do ceos affect employees political choices · after we control for common determinants of political...
TRANSCRIPT
DO CEOS AFFECT EMPLOYEES’ POLITICAL CHOICES?*
Ilona Babenko Viktar Fedaseyeu W.P. Carey School of Business, Department of Finance, Arizona State University Bocconi University
Song Zhang University of Lugano and
Swiss Finance Institute
February 8, 2017
ABSTRACT
We analyze how the political preferences of CEOs affect their employees’ campaign contributions and electoral choices. Employees donate almost three times more money to CEO-supported political candidates than to candidates not supported by the CEO. This relation also holds around CEO departures, including plausibly exogenous departures due to death or retirement. CEO influence is strongest in firms that explicitly advocate for political candidates and firms with politically connected CEOs. Finally, employees are more likely to vote in elections in those congressional districts where CEOs are more politically active. Our results suggest that CEOs are a political force.
JEL classification codes: G30, D72, P48
Keywords: campaign contributions, elections, voting, CEOs, political activism, PACs, political candidates, voter turnout
* Contact information: Main campus, P.O. Box 873906, Tempe, AZ 85287-3906, United States; email: [email protected]; via Röntgen 1, Milan, 20136, Italy; email: [email protected]; via G. Buffi 13, CH-6900, Lugano, Switzerland; email: [email protected]. This paper has benefited from helpful comments by Benjamin Bennett, Lauren Cohen, Francesco Corielli, Francesco Franzoni, Nicola Gennaioli, Erik Gilje, Julien Sauvagnat, Fabiano Schivardi, Rik Sen, Philip Strahan, Yuri Tserlukevich, Hannes Wagner, and seminar participants at Arizona State University and Bocconi University. We are especially grateful to Joseph Blasi and Doug Kruse for generously providing their data on voter turnout.

1. Introduction
A large literature examines interactions between firms and politicians and argues that participation
in the political process may be valuable to firms. Firms can invest in political capital by
establishing direct connections with legislators, for example through employment of current or
former politicians (Faccio (2006); Faccio, Masulis, and McConnell (2006); Goldman, Rocholl,
and So (2009); Duchin and Sosyura (2012)), by spending money on lobbying (Bertrand,
Bombardini, and Trebbi (2014); Borisov, Goldman, and Gupta (2015)), and by financing
candidates’ political campaigns through corporate political action committees, known as PACs
(Stratmann (1992); Cooper, Gulen, and Ovtchinnikov (2010); Akey (2015)). These activities may
create value for firms’ shareholders because of subsidies, preferential allocation of government
contracts and external financing, less strict regulation, and lighter taxation.1
Yet another, and largely unexplored, mechanism through which firms can establish
political connections is campaign contributions made by their employees. In fact, political
contributions made by individuals far exceed those made by corporate PACs. For example,
Ansolabehere, de Figueiredo, and Snyder (2003) show that during the 1999–2000 election cycle
candidates in congressional elections raised over three times more money directly from individuals
than they did from PACs. Further, anecdotal evidence suggests that CEOs attempt to influence
which candidates their employees support and contribute to. For example, companies such as
1 The positive effect of political activism on firm value is documented in, e.g., Fisman (2001); Johnson and Mitton (2003); Faccio (2006), Faccio, Masulis, and McConnell (2006); Claessens, Feijen, and Laeven (2008); Ferguson and Voth (2008); Goldman, Rocholl, and So (2009); Cooper, Gulen, and Ovtchinnikov (2010); Chaney, Faccio, and Parsley (2011); Duchin and Sosyura (2012); Amore and Bennedsen (2013); Correia (2014); Tahoun (2014); Akey (2015); Borisov, Goldman, and Gupta (2015); Brogaard, Denes, and Duchin (2015); Stratmann, and Verret (2015); and Acemoglu, Johnson, Kermani, Kwak, and Mitton (2016). In contrast, Aggarwal, Meschke, and Wang (2012) find evidence that corporate donations to political candidates are negatively correlated with returns and contend that donations are symptomatic of agency problems. Coates (2012) argues that corporate political contributions are motivated at least in part by the personal ambitions of firms’ CEOs, and Gehlbach, Sonin, and Zhuravskaya (2010) show that many businessmen run for office to avoid the cost of lobbying elected officials.
1

Pfizer and Koch Industries send educational materials to employees about their firms’ preferred
political choices and nudge employees to participate in political meetings, write letters and emails
to politicians, donate, campaign, and vote in particular ways.2 Some firms go even further and
offer perks for employee political contributions. BP, for example, allows its employees to choose
better parking spots in the company lot if they donate at least 2.5 percent of their salary to the
company PAC.
In this paper, we analyze whether firms are able to systematically influence their
employees’ political choices by studying how political preferences of CEOs affect campaign
donations and voter turnout of their firms’ employees. Using a large sample of S&P 1,500 firms
between 1999 and 2014, we find that employee donations to political candidates seeking federal
office strongly respond to how their firms’ CEOs donate. For example, Figure 1 shows that
employees of firms whose CEOs contributed to only one of the two presidential candidates in the
2012 election (Barack Obama or Mitt Romney) contributed approximately two times more to the
candidate supported by their CEO than to his opponent. We find similar effects for all U.S. federal
elections. After we control for common determinants of political contributions and account for
firm, candidate, and election cycle fixed effects, we estimate that employees direct approximately
three times more of their campaign contributions to political candidates supported by their firm’s
CEO than to other candidates.
That CEOs and employees donate to the same political candidates does not necessarily
imply a causal relation, but neither is it to be expected. Even though employees and CEOs may be
subject to common economic forces, participation in the political process is a high civic duty and
2 See “Nine CEOs pushing workers to vote for Romney,” The Huffington Post, October 28, 2012; “CEO to workers: you’ll likely be fired if Obama is reelected,” CNBC, October 10, 2012; and “The new U.S. office politics: funding your boss’s political causes,” Reuters, May 11, 2015.
2
is not determined by economic factors alone. Moreover, employees typically have different
socioeconomic characteristics from those of CEOs and may therefore favor different political
outcomes.
What can explain the observed positive relation between CEO and employee contributions?
One possibility is that both CEOs and employees simply recognize political candidates who are
instrumental to the firm’s success and contribute accordingly. In this case, CEOs do not have an
independent effect on employees’ political decisions. Another explanation is that by providing
timely and relevant information on political matters, CEOs reduce the costs of political
participation by their employees and help mitigate the collective action problem, first formalized
by Olson (1965).3 Under this explanation, changes in employee political contributions are a
consequence of CEOs’ actions, whether intended or unintended. For example, employees may
simply become aware of the CEO’s political preferences and infer which candidates are most
beneficial to the firm. Alternatively, CEOs can make deliberate attempts to influence their
employees’ political choices by explicitly advocating for political candidates or by providing
positive inducement to employees, such as in case of BP. We conduct a series of tests to distinguish
between alternative explanations and find strong evidence that changes in CEOs’ political
preferences affect their employees’ campaign contributions. Further, at least in some cases CEOs
make intentional attempts to influence their employees’ political choices and these attempts
succeed.
In our first set of tests, we show that economic and political factors common to CEOs and
employees cannot explain away the relation between CEO and employee contributions. One such
3Brady, Verba, and Schlozman (1995) propose a resource model of political participation with three main resources considered: time, money, and civic skills. In our context, information provided by CEOs could relax the time constraint of individuals, who otherwise would need to obtain information about the relevant political candidates on their own.
3

factor is political candidates’ strength and ideology. We find, however, that our results hold if we
include candidate or candidate-cycle fixed effects, or if we control for the candidate’s party,
incumbency status, and contemporaneous campaign contributions to the candidate from
individuals who are not employees of the firm. We also show that the relation between CEO and
employee contributions remains largely intact if we include state-cycle fixed effects or if we only
consider contributions made by employees living in a different geographic area (zip code or state)
from that of the CEOs. Hence our results cannot be attributed to the geography of contributions,
the presence of strong political networks in certain areas, regional demographic characteristics, or
industry concentration, which have been documented to be important determinants of campaign
finance by prior literature (Gimpel, Lee, and Kaminski (2006); Ovtchinnikov and Pantaleoni
(2012)). We also find that our results survive if we account for firm or firm-cycle fixed effects.
These latter results suggest that the impact of CEOs on their employees’ political contributions is
not driven by a firm-wide political orientation that attracts employees and CEOs of similar political
ideology (or by CEOs hiring and retaining only those employees who share their political values).
We also perform a formal test proposed by Altonji, Elder, and Taber (2005) and Oster
(2015) to assess the degree to which the omitted variable bias or selection on unobservables can
explain the observed positive relation between employee and CEO contributions. We find that the
share of variation explained by unobservable variables needs to be two to five times as large as the
share of variation explained by observable variables in order to reduce the coefficient of interest
to zero, which seems unlikely given that our regression includes many common determinants of
campaign contributions as well as a large number of fixed effects.
In our second set of tests, we investigate the dynamics of employee contributions around
CEO turnovers. These tests provide robust evidence that CEO political preferences affect
4

employee contributions (even if this effect is unintended). While CEO turnovers are not exogenous
to the firm’s overall economic conditions, it is unlikely that the arrival of a new CEO coincides
with a change in employees’ political views, particularly if the CEO turnover is due to planned
retirement or death. Thus, if the CEO has no influence on political giving by employees, one would
expect to find no systematic relation between the change of CEO (and his or her preferred political
candidates) and changes in employees’ political contributions. In contrast, we find that when a
new CEO contributes to different political candidates from the ones supported by the prior CEO,
employees tend to follow his/her lead and redirect their donations as well. This result also holds if
we limit our sample of CEO turnovers only to those cases in which the departing CEO dies or is
over 65 years old, as such turnovers are least likely to be caused by changes in the firm’s political
or economic environment. While one can never completely rule out the possibility of omitted
variables in a non-experimental setting, this evidence supports the view that CEOs have a direct
effect on the political choices of their employees. To investigate whether this effect is the result of
CEOs’ deliberate attempts to advocate for certain political candidates, we conduct a third set of
tests to study the mechanisms behind CEO influence.
To this end, we identify cases in which CEOs are more likely to be active in their attempts
to communicate their political views to employees. While we cannot observe all communication
by CEOs on election matters, U.S. federal law requires corporations that spend more than $2,000
per election on express advocacy of the election or defeat of a political candidate to report such
communication costs to the Federal Election Commission (FEC). We find that the estimated effect
of CEOs on employee contributions is five times higher in firms that report communication costs.
Thus our results cannot be fully explained by common economic shocks or reverse causality (i.e.,
by CEOs observing the political preferences of their employees and contributing to the candidates
5

favored by them). If common shocks or reverse causality were the main driver of the relation
between CEO and employee contributions, there would be little reason to expect that CEOs who
deliberately try to influence their employees are more effective at doing so. We also present a case
study of Murray Energy, which shows that employees increase their contributions to CEO-favored
candidates immediately following the CEO’s explicit attempts to advocate for them, but not
before.4 Thus, at least in some instances, CEOs make deliberate attempts to influence their
employees’ political choices and these attempts are successful.
We also show that the effect of CEOs’ political preferences on employees is strongest for
firms that operate in heavily regulated industries or in industries that spend large amounts on
lobbying and for firms that have set up their own corporate PACs. Thus CEOs are more successful
and/or more active in trying to affect their employees’ donations in those firms that are politically
active and regulated, perhaps because participation in the political process yields the highest
marginal benefits for such firms. Further, we find that CEOs who have political connections are
able to exert greater influence on employee contributions, perhaps because such CEOs have a
deeper knowledge of the political environment and are more effective at convincing employees,
or because they are better able to exchange favors with politicians. For example, Bertrand,
Kramarz, Schoar, and Thesmar (2004) find that in France politically connected CEOs bestow re-
election favors on incumbent politicians by creating more jobs in politically contested areas and
that these favors are reciprocated by politicians. We also show that CEOs are more successful in
influencing employee contributions to political candidates who have direct jurisdiction over the
firm (as indicated by the congressional committees a candidate serves on), suggesting that
4 In the case of Murray Energy, 95.5% of employee contributions raised by CEO-supported candidates are received within one week after the CEO explicitly advocates for those candidates.
6

employees may be more easily persuaded to contribute to political candidates who could affect the
firm’s success.
Campaign contributions are not the only way in which employees participate in the political
process. Since employees are voters, they can also directly affect electoral outcomes by voting for
a particular candidate. Anecdotal evidence suggests that CEOs attempt to influence how their
employees vote,5 and prior research shows that voter turnout and employee mobilization can be
substantially increased through direct contact and communication (e.g., Gerber and Green (2000);
Kling and Stratmann (2016); Hertel-Fernandez (2016)). To study whether CEOs are effective in
mobilizing their employees to vote, we use individual employee survey data from the NBER’s
Shared Capitalism Research Project, which contains self-reported information on voting behavior
(Kruse, Freeman, and Blasi (2010)). We find that employees from congressional districts in which
CEOs make campaign contributions are approximately 11.5% more likely to vote in elections.
Consistent with the idea that some employees obtain information on electoral issues from their
CEOs, we find that this effect is driven almost entirely by less wealthy employees and those
without a college degree, who are perhaps less likely to seek out election-relevant information
from independent sources.
Overall, our evidence indicates that CEOs are a political force, with potentially important
implications for firms they manage and for the nature of democracy. The welfare implications
depend both on whether CEOs promote their own political agenda or act in the interests of their
firms, and on whether the interests of the firm coincide with the interests of its employees. If CEOs
promote their own political agenda, then their impact on employee contributions is likely to be
5 See, e.g., “Nine CEOs pushing workers to vote for Romney,” The Huffington Post, October 28, 2012.
7
welfare decreasing. While we cannot rule out that CEOs pursue personal goals, our evidence does
indicate that at least some of their political impact is driven by the interests of the firms they run:
CEOs appear to exert greater influence on employee contributions in regulated industries and to
candidates with jurisdiction over the firm, both of which are likely to be correlated with firm-
specific benefits from political activism but not necessarily with CEOs’ political ambitions.
Note, however, that the economic and political interests of the firm’s shareholders are not
always aligned with those of the firm’s employees.6 Thus, even if CEOs represent their firms’
shareholders and advise employees on political options most beneficial for the firm, following this
advice is not necessarily welfare improving for employees. If employees are able to process
information efficiently, they should themselves be able to make political choices that take into
account both their personal interests and the interests of the firm. If, however, employees are not
efficient at processing politically relevant information, then, following the CEO’s advice, they may
choose political candidates that are beneficial to the firm at the expense of their own interests.
Since we observe neither the political ideology of individual employees nor the extent to which
their economic livelihoods depend on the firm’s success, further evidence is needed to understand
the exact welfare implications of CEOs’ political influence.
This paper makes three contributions to the literature. First, we show that the firm as a
whole is a political actor and that firms’ participation in the political process is not limited to
corporate PACs, lobbying, or direct connections with politicians. Second, our evidence indicates
that it is CEOs’ political preferences that at least partially shape their employees’ political choices,
which implies that CEOs’ influence goes beyond financial and operational decisions. Finally, we
6 For example, Wal-Mart is known for opposing a minimum wage increase, while a substantial share of its employees might benefit from such an increase (at least in the short run).
8
find evidence that CEOs may be able to affect their employees’ likelihood of voting, suggesting
that CEOs may influence not just campaign contributions but also electoral outcomes.
The rest of this paper is organized as follows. Section 2 describes our data as well as the
institutional framework of campaign contributions in the United States. Section 3 presents our
results on CEO and employee contributions including the analysis of CEO departures. Section 4
investigates the mechanisms behind CEOs’ influence on employee political giving. Section 5
studies the impact of CEOs on their employees’ voter turnout. Section 6 concludes.
2. Institutional background and data
2.1. Campaign contributions in the United States: A brief overview
U.S. federal law explicitly prohibits corporations from using their treasury funds to make direct
contributions to candidates in federal elections. In order to make campaign contributions, a
corporation must establish a political action committee (PAC), which may solicit contributions
from the corporation’s employees but must not accept contributions from individuals unaffiliated
with the firm. Corporations are not allowed to contribute directly to PACs (including their own),
but may pay for their own PAC’s start-up, administrative, and fundraising expenses.
Whereas direct campaign contributions from corporations to candidates are prohibited, the
law explicitly allows “communications by a corporation to its stockholders and executive or
administrative personnel and their families or by a labor organization to its members and their
families on any subject,” including election-related matters.7 The ability of corporations to
advocate for or against political candidates was greatly expanded after the 2010 Supreme Court
decision in Citizens United v. FEC. This decision allowed corporations to spend unlimited funds,
7 52 U.S.C. §30118 (b) (2) (A).
9
including funds from their treasuries, on independent political expenditures. Such expenditures
can be used to expressly advocate for the election or defeat of a candidate as long as they are not
coordinated with any candidate. While the Citizens United decision allowed election-related
communications by corporations to both employees and non-employees, the corporations’ ability
to communicate with employees precedes this decision.8
Unlike corporations, individuals are allowed to make campaign contributions directly to
political candidates. However, federal law restricts the amount that an individual can contribute to
a candidate seeking election to federal office (House, Senate, or the presidency). In the 2014
election cycle, the limit on individual contributions was $2,600 to each candidate per election.
Candidates, in turn, are required to itemize all individual contributions in excess of $200 and report
the amount and date of the contribution, as well as the contributing individual’s name, employer,
occupation, and address. Contributions totaling less than $200 do not have to be itemized; therefore
the identities of most individuals who contribute less than $200 are impossible to track.9 Such
contributions, however, represent a relatively small share of political giving: for example, in 2010
only 21% of contributions made by individuals were unitemized.10 The FEC makes contributions
data publicly available on its website (the individual contributions files are updated weekly on
Sunday).11 The data on individual campaign contributions form the basis for our subsequent
analysis. The FEC dataset is organized by election cycle (e.g., all contributions made in 1999–
8 Our results hold both before and after 2010. 9 Candidates may choose to voluntarily itemize contributions below $200; however, such cases are rare (in our sample we have only seven contributions below $200). 10 Center for Responsible Politics. 11 The FEC assigns a unique identification number to each candidate running for federal office, and this identification number remains unchanged as long as the candidate runs for the same office. A different identification number is assigned when the candidate runs for a different federal office. Thus the FEC data allow us to reliably track the same political candidate across election cycles.
10
2000 are recorded in the file corresponding to election cycle 2000) and contains over 18 million
individual contributions made during our sample period.
2.2. Data on CEO and employee political contributions
We merge the FEC data with BoardEx, which provides biographical information on corporate
board members and senior executives starting in 1999. We identify all years in which BoardEx
provides the name of the CEO of an S&P 1,500 firm (31,454 firm-years, 2,508 firms) and then
identify all political contributions in the FEC data that were made either by the CEO or by
employees of the firm.12 The FEC data do not share a common identifier with BoardEx. Therefore
we match firm names in BoardEx with firm names in the FEC data through a “fuzzy merge” using
a bigram string comparator score of the firm name as reported in each data set.13 We follow the
same procedure to match the names of CEOs of BoardEx firms with the names of individuals in
the FEC data. To measure CEOs’ political preferences, we obtain their individual campaign
contributions. We drop contributions for which the employer name in the FEC data has not been
matched with a firm name in BoardEx. We then attribute contributions to the firm’s CEO if the
employer name in the FEC dataset matches a firm name in BoardEx and the name of the person in
the FEC dataset matches the name of the firm’s CEO. We attribute contributions to the firm’s
employees if the employer name in the FEC dataset matches a firm name in BoardEx and the name
of the person in the FEC dataset does not match the name of the firm’s CEO. We drop all firm-
years for which there are no contributions to any identifiable federal candidate from either the
12 The list of S&P 1,500 firms changes over time. We retain all firms that have been part of the S&P 1,500 at any point between 1999 and 2014. 13 A bigram string comparator computes the fraction of consecutive character matches between two strings. We implement the fuzzy merge using the Stata ado file reclink. We then perform a manual review of all matches (13,609 combinations of firm names in the two datasets) to ensure accuracy.
11
CEO or employees and also all firms with headquarters outside the United States, which leaves us
with 23,765 firm-year observations for 2,287 unique firms.
Special attention needs to be paid to candidates to which neither the CEO nor the
employees contribute in a given election cycle. A CEO’s decision not to contribute to a candidate
may in itself be informative about his/her political preferences, and employees may follow the
CEO’s lead by also not contributing to this candidate. However, there may also be some cases
when the absence of contributions indicates that the candidate was not considered viable or
relevant to the firm. We follow a conservative approach and drop all candidate-firm combinations
for which there is no election cycle when either the firm’s CEO or employees contributed to the
candidate. We do retain cases when a firm’s CEO or employees switch their contributions between
different candidates running for the same office in different election cycles. As an illustration,
consider the case when candidate A and candidate B compete for the same office in election cycle
1 and election cycle 2. If the firm’s CEO or employees contribute to candidate A in election cycle
1 but then switch to contributing to candidate B in election cycle 2, we retain both candidate A and
candidate B in both election cycles.
In the final step, we merge our sample of BoardEx firms and political contributions with
Compustat, drop observations with missing data on control variables required for our baseline
specification, and winsorize all continuous variables at 1%. We aggregate data at the election cycle
level by retaining the value of firm control variables in the first year of the election cycle.14 Our
14 Since each election cycle covers two calendar years, we need to choose how to assign firm control variables to election cycles. We have verified that our results are robust to choosing either the first year of the election cycle or the year immediately preceding the election cycle.
12
final sample contains 232,448 firm-candidate-cycle observations (12,467 firm-cycles) for 2,181
unique firms and 4,606 unique candidates over eight election cycles from 1999 to 2014.
2.3. Data on voter turnout
Our data on employee voting behavior come from a survey of employees conducted as part of the
NBER’s Shared Capitalism Research Project at fourteen companies that have broad-based
employee ownership programs (Kruse, Freeman, and Blasi (2010)). The web-based or paper-based
surveys were administered from 2001 to 2005 at 323 different work sites, and the average response
rate across firms was 49.5%. In twelve out of the fourteen firms, the survey included a question
that asked employees whether they had voted in the general election held in November 2000. At
ten firms this question was administered to all firm employees and at two firms it was administered
to a random sample of employees. While the firms chosen for the survey were not randomly
selected and therefore are not necessarily representative of all U.S. employers, these firms come
from different industries (eight are in manufacturing, three are in services, two are Internet-based
companies, and one is a financial firm) and vary in size from fewer than 500 employees to more
than 30,000 employees. In addition to the voter turnout question, the surveys included questions
about demographic characteristics, wealth, and education. More details on the survey methodology
and the selection of companies are provided by Kruse, Freeman, and Blasi (2010).
The firms in the survey have operations both in the United States and abroad. To select
eligible voters, we restrict the sample of respondents to U.S.-based employees who worked at the
firm as of November 2000, were at least 18 years old, and answered the voter turnout question as
well as the questions we use as control variables in our baseline specification. Our final sample
includes 5,677 employees working at 53 different sites.
13

For each firm in the sample we manually identify the firm’s CEO as of November 2000
and obtain from the FEC all his/her campaign contributions to House and Senate candidates during
the 1999–2000 election cycle. Further, for each firm-site location in our sample we identify the
congressional district to which that location belongs and verify whether the firm’s CEO
contributed to any candidate running for office in that congressional district. Since Senate
candidates run for statewide office, we assume that they run in each congressional district of a
state. We then create an indicator variable equal to one for a given firm site if the CEO contributed
to any candidate in that site’s congressional district, as well as a continuous variable equal to the
total amount that the CEO contributed to all candidates in that congressional district.
3. CEO support and employee contributions to political candidates
3.1. Summary statistics on CEO and employee contributions
In our sample, the total amount contributed by CEOs and employees to all political candidates is
approximately $317 million, out of which $286 million (or 90%) are contributed by employees
(see Figure 2). Notably, there is a partisan divide in employee and CEO contributions: while 59%
of CEOs’ political contributions are directed to Republican candidates, employees’ contributions
are almost evenly split between Republicans and Democrats.
In a given election cycle, CEOs contribute, on average, $1,743 to slightly more than one
political candidate. The total amount that all the firm’s employees (excluding the CEO) contribute
is $14,684, on average, and is allocated across approximately nine candidates (Panel A of Table
1). Contributions by employees are more frequent than contributions by CEOs: the former donate
83.9% of the time in our sample while the latter donate 38.3% of the time (this number is similar
to the 44.3% of CEOs making contributions to candidates reported in Fremeth, Richter, and
14

Schaufele (2013)). Contributions in our sample come from a range of employees that includes both
top and middle management. Apart from the CEO, the top 10 self-reported occupations in our
sample are, in descending order: Executive, Attorney/Lawyer, Engineer, Vice President, Banker,
Manager, President, Software Engineer, Financial Advisor, and Sales/Marketing.
On a per candidate basis, the average CEO contribution is $1,544 and the contribution from
all employees is $1,885 (Panel B). Because our sample includes all candidates to which either the
CEO or the employees contribute, we also calculate the average CEO and employee contribution
across all such candidates, which amount to $94 and $784, respectively. These variables are right
skewed, which is typical for political contributions (see, e.g., Duchin and Sosyura (2012);
Ovtchinnikov and Pantaleoni (2012); and Lee, Lee, and Nagarajan (2014)).
Panel C of Table 1 presents summary statistics for firm-level control variables. The firms
in our sample are large (average value of assets is $10.8 billion) and profitable (average ROA of
4.1%), and they have CEOs who are politically connected (with an average of 25 political
connections). To identify political connections, we count the number of individuals with a political
background in the BoardEx database who share a common connection with the CEO. Common
connections between two individuals in BoardEx include past or current working relationships,
memberships in the same clubs and associations, or overlapping periods of study at the same
educational institutions. We classify individuals as having a political background if they have
current or past work experience in a government organization or have ever held elected office.
3.2. Baseline results
Graphical evidence presented in Figure 1 suggests a positive correlation between CEO and
employee political contributions. To examine this association further, we estimate the following
15

panel OLS regression (our baseline) that relates employee political contributions to those of a
firm’s CEO:
𝐶𝐶𝑖𝑖𝑖𝑖𝑖𝑖𝑒𝑒𝑒𝑒𝑒𝑒𝑒𝑒𝑒𝑒𝑒𝑒𝑒𝑒𝑒𝑒𝑒𝑒 = 𝛼𝛼𝑖𝑖 + 𝛿𝛿𝑖𝑖 + 𝛾𝛾𝑖𝑖 + 𝛽𝛽𝐷𝐷𝑖𝑖𝑖𝑖𝑖𝑖𝐶𝐶𝐶𝐶𝐶𝐶 + 𝜂𝜂′𝑋𝑋𝑖𝑖𝑖𝑖𝑖𝑖 + 𝜀𝜀𝑖𝑖𝑖𝑖𝑖𝑖, (1)
where 𝑖𝑖 indexes firms, 𝑗𝑗 indexes candidates, 𝑡𝑡 indexes election cycles, 𝐶𝐶𝑖𝑖𝑖𝑖𝑖𝑖𝑒𝑒𝑒𝑒𝑒𝑒𝑒𝑒𝑒𝑒𝑒𝑒𝑒𝑒𝑒𝑒𝑒𝑒 refers to the
total amount of campaign contributions by the employees of firm 𝑖𝑖 made to candidate 𝑗𝑗 in election
cycle 𝑡𝑡, 𝐷𝐷𝑖𝑖𝑖𝑖𝑖𝑖𝐶𝐶𝐶𝐶𝐶𝐶 is an indicator variable equal to one if the CEO of firm 𝑖𝑖 makes at least one campaign
contribution to candidate 𝑗𝑗 in election cycle 𝑡𝑡, and 𝑋𝑋𝑖𝑖𝑖𝑖𝑖𝑖 are control variables.15 Thus our baseline
model absorbs all observed and unobserved time-invariant heterogeneity across firms, candidates,
and time. Because observations may be correlated across the same firm or across the same
candidate in different election cycles, we double-cluster standard errors by firm and candidate in
all our specifications.16
Panel A of Table 2 presents the estimation results. In model 1, we regress total employee
contributions on the CEO contributions indicator without including any control variables or fixed
effects. Model 2 adds firm-level controls, whereas model 3 also includes firm, candidate, and
election cycle fixed effects. The inclusion of firm fixed effects accounts for any time-invariant
factors common to a firm, such as the industry the firm operates in, the general level of political
participation within the firm, or employee demographics. Candidate fixed effects ensure that our
results are not merely an artifact of higher quality candidates drawing greater support from both
15 All our results are robust to replacing the indicator of CEO support with the actual amount contributed by the CEO (see Appendix A). 16 We choose not to cluster standard errors by election cycle because our sample covers only eight cycles, which Petersen (2009) and Thompson (2011) show may be insufficient for consistent inference. Our results are very similar if we only cluster standard errors by firm.
16

CEOs and employees. Finally, election cycle fixed effects absorb variation due to secular trends
in general economic and political conditions.
In all models, CEO support of political candidates positively affects employee
contributions to the same candidates, and the effect is similar across different specifications. Based
on model 3 (our baseline), a candidate supported by the CEO receives $1,468 more in campaign
contributions from the firm’s employees than a candidate not supported by the CEO. This amount
is almost double the unconditional mean of employee contributions ($784), which implies that
CEO-supported candidates raise approximately three times more funds from the firm’s employees
than candidates not supported by the CEO.
Is $1,468 in additional contributions sufficient to affect political outcomes in the firm’s
favor? Prior literature on political contributions does show that even relatively moderate amounts
of campaign contributions have large positive effects on firm value, potentially because campaign
contributions are an indicator of greater firm involvement in the political process (Cooper, Gulen,
and Ovtchinnikov (2010); Akey (2015)). More relevant for this study, however, is not whether
employee contributions can influence political outcomes but whether CEO influence leads to
substantial changes in the behavior of individual employees, and an increase of $1,468 does appear
to be considerable for employees who on average donate $784. Further, even relatively moderate
changes in contributions at the level of individual firms can have potentially large aggregate
effects. More important, campaign contributions are only one way for employees to participate in
the political process, and changes in contributions may be symptomatic of changes in employee
voting behavior, which is not always observable. We do observe voter turnout for a sample of
17
employees and find evidence that it can also be affected by CEOs, which suggests that CEOs may
also influence electoral outcomes (see Section 5).17
3.3. Alternative explanations
That employees and CEOs tend to contribute to political candidates in a coordinated manner
indicates, at a minimum, that the firm as a whole should be viewed as a political actor. However,
this prima facie evidence does not necessarily imply that CEOs have an independent effect on
employees’ campaign contributions. In particular, coordination among CEOs and employees may
arise either because their political interests are aligned or because CEOs actively influence
employees’ political choices. In this section, we investigate several factors that could align the
interests of CEOs and employees.
One potential explanation for the positive association between CEO and employee
contributions is related to political candidates’ strength. For example, Snyder (1990) shows that if
all political candidates can supply the same number of favors in exchange for campaign
contributions, then the total amount of contributions received by a candidate should be directly
proportional to his or her probability of winning the election.18 Further, ample research documents
that more powerful politicians, such as committee chairs, party leaders, and politicians serving on
important committees, receive significantly more campaign contributions (e.g., Grier and Munger
(1991); Romer and Snyder (1994); Kroszner and Stratmann (1998); and Milyo (1997)). Thus it is
17 Employees may also participate in the political process by volunteering their time to political campaigns, attending rallies and political meetings, or writing letters and emails to politicians. For example, in April 2015 Pfizer’s employees sent more than 8,000 emails to politicians about healthcare and patent legislation favorable to Pfizer. “The new U.S. office politics: funding your boss’s political causes,” Reuters, May 11, 2015. 18 Snyder (1990) also finds that the evidence from contributions made by special interest groups supports this theoretical prediction. Contributions made by individuals, however, have a different pattern as individuals contribute too much to “losers” and too little to “winners” relative to the model.
18

important to show that our results do not arise simply because stronger political candidates draw
greater support from both firm employees and their CEOs.
In our baseline specification we have partially accounted for variation in candidate strength
with the inclusion of candidate fixed effects. These fixed effects, however, do not absorb variation
in candidate strength over time. To investigate this issue further, we perform two additional tests.
First, in model 4 we explicitly control for the candidate’s party, incumbency status, and
contemporaneous contributions to the candidate by individuals who are not employed by the firm.
The latter proxy for the aggregate level of support to a candidate in a given election cycle that is
not attributable to the firm’s employees.19 Perhaps not surprising, the level of employee
contributions positively relates to the aggregate amount of campaign contributions a candidate
receives. Nevertheless, the effect of CEO contributions remains positive and significant in this
specification as well, with a magnitude similar to the baseline. Second, we include candidate-cycle
fixed effects in column 5 of Panel A to flexibly account for time-varying candidate quality. Our
results remain unchanged, making it unlikely that unobserved candidate strength can explain the
relation between CEO and employee contributions.
Donations to political candidates may also respond to changes in firm-specific political
conditions, and these conditions may change depending on the election cycle. For example, firms
may have a stronger incentive to establish political connections in times of financial distress or
turmoil (Faccio, Masulis, and McConnell (2006); Ovtchinnikov and Pantaleoni (2012); Acemoglu,
Johnson, Kermani, Kwak, and Mitton (2016)), which can therefore lead to changes in how a given
firm’s employees contribute in different election cycles. Further, firm-specific characteristics can
19 In particular, for all candidate-firm-cycle observations, we calculate the amount that the candidate receives from individuals not employed by the firm in that election cycle.
19

affect both CEO and employee contributions over time because CEOs may hire and retain only
those employees who conform to their political views, or because employees may be more willing
to work for a firm whose CEO’s political interests are aligned with theirs. To account for such
effects, we include firm-cycle fixed effects in model 6 and find results similar to the baseline.20
Next, we explore whether our results are driven by common geographic factors that can
simultaneously affect CEO and employee contributions. As Gimpel, Lee, and Kaminski (2006)
and Gimpel, Lee, and Pearson‐Merkowitz (2008) show, there are strong geographic patterns in
individual campaign contributions related to the spatial distribution of individuals with the
resources and inclination to give, as well as the presence of social networks that facilitate political
fundraising activities. Faccio (2006) shows that the prevalence of political connections is related
to the local regulatory environment, and Kim, Pantzalis, and Park (2012) find that firms located in
states whose politicians are aligned with the ruling (presidential) party outperform those located
in other states. Further, Ovtchinnikov and Pantaleoni (2012) show that political contributions are
related to geographic concentration of industries as individuals who live in congressional districts
with industry clusters are more likely to contribute to politicians with jurisdiction over the industry.
To investigate whether our results can be attributed to geographic factors, we first examine
the relation between political contributions of CEOs and employees who reside in different
locations. Specifically, we compute campaign contributions from employees who live in a
different zip code, or a different state, from that of the CEO. We then use these contributions as
dependent variables in models 1 and 2 in Panel B of Table 2. We find that our results remain
qualitatively the same. For example, in model 1 (which excludes contributions of employees that
20 Note that the inclusion of firm-cycle fixed effects makes it impossible to include other control variables in the same model.
20
live in the same zip code as the CEO), the mean of the dependent variable is $758 (from Panel B
of Table 1). Thus CEO support for a given candidate translates into an increase in employee
contributions of approximately 171.8% relative to its mean. In model 2 (which excludes
contributions of employees that live in the same state as the CEO), the corresponding effect is
47.3% relative to the mean employee contribution. In addition, we include state-cycle fixed effects
in model 3 to flexibly account for time-varying economic and political factors that affect all firms
in the same state and find that our results are unchanged. Overall, it appears that our findings are
unlikely to be explained by geographic factors.
To further investigate the degree to which omitted unobservable factors can possibly
explain away the observed positive relation between employee and CEO contributions, we perform
a formal test advocated by Altonji, Elder, and Taber (2005) and further developed by Oster
(2015).21 Specifically, the test computes the share of variation that unobservable variables need to
explain (relative to included control variables) in order to reduce the effect of interest to zero. This
share is denoted by 𝛿𝛿. A value of 𝛿𝛿 equal to 2, for example, indicates that unobservables need to
be twice as important as observables in order for the omitted variable bias to explain away the
results and reduce the coefficient of interest to zero.
The implementation of the Oster (2015) test requires specifying the value of 𝑅𝑅𝑒𝑒𝑚𝑚𝑚𝑚, which
denotes the R-squared from a hypothetical regression that includes both observed and unobserved
controls. Based on experimental evidence, Oster (2015) suggests reporting the value of 𝛿𝛿 with
𝑅𝑅𝑒𝑒𝑚𝑚𝑚𝑚 = 1.3𝑅𝑅�, where 𝑅𝑅� is the R-squared from the regression that includes all observed controls. In
Panel C of Table 2, we use regression specification from column 5 of Panel A (since it is the model
21 We perform the test in Stata by using the psacalc command provided by Oster (2015).
21

with the highest R-squared) and report the value of 𝛿𝛿 for 𝑅𝑅𝑒𝑒𝑚𝑚𝑚𝑚 = 1.3𝑅𝑅�, as well as for more
stringent specifications with 𝑅𝑅𝑒𝑒𝑚𝑚𝑚𝑚 = 2𝑅𝑅� and 𝑅𝑅𝑒𝑒𝑚𝑚𝑚𝑚 = 1. The values of 𝛿𝛿 reported in Panel C
indicate that the unobservables need to be two to five times as important as the observables to
produce an effect of zero, which seems unlikely given that our regression includes many common
determinants of campaign contributions as well as a large number of fixed effects.
3.4. Changes in political contributions around CEO turnover
We now turn to the dynamics of employee contributions around CEO turnovers. CEO turnovers
may be triggered by many factors, such as poor firm performance or disagreement between the
CEO and the Board of Directors about the firm’s strategic direction. However, it is unlikely that
shifts in the political landscape are the primary reason for CEO turnover, especially if this turnover
is caused by natural retirement or death.22 Important for our purposes, political preferences of a
new CEO may differ from those of the old one even if the firm’s political and economic
environment does not change. First, there may be genuine disagreement between different CEOs
about the set of political candidates most beneficial to the firm’s success. Second, the set of such
candidates may be CEO-specific because different CEOs may have different political connections
or because they have different information about the candidates.
There are 877 CEO turnovers in our sample.23 For each such turnover, we first identify the
candidates to whom the departing CEO contributes in the two years before the turnover and the
candidates to whom the replacement CEO contributes in the two years after the turnover. We
22 CEO turnovers may also be associated with simultaneous changes in the composition of the firm’s workforce (e.g., downsizing, mergers, or opening of new plants), which can also alter its political orientation. We address this issue below by restricting the sample of employee contributions only to those employees who contribute under both the departing CEO and the replacement CEO. 23 We exclude turnovers where neither the departing CEO nor the replacement CEO contributed to any political candidates.
22
identify all candidates who receive at least one contribution from the departing CEO in the two
years before the turnover or at least one contribution from the replacement CEO in the two years
after the turnover, or both. We then do the same for the candidates to which the firm’s employees
contribute in the two years before and/or after the turnover. Thus we include all candidates who
receive contributions from either the CEO or the employees before or after the CEO turnover.
Finally, we require that the candidate ran for office in the two-year window both before and after
CEO turnover.24 We drop the year of the turnover itself from the sample since it is unclear which
of the two CEOs might have had the greatest influence on employee behavior during that year.
For each candidate, we compute the difference in CEO support between the replacement
CEO and the departing CEO. A difference of 0 indicates that the candidate is either supported by
both CEOs or by none of the two CEOs; a difference of 1 indicates that the candidate is supported
by the replacement CEO but not by the departing CEO; a difference of –1 indicates that the
candidate is supported by the departing CEO but not by the replacement CEO. We also calculate
the difference in employee contributions by subtracting the amount the candidate receives from
the firm’s employees before the CEO turnover from the amount he/she receives after the turnover.
We then regress the difference in employee contributions on the difference in CEO support and
report the results in Table 3. In Panel A, we use the difference in contributions for all employees
we observe. Thus, the effects documented in this panel may be due to both changes in how
individual employees contribute as well as changes in the composition of contributing employees.
In Panel B, we retain contributions made only by those employees who contribute at least once
24 This requirement excludes politicians who, for example, retired in the year of CEO turnover, because neither the employees nor the replacement CEO would have contributed to such candidates in the years following CEO change.
23
both before and after the CEO turnover, thereby focusing on changes in contributions that are not
caused by compositional changes.
Consistent with the idea that CEOs have a direct impact on political contributions of their
employees, we find, across all specifications, that when the replacement CEO starts to contribute
to different political candidates from the ones supported by the departing CEO, employees tend to
follow his/her lead and shift their support to the same candidates. A candidate supported by the
replacement CEO but not by the departing CEO receives $1,155 in new donations from the firm’s
employees at the expense of candidates supported by the departing CEO (column 1 of Panel A).
The difference in contributions around CEO turnovers may stem from changes in political
candidates’ electoral strength. To account for this possibility, in model 2 we include candidate-
cycle fixed effects and find similar results. Another factor that may prompt the replacement CEO
to contribute to a different set of candidates is firm-level changes around CEO turnover, such as a
decrease in firm profitability or new investment. We address this possibility in model 3, where
instead of using levels of control variables we use their changes from the year before the turnover
to the year after.25 Our results hold also in this specification. Finally, in model 4 we consider only
those CEO turnovers that resulted from CEO death or natural retirement, which should therefore
be unrelated to politics. Specifically, we choose turnover events in which the departing CEO dies
or is 65 years or older (we have 264 such events, of which 12 are caused by death) at the time of
the turnover and find that our results remain qualitatively unchanged.
Our results hold for all employees (Panel A) as well as for the subsample of employees
who contribute both before and after CEO turnover (Panel B). The magnitudes in Panel B are
25 Since calculating changes in control variables requires that the variables be non-missing in both years, the sample is slightly smaller in this case.
24

somewhat smaller, indicating that changes in employee contributions after CEO turnover result
both from changes in the composition of contributing employees and from changes in the
candidates to which the same employees contribute.
4. Mechanisms behind CEO influence
Why and when are CEOs able to have a significant impact on employees’ political choices?
Arguably, the CEO is a natural leader of an organization, and participation in the political process
may be an implicit element of a CEO’s job because leaders set social norms and expectations for
members of their organization (Fremeth, Richter, and Schaufele (2013)).26 Similarly, because
employees attribute a high status to the firm’s CEO, they may want to conform to a particular
behavior promoted by him/her (Akerlof (1980); Bénabou and Tirole (2006); Bernheim (1994)). In
this way, the CEO’s support of particular candidates may be viewed by employees as implicit
political advice, particularly if employees are ignorant about politics, do not know who their
representatives are, or do not know what policies they plan to implement.27 CEOs may also
explicitly advocate for political candidates, and employees may heed this advice either because
they believe that the set of candidates favored by the CEO is beneficial to the firm or because they
are afraid of retribution. Further, the information provided by the CEO could relax the employees’
time constraint for political participation (Brady, Verba, and Schlozman (1995)) and also reduce
the difference of opinion among employees, which could help mitigate the collective action
26 Prat (2002) develops a theory in which the contributions by the elite or a special interest group are informative about the candidate quality even if the interests of the elite diverge from those of a median voter. Thus employees may follow the lead of the CEO if they believe that he/she is knowledgeable about political candidates even if their preferences are not aligned with those of the CEO. Further, Gimpel, Lee, and Kaminski (2006) argue that individuals are more likely to develop purposive and solidary motives for giving if someone they know and trust communicates to them his or her commitment to a particular candidate. 27 Caplan (2007) argues that many voters are deeply ignorant about politics, are subject to behavioral biases in their political decision-making, and are easily influenced by others.
25

problem highlighted by Olson (1965). In this way, the CEO could play a role of political mobilizer
at his/her firm.
4.1. Case study: Employee contributions at Murray Energy
How do CEOs communicate their political preferences to employees? Anecdotal evidence
suggests that some firms, such as Westgate Resorts, Wynn Resorts, and Koch Industries, directly
educate their employees about their companies’ preferred electoral choices. Of course, much of
the communication between CEOs and company employees is unobservable to a researcher
because it takes place through internal communication channels, such as email, intranet, posters,
banners, company newsletters, network messages, and team meetings. There are instances,
however, in which records of such communication are publicly available. One such example comes
from Murray Energy, whose CEO, Robert E. Murray, has for many years been a major donor to
the Republican Party. He has hosted fundraising events for Republican candidates and has
repeatedly sent letters to his employees urging them to contribute to and vote for certain
candidates.28 Although Murray Energy is perhaps not a representative firm, it is a rare example
that allows us to directly observe the timing and nature of communication between the CEO and
employees.
For the 2012 election cycle, we are able to identify two instances when Robert E. Murray
explicitly expressed his political preferences to employees. On September 29, 2011, he hosted a
fundraiser for Texas governor Rick Perry. In a letter advertising the event, Murray wrote, “This is
likely the most vital election for America in our lifetimes, and we ask you to support Governor
28 Federal Election Commission MUR Case #6661.
26
Rick Perry at this time.”29 On May 3, 2012, Murray hosted another fundraiser, this time for Mitt
Romney.30
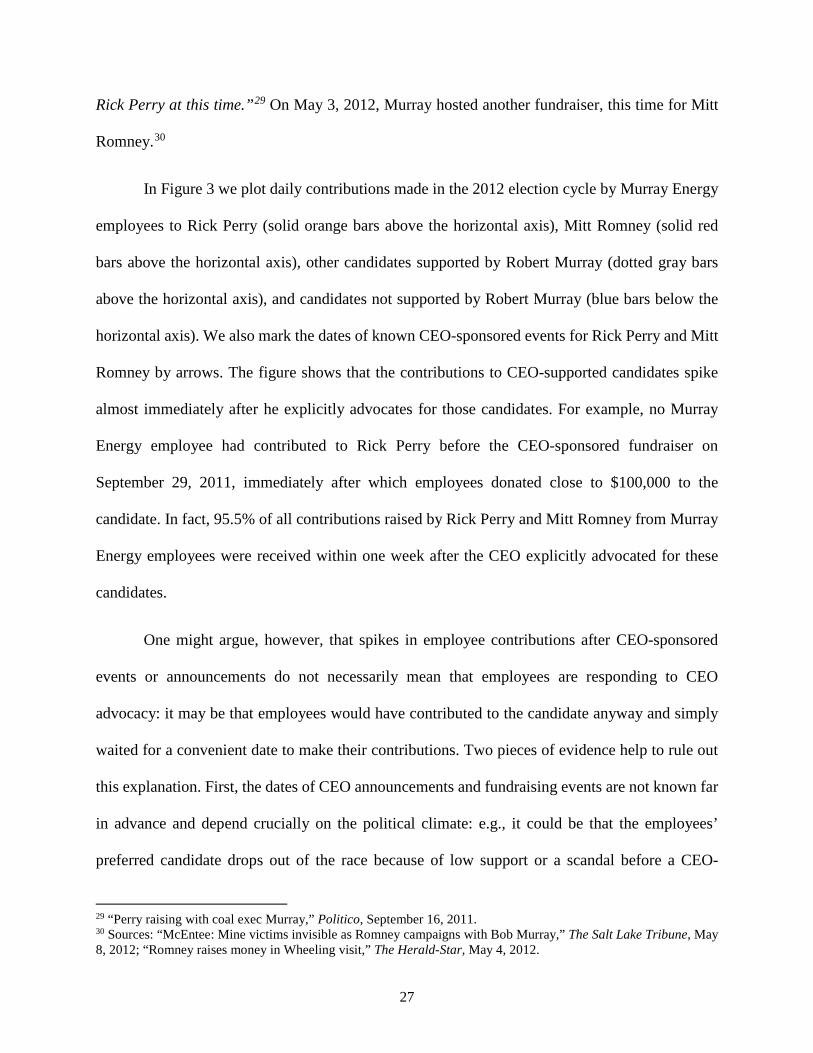
In Figure 3 we plot daily contributions made in the 2012 election cycle by Murray Energy
employees to Rick Perry (solid orange bars above the horizontal axis), Mitt Romney (solid red
bars above the horizontal axis), other candidates supported by Robert Murray (dotted gray bars
above the horizontal axis), and candidates not supported by Robert Murray (blue bars below the
horizontal axis). We also mark the dates of known CEO-sponsored events for Rick Perry and Mitt
Romney by arrows. The figure shows that the contributions to CEO-supported candidates spike
almost immediately after he explicitly advocates for those candidates. For example, no Murray
Energy employee had contributed to Rick Perry before the CEO-sponsored fundraiser on
September 29, 2011, immediately after which employees donated close to $100,000 to the
candidate. In fact, 95.5% of all contributions raised by Rick Perry and Mitt Romney from Murray
Energy employees were received within one week after the CEO explicitly advocated for these
candidates.
One might argue, however, that spikes in employee contributions after CEO-sponsored
events or announcements do not necessarily mean that employees are responding to CEO
advocacy: it may be that employees would have contributed to the candidate anyway and simply
waited for a convenient date to make their contributions. Two pieces of evidence help to rule out
this explanation. First, the dates of CEO announcements and fundraising events are not known far
in advance and depend crucially on the political climate: e.g., it could be that the employees’
preferred candidate drops out of the race because of low support or a scandal before a CEO-
29 “Perry raising with coal exec Murray,” Politico, September 16, 2011. 30 Sources: “McEntee: Mine victims invisible as Romney campaigns with Bob Murray,” The Salt Lake Tribune, May 8, 2012; “Romney raises money in Wheeling visit,” The Herald-Star, May 4, 2012.
27

sponsored event can even take place. Thus employees who are politically active and care about the
electoral prospects of their preferred candidates have little reason to wait until CEO
announcements.31 Second, Figure 3 shows no discernible pattern in employee contributions to
candidates not supported by the CEO. The evidence in Figure 3 is therefore consistent with the
idea that at least in some cases CEOs do have a substantial impact on how (and when) their
employees contribute to political candidates.32
4.2. Mechanisms
As the case of Murray Energy suggests, direct communication on political matters may be one way
for CEOs to influence employee contributions. While most communication between CEOs and
employees on political matters is unobservable, in some cases such communications have to be
reported to the FEC. When a firm spends more than $2,000 per election on express advocacy of
the election or defeat of a political candidate for federal office, the firm is required, under U.S.
federal law, to report the amount of incurred communication costs to the FEC. We therefore rely
on this piece of regulation and identify all cases in which firms in our sample report communication
costs (approximately 1% of observations), which likely singles out those firms that are most active
in promoting their political views to employees.33
31 Indeed, waiting to contribute could prove consequential for Murray Energy’s employees who supported Rick Perry in the 2012 presidential race, as Perry eventually had to drop out owing to a lack of electoral support. 32 This evidence, however, is silent on whether employees at Murray Energy were coerced to make campaign contributions or whether Robert E. Murray is simply an effective communicator. For example, a former Murray Energy employee filed a lawsuit in 2014 claiming that she was fired for not making campaign contributions to the CEO’s preferred political candidates (see, e.g., “Former foreman sues Murray Energy over firing,” Charleston Gazette-Mail, September 9, 2014). The FEC (MUR Case #6661), in a split 3–3 decision, decided not to pursue an investigation against Robert E. Murray. 33 Indeed, many firms that communicate with employees on election matters do not report such communication costs. For example, Wynn Resorts did not report communication costs in 2012, even though the company did send election guidance to its employees in that year.
28
To see whether employee contributions respond more strongly to CEO influence when the
firm directly communicates its electoral preferences to employees, in column 1 of Table 4 we show
the results of a regression of employee contributions to a political candidate on the CEO support
indicator, the indicator variable for a firm having reported communication costs, and an interaction
term between these two variables. We also include other control variables and firm, candidate, and
election cycle fixed effects in the same specification. The estimated coefficient on the interaction
term indicates that employee campaign contributions respond more strongly to the CEO’s
contributions in firms that explicitly advocate for political candidates. In fact, contributions to
CEO-supported candidates increase approximately fivefold for firms that report communication
costs, highlighting the significance of the communication channel.
These results also help us to rule out a reverse causality explanation, i.e., that CEOs who
observe the political preferences of their employees try to contribute to the political candidates that
their employees would approve of. The fact that some firms explicitly advocate for certain political
candidates and that CEO impact is largest in these firms does not support this reverse causality
explanation.
Another set of firms that are likely to educate their employees on election matters, even
without crossing the FEC reporting threshold, are firms that actively participate in the political
process or are subject to regulatory scrutiny. Prior literature documents that firms can engage in
political activism through lobbying or contributions made by their corporate PACs and shows that
political engagement may be beneficial to shareholders (Cooper, Gulen, and Ovtchinnikov (2010);
Claessens, Feijen, and Laeven (2008); Brogaard, Denes, and Duchin (2015); Akey (2015);
Borisov, Goldman, and Gupta (2015)). Further, as argued by Akey and Lewellen (2016),
investment in political capital has a higher expected return for firms exposed to significant policy
29
risk, such as firms that have corporate PACs or spend substantial amounts of money on lobbying,
perhaps because such firms operate in industries subject to greater regulation, and depend more
heavily on the allocation of government contracts or financing. We therefore investigate whether
such firms are also more successful in influencing their employees to contribute to certain political
candidates.
We identify politically active and regulated firms in three different ways. First, we create
an indicator variable equal to one for firms that have corporate PACs. Second, we define another
indicator variable equal to one for firms that operate in industries with heavy lobbying
expenditures. To identify such industries, we select all industries that are, in a given election cycle,
on the Center for Responsible Politics list of top 20 industries with the highest total lobbying
expenses. Finally, we create an indicator variable for firms that operate in heavily regulated
industries. We define an industry as heavily regulated if, in a given election cycle, it is among the
top 20 industries ranked by the sum of all federal regulations. The data on federal regulations are
provided by the Mercatus Center at George Mason University (Al-Ubaydli and McLaughlin
(2015)). Columns 2 to 4 of Table 4 report the results. Consistent with the idea that CEO influence
should be highest in firms with the highest expected returns from political participation, firms that
have corporate PACs, that belong to most lobbying-intensive or heavily regulated industries all
demonstrate a higher sensitivity of employee contributions to CEO contributions.
We next explore the conditions under which CEO influence on employee contributions is
likely to be most effective. We first investigate whether more politically connected CEOs are able
to exert greater influence on employee political contributions. There are several reasons to expect
a relation. First, CEOs with political connections may be in a better position to trade off favors
with politicians. Second, politically connected CEOs may themselves be more engaged in politics
30

and have better knowledge of whether certain candidates would promote policies favorable to the
firm.
In column 5, we add to our baseline specification the total number of a CEO’s political
connections as well as an interaction term between CEO support of a given candidate and the total
number of the CEO’s connections. We find that politically connected CEOs indeed appear to exert
greater influence on campaign contributions provided by their employees, although the economic
significance of personal political connections of CEOs is not as large as that of corporate PACs or
communication costs.
CEO influence may also depend on economic conditions. Prior literature suggests that
firms in general have a greater incentive and propensity to engage in political activism at times of
financial distress and poor business conditions (Acemoglu, Johnson, Kermani, Kwak, and Mitton
(2016); Ovtchinnikov and Pantaleoni (2012); Duchin and Sosyura (2012)). One reason is that
during such times political activism may be critical for firms’ survival. For example, Faccio,
Masulis, and McConnell (2006) find that politically connected firms are significantly more likely
to be bailed out by government than otherwise similar non-connected peers. Likewise, Duchin and
Sosyura (2012) document that during the financial crisis of 2008–2009 politically connected firms
were more likely to be funded through the Troubled Asset Purchase Program (TARP). To
investigate, we interact poor macroeconomic conditions (NBER-identified recessions) with CEO
support of political candidates and find that CEOs have a stronger impact on employee
contributions when the economy is in recession.34 These results may be explained by employees
34 Since election cycles last two years, there is no direct correspondence between recessions and election cycles. We code a given election cycle as part of a recession if the U.S. economy was in recession for at least three full quarters during that election cycle.
31

being more inclined to follow the CEO’s advice when layoffs are more likely, or by CEOs having
a greater incentive to engage in political activism when firm survival is at stake.
Finally, CEOs may be more eager to provide political advice and employees may be more
willing to follow it when political candidates have direct jurisdiction over the firm through their
positions on House or Senate committees. Such politicians are in a position to promulgate
regulations that may have an impact on a firm’s performance and the economic livelihood of its
employees. For each firm in our sample, we identify House members and Senators who sit on
committees with jurisdiction over a firm’s industry by using data on committee assignments from
Charles Stewart’s Congressional Data Page and the correspondence between committees and their
industry jurisdiction identified in Ovtchinnikov and Pantaleoni (2012).35 We then create an
indicator variable equal to one if a given candidate has jurisdiction over the firm’s industry and
interact this variable with CEO support. The results in column 7 of Table 4 indicate that the
sensitivity of employee contributions is stronger for politicians that have jurisdiction over the firm.
5. CEO political contributions and voter turnout
Apart from campaign contributions, firm employees may directly participate in the political
process by going to the polls and casting their votes for political candidates. In the United States,
voting is by secret ballot, and individual employee votes are thus unobservable. However, we have
survey data on employee voter turnout and can therefore investigate whether turnout is affected by
CEO contributions.
35 Charles Stewart has generously provided committee assignment data on his website at http://web.mit.edu/17.251/www/data_page.html. The data for House committee assignments are available for all election cycles in our sample. The data for Senate committee assignments are available through the 112th Congress. We manually collected Senate committee assignments for the 113th Congress (the last election cycle in our sample).
32
5.1. Summary statistics on voter turnout
Panel A of Table 5 reports summary statistics for our voter turnout sample. On average, CEOs
contribute to an employee’s congressional district 57.6% of the time, and the average CEO
contribution across all candidates in a given congressional district is $2,508. The average reported
household wealth is $498,000, where wealth includes the value of the employee’s house net of the
mortgage, plus the value of any vehicles, stocks and mutual funds, cash, checking accounts, and
retirement accounts. Approximately 58.6% of employees in our sample have a college degree or
higher, which is high relative to the national average. The share of respondents who report having
voted in the 2000 general election is 78.1% in our sample, which is higher than the average state-
level voter turnout of 51.0% during that election. This discrepancy may reflect people’s tendency
to over-report their voting activity, as noted by Harbaugh (1996), or the fact that our sample firms
have a higher level of education or employee involvement which was previously linked to voter
turnout (Schur, Kim, and Kruse (2016)).
5.2. Results on voter turnout
Panel B of Table 5 reports the results of cross-sectional regressions in which the dependent variable
is whether the employee voted in the 2000 general election. The main explanatory variables are
whether the CEO contributed to any candidate in the employee’s congressional district and the
total amount that the CEO contributed to all candidates in the employee’s congressional district.
We control for employee education, household wealth, and demographics, as well as average
voter turnout in the employee’s county of employment as a proxy for the general propensity to
33
vote.36 Since we use interaction terms in some of the specifications, we estimate linear probability
models.37 Standard errors are clustered by employee work-site. Consistent with prior studies on
voter turnout (see, e.g., Wolfinger and Rosenstone (1980) and Leighley and Nagler (1992)), we
see that education and household wealth are positively related to the individual’s propensity to
vote, perhaps because these characteristics help to overcome the procedural difficulties associated
with voting, such as voter registration, or because better-educated individuals have a stronger sense
of citizen duty as argued by Wolfinger and Rosenstone (1980). In line with findings by Leighley
and Nagler (1992), we also observe that women are more likely to vote and there is a hump-shaped
relation between age and voter turnout. We also observe that respondents who classify themselves
as Asian have a 36.4% lower propensity to vote in our sample, which is similar to more than 20%
lower turnout by Asians relative to Whites found by Citrin and Highton (2002) for California
residents.
More importantly, after controlling for demographic characteristics and the general
propensity to vote, we find that employees located in congressional districts in which CEOs make
political contributions are 11.5% more likely to vote than employees in other districts (we observe
a similar effect if we use the total amount of CEO contributions as the explanatory variable). The
magnitude of this effect is comparable to the effect of face-to-face political mobilization on voter
turnout documented in Gerber and Green (2000) and Gerber, Green, and Larimer (2008). Thus
CEO contributions appear to be successful in mobilizing employees to vote. We caution the reader
that these results are largely descriptive and do not necessarily imply causality and that we do not
36 For one location site in our sample we only have the state of employment, i.e., we have no information about the county. For this location site, we use state voter turnout instead. Our results remain virtually unchanged if we drop this location site from the sample. 37 We obtain similar results if we use probit. However, Ai and Norton (2003) and Greene (2010) show that interaction terms are not necessarily informative in the context of nonlinear models.
34

know whether the employees cast their votes for the candidates supported by the CEO. It could,
for example, be the case that the CEO involvement in politics increases the general political
awareness of employees, resulting in their higher propensity to vote, but not necessarily for the
CEO-favored candidates.
We also investigate whether the effect of CEOs on voter turnout varies across employees.
In particular, we interact employee education and wealth with the indicator variable of whether the
CEO contributed to candidates from the employee’s congressional district. These results, reported
in the last two columns of Table 5, indicate that the effect of CEO contributions is driven almost
entirely by less wealthy employees and those without a college degree. Because wealthy and
educated employees are likely to vote regardless of CEO advocacy, this evidence is consistent with
the idea that some employees, who may not actively seek election-related information on their
own, may obtain such information from their CEOs. Alternatively, it is possible that skills of poor
and less educated employees are less redeployable so that these people stand in for a greater risk
should the firm perform badly and hence have a greater incentive to further the interests of their
firm.
6. Conclusion
Employees contribute almost three times more to political candidates supported by their firm’s
CEO than to candidates not supported by the CEO, which suggests that CEO influence goes
beyond firm financial and operational decisions. We show that the effect of CEO contributions on
political donations by employees is not explained by common economic or geographic factors.
Moreover, this effect persists around CEO turnovers, including turnovers caused by death or
35
natural retirement, as employees start to contribute less to the candidates supported by the
departing CEO and more to the candidates supported by the replacement CEO.
The effect of CEO contributions is strongest among politically connected CEOs, in firms
that explicitly advocate for the election of particular candidates, in firms that have their own
corporate PACs, and in firms operating in heavily regulated industries. Further, CEOs have greater
influence on employee contributions to candidates that have direct jurisdiction over the firm and
during recessions, when political participation is most valuable. These results suggest that firms
with the greatest potential benefits from political activism may be more likely to try to influence
their employees’ political choices.
Finally, we find evidence that CEO influence on employee political choices extends
beyond campaign contributions and may also affect their likelihood of voting, as employees
located in congressional districts in which CEOs make political contributions are substantially
more likely to go to the polls than other employees.
36

References
Acemoglu, Daron, Simon Johnson, Amir Kermani, James Kwak, and Todd Mitton, 2016, The value of connections in turbulent times: Evidence from the United States, Journal of Financial Economics 121, 368–391.
Aggarwal, Rajesh K., Felix Meschke, and Tracy Y. Wang, 2012, Corporate political donations: Investment or agency, Business and Politics 14, 1–38.
Ai, Chunrong, and Norton, Edward C., 2003, Interaction terms in logit and probit models, Economics Letters 80, 123–129.
Akerlof, George, 1980, A theory of social custom, of which unemployment may be one consequence, Quarterly Journal of Economics 94, 749–775.
Akey, Pat, 2015, Valuing changes in political networks: Evidence from campaign contributions to close congressional elections, Review of Financial Studies 28, 3188–3223.
Akey, Pat, and Stefan Lewellen, 2016, Policy uncertainty, political capital, and firm risk-taking, University of Toronto working paper.
Altonji, Joseph G., Todd E. Elder, and Christopher R. Taber, 2005, Selection on observed and unobserved variables: Assessing the effectiveness of Catholic schools, Journal of Political Economy 113, 151–184.
Al-Ubaydli, Omar, and Patrick A. McLaughlin, 2015, RegData: A numerical database on industry-specific regulations for all United States industries and federal regulations, 1997–2012, Regulation & Governance, forthcoming.
Amore, Mario D., and Morten Bennedsen, 2013, The value of local political connections in a low-corruption environment, Journal of Financial Economics 110, 387–402.
Ansolabehere, Stephen, John M. de Figueiredo, and James M. Snyder Jr., 2003, Why is there so little money in U.S. politics? Journal of Economic Perspectives 17, 105–130.
Bénabou, Roland, and Jean Tirole, 2006, Incentives and prosocial behavior, American Economic Review 96, 1652–1678.
Bernheim, B. Douglas, 1994, A theory of conformity, Journal of Political Economy 102, 841–877.
Bertrand, Marianne, Francis Kramarz, Antoinette Schoar, and David Thesmar, 2004, Politically connected CEOs and corporate outcomes: Evidence from France, NBER working paper.
Bertrand, Marianne, Matilde Bombardini, and Francesco Trebbi, 2014, Is it whom you know or what you know? An empirical assessment of the lobbying process, American Economic Review 104, 3885–3920.
Borisov, Alexander, Eitan Goldman, and Nandini Gupta, 2015, The corporate value of (corrupt) lobbying, Review of Financial Studies, forthcoming.
Brady, Henry E., Sidney Verba, and Kay Lehman Schlozman, 1995, Beyond SES: A resourse model of political participation, American Political Science Review 89, 271-294.
37
Brogaard, Jonathan, Matthew Denes, and Ran Duchin, 2015, Political connections, incentives and innovation: Evidence from contract-level data, University of Washington working paper.
Caplan, Bryan, 2007, The myth of the rational voter: Why democracies choose bad policies, New Jersey: Princeton University Press.
Chaney, Paul K., Mara Faccio, and David C. Parsley, 2011, The quality of accounting information in politically connected firms, Journal of Accounting and Economics 51, 58–76.
Citrin, Jack, and Benjamin Highton, 2002, How race, ethnicity, and immigration shape the California electorate, Public Policy Institute of California.
Claessens, Stijn, Erik Feijen, and Luc Laeven, 2008, Political connections and preferential access to finance: The role of campaign contributions, Journal of Financial Economics 88, 554–580.
Coates, John C., 2012, Corporate politics, governance, and value before and after Citizens United, Journal of Empirical Legal Studies 9, 657–696.
Cooper, Michael J., Huseyin Gulen, and Alexei V. Ovtchinnikov, 2010, Corporate political contributions and stock returns, Journal of Finance 65, 687–724.
Correia, Maria M., 2014, Political connections and SEC enforcement, Journal of Accounting and Economics 57, 241–262.
Duchin, Ran, and Denis Sosyura, 2012, The politics of government investment, Journal of Financial Economics 106, 24–48.
Faccio, Mara, 2006, Politically connected firms, American Economic Review 96, 369–386.
Faccio, Mara, Ron W. Masulis, and John J. McConnell, 2006, Political connections and corporate bailouts, Journal of Finance 61, 2597–2635.
Ferguson, Thomas, and Hans-Joachim Voth, 2008, Betting on Hitler – the value of political connections in Nazi Germany, Quarterly Journal of Economics 123, 101–137.
Fisman, Raymond, 2001, Estimating the value of political connections, American Economic Review 91, 1095–1102.
Fremeth, Adam, Brian Kelleher Richter, and Brandon Schaufele, 2013, Campaign contributions over CEO’s careers, American Economic Journal: Applied Economics 5, 170–188.
Gehlbach, Scott, Konstantin Sonin, and Ekaterina Zhuravskaya, 2010, Businessman candidates, American Journal of Political Science 54, 718–736
Gerber, Alan S., and Donald P. Green, 2000, The effects of canvassing, telephone calls, and direct mail on voter turnout: A field experiment, American Political Science Review 94, 653–663.
Gerber, Alan S., Donald P. Green, and Christopher W. Larimer, 2008, Social pressure and voter turnout: Evidence from a large-scale field experiment, American Political Science Review 102, 33–48.
Gimpel, James G., Frances E. Lee, and Joshua Kaminski, 2006, The political geography of campaign contributions in American politics, Journal of Politics 68, 626–639.
38

Gimpel, James G., Frances E. Lee., and Shanna Pearson‐Merkowitz, 2008, The check is in the mail: Interdistrict funding flows in congressional elections, American Journal of Political Science 52, 373–394.
Goldman, Eitan, Jörg Rocholl, and Jongil So, 2009, Do politically connected boards affect firm value? Review of Financial Studies 22, 2331–2360.
Greene, William, 2004, The behavior of the maximum likelihood estimator of limited dependent variable models in the presence of fixed effects, Econometrics Journal 7, 98-119.
Greene, William, 2010, Testing hypotheses about interaction terms in nonlinear models, Economics Letters 107, 291–296.
Grier, Kevin B., and Michael C. Munger, 1991, Committee assignments, constituent preferences, and campaign contributions, Economic Inquiry 29, 24–43.
Harbaugh, William T., 1996, If people vote because they like to, then why do so many of them lie? Public Choice 89, 63–76.
Hertel-Fernandez, Alexander, 2016, American employers as political machines, forthcoming in the Journal of Politics.
Johnson, Simon, and Todd Mitton, 2003, Cronyism and capital controls: Evidence from Malaysia, Journal of Financial Economics 67, 351–382.
Kim, Chansog Francis, Christos Pantzalis, and Jung Chul Park, 2012, Political geography and stock returns: The value and risk implications of proximity to political power, Journal of Financial Economics 106, 196–228.
Kling, Daniel, and Stratmann, Thomas, 2016, The efficacy of political advertising: A voter participation field experiment with multiple robo calls and controls for selection effects, GMU working paper in economics No. 16–31.
Kroszner, Randall S., and Stratmann, 1998, Interest-group competition and the organization of Congress: Theory and evidence from financial services’ political action committees, American Economic Review 88, 1163–1187.
Kruse, Douglas L., Richard B. Freeman, and Joseph R. Blasi (eds.), 2010, Shared capitalism at work: Employee ownership, profit and gain-sharing, and broad-based stock options, University of Chicago Press.
Lee, Jongsub, Kwang J. Lee, and Nandu J. Nagarajan, 2014, Birds of a feather: Value implications of political alignment between top management and directors, Journal of Financial Economics 112, 232–250.
Leighley, Jan E., and Jonathan Nagler, 1992, Individual and systemic influences on turnout: Who votes? 1984, Journal of Politics 54, 718–740.
Milyo, Jeffrey, 2007, Electoral and financial effects of changes in committee power: The Gramm–Rudman–Hollings Budget Reform, the Tax Reform Act of 1986, and the money committees in the House, Journal of Law and Economics 40, 93–112.
39
Olson, Mancur Jr., 1965, The logic of collective action: Public goods and the theory of groups, Harvard University Press.
Oster, Emily, 2015, Unobservable selection and coefficient stability: Theory and evidence, Journal of Business Economics and Statistics, forthcoming.
Ovtchinnikov, Alexei V. and Eva Pantaleoni, 2012, Individual political contributions and firm performance, Journal of Financial Economics 105, 367–392.
Prat, Andrea, 2002, Campaign advertising and voter welfare, Review of Economic Studies 69, 999–1017.
Petersen, Mitchell A., 2009, Estimating standard errors in finance panel data sets: Comparing approaches, Review of Financial Studies 22, 435–480.
Romer, Thomas, and James M. Snyder, Jr., 1994, An empirical investigation of the dynamics of PAC contributions, American Journal of Political Science 38, 746–769.
Schur, Lisa, Jung Ook Kim, and Douglas Kruse, 2016, Workplace democracy and political participation, NBER working paper.
Snyder, James M., Jr., 1990, Campaign contributions as investments: The U.S. House of Representatives, 1980–1986, Journal of Political Economy 98, 1195–1227.
Stewart, Charles III, and Jonathan Woon, Congressional Committee Assignments, 103rd to 113th Congresses, 1993–2014: House, date of data file: March 9, 2016.
Stewart, Charles III, and Jonathan Woon, Congressional Committee Assignments, 103rd to 112th Congresses, 1993–2012: Senate, date of data file: June 23, 2011.
Stratmann, Thomas, 1992, Are contributors rational? Untangling strategies of political action committees, Journal of Political Economy 100, 647-664.
Stratmann, Thomas, and J. W. Verret, 2015, How does corporate political activity allowed by Citizens United v. Federal Election Commission affect shareholder wealth? Journal of Law and Economics 58, 545-717.
Tahoun, Ahmed, 2014, The role of stock ownership by U.S. members of Congress on the market for political favors, Journal of Financial Economics 111, 86–110.
Thompson, Samuel B., 2011, Simple formulas for standard errors that cluster by both firm and time, Journal of Financial Economics 99, 1–10.
Wolfinger, Raymond E., and Stephen J. Rosenstone, 1980, Who votes? New Haven: Yale University Press.
40
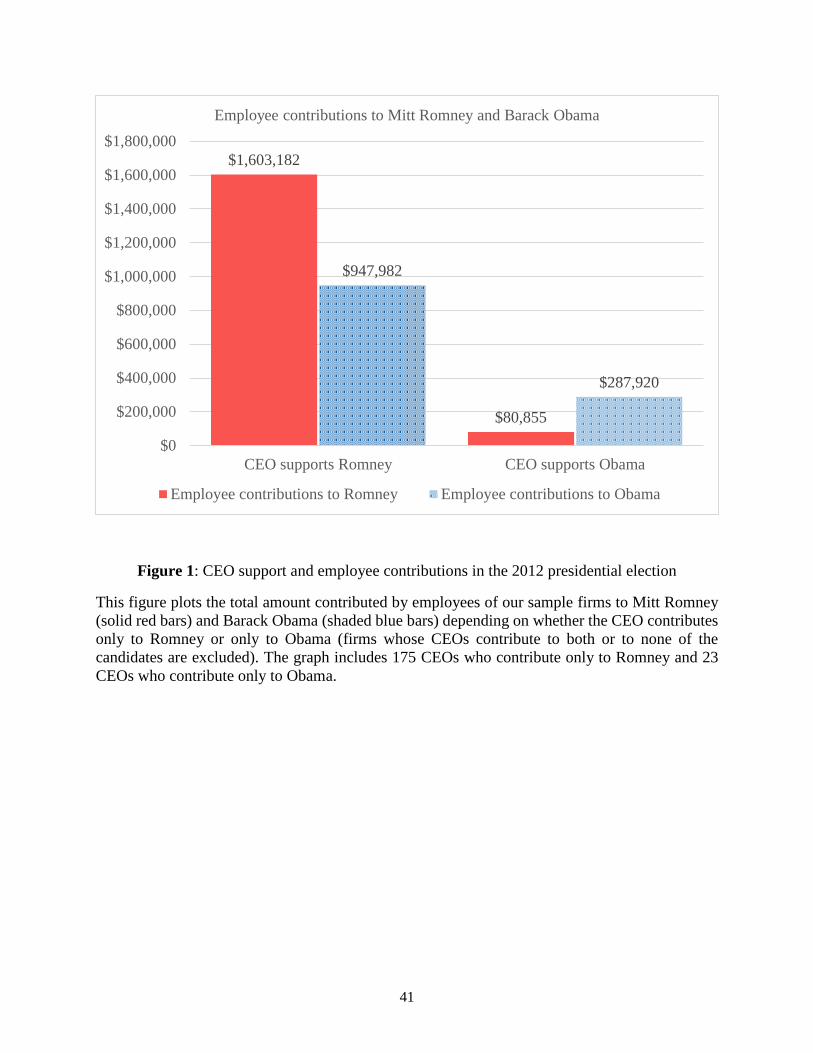
Figure 1: CEO support and employee contributions in the 2012 presidential election
This figure plots the total amount contributed by employees of our sample firms to Mitt Romney (solid red bars) and Barack Obama (shaded blue bars) depending on whether the CEO contributes only to Romney or only to Obama (firms whose CEOs contribute to both or to none of the candidates are excluded). The graph includes 175 CEOs who contribute only to Romney and 23 CEOs who contribute only to Obama.
$1,603,182
$80,855
$947,982
$287,920
$0
$200,000
$400,000
$600,000
$800,000
$1,000,000
$1,200,000
$1,400,000
$1,600,000
$1,800,000
CEO supports Romney CEO supports Obama
Employee contributions to Mitt Romney and Barack Obama
Employee contributions to Romney Employee contributions to Obama
41

Figure 2: Total employee and CEO contributions
This figure plots the total amount contributed by employees and CEOs between 1999 and 2014, split by party of the candidates receiving contributions: solid red bars for Republicans and shaded blue bars for Democrats and Independents. The total amount (in millions of USD) is indicated on the left axis; the percentages above the bars indicate the share of contributions received by candidates from a given party.
49.95%
59.48%
50.05%
40.52%
0
20
40
60
80
100
120
140
160
Contributions by employees Contributions by CEOs
Campaign contributions by CEOs and employees ($ millions)
Republican Democrat and Independent
42

Figure 3: Campaign contributions by employees of Murray Energy
This figure plots daily amounts contributed in the 2012 election cycle by Murray Energy’s employees to Rick Perry (solid orange bars above the horizontal axis), Mitt Romney (solid red bars above the horizontal axis), other candidates supported by Robert Murray (dotted gray bars above the horizontal axis), and candidates not supported by Robert Murray (blue bars below the horizontal axis). The dates on which Murray Energy’s CEO hosted campaign fundraisers for political candidates (September 29, 2011 for Rick Perry and May 3, 2012 for Mitt Romney) are marked by arrows.
43
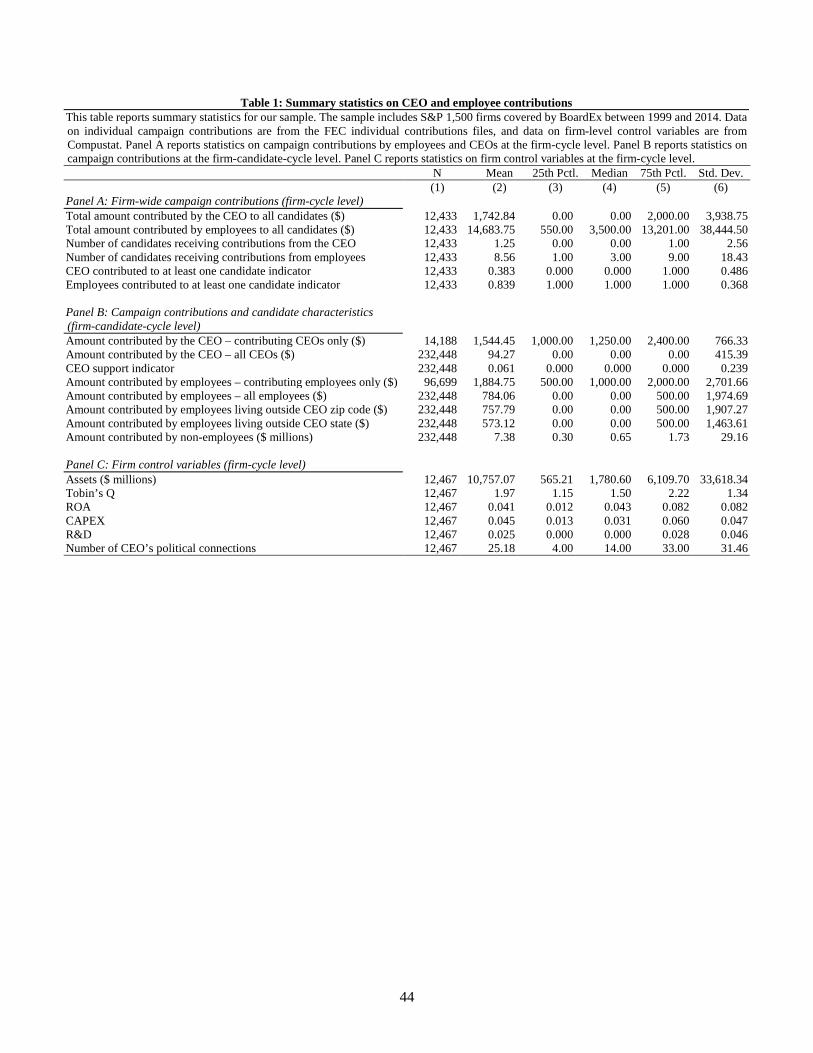
Table 1: Summary statistics on CEO and employee contributions This table reports summary statistics for our sample. The sample includes S&P 1,500 firms covered by BoardEx between 1999 and 2014. Data on individual campaign contributions are from the FEC individual contributions files, and data on firm-level control variables are from Compustat. Panel A reports statistics on campaign contributions by employees and CEOs at the firm-cycle level. Panel B reports statistics on campaign contributions at the firm-candidate-cycle level. Panel C reports statistics on firm control variables at the firm-cycle level.
N Mean 25th Pctl. Median 75th Pctl. Std. Dev. (1) (2) (3) (4) (5) (6)
Panel A: Firm-wide campaign contributions (firm-cycle level) Total amount contributed by the CEO to all candidates ($) 12,433 1,742.84 0.00 0.00 2,000.00 3,938.75 Total amount contributed by employees to all candidates ($) 12,433 14,683.75 550.00 3,500.00 13,201.00 38,444.50 Number of candidates receiving contributions from the CEO 12,433 1.25 0.00 0.00 1.00 2.56 Number of candidates receiving contributions from employees 12,433 8.56 1.00 3.00 9.00 18.43 CEO contributed to at least one candidate indicator 12,433 0.383 0.000 0.000 1.000 0.486 Employees contributed to at least one candidate indicator 12,433 0.839 1.000 1.000 1.000 0.368 Panel B: Campaign contributions and candidate characteristics (firm-candidate-cycle level)
Amount contributed by the CEO – contributing CEOs only ($) 14,188 1,544.45 1,000.00 1,250.00 2,400.00 766.33 Amount contributed by the CEO – all CEOs ($) 232,448 94.27 0.00 0.00 0.00 415.39 CEO support indicator 232,448 0.061 0.000 0.000 0.000 0.239 Amount contributed by employees – contributing employees only ($) 96,699 1,884.75 500.00 1,000.00 2,000.00 2,701.66 Amount contributed by employees – all employees ($) 232,448 784.06 0.00 0.00 500.00 1,974.69 Amount contributed by employees living outside CEO zip code ($) 232,448 757.79 0.00 0.00 500.00 1,907.27 Amount contributed by employees living outside CEO state ($) 232,448 573.12 0.00 0.00 500.00 1,463.61 Amount contributed by non-employees ($ millions) 232,448 7.38 0.30 0.65 1.73 29.16 Panel C: Firm control variables (firm-cycle level) Assets ($ millions) 12,467 10,757.07 565.21 1,780.60 6,109.70 33,618.34 Tobin’s Q 12,467 1.97 1.15 1.50 2.22 1.34 ROA 12,467 0.041 0.012 0.043 0.082 0.082 CAPEX 12,467 0.045 0.013 0.031 0.060 0.047 R&D 12,467 0.025 0.000 0.000 0.028 0.046 Number of CEO’s political connections 12,467 25.18 4.00 14.00 33.00 31.46
44
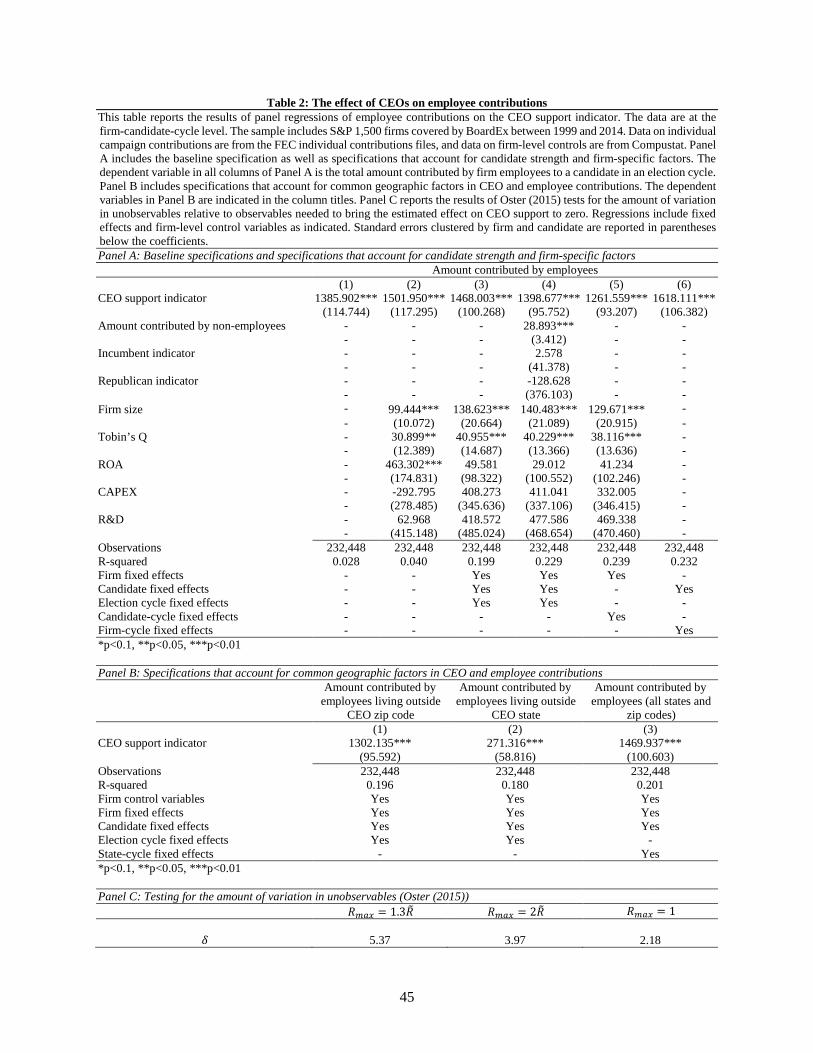
Table 2: The effect of CEOs on employee contributions This table reports the results of panel regressions of employee contributions on the CEO support indicator. The data are at the firm-candidate-cycle level. The sample includes S&P 1,500 firms covered by BoardEx between 1999 and 2014. Data on individual campaign contributions are from the FEC individual contributions files, and data on firm-level controls are from Compustat. Panel A includes the baseline specification as well as specifications that account for candidate strength and firm-specific factors. The dependent variable in all columns of Panel A is the total amount contributed by firm employees to a candidate in an election cycle. Panel B includes specifications that account for common geographic factors in CEO and employee contributions. The dependent variables in Panel B are indicated in the column titles. Panel C reports the results of Oster (2015) tests for the amount of variation in unobservables relative to observables needed to bring the estimated effect on CEO support to zero. Regressions include fixed effects and firm-level control variables as indicated. Standard errors clustered by firm and candidate are reported in parentheses below the coefficients. Panel A: Baseline specifications and specifications that account for candidate strength and firm-specific factors Amount contributed by employees
(1) (2) (3) (4) (5) (6) CEO support indicator 1385.902*** 1501.950*** 1468.003*** 1398.677*** 1261.559*** 1618.111*** (114.744) (117.295) (100.268) (95.752) (93.207) (106.382) Amount contributed by non-employees - - - 28.893*** - - - - - (3.412) - - Incumbent indicator - - - 2.578 - - - - - (41.378) - - Republican indicator - - - -128.628 - - - - - (376.103) - - Firm size - 99.444*** 138.623*** 140.483*** 129.671*** - - (10.072) (20.664) (21.089) (20.915) - Tobin’s Q - 30.899** 40.955*** 40.229*** 38.116*** - - (12.389) (14.687) (13.366) (13.636) - ROA - 463.302*** 49.581 29.012 41.234 - - (174.831) (98.322) (100.552) (102.246) - CAPEX - -292.795 408.273 411.041 332.005 - - (278.485) (345.636) (337.106) (346.415) - R&D - 62.968 418.572 477.586 469.338 - - (415.148) (485.024) (468.654) (470.460) - Observations 232,448 232,448 232,448 232,448 232,448 232,448 R-squared 0.028 0.040 0.199 0.229 0.239 0.232 Firm fixed effects - - Yes Yes Yes - Candidate fixed effects - - Yes Yes - Yes Election cycle fixed effects - - Yes Yes - - Candidate-cycle fixed effects - - - - Yes - Firm-cycle fixed effects - - - - - Yes *p<0.1, **p<0.05, ***p<0.01 Panel B: Specifications that account for common geographic factors in CEO and employee contributions Amount contributed by
employees living outside CEO zip code
Amount contributed by employees living outside
CEO state
Amount contributed by employees (all states and
zip codes) (1) (2) (3)
CEO support indicator 1302.135*** 271.316*** 1469.937*** (95.592) (58.816) (100.603) Observations 232,448 232,448 232,448 R-squared 0.196 0.180 0.201 Firm control variables Yes Yes Yes Firm fixed effects Yes Yes Yes Candidate fixed effects Yes Yes Yes Election cycle fixed effects Yes Yes - State-cycle fixed effects - - Yes *p<0.1, **p<0.05, ***p<0.01 Panel C: Testing for the amount of variation in unobservables (Oster (2015)) 𝑅𝑅𝑒𝑒𝑚𝑚𝑚𝑚 = 1.3𝑅𝑅� 𝑅𝑅𝑒𝑒𝑚𝑚𝑚𝑚 = 2𝑅𝑅� 𝑅𝑅𝑒𝑒𝑚𝑚𝑚𝑚 = 1
𝛿𝛿 5.37 3.97 2.18
45
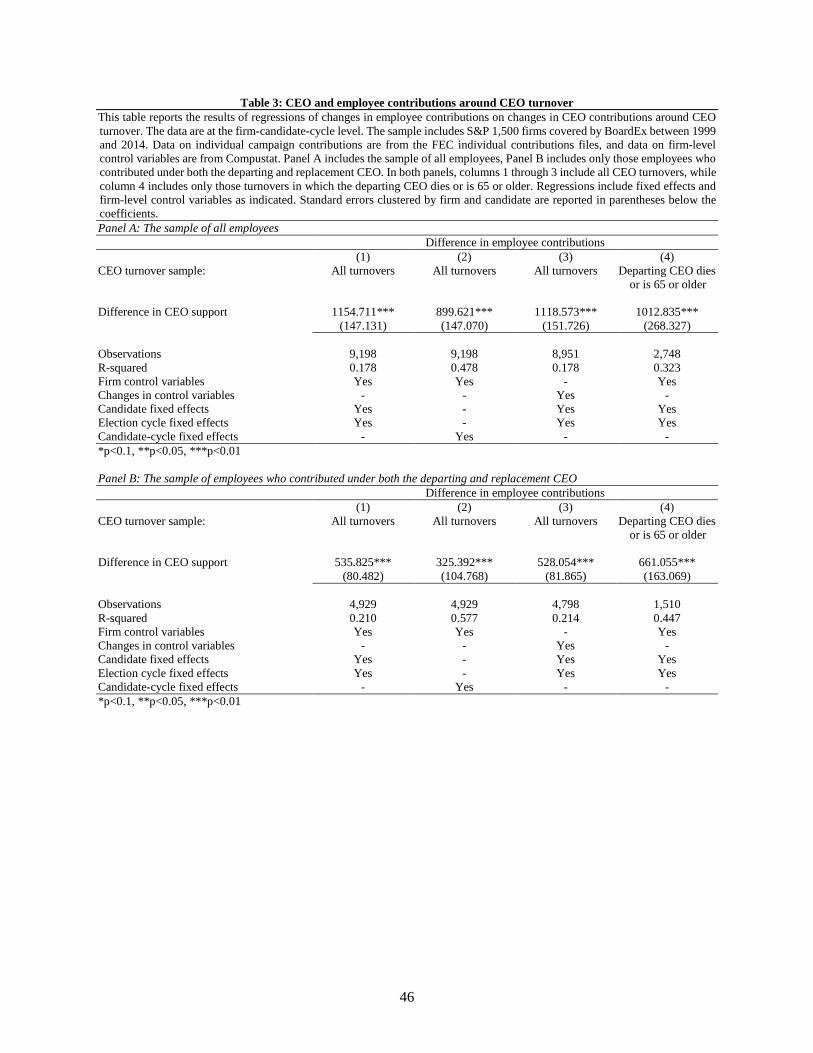
Table 3: CEO and employee contributions around CEO turnover This table reports the results of regressions of changes in employee contributions on changes in CEO contributions around CEO turnover. The data are at the firm-candidate-cycle level. The sample includes S&P 1,500 firms covered by BoardEx between 1999 and 2014. Data on individual campaign contributions are from the FEC individual contributions files, and data on firm-level control variables are from Compustat. Panel A includes the sample of all employees, Panel B includes only those employees who contributed under both the departing and replacement CEO. In both panels, columns 1 through 3 include all CEO turnovers, while column 4 includes only those turnovers in which the departing CEO dies or is 65 or older. Regressions include fixed effects and firm-level control variables as indicated. Standard errors clustered by firm and candidate are reported in parentheses below the coefficients. Panel A: The sample of all employees
Difference in employee contributions (1) (2) (3) (4) CEO turnover sample: All turnovers All turnovers All turnovers Departing CEO dies
or is 65 or older Difference in CEO support 1154.711*** 899.621*** 1118.573*** 1012.835*** (147.131) (147.070) (151.726) (268.327) Observations 9,198 9,198 8,951 2,748 R-squared 0.178 0.478 0.178 0.323 Firm control variables Yes Yes - Yes Changes in control variables - - Yes - Candidate fixed effects Yes - Yes Yes Election cycle fixed effects Yes - Yes Yes Candidate-cycle fixed effects - Yes - - *p<0.1, **p<0.05, ***p<0.01 Panel B: The sample of employees who contributed under both the departing and replacement CEO
Difference in employee contributions (1) (2) (3) (4) CEO turnover sample: All turnovers All turnovers All turnovers Departing CEO dies
or is 65 or older Difference in CEO support 535.825*** 325.392*** 528.054*** 661.055*** (80.482) (104.768) (81.865) (163.069) Observations 4,929 4,929 4,798 1,510 R-squared 0.210 0.577 0.214 0.447 Firm control variables Yes Yes - Yes Changes in control variables - - Yes - Candidate fixed effects Yes - Yes Yes Election cycle fixed effects Yes - Yes Yes Candidate-cycle fixed effects - Yes - - *p<0.1, **p<0.05, ***p<0.01
46
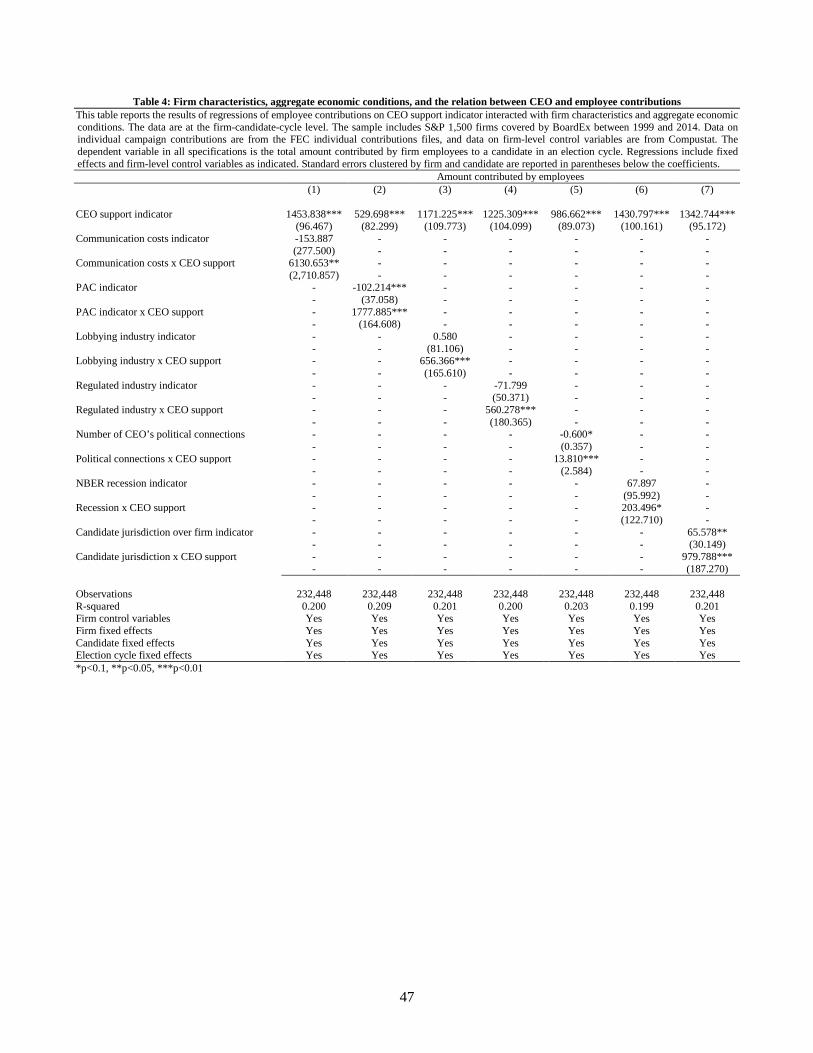
Table 4: Firm characteristics, aggregate economic conditions, and the relation between CEO and employee contributions This table reports the results of regressions of employee contributions on CEO support indicator interacted with firm characteristics and aggregate economic conditions. The data are at the firm-candidate-cycle level. The sample includes S&P 1,500 firms covered by BoardEx between 1999 and 2014. Data on individual campaign contributions are from the FEC individual contributions files, and data on firm-level control variables are from Compustat. The dependent variable in all specifications is the total amount contributed by firm employees to a candidate in an election cycle. Regressions include fixed effects and firm-level control variables as indicated. Standard errors clustered by firm and candidate are reported in parentheses below the coefficients.
Amount contributed by employees (1) (2) (3) (4) (5) (6) (7) CEO support indicator 1453.838*** 529.698*** 1171.225*** 1225.309*** 986.662*** 1430.797*** 1342.744*** (96.467) (82.299) (109.773) (104.099) (89.073) (100.161) (95.172) Communication costs indicator -153.887 - - - - - - (277.500) - - - - - - Communication costs x CEO support 6130.653** - - - - - - (2,710.857) - - - - - - PAC indicator - -102.214*** - - - - - - (37.058) - - - - - PAC indicator x CEO support - 1777.885*** - - - - - - (164.608) - - - - - Lobbying industry indicator - - 0.580 - - - - - - (81.106) - - - - Lobbying industry x CEO support - - 656.366*** - - - - - - (165.610) - - - - Regulated industry indicator - - - -71.799 - - - - - - (50.371) - - - Regulated industry x CEO support - - - 560.278*** - - - - - - (180.365) - - - Number of CEO’s political connections - - - - -0.600* - - - - - - (0.357) - - Political connections x CEO support - - - - 13.810*** - - - - - - (2.584) - - NBER recession indicator - - - - - 67.897 - - - - - - (95.992) - Recession x CEO support - - - - - 203.496* - - - - - - (122.710) - Candidate jurisdiction over firm indicator - - - - - - 65.578** - - - - - - (30.149) Candidate jurisdiction x CEO support - - - - - - 979.788*** - - - - - - (187.270) Observations 232,448 232,448 232,448 232,448 232,448 232,448 232,448 R-squared 0.200 0.209 0.201 0.200 0.203 0.199 0.201 Firm control variables Yes Yes Yes Yes Yes Yes Yes Firm fixed effects Yes Yes Yes Yes Yes Yes Yes Candidate fixed effects Yes Yes Yes Yes Yes Yes Yes Election cycle fixed effects Yes Yes Yes Yes Yes Yes Yes *p<0.1, **p<0.05, ***p<0.01
47
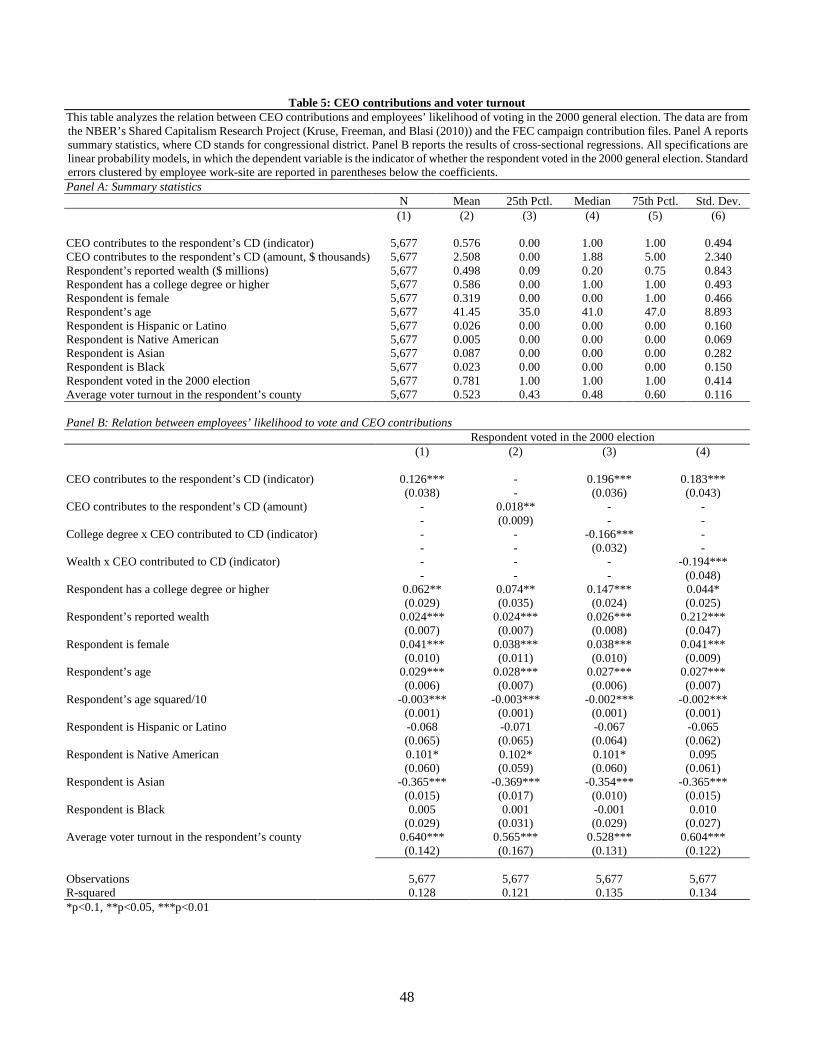
Table 5: CEO contributions and voter turnout This table analyzes the relation between CEO contributions and employees’ likelihood of voting in the 2000 general election. The data are from the NBER’s Shared Capitalism Research Project (Kruse, Freeman, and Blasi (2010)) and the FEC campaign contribution files. Panel A reports summary statistics, where CD stands for congressional district. Panel B reports the results of cross-sectional regressions. All specifications are linear probability models, in which the dependent variable is the indicator of whether the respondent voted in the 2000 general election. Standard errors clustered by employee work-site are reported in parentheses below the coefficients. Panel A: Summary statistics
N Mean 25th Pctl. Median 75th Pctl. Std. Dev. (1) (2) (3) (4) (5) (6)
CEO contributes to the respondent’s CD (indicator) 5,677 0.576 0.00 1.00 1.00 0.494 CEO contributes to the respondent’s CD (amount, $ thousands) 5,677 2.508 0.00 1.88 5.00 2.340 Respondent’s reported wealth ($ millions) 5,677 0.498 0.09 0.20 0.75 0.843 Respondent has a college degree or higher 5,677 0.586 0.00 1.00 1.00 0.493 Respondent is female 5,677 0.319 0.00 0.00 1.00 0.466 Respondent’s age 5,677 41.45 35.0 41.0 47.0 8.893 Respondent is Hispanic or Latino 5,677 0.026 0.00 0.00 0.00 0.160 Respondent is Native American 5,677 0.005 0.00 0.00 0.00 0.069 Respondent is Asian 5,677 0.087 0.00 0.00 0.00 0.282 Respondent is Black 5,677 0.023 0.00 0.00 0.00 0.150 Respondent voted in the 2000 election 5,677 0.781 1.00 1.00 1.00 0.414 Average voter turnout in the respondent’s county 5,677 0.523 0.43 0.48 0.60 0.116 Panel B: Relation between employees’ likelihood to vote and CEO contributions
Respondent voted in the 2000 election (1) (2) (3) (4) CEO contributes to the respondent’s CD (indicator) 0.126*** - 0.196*** 0.183*** (0.038) - (0.036) (0.043) CEO contributes to the respondent’s CD (amount) - 0.018** - - - (0.009) - - College degree x CEO contributed to CD (indicator) - - -0.166*** - - - (0.032) - Wealth x CEO contributed to CD (indicator) - - - -0.194*** - - - (0.048) Respondent has a college degree or higher 0.062** 0.074** 0.147*** 0.044* (0.029) (0.035) (0.024) (0.025) Respondent’s reported wealth 0.024*** 0.024*** 0.026*** 0.212*** (0.007) (0.007) (0.008) (0.047) Respondent is female 0.041*** 0.038*** 0.038*** 0.041*** (0.010) (0.011) (0.010) (0.009) Respondent’s age 0.029*** 0.028*** 0.027*** 0.027*** (0.006) (0.007) (0.006) (0.007) Respondent’s age squared/10 -0.003*** -0.003*** -0.002*** -0.002*** (0.001) (0.001) (0.001) (0.001) Respondent is Hispanic or Latino -0.068 -0.071 -0.067 -0.065 (0.065) (0.065) (0.064) (0.062) Respondent is Native American 0.101* 0.102* 0.101* 0.095 (0.060) (0.059) (0.060) (0.061) Respondent is Asian -0.365*** -0.369*** -0.354*** -0.365*** (0.015) (0.017) (0.010) (0.015) Respondent is Black 0.005 0.001 -0.001 0.010 (0.029) (0.031) (0.029) (0.027) Average voter turnout in the respondent’s county 0.640*** 0.565*** 0.528*** 0.604*** (0.142) (0.167) (0.131) (0.122) Observations 5,677 5,677 5,677 5,677 R-squared 0.128 0.121 0.135 0.134 *p<0.1, **p<0.05, ***p<0.01
48
Appendix A: Robustness
Table A1 presents the results of several robustness tests. For ease of comparison with the main
text, the first column of Table A1 reports our baseline specification. In column 2 of Table A1, we
replace our main explanatory variable (CEO support indicator) with the amount that the CEO
contributed to a given candidate. The effect of CEO contributions remains statistically and
economically significant and implies that a one-standard deviation increase in the amount
contributed by the CEO increases the amount of employee contributions by 52% relative to its
mean. Column 3 shows that our results are robust to using Tobit estimation instead of OLS, given
that the amount of contributions is naturally left-censored at 0. The coefficient of interest remains
statistically significant, and its magnitude increases somewhat relative to the baseline.38
We also investigate the robustness of our results to alternative sample construction
methods. Recall that our main sample contains all candidates to which either the firm’s CEO or its
employees contributed at any point between 1999 and 2014 and thus includes observations for
which a candidate running for office did not receive any contributions from the firm’s CEO or
employees in a given election cycle (as long as this candidate received such contributions in
another election cycle). In the first robustness test of sample construction (reported in column 4 of
Table A1), we exclude all firm-cycle observations where the CEO did not contribute to any
political candidates. This test thus excludes all cases in which the CEO does not intend to influence
employees’ contributions as well as cases in which the CEO may intend to prevent employees
from contributing to any federal candidates. We find that in this subsample the effect of CEO
contributions remains both economically and statistically significant, and its magnitude is similar
38 Because of the well-known bias in nonlinear models with fixed effects (Greene, 2004), the Tobit model reported in column 3 does not include fixed effects.
49
to that in the baseline. Finally, in column 4 of Table A1, we exclude all observations in which
neither employees nor the CEO contributed to a candidate and find that campaign contributions by
the CEO continue to have a statistically and economically significant effect on campaign
contributions by employees. Perhaps unsurprisingly, the coefficient’s magnitude decreases
somewhat relative to the baseline, consistent with the idea that employees’ decision both which
candidates to contribute to and which candidates not to contribute to is related to CEOs’ political
preferences.
50
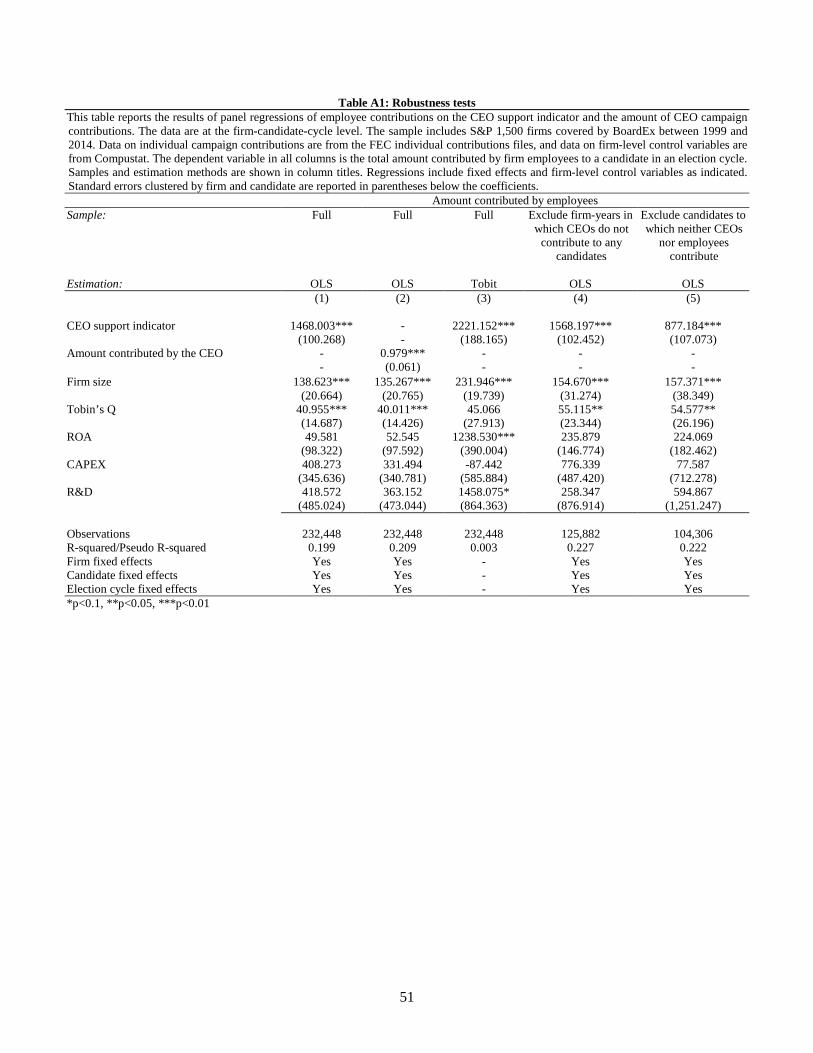
Table A1: Robustness tests This table reports the results of panel regressions of employee contributions on the CEO support indicator and the amount of CEO campaign contributions. The data are at the firm-candidate-cycle level. The sample includes S&P 1,500 firms covered by BoardEx between 1999 and 2014. Data on individual campaign contributions are from the FEC individual contributions files, and data on firm-level control variables are from Compustat. The dependent variable in all columns is the total amount contributed by firm employees to a candidate in an election cycle. Samples and estimation methods are shown in column titles. Regressions include fixed effects and firm-level control variables as indicated. Standard errors clustered by firm and candidate are reported in parentheses below the coefficients. Amount contributed by employees Sample: Full Full Full Exclude firm-years in
which CEOs do not contribute to any
candidates
Exclude candidates to which neither CEOs
nor employees contribute
Estimation: OLS OLS Tobit OLS OLS
(1) (2) (3) (4) (5)
CEO support indicator 1468.003*** - 2221.152*** 1568.197*** 877.184*** (100.268) - (188.165) (102.452) (107.073) Amount contributed by the CEO - 0.979*** - - - - (0.061) - - - Firm size 138.623*** 135.267*** 231.946*** 154.670*** 157.371*** (20.664) (20.765) (19.739) (31.274) (38.349) Tobin’s Q 40.955*** 40.011*** 45.066 55.115** 54.577** (14.687) (14.426) (27.913) (23.344) (26.196) ROA 49.581 52.545 1238.530*** 235.879 224.069 (98.322) (97.592) (390.004) (146.774) (182.462) CAPEX 408.273 331.494 -87.442 776.339 77.587 (345.636) (340.781) (585.884) (487.420) (712.278) R&D 418.572 363.152 1458.075* 258.347 594.867 (485.024) (473.044) (864.363) (876.914) (1,251.247) Observations 232,448 232,448 232,448 125,882 104,306 R-squared/Pseudo R-squared 0.199 0.209 0.003 0.227 0.222 Firm fixed effects Yes Yes - Yes Yes Candidate fixed effects Yes Yes - Yes Yes Election cycle fixed effects Yes Yes - Yes Yes *p<0.1, **p<0.05, ***p<0.01
51