dnv-cg-0041 ice strengthening of propulsion machinery and
TRANSCRIPT

CLASS GUIDELINE
DNV-CG-0041 Edition September 2021
Ice strengthening of propulsion machineryand hull appendages
The content of this service document is the subject of intellectual property rights reserved by DNV AS (“DNV”). The useraccepts that it is prohibited by anyone else but DNV and/or its licensees to offer and/or perform classification, certificationand/or verification services, including the issuance of certificates and/or declarations of conformity, wholly or partly, on thebasis of and/or pursuant to this document whether free of charge or chargeable, without DNV’s prior written consent. DNVis not responsible for the consequences arising from any use of this document by others.
The PDF electronic version of this document available at the DNV website dnv.com is the official version. If thereare any inconsistencies between the PDF version and any other available version, the PDF version shall prevail.
DNV AS

FOREWORD
DNV class guidelines contain methods, technical requirements, principles and acceptance criteriarelated to classed objects as referred to from the rules.
© DNV AS September 2021
Any comments may be sent by e-mail to [email protected]
This service document has been prepared based on available knowledge, technology and/or information at the time of issuance of thisdocument. The use of this document by other parties than DNV is at the user's sole risk. Unless otherwise stated in an applicable contract,or following from mandatory law, the liability of DNV AS, its parent companies and subsidiaries as well as their officers, directors andemployees (“DNV”) for proved loss or damage arising from or in connection with any act or omission of DNV, whether in contract or in tort(including negligence), shall be limited to direct losses and under any circumstance be limited to 300,000 USD.

CHANGES – CURRENT
This document supersedes the July 2020 edition of DNVGL-CG-0041.The numbering and/or title of items containing changes is highlighted in red.
Changes September 2021
Topic Reference Description
Rebranding to DNV All This document has been revised due to the rebranding of DNVGL to DNV. The following have been updated: the companyname, material and certificate designations, and references toother documents in the DNV portfolio. Some of the documentsreferred to may not yet have been rebranded. If so, please seethe relevant DNV GL document. No technical content has beenchanged.
Editorial correctionsIn addition to the above stated changes, editorial corrections may have been made.
Changes - current
Class guideline — DNV-CG-0041. Edition September 2021 Page 3Ice strengthening of propulsion machinery and hull appendages
DNV AS

CONTENTS
Changes – current.................................................................................................. 3
Section 1 General....................................................................................................61 Scope................................................................................................... 62 Application...........................................................................................63 Symbols, nomenclature and units........................................................6
Section 2 Propeller blades...................................................................................... 91 Ice interaction load models.................................................................92 Finite element analysis......................................................................143 Propeller blade strength assessment.................................................214 Blade failure design loads................................................................. 24
Section 3 Propeller hub and pitch mechanism...................................................... 251 Scope and general remarks............................................................... 252 Applicable load scenarios.................................................................. 273 Load transmission..............................................................................284 Strength assessment......................................................................... 335 Stress in components of CP-Mechanism............................................ 346 Material strength............................................................................... 47
Section 4 Guidance on simulation calculations..................................................... 561 The lumped mass-elastic system....................................................... 562 Damping in the mass-elastic system................................................. 563 Excitations......................................................................................... 61
Section 5 Propulsion shaft design against fatigue................................................ 621 Nomenclature.....................................................................................622 General.............................................................................................. 623 Method for fatigue analysis............................................................... 63
Section 6 Reduction gears.................................................................................... 691 General.............................................................................................. 69
Section 7 Podded propulsors or azimuthing thrusters.......................................... 701 Ice loads on pod/thruster body and propeller hub............................ 70
Section 8 Ice load on appendages and other special structures............................741 Ice load on nozzle, rudder and shaft brackets...................................74
Contents
Class guideline — DNV-CG-0041. Edition September 2021 Page 4Ice strengthening of propulsion machinery and hull appendages
DNV AS
2 Ice load on bow thrusters grids........................................................ 80
Appendix A General guidance on fatigue analysis of propulsion machinerysubject to ice loads.............................................................................................. 82
1 Cumulative Damage by Palmgren-Miner’s Rule..................................822 Design S-N curve...............................................................................843 Long term stress amplitude distribution due to ice loads...................874 Calculation of the Palmgren-Miner’s damage sum............................. 905 Guidance to when detailed fatigue analysis can be omitted...............92
Changes – historic................................................................................................94
Contents
Class guideline — DNV-CG-0041. Edition September 2021 Page 5Ice strengthening of propulsion machinery and hull appendages
DNV AS
SECTION 1 GENERAL
1 ScopeThis class guideline contains procedures and methods necessary for verification of the load carrying capacity(ultimate and fatigue strength) for the following components in the propulsion plant subject to loads due toice impacts:
— propeller blades, hub and pitch mechanism— shafts— reduction gears— pod/thruster underwater housing.
The assessment of other components together with the general applicability, required safety factors, materialrequirements and design ice loads for the different ice classes are given in DNV-RU-SHIP Pt.6 Ch.6 Sec.3(Northern Baltic ice classes: Ice(1A*F) - Ice(1C)) and DNV-RU-SHIP Pt.6 Ch.6 Sec.7 (polar ice classes:PC(1) to PC(7)). Consequently, this document should be read together with the rules referred to above, inorder to describe all aspects of the strength assessment.
2 ApplicationThe ice loads described in DNV-RU-SHIP Pt.6 Ch.6 Sec.3 and DNV-RU-SHIP Pt.6 Ch.6 Sec.7 are meant tobe total loads, i.e. in general they include the open water hydrodynamic loads (unless otherwise stated).In cases where the calculations described herein result in smaller scantlings than derived from other classrequirements, the latter requirements prevail.The calculation methods specified herein are to some extent prepared based on empirical considerations andstudies of conventional design. This means that they are applicable for 'standard' materials and geometricalshapes within a limited range of geometry and size.Hence, the presented formulae should not be used uncritically for novel designs or be transferred to otherapplications. In principle, other relevant calculation methods may be applied for this purpose.
3 Symbols, nomenclature and unitsSymbols
In addition to the list presented below, the symbols are explained with their first occurrence in the text or anequation.
ā = S-N curve parameter, log(ā) is the intercept of the log(N) axisCP = controllable pitchd = minimum shaft diameter at considered notch, in mmD = propeller diameter, in mdi = inner diameter of shaft at considered notch, in mmFb = maximum backward blade force for the ship’s service life, in kNFex = ultimate blade load resulting from blade loss through plastic bending, in kNFf = maximum forward blade force for the ship’s service life, in kNh0 = depth of the propeller centreline from lower ice waterline, in mHice = thickness of maximum design ice block entering the propeller, in mI = number of different load magnitudes (load blocks) considered in Palmgren-Miner’s usage
factor/'damage sum'k = weibull shape parameter
Section 1
Class guideline — DNV-CG-0041. Edition September 2021 Page 6Ice strengthening of propulsion machinery and hull appendages
DNV AS

LIWL = lower ice waterline, in mm = slope parameter for SN curve in log/log scaleMbl = blade bending moment, in kNmMCR = maximum continuous ratingMDR = miner’s accumulated fatigue damage ration = propeller rotational speed, in rev./sni(τv ice) = number of cycles with a constant stress amplitude τv iceNice = mumber of load cycles in ice load spectrumNi(τv ice) = mumber of cycles to failure due to the constant stress amplitude τv iceqw = weibull scale parameter, in NmR = propeller radius, in mS = safety factorT = torque, in NmT0 = torque at maximum continuous power in bollard condition, in NmTaverage = average torque during an ice milling sequence, in NmThb = maximum backward propeller ice thrust for the ship’s service life, in kNThf = maximum forward propeller ice thrust for the ship’s service life, in kNThr = maximum response thrust along the shaft line, in kNTpeak = highest response peak torque in the shaft due ice impacts on propeller, in Nm (probability for
exceeding = 1/Z · Nice)TA = response torque amplitude on the shaft during a sequence of ice impacts on the propeller, in NmTA max = highest response torque amplitude on the shaft during a sequence of ice impacts on the
propeller, in Nm (probability for exceeding = 1/Z· Nice)Wt = cross section modulus torsion, in mm3 = polar moment of inertia divided by distance to the
surfaceZ = number of propeller bladesαt = geometrical stress concentration factor, torsionΔσmax = maximum dynamic stress range, difference in maximum backward bending stress and maximum
forward bending stress, in MPaη = Palmgren-Miner’s usage factor/'damage sum'σAmax = maximum dynamic stress amplitude, in MPa
σAmax = (∆σmax / 2)σFat‐E7 = high cycle mean bending fatigue strength - 107 load cyclesσmean = mean stress, in MPaσref = reference stress, in MPa
σref = 0.6 · σ0.2 + 0.4 · σuσref 2 = reference stress, in MPa
σref2 = 0.7 · σuor
σref2 = 0.6 · σ0.2 + 0.4 · σu whichever is lessσu = ultimate tensile strength of blade material, in MPaσy = minimum specified yield strength of shaft material, in MPaτ = nominal mean torsional stress at any load (or r.p.m.), in MPa
Section 1
Class guideline — DNV-CG-0041. Edition September 2021 Page 7Ice strengthening of propulsion machinery and hull appendages
DNV AS

τv ice = nominal torsional stress on the shaft caused by τv ice, in MPaτv ice max = nominal torsional stress on the shaft caused by τv ice max, in MPaτvHC = permissible high cycle (= 3 · 106 cycles) torsional vibration stress amplitude, in MPaτvLC = permissible low cycle (= 104 cycles) torsional vibration stress amplitude, in MPaτy = yield strength in shear of shaft material, in MPa (= minimum specified σy/√3). S
ection 1
Class guideline — DNV-CG-0041. Edition September 2021 Page 8Ice strengthening of propulsion machinery and hull appendages
DNV AS

SECTION 2 PROPELLER BLADES
1 Ice interaction load modelsThe design loads described in the rules and listed in Table 1 are maximum lifetime forces on a propellerresulting from propeller/ice interaction, including hydrodynamic loads.The methodology presented here is an approach to be more in accordance with the actual, physical contactbetween propeller and ice. It covers conventional propeller design not limited to a certain blade skew angle.The background for the ice loads is a combination of ice model tests, full scale measurements and theSociety's long service experience with ice classed vessels.The requirements for concentrated ice loads affecting the blade tips and edges have been removed fromthese guidelines and will give a unique opportunity for the designers to optimise the blade edges and profilesindividually. It is however necessary, during design of blades, to take into consideration the blade edgesimpact strength to avoid local indentations of the edges. This can be done with either old methods or evenbetter with FEA and local ice pressures on the propeller blade edge and tip. See [3].
Table 1 Ice interaction loads
Load Definition Use of the load in design process
Qsmax The maximum lifetime spindle torque on a propellerblade resulting from propeller/ice interaction, includinghydrodynamic loads on that blade.
In designing the propeller strength, the spindletorque is automatically taken into accountbecause the propeller load is acting on theblade as distributed pressure on the leadingedge or tip area.
Thb The maximum lifetime thrust on propeller (all blades)resulting from propeller/ice interaction. The direction ofthe thrust is the propeller shaft direction and the force isopposite to the hydrodynamic thrust.
Is used for estimation of the responsethrust Thr. Thb can be used as an estimateof excitation for axial vibration calculations.However, axial vibration calculations are notrequired by the rules.
Thf The maximum lifetime thrust on propeller (all blades)resulting from propeller/ice interaction. The direction ofthe thrust is the propeller shaft direction acting in thedirection of hydrodynamic thrust.
Is used for estimation of the responsethrust Thr. Thf can be used as an estimateof excitation for axial vibration calculations.However, axial vibration calculations are notrequired by the rules.
Tmax The maximum ice-induced torque resulting frompropeller/ice interaction on one propeller blade, includinghydrodynamic loads on that blade.
Is used for estimation of the response torque(Tr(t)) along the propulsion shaft line and asexcitation for torsional vibration calculations.
Fex Ultimate blade load resulting from blade loss throughplastic bending. The force that is needed to cause totalfailure of the blade so that plastic hinge is caused tothe root area. The force is acting on 0.8R. Spindle armshall be taken as 1/3 of the distance between the axis ofblade rotation and leading/trailing edge (whichever is thegreater) at the 0.8R radius.
Blade failure load is used to dimension theblade bolts, pitch control mechanism, propellershaft, propeller shaft bearing and trustbearing. The objective is to guarantee thattotal propeller blade failure should not causedamage to other components.
Tr(t) Maximum response torque along the propeller shaftline, taking into account the dynamic behaviour of theshaft line for ice excitation (torsional vibration) andhydrodynamic mean torque on propeller.
Design torque for propeller shaft linecomponents.
Section 2
Class guideline — DNV-CG-0041. Edition September 2021 Page 9Ice strengthening of propulsion machinery and hull appendages
DNV AS

Load Definition Use of the load in design process
Thr Maximum response thrust along shaft line, taking intoaccount the dynamic behaviour of the shaft line for iceexcitation (axial vibration) and hydrodynamic mean thruston propeller.
Design thrust for propeller shaft linecomponents.
Figure 1 Ice loads acting on propeller
The direction of the forces is perpendicular to the plane defined by the generatrix and the 0.7R chord line.Homogenous surface pressure is applied over the part of the blade as specified for the various load casesin Table 2 and Table 3. Because the propeller blade is a curved 3-D shape the force resulting from ahomogenous pressure, Fresult may act in a somewhat different direction than perpendicular to the planedefined by the propeller generatrix and 0.7R chord line.Hence the surface pressure shall be scaled so that the component of the resulting force perpendicular tothe plane defined by the generatrix and 0.7R chord line equals the design load as derived from formulae inthe DNV-RU-SHIP Pt.6 Ch.6 Sec.3 [15.8] and DNV-RU-SHIP Pt.6 Ch.6 Sec.7 [11.3] and DNV-RU-SHIP Pt.6Ch.6 Sec.7 [11.4]. Hence, the resulting force from the ice pressure, Fresult may be somewhat larger than thedesign ice load but the difference will normally not be very large.
This is illustrated in the example for Fb in Figure 1.Table 2, Table 3 and Table 4 give the extreme loads a propeller operating in ice is expected to encounter. Theload cases 1-5 are given by the rules and are only reproduced here for convenience.
Section 2
Class guideline — DNV-CG-0041. Edition September 2021 Page 10Ice strengthening of propulsion machinery and hull appendages
DNV AS

Table 2 Ice loads on leading edge and tip region – backward bending
Backward bending force - FbUse of the load inthe design process
Fb
The maximum lifetime backward force on a propeller blade resultingfrom propeller/ice interaction, including hydrodynamic loads on thatblade. The direction of the force is perpendicular to 0.7R chord line.See Figure 1.
Design force for strengthcalculation of the propellerblade.
Load case 1
Open propeller Uniform pressure applied on the back of the blade (suction side) toan area from 0.6R to the tip and from the leading edge to 0.2 timesthe chord length.
Pressure corresponding to Fb.
Ducted propeller Uniform pressure applied on the back of the blade (suction side) toan area from 0.6R to the tip and from the leading edge to 0.2 timesthe chord length.
Pressure corresponding to Fb.
Load case 2
Open propeller Uniform pressure applied on the back of the blade (suction side) onthe propeller tip area outside 0.9R radius.Pressure corresponding to 50% of Fb.
Section 2
Class guideline — DNV-CG-0041. Edition September 2021 Page 11Ice strengthening of propulsion machinery and hull appendages
DNV AS

Figure 2 Backward bent blade trailing edge tip resulting in too heavy pitch and loss of propulsionuntil temporarily repaired
Table 3 Ice loads on leading edge and tip region – forward bending
Forward bending force - FfUse of the load inthe design process
Ff
The maximum lifetime forward force on a propeller blade resultingfrom propeller/ice interaction, including hydrodynamic loads on thatblade. The direction of the force is perpendicular to 0.7R chord line.See Figure 1.
Design force for calculation ofstrength of the propeller blade.
Load case 3
Openpropeller
Uniform pressure applied on the blade face (pressure side) to anarea from 0.6R to the tip and from the leading edge to 0.2 times thechord length.
Pressure corresponding to Ff
Section 2
Class guideline — DNV-CG-0041. Edition September 2021 Page 12Ice strengthening of propulsion machinery and hull appendages
DNV AS

Forward bending force - FfUse of the load inthe design process
Ductedpropeller
Uniform pressure applied on the blade face (pressure side) to anarea from 0.6R to the tip and from the leading edge to 0.5 times thechord length.
Pressure corresponding to Ff.
Load case 4
Openpropeller
Uniform pressure applied on propeller face (pressure side) on thepropeller tip area outside 0.9R radius.Pressure corresponding to 50% of Ff.
Table 4 Ice loads on trailing edge – forward or backward bending
Load case 5
Open propeller 60% of Ff orFb, whichever isgreater.
Uniform pressure applied on propeller face(pressure side) to an area from 0.6R to the tipand from the trailing edge to 0.2 times the chordlength.
Section 2
Class guideline — DNV-CG-0041. Edition September 2021 Page 13Ice strengthening of propulsion machinery and hull appendages
DNV AS

Load case 5
Ductedpropeller
60% of Ff orFb, whichever isgreater.
Uniform pressure applied on propeller face(pressure side) to an area from 0.6R to the tipand from the trailing edge to 0.2 times the chordlength.
2 Finite element analysis
2.1 FE modelThe requirement for the finite element model is that it is able to represent the complex curvilinear geometryand the thickness variation of the blade, in order to represent the complex three-dimensional stress stateof the structure and to predict the local peak stresses needed to assess the fatigue strength of the structurewith acceptable accuracy. The load of the propeller blade is dominated by bending, leading to non-constantstress distribution over the thickness of the blade. Local details such as anti-singing edges etc. are normallyexcluded.
2.2 FE engineering practiceThe use of solid elements is highly recommended for determining the stress distribution of the propellerblades. The use of a very dense parabolic tetrahedron mesh is recommended (see Figure 4). Parabolichexahedron solid elements may also be used, but hexahedra require considerable greater modelling effort.Linear elements and, especially linear tetrahedrals should not be used in the stress analysis.Well shaped elements are a prerequisite for the stress analysis. The element density should capture stressgradients and good element shape is important in the most loaded areas. It is recommended to show thatthe solution is independent of the mesh density.Additional geometric details such as root fillet (see Figure 3) may be modelled however these tend toincrease the complexity of the calculation and make it very heavy. This also applies for bolt holes etc. for CPpropellers where it is recommended to do such studies separate from the propeller blade analysis but with acheck of eventual interaction.
Section 2
Class guideline — DNV-CG-0041. Edition September 2021 Page 14Ice strengthening of propulsion machinery and hull appendages
DNV AS

Figure 3 Root fillet of a propeller blade included in the lower blade profiles
A practical workaround would be to model the actual shape of the root fillet included in the sectionalgeometry of the blade and extend these cylindrical sections inside the propeller hub radius and then neglectthe stress concentrations at the boundary connection.
Figure 4 A typical parabolic tetrahedron mesh of a propeller blade
Section 2
Class guideline — DNV-CG-0041. Edition September 2021 Page 15Ice strengthening of propulsion machinery and hull appendages
DNV AS
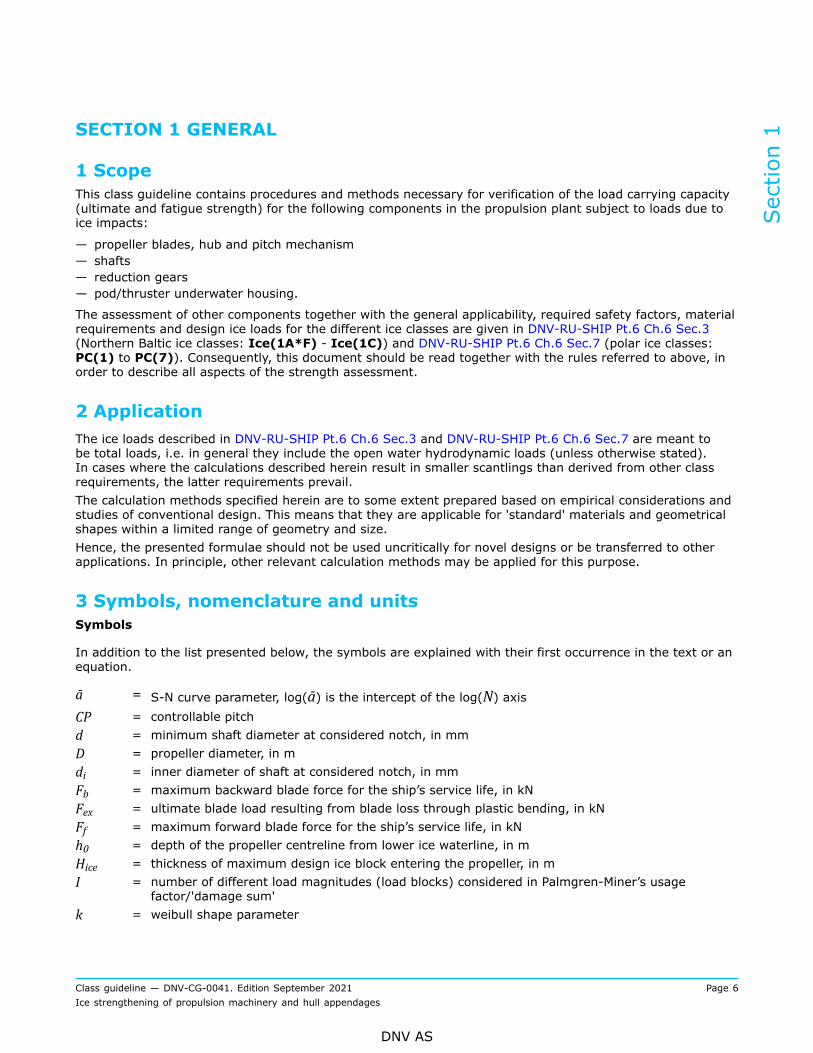
The modelling of the tip region is difficult. Thus, it is allowed, for example, to finish discretisation atthe 0.975R cylindrical section and to make an artificial chord at the tip. In areas where mesh quality isunimportant is it acceptable to use highly skewed elements as these surfaces are only utilized for applicationof load/pressure.
Figure 5 Typical thickness mesh
Where high bending stress occurs is it important to have at least 3-4 elements through the blade thicknessas shown in Figure 5.
2.3 Boundary conditionsThe boundary conditions of the blade model should be given at an adequate distance from the peak stresslocation in order to ensure that the boundary condition has no significant effect on the calculated stress inareas of interest.
2.4 Applied pressure loadsThe pressure loads applied on the finite element model can be given either in the normal direction of thecurved blade surface or alternatively as a directional pressure load. The normal pressure approach leads toa loss of the net applied transversal load as a result of highly curved surface near the edges of the propellerblade. The surface pressure shall be scaled so that the resulting force in the perpendicular (normal) directionof the 0.7R chord line equals the design ice load as derived from formulae in the rules. Whichever approachis used, it should be ensured that the total force determined in the particular load case is applied on themodel. In the normal pressure case, this can be by scaling the load or, alternatively, by scaling the resultingstresses. See Figure 6 and Figure 7.
Section 2
Class guideline — DNV-CG-0041. Edition September 2021 Page 16Ice strengthening of propulsion machinery and hull appendages
DNV AS

Figure 6 One possible way to apply the pressure load to the propeller blade. If the pressure loadis given in the normal direction of the highly curved blade surface, the resulting net applied loadwill be less than the intended load and should be scaled appropriately
Section 2
Class guideline — DNV-CG-0041. Edition September 2021 Page 17Ice strengthening of propulsion machinery and hull appendages
DNV AS

Figure 7 Second alternative: If the pressure load is given in a fixed direction the net applied loadis directly the intended load
2.5 Choice of areas for further fatigue analysisThe relevant areas of an FE analysed blade would be where the stress range is largest for the completelifetime of the propeller i.e. between the backward load, Fb and the forward load, Ff.
Section 2
Class guideline — DNV-CG-0041. Edition September 2021 Page 18Ice strengthening of propulsion machinery and hull appendages
DNV AS
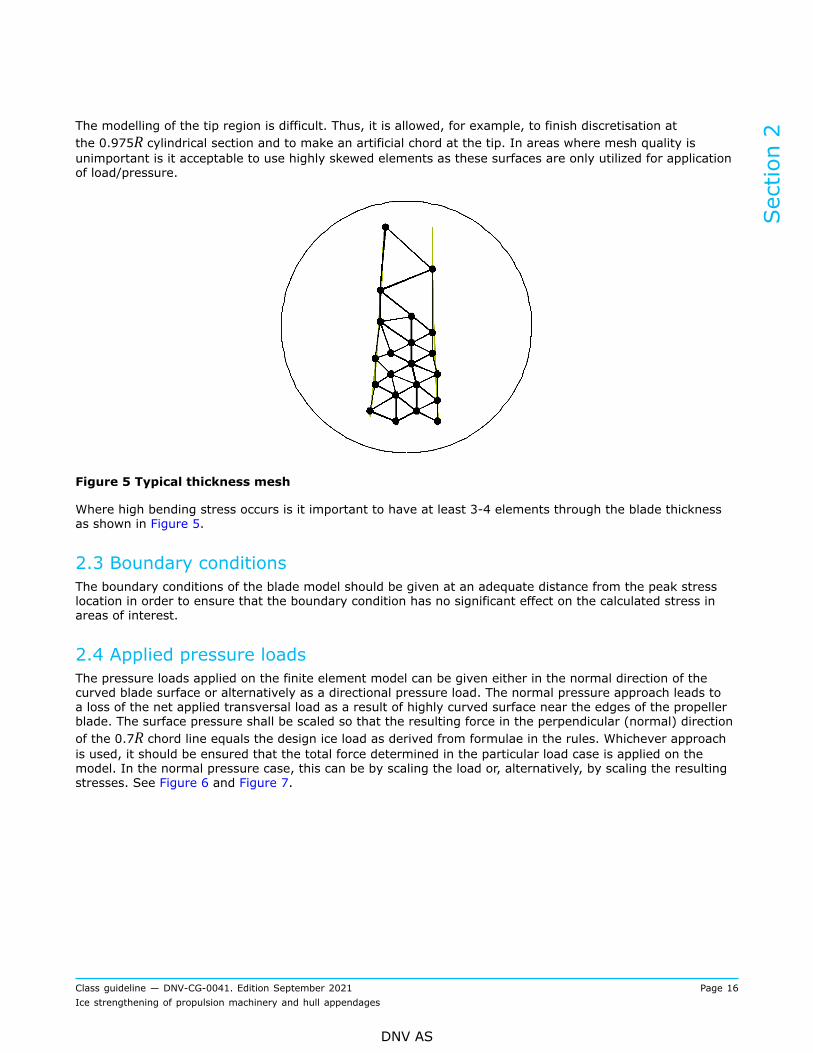
Figure 8 Typical arrangement of compared results: Top left- Max Principal- Ff, Top center -MaxPrincipal-Fb Bottom left-Min Principal-Ff, Bottom center-Min Principal-Fb Top right-von Mises-Ff,Bottom right – von Mises-Fb
The stresses compared should be Max-Min principal stresses for Ff and Fb respectively. It is important thatthe main principal stress direction is the same in both load cases. This might not be the case in specific areasof unconventional designs (f. ex. highly skewed propellers) where a lot of torsion occurs. There are in manyFE post processors features available that creates stress plots with two load cases and by that shows theactual stress range on the model itself.
2.6 Blade tip and edge strengtheningThe requirements for concentrated ice loads affecting the blade tips and edges have been removed fromthe rules and will give a unique opportunity for the designers to optimize the blade edges and profilesindividually. It is however necessary, during design of blades, to take into consideration the blade edgesimpact strength to avoid local indentations of the edges by making blade edges and tips sufficiently strong towithstand contact with multiyear hard blue ice with pressures that may reach 30…40 MPa very locally.This can be done with either old methods or even better with FEA and local ice pressures on the propellerblade edges and tips applying local ice loads depending on considered local area on the relevant blade edgeand tip regions. Ice force as a function of considered area may be found as for pod/thruster structures, seeSec.7 [1.2].
Section 2
Class guideline — DNV-CG-0041. Edition September 2021 Page 19Ice strengthening of propulsion machinery and hull appendages
DNV AS

Figure 9 Blade tip and edge stress
Section 2
Class guideline — DNV-CG-0041. Edition September 2021 Page 20Ice strengthening of propulsion machinery and hull appendages
DNV AS

3 Propeller blade strength assessmentThe propeller blade shall be assessed for both fatigue and static loading. The Palmgren-Miner damage theoryand the S-N curve will be restricted for stresses exceeding σref2 / 1.5.A cumulative load spectrum is distributed utilizing the Weibull method for the corresponding σAmax based onthe FEA for selected position(s) on the blade where the stress range (Ff vs. ΔσmaxFb) is largest.
3.1 Propeller materials fatigue strength, S-N curveMaterials fatigue endurance has mainly been found from literature. However the majority of these testswere conducted several decades ago. The values presented in Table 5 are strictly 'mean fatigue strengthvalues' at 107 cycles and shall not be directly compared to the values given in DNV-RU-SHIP Pt.4 Ch.5 Sec.1Table 4. The values in Table 5 are not containing any uncertainties which need to be taken into considerationseparately.
Table 5 High cycle mean fatigue strengths
Bronze and brass (a=0.10) Stainless steel (a=0.05)
Mn-Bronze, CU1 (high tensile brass) 80 MPa Ferritic (12Cr 1Ni) 120 MPa
Mn-Ni-Bronze, CU2 (high tensile brass) 80 MPa Martensitic (13Cr 4Ni/13Cr 6Ni) 150 MPa
Ni-Al-Bronze, CU3 120 MPa Martensitic (16Cr 5Ni) 165 MPa
Mn-Al-Bronze, CU4 105 MPa Austenitic (19Cr 10Ni) 130 MPa
Alternatively, σFat‐E7 can be defined from fatigue test results from approved fatigue tests at 50% survival probability andstress ratio R = -1, see DNV-RU-SHIP Pt.4 Ch.5 Sec.1 [2.1.1].
Endurance values shall reflect the components actual production methods (casting process, welding, heattreatment etc.), loading patterns (bending vs. tension, shear etc) as well as the materials behaviour ofchanging over time (corrosion etc.). Due to the effect of variable loading with respect of fatigue (stressmemory effects) the S-N curve slope of 4.5 from 107 cycles has been extended to 108 cycles and thereaftercontinues with slope 10. Some more details regarding the establishment of S-N curve are given in DNV-RU-SHIP Pt.6 Ch.6 Sec.7.
3.2 Blade fatigue assessmentThe fatigue assessment can be carried out by means of Palmgren-Miner’s theory either utilizing several loadblocks (I) as in Figure 10, or by a direct integration method. See App.A Figure 10 showing a two-slope S-Ncurve combined with σref 2 limitation, extension of slope 4.5 to E8 cycles and the Weibull load function basedon k = 1.0.
Section 2
Class guideline — DNV-CG-0041. Edition September 2021 Page 21Ice strengthening of propulsion machinery and hull appendages
DNV AS

Figure 10 S-N curve, maximum stress and load spectrum
Maximum dynamic stress range; Δσmax is difference in maximum backward bending stress, σmax b and
maximum forward bending stress, σmax f. The stress amplitude;
Mean stress; σmean should be taken as mean stress due to hydrodynamic propeller load in ice condition(bollard condition).
Figure 11 Time series of blade stresses
Investigations have shown that dividing the stress spectrum into minimum I = 10 load blocks is necessary toavoid too conservative results.
Stress amplitude for block No. i:
Section 2
Class guideline — DNV-CG-0041. Edition September 2021 Page 22Ice strengthening of propulsion machinery and hull appendages
DNV AS

No. of cycles in block No. i:
Where Nice is the total number of ice impacts.
A Miner sum, MDR < 1.0 is sufficient, since safety factors are included in the values for fatigue strength.
The damage rate for a propeller blade can be expressed in the following form:
where:
σAmax = is a constant stress amplitude of the blade due to ice interaction on the propellerni (σAmax) = is the discrete number of cycles with a constant stress amplitude σAmaxNi (σAmax) = is the number of cycles to failure of a constant stress amplitude σAmax based on the
relevant part of the design S-N-curve= degree of cumulative 'damage' of a constant stress amplitude σAmax
I = number of different load magnitudes (load blocks)k = Weibull shape parameter = 0.75 for open propellers and 1.0 for nozzle propellersm = negative inverse slope of the relevant part (for σAmax) of the design S-N curveā = intercept with the log(N) axis of the relevant part (for σAmax) of the design S-N curve.
Section 2
Class guideline — DNV-CG-0041. Edition September 2021 Page 23Ice strengthening of propulsion machinery and hull appendages
DNV AS

4 Blade failure design loads
4.1 Blade failure loadBlade failure load has been applied as one of the main design principles since 1971 in design of propulsionplant pyramidic strength. The blade shall be the weak part and bending of one blade shall not lead tosuccessive damages to hub or shaft, or any other relevant part, such as thrust bearing, or azimuth thrusterstructure or its support.
Figure 12 'Pyramide' or selective strength principal = blade failure before shafting failure
4.2 Calculation of the bent blade scenario with FE analysisDetermination of the blade failure load Fex can either be made by means of a bending beam based equation,or by means of FEA. In both cases the load shall act on genetric axis at 0.8 radius. The load may be givenas a point load, or a pressure load on defined area with centriod at defined load acting point. One ofassumptions is that blade shall bend near root fillet. This is one reason why load is now defined acting at0.8R rather than 0.85 or 0.9R, as has been case in the previous ice rules.It is further assumed that the same load may act on a certain offset of spindle (genetric) axis. Based on aseries of FEA the Society has carried out it has been proven that this load may act at a distance of 1/3 ofdistance between the spindle axis and leading or trailing edge, which ever is greater. If the distance is madelonger a blade starts to deform locally and not as assumed.
4.3 Plastic hinge methodEven if the Society consider plastic bending of the blade over a root section, the Society will accept linearFEA assuming an elastic model. In this respect blade failure load is defined as a force causing von Misesequivalent stresses of 1.5 times σref. Because σref (which is a function of ultimate tensile strength, UTS andyield strength, YS) has been determined experimentally for stainless steel and bronze materials by means ofmeasuring real force needed to bend rectangular test beam 45o and assuming that plastic section modulus is1.5 times ditto elastic, the Society consider this sufficiently proven.
σref can either be determined based on known mechanical properties of the considered section, or on basis ofspecified maximum permissible range of the UTS and YS.
Section 2
Class guideline — DNV-CG-0041. Edition September 2021 Page 24Ice strengthening of propulsion machinery and hull appendages
DNV AS

SECTION 3 PROPELLER HUB AND PITCH MECHANISM
1 Scope and general remarks
1.1 ScopeIn the following it is specified more in detail an acceptable way of assessing the propeller hub and pitchmechanism strength-wise, according to the ice criteria as described in DNV-RU-SHIP Pt.6 Ch.6 Sec.3 andDNV-RU-SHIP Pt.6 Ch.6 Sec.7.
Figure 1 CP propeller failure resulting in too heavy pitch and thus total loss of propulsion
Calculation principles and methodologies are specified, and analytical formulae for stress calculations aregiven as an alternative to more detailed calculations by means of Finite Element Analysis - FEA.
1.2 Considered parts in hub and pitch mechanismThe following calculation method is valid only for crosshead type of pitch mechanism as illustrated in Figure 2and Figure 3. Other types of pitch mechanisms may be assessed on basis of the equivalency principle.
Section 3
Class guideline — DNV-CG-0041. Edition September 2021 Page 25Ice strengthening of propulsion machinery and hull appendages
DNV AS

Figure 2 Illustration of considered parts in hub and pitch mechanism for some design types:
a) servo cylinder in propeller hub with integrated servo piston and cross head, crank pin on crank diskb) servo cylinder in propeller hub with separate servo piston and cross head, crank pin on crank diskc) servo cylinder in shaft line or reduction gear with crank pin on cross headd) close-up of blade fastening and crank disk of mechanism type a) and b).
Figure 3 Typical controllable pitch propeller mechanism (courtesy of Berg Propulsion TechnologyAB)
The following components are considered for mechanical strength:
Section 3
Class guideline — DNV-CG-0041. Edition September 2021 Page 26Ice strengthening of propulsion machinery and hull appendages
DNV AS

— propeller hub with blade carrier bearings (1)— servo cylinder (2), including clamping bolts (3)— blade bolts (4) and shear pins (5)— crank pin (6)— guide block (7)— retaining wall of slot for guide block (8)— push-pull rod, including fitting to cross head (9).
2 Applicable load scenarios
2.1 Propeller blade plastic bending (selective strength or 'pyramid strengthprinciple')A propeller blade exposed to an ice load causing plastic bending of blade shall not lead to significantpermanent deformation in the blade fitting arrangement, propeller hub or pitch mechanism. This means thatthe resulting nominal (excluding local stress concentrations) equivalent (von Mises) tensile stress in each ofthe components shall not exceed the specified minimum yield strength of respective components material(i.e. safety factor against nominal yielding is 1.0, as given in DNV-RU-SHIP Pt.6 Ch.6 Sec.3 and DNV-RU-SHIP Pt.6 Ch.6 Sec.7. See also Sec.2 [4].
For blade bolts and hub (blade carriers) the bending moment resulting from the blade failure load, Fex asdescribed in DNV-RU-SHIP Pt.6 Ch.6 Sec.3 and DNV-RU-SHIP Pt.6 Ch.6 Sec.7 located at the propeller bladespindle axis shall be considered (i.e. no spindle torque is considered).The torsional capacity of the blade fitting (shear pins and friction capacity in blade bolt connection) andcomponents in pitch mechanism shall be considered on basis of the spindle torque Qsex from the eccentricallylocated Fex (see Sec.2 [4.1]).
2.2 Propeller blade force due to maximum ice loadWhen propeller blade is exposed to maximum ice loads (Fb and Ff) as described in DNV-RU-SHIP Pt.6 Ch.6Sec.3 and DNV-RU-SHIP Pt.6 Ch.6 Sec.7 the methodology for assessing blade fitting arrangement, propellerhub and pitch mechanism is the same as in the propeller blade plastic bending case (see also [2.1]), i.e.nominal stresses are compared to yield strength.However, for the maximum ice load case, a safety factor of 1.3 against yielding is required in the DNV-RU-SHIP Pt.6 Ch.6 Sec.3 and DNV-RU-SHIP Pt.6 Ch.6 Sec.7. Safety factor shall be applied on the acting ice load,unless otherwise is explicitly specified.
2.3 Propeller blade forces due to dynamic ice load amplitudesWhen exposed to a spectrum of ice loads derived from the maximum ice loads (Fb and Ff) as described in theice rules, the safety factor against fatigue for the influenced parts in propeller hub and pitch mechanism shallbe at least 1.5, according to Miner’s rule, as required in DNV-RU-SHIP Pt.6 Ch.6 Sec.3 and DNV-RU-SHIP Pt.6Ch.6 Sec.7. Safety factor shall be applied on the acting dynamic ice load amplitudes.The application of ice loads on each component is the same as for the two (static) cases above.
Section 3
Class guideline — DNV-CG-0041. Edition September 2021 Page 27Ice strengthening of propulsion machinery and hull appendages
DNV AS

3 Load transmission
3.1 Transmission of spindle torque into mechanismThe propeller blade spindle torque caused by ice loads acting eccentrically to the spindle axis will betransmitted into the propeller pitch mechanism.However, parts of the spindle torque will be taken up as friction loss due to reaction forces set up in theblade carrier bearings. In the radial bearing, there will be reaction forces due to ice load on propeller blade,and forces on the crank pin. The reduction in loads due to these frictional losses may be accounted for asmentioned herein.
3.2 Geometrical relationsThe geometrical relations between spindle torque and force on crank pin are given as follows:In the case crank pin is fixed in crank disk:
In the case crank pin is fixed in cross head:
where Qcrp is net spindle torque (kNm) transmitted into the mechanism, see [3.3] next chapter, Rcrp (mm) iscrank pin eccentricity and φ (rad) is considered angular position of crank pin (normally same as pitch angle).Note that since Qcrp includes the frictional losses and the specified safety factors, this also applies for Fcrp.
Figure 4 Crank pin in crank disc and in cross head
Section 3
Class guideline — DNV-CG-0041. Edition September 2021 Page 28Ice strengthening of propulsion machinery and hull appendages
DNV AS

Further, the force on crank pin is transmitted into a servo, generating a certain increase in servo pressure. Inthis respect, a direct transformation shall be carried out (i.e. no further internal frictional losses except thosementioned in next chapter shall be accounted for). Servo pressure corresponding to a given force on crankpin is then found as follows:In case crank pin is fixed in crank disk:
In case crank pin is fixed in cross head:
Where Aservo is effective pressurised area of the servo piston (mm2).
3.3 Reduction in transmitted spindle torque due to friction
3.3.1 Bending moments taken up by the blade carrier will cause the following friction torque:
Where Mb is bending moment (kNm) including relevant safety factor and may be taken in the same wayas for the blade bolts (see [5.4]). Dblc is effective blade carrier diameter (mm) carrying the load, Dbfric iseffective friction diameter (mm) and μ is friction coefficient (-). See also Figure 5.For lubricated surfaces, the friction coefficient μ shall be taken as 0.10.Pressure distribution may be assumed to be sinusoidal. Then the relation Dblc/Dbfric equals 4/π.Forces taken up radially by the blade carrier will cause the following friction torque, Qfrf:
Where F is considered radial force (kN) in bearing, including relevant safety factor and Dffric is effectivefriction diameter (mm).
Pressure distribution may be assumed to be sinusoidal. Then Dffric is 4×Diblc/π, where Diblc is innerdiameter (mm) of blade carrier (blade thrust) bearing. See also Figure 5.Compared to the frictional forces generated by the ice loads, the contribution from centrifugal forces isnormally relatively small and shall be neglected for safety and simplicity. This will contribute to predictedcrank pin forces somewhat more to the safe side, in particular for the high cycle loads.Note that the ice loads specified in the rules include contribution from hydrodynamic propeller load, whenapplicable, and hence no separate friction loss shall be calculated for the hydrodynamic propeller load.
Section 3
Class guideline — DNV-CG-0041. Edition September 2021 Page 29Ice strengthening of propulsion machinery and hull appendages
DNV AS

3.3.2 Spindle torque transferred into crank pinNet spindle torque transferred into the pitch mechanism (crank pin), Qcrp shall be taken as Qcrp = Qsp - Qfr1(kNm) where Qsp is the considered blade spindle torque (kNm), including the specified safety factor, Qfr1(kNm) is the sum of relevant friction torque reductions due to blade carrier loads, i.e. Q fr1 = Qfrb + Qfrf(kNm).
3.3.3 Spindle torque for evaluation of blade flange/crank disk connectionWhen considering the transfer of spindle torque between the blade flange and the crank disk, the followingnet spindle torque shall be used: Qcrp = Qsp - Qfr1- Qfr2 (kNm) where Qfr2 is the friction torque reductionbetween the blade flange and crank disk due to bolt pretension forces, to be taken as:
Where σbpre is bolt pre-stress (N/mm2) in section with minimum diameter, Dbblt (mm), Nbblt is number ofbolts, and PCD is bolt pitch circle diameter (mm). For non-lubricated surfaces the friction coefficient μ shallbe taken as 0.15 unless otherwise substantiated.
The relevant friction torque reduction, Qfr1 should in this respect only include the friction contribution on theblade flange (not the crank disk). I.e. the following applies:
Where khcr is describing the height ratio between blade flange part of radial bearing and total radial bearingheight. I.e. if only blade flange has a radial bearing surface, khcr is 1.0, if only crank disk has a radial bearingsurface, khcr is 0.0. For designs as illustrated in Figure 2, khcr would be some 0.5.
3.4 Transmission of blade bending moment into blade carrierAssuming that the peripherical pressure distribution due to a bending moment Mbl follows a sinusoidalrelationship, the maximum pressure at the blade carrier is found from:
Where Bblc is breadth of blade carrier bearing (mm). See also Figure 5.Section 3
Class guideline — DNV-CG-0041. Edition September 2021 Page 30Ice strengthening of propulsion machinery and hull appendages
DNV AS

Figure 5 Illustration of blade carrier and blade bearing
3.5 Transmission of force into blade carrierAssuming that the peripherical pressure distribution due to a force also follows a sinusoidal relationship, themaximum radial pressure at the blade carrier is found from:
Where Tblc is thickness of blade carrier bearing (mm). See also Figure 5.
3.6 Transmission of load between crank pin and retaining wall for guideblockThe ice loads from the blade are transferred by means of pressure from the crank disk to the crosshead, viathe guide block. These components deflect when loaded. This influences on the pressure distribution andhence, the pressure distribution at the contact surfaces deviates from the nominal pressure. This applies inparticular when the loading is high. The skewed pressure distribution changes the effective point of reactionfor the transmitted force, as well as introduces local strains and stresses.
Section 3
Class guideline — DNV-CG-0041. Edition September 2021 Page 31Ice strengthening of propulsion machinery and hull appendages
DNV AS
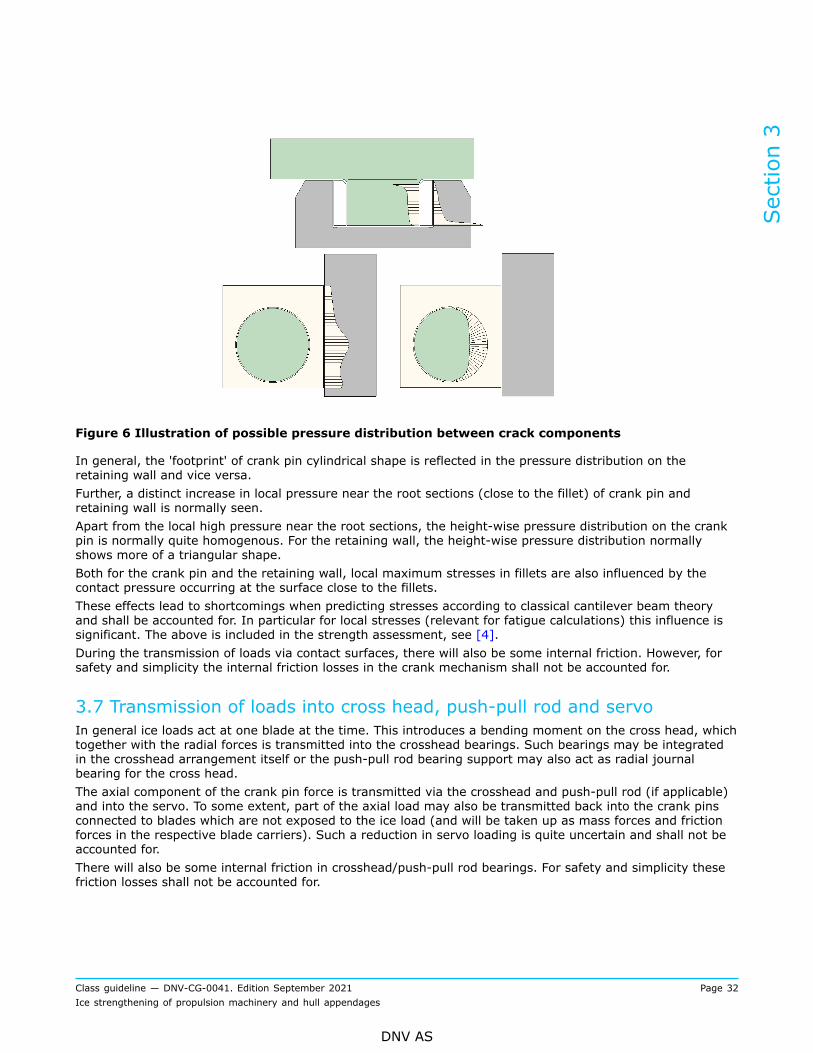
Figure 6 Illustration of possible pressure distribution between crack components
In general, the 'footprint' of crank pin cylindrical shape is reflected in the pressure distribution on theretaining wall and vice versa.Further, a distinct increase in local pressure near the root sections (close to the fillet) of crank pin andretaining wall is normally seen.Apart from the local high pressure near the root sections, the height-wise pressure distribution on the crankpin is normally quite homogenous. For the retaining wall, the height-wise pressure distribution normallyshows more of a triangular shape.Both for the crank pin and the retaining wall, local maximum stresses in fillets are also influenced by thecontact pressure occurring at the surface close to the fillets.These effects lead to shortcomings when predicting stresses according to classical cantilever beam theoryand shall be accounted for. In particular for local stresses (relevant for fatigue calculations) this influence issignificant. The above is included in the strength assessment, see [4].During the transmission of loads via contact surfaces, there will also be some internal friction. However, forsafety and simplicity the internal friction losses in the crank mechanism shall not be accounted for.
3.7 Transmission of loads into cross head, push-pull rod and servoIn general ice loads act at one blade at the time. This introduces a bending moment on the cross head, whichtogether with the radial forces is transmitted into the crosshead bearings. Such bearings may be integratedin the crosshead arrangement itself or the push-pull rod bearing support may also act as radial journalbearing for the cross head.The axial component of the crank pin force is transmitted via the crosshead and push-pull rod (if applicable)and into the servo. To some extent, part of the axial load may also be transmitted back into the crank pinsconnected to blades which are not exposed to the ice load (and will be taken up as mass forces and frictionforces in the respective blade carriers). Such a reduction in servo loading is quite uncertain and shall not beaccounted for.There will also be some internal friction in crosshead/push-pull rod bearings. For safety and simplicity thesefriction losses shall not be accounted for.
Section 3
Class guideline — DNV-CG-0041. Edition September 2021 Page 32Ice strengthening of propulsion machinery and hull appendages
DNV AS
4 Strength assessment
4.1 Static strengthThe load conditions referred to in [2.1] (blade failure load) and [2.2] (maximum ice loads) shall beconsidered as static load cases. That means that the strength assessment is carried out directly against theloads, including the safety factors specified in DNV-RU-SHIP Pt.6 Ch.6 Sec.3 and DNV-RU-SHIP Pt.6 Ch.6Sec.7.For these load cases, the 'worst condition' assumption applies, since the loads in principle may apply in anyoperating condition. For the static strength assessment this means that propeller pitch angle shall be chosenas the one giving highest loads in the components.In case crank pin is located in cross head this means that pitch angle shall correspond to crank pin in zeroangle position (normally, this equals the geometrical zero pitch position).With the crank pin located in the crank disk, maximum operational pitch angle for ice operation shall bechosen. If not otherwise is substantiated, a pitch angle corresponding to 70% of pitch at ahead free running,MCR shall be used.In case the design pressure is lower than the pressure corresponding to blade failure load, the mechanismshall additionally be checked in a pitch condition corresponding to mechanical stop. The same applies if reliefvalve arrangement is only provided on the pump side of the directional valves.
4.2 Dynamic strengthThe load conditions referred to in [2.3] (dynamic loads) shall be assessed according to fatigue criteria asdescribed in the following sub-sections. In general, such loads will accumulate under all possible ice operatingconditions, and hence under varying pitch angles.However, in order to simplify the calculations, the complete fatigue assessment shall be carried out for onereference pitch setting:
— in case crank pin is located in crank disk a pitch angle corresponding to 60% of pitch at ahead freerunning, MCR shall be used
— in case crank pin is located in cross head a pitch angle corresponding to 40% of pitch at ahead freerunning, MCR shall be used.
4.3 Cumulative fatigue calculationThe hub and pitch mechanism shall be designed to prevent accumulated fatigue when considering loads asdescribed in DNV-RU-SHIP Pt.6 Ch.6 Sec.3 and DNV-RU-SHIP Pt.6 Ch.6 Sec.7.There are locations at the components in the hub and pitch mechanism where dynamic stresses due to iceloads are significantly higher than in the surrounding material. These stress risers, such as notches or filletsforming the transition between different shapes, are critical w.r.t. fatigue strength.The same may apply to welded parts, where fatigue strength is reduced due to the welding.
In case local stresses at maximum load exceeds yield strength (σy or σ0.2) or 70% of the ultimate tensilestrength (σu) sufficient margin against accumulated fatigue shall be documented using the linear elasticMiner’s rule.
The stress spectrum should be divided into minimum I = 10 blocks. A lower number of blocks is tooconservative, whereas increasing the number of blocks beyond I = 20 blocks will not reduce the calculatedfatigue damage significantly.
Section 3
Class guideline — DNV-CG-0041. Edition September 2021 Page 33Ice strengthening of propulsion machinery and hull appendages
DNV AS

Miner’s rule sum up damage fractions, ni / Ni, where ni and Ni are respective occurring and allowablenumber of cycles for the load level (stress block) in question (according to the material SN diagram – seealso [6.2]). Hence the total fatigue damage is given by the Miner sum, MDR (-):
A Miner sum, MDR < 1.0 is sufficient, since safety factors are included in the ice loads and load level foreach block is chosen conservatively.No. of cycles in block No. i:
Where Zice equals number of propeller blades in case the considered component accumulates ice loads fromall blades (for instance push-pull rod). Otherwise Zice = 1. Further, k is the Weibull shape parameter = 0.75for open propellers and 1.0 for nozzle propellers, and Nice is the number of ice impacts (-) experienced bythe propeller blade during its life time, as defined in DNV-RU-SHIP Pt.6 Ch.6 Sec.3 and DNV-RU-SHIP Pt.6Ch.6 Sec.7. The formulation is conservative, because each block refers to the nearest load level above.
4.4 Fatigue stress amplitudeThe propeller blade ice spindle torque variation spectrum follows a Weibull distribution. However, the relationbetween load and corresponding stress in parts of the pitch mechanism components is not necessarily strictlylinear. This is due to deflections in the mechanism and frictional effects. In the calculation model describedherein, this is neglected, and the calculation models are chosen in order to be representative for typical loadsituations contributing to fatigue damage.Hence, a Weibull distribution for acting stress is assumed as a simplification, and fatigue stress amplitude forblock No. i shall be taken as:
Stress concentration factors, Kt are discussed in subsequent sub-sections for each component.
5 Stress in components of CP-Mechanism
5.1 Stress calculation in general5.1.1 Static stressFormulae for nominal equivalent static stresses are given for each of the components in the sub-sectionsbelow.
Section 3
Class guideline — DNV-CG-0041. Edition September 2021 Page 34Ice strengthening of propulsion machinery and hull appendages
DNV AS

5.1.2 Dynamic stress amplitude/mean stressMaximum dynamic stress range, Δσmax (N/mm2) is defined as the difference in component stress when bladeis exposed to maximum backward load (Fb) and maximum forward load (Ff) for components that will beinfluence by load in both directions.For components influenced by load in only one direction (retaining wall) maximum backward load ormaximum forward load is taken as zero (whichever is less critical).
The maximum stress amplitude σAmax = Δσmax/2 (N/mm2) corresponds to the 'once in a life time' ice loadsituation. For stress range/amplitude distribution, see [4].
Mean stress, σmean (for determination of reduction in fatigue strength due influence of mean stress, Kmean,see [6.2]) shall be taken as a constant = stress due to hydrodynamic propeller load in ice condition (withoutreduction for friction loss in blade bearings), except for components influenced by load in only one direction(retaining wall) where mean stress shall be taken equivalent to the stress amplitude plus stress fromhydrodynamic propeller load in ice condition.The above is a simplification, since the number of cycles related to backward and forward blade load is notnecessarily the same. However due to the conservatism built into the calculation method in total, results willbe somewhat on the safe side.For some components (mainly the retaining wall), the maximum stresses will occur at somewhat differentlocations, depending on pitch angle. However, as the fatigue calculation is carried out for one reference pitchsetting this shall not be accounted for, unless it is substantiated that it will have significant influence on thepredicted Miner sum.Formulae for principal dynamic stresses, including geometrical stress concentration factors, are given foreach of the components in the following sub-sections.Stress concentration factors for short beams have in general been derived from the book Stressconcentration factors by R.E. Peterson (1973). Corrections to these formulations have been done on basis offinite element calculations and empirical studies.
5.2 Propeller hub/blade carrier bearing
5.2.1 For the propeller hub, only the blade carrier bearings need to be documented for sufficient strengthdue to ice loads. However, this does not discharge the designer to ensure that the complete propeller hub isdesigned with sufficient strength and rigidity to withstand the ice loads.The blade carrier bearing is exposed to bending and shear due to the bearing pressure when the bearing iscarrying the blade bending moment from the ice loads.A sector strip of the bearing in way of the highest pressure shall be considered. For prediction of bendingstresses, the reaction point of the resulting force acting on the bearing may be assumed to be in the centreof the considered surface.
5.2.2 Static stress (yielding)In order to comply with yielding requirements, a prediction of nominal equivalent static stress, σeblc shall becarried out. The combined effect of bending, compression and shear on the bearing shall be considered:
Where pressure distribution correction factor, βcblc, bending stress, σbblc, and shear stress, τblc, are takenfrom the following formulae:
Section 3
Class guideline — DNV-CG-0041. Edition September 2021 Page 35Ice strengthening of propulsion machinery and hull appendages
DNV AS

Where pbblcmax, Bblc and Tblc are as defined in [3].
5.2.3 Dynamic stressIn order to predict the maximum principal stress for fatigue calculation, σpblc, it is relevant to consider theinfluence of (short beam) bending. Hence, σpblc should be taken as for σbblc above.Influence from stress concentration and local compression should be represented in fatigue calculations bythe total geometrical stress concentration factor Kt = βcblc · αbblc as described in [6.2]. In this respect, βcblcshall be taken as for the static stress case and αbblc is geometrical (short beam) stress concentration inbending in the bearing notch.The following empirical formulae applies, unless otherwise substantiated:U shaped notch for O-ring:
Shoulder Fillet:
Where rfblc is radius of bearing fillet.The first part in the stress concentration formulae above represents the stress concentration factor in purebending for flat bar with U-notch / shoulder fillet, respectively, whereas the second part includes the shortbeam correction.
5.3 Servo cylinder including clamping bolts
5.3.1 The servo cylinder with clamping bolts need normally be assessed only according to static strengthcriteria.
Section 3
Class guideline — DNV-CG-0041. Edition September 2021 Page 36Ice strengthening of propulsion machinery and hull appendages
DNV AS

5.3.2 Static stress servo cylinder/design pressureIn order to comply with yielding requirements, a prediction based on nominal equivalent static stress notexceeding yield stress shall be carried out. I.e. the cylinder minimum thickness, tcyl shall comply with:
Where pservo is servo pressure (bar) as defined in [3.2] or design pressure, whichever is higher, Dcyl is servocylinder outer diameter (mm) and Kshape is factor for increased stress due to shape of dished end.Unless otherwise is substantiated, Kshape shall be taken according to the following empirical formulae for thecurved part of the cylinder:
Where Hcyl is height of curved part of servo cylinder (see Figure 7). Hcyl needs not to be taken less than0.1Dcyl.Kshape shall not be taken less than 1.0.For the cylindrical part of servo cylinder, Kshape is 1.0.
Figure 7 Illustration of curved height of cylinder – two examples
Design pressure of the pitch mechanism system shall be taken as given in DNV-RU-SHIP Pt.6 Ch.6 Sec.7[12.4.6]
5.3.3 Static stress cylinder clamping boltsIn order to comply with yielding requirements, a prediction based on bolt pretension stress plus additionalnominal bolt stress due to pressure in servo cylinder shall be carried out in case servo cylinder is clamped tothe propeller hub.Assuming that the complete force on crank pin is transmitted to the servo, the total clamping bolt stress isfound from:
Section 3
Class guideline — DNV-CG-0041. Edition September 2021 Page 37Ice strengthening of propulsion machinery and hull appendages
DNV AS

Where σcpre is pre-tension stress in minimum section of bolt (N/mm2), Dcblt is minimum section diameterof bolt (mm), ncblt is No. of clamping bolts and kcblt is bolt factor describing part of additional load carriedby the clamping bolts. Unless otherwise is substantiated, kcblt shall be taken as 0.25 / 0.33 in case of steel /bronze material in hub and servo cylinder, respectively.
5.3.4 Separation between hub and cylinderThe bolt pre-stress shall be sufficient to prevent separation between the mating surfaces between hub andcylinder when servo pressure corresponds to maximum forward, Ff and backward load Fb. This correspondsto a situation where the compression load in the flanges becomes zero. Hence, bolt pre-tension stress shallas a minimum be:
5.4 Blade bolts and shear pins
5.4.1 The blade bolts and shear pins need normally be assessed only according to static strength criteria.
5.4.2 Static stress of blade boltsThe blade bolt connection shall withstand the blade failure bending moment described in the rules withoutyielding. Stresses in the bolts, σbblt shall be calculated according to the following:
Where σbpre is pre-tension stress in minimum section of bolt (N/mm2), kbblt is bolt factor (-) describingpart of additional load carried by the blade bolts. Unless otherwise is substantiated, kbblt shall be taken asfollows:
Table 1 Blade bolt factors
Blade flange material Crank disk material kbbltBronze Steel 0.30
Bronze Bronze 0.35
Stainless steel Steel 0.25
Stainless steel Bronze 0.30
Section 3
Class guideline — DNV-CG-0041. Edition September 2021 Page 38Ice strengthening of propulsion machinery and hull appendages
DNV AS
In the case that separation between mating surfaces will occur before yielding of bolt
(σybblt is yield strength of bolt material in N/mm2). This is acceptable for the blade failure load, but then kbbltmay be taken as 1.0 and σbpre may be taken as 0.0 in the above formula for bolt stress, σbblt, irrespective ofactual values.
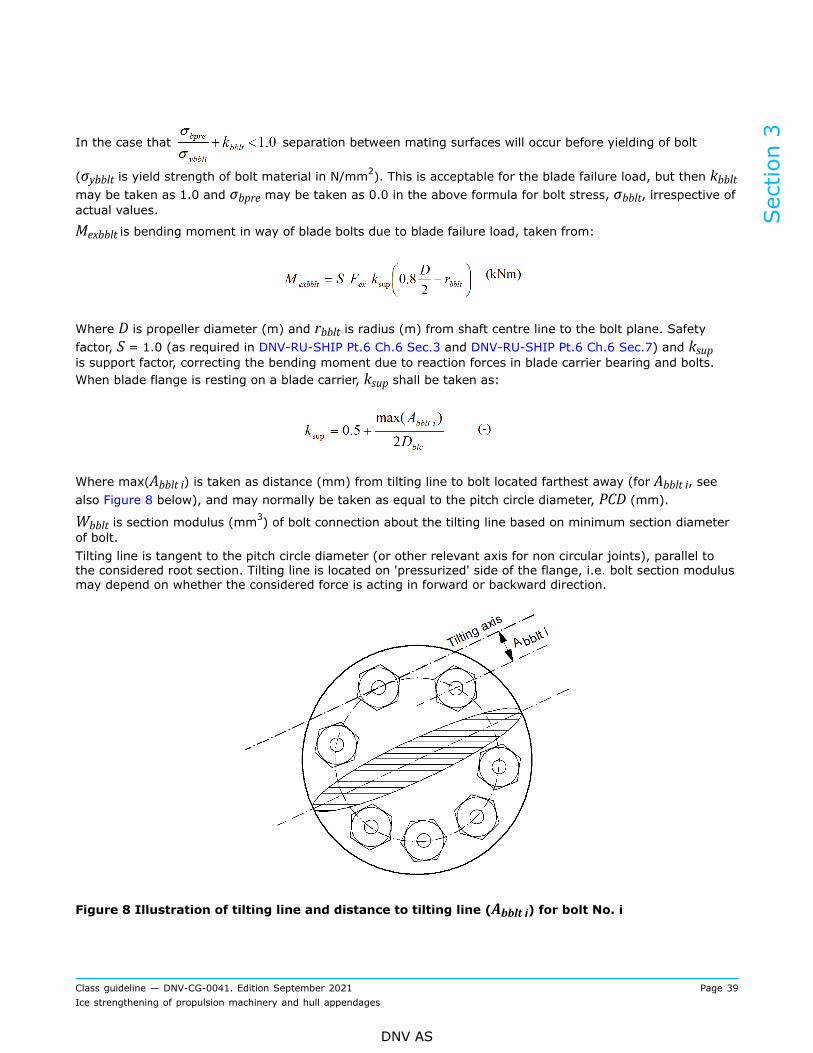
Mexbblt is bending moment in way of blade bolts due to blade failure load, taken from:
Where D is propeller diameter (m) and rbblt is radius (m) from shaft centre line to the bolt plane. Safetyfactor, S = 1.0 (as required in DNV-RU-SHIP Pt.6 Ch.6 Sec.3 and DNV-RU-SHIP Pt.6 Ch.6 Sec.7) and ksupis support factor, correcting the bending moment due to reaction forces in blade carrier bearing and bolts.When blade flange is resting on a blade carrier, ksup shall be taken as:
Where max(Abblt i) is taken as distance (mm) from tilting line to bolt located farthest away (for Abblt i, seealso Figure 8 below), and may normally be taken as equal to the pitch circle diameter, PCD (mm).Wbblt is section modulus (mm
3) of bolt connection about the tilting line based on minimum section diameterof bolt.Tilting line is tangent to the pitch circle diameter (or other relevant axis for non circular joints), parallel tothe considered root section. Tilting line is located on 'pressurized' side of the flange, i.e. bolt section modulusmay depend on whether the considered force is acting in forward or backward direction.
Figure 8 Illustration of tilting line and distance to tilting line (Abblt i) for bolt No. i
Section 3
Class guideline — DNV-CG-0041. Edition September 2021 Page 39Ice strengthening of propulsion machinery and hull appendages
DNV AS

Bolt section modulus for circular location of bolts shall be taken from the following expression:
Where Nbblt is number of blade bolts and Dbblt is minimum section diameter of bolt (mm).
5.4.3 Separation between mating surfacesThe bolt pre-tension stress shall be sufficient to prevent separation between the mating surfaces withmaximum forward, Ff and backward load Fb. This corresponds to a situation where compression load in theflanges becomes zero. Hence, bolt pre-tension stress shall as a minimum be:
Where Micebblt is maximum bending moment due to ice load, taken from:
Where F is maximum forward ice load (kN), Ff or maximum backward ice load, Fb, respectively, rice is radiusform shaft centre to acting ice load (m). Safety factor, S is 1.3, as required in DNV-RU-SHIP Pt.6 Ch.6 Sec.3and DNV-RU-SHIP Pt.6 Ch.6 Sec.7.
5.4.4 Static stress of shear (dowel) pinsDNV-RU-SHIP Pt.6 Ch.6 Sec.7 specify the minimum required diameter for the shear (dowel) pins, in order toavoid shear yield when blade is exposed to maximum ice load and blade failure load.
Formulations for friction torque reductions (Qfr1 and Qfr2) are given in [3.3].Note that the pitch circle diameter referred to in the ice rules (PCD) describes the diametrical location of theshear pins (which may be different from the PCD for the blade bolts).
5.5 Crank pin
5.5.1 Crank pin is exposed to bending and shear, as well as local compression due to pressure from guideblock acting close to the point of maximum bending stress. For prediction of bending stresses, the reactionpoint of the resulting force acting on crank pin may be assumed to be half way up the crank pin.Hence, stress in crank pin shall be taken as described in the following.
5.5.2 Static stress (yielding)In order to comply with yielding requirements, a prediction of nominal equivalent static stress, σecr shall becarried out. The combined effect of bending, compression and shear on the crank pin shall be considered:
Section 3
Class guideline — DNV-CG-0041. Edition September 2021 Page 40Ice strengthening of propulsion machinery and hull appendages
DNV AS

Where pressure distribution correction factor, βccr, bending stress σbcr and shear stress, τcr, are taken fromthe following formulae:
Where Fcrp is force acting on crank pin (kN), Dcr is crank pin diameter (mm) and Hcr is height of crank pin(mm).Additionally, it shall be verified that surface pressure from guide block on crank pin does not exceed yieldstrength. The following formula for surface pressure on crank pin, pcr shall be used.
Where βcr is the peripherical pressure concentration factor (local increase in pressure near the edges of theguide block are not considered). Assuming that the surface pressure has a sinusoidal peripherical distributionover the crank pin, βcr shall be taken as 2.0.In case effective height of guide block is significantly less than height of crank pin (Hcr) due to chamfers orsimilar, a corresponding change in Hcr for calculation purposes shall be done.
5.5.3 Dynamic stress and mean stress (fatigue)In order to predict the maximum principal stress for fatigue calculation, σpcr, it is relevant to consider theinfluence of (short beam) bending. Hence, σpcr should be taken as for σbcr above.The above reflects the assumption that when considering local stresses, it is relevant to distribute the loadover an area corresponding to the crank pin profile.Influence from stress concentration and local compression should be represented in fatigue calculations withthe total geometrical stress concentration Kt = βccr · αbcr , as described in [6.2].Influence of local compression βccr is found as for the static case above, and geometrical (short beam)stress concentration factor αbcr shall be found from the following empirical expression, unless otherwise issubstantiated:
Section 3
Class guideline — DNV-CG-0041. Edition September 2021 Page 41Ice strengthening of propulsion machinery and hull appendages
DNV AS

Where rfcr is crank pin fillet radius (mm).The first part in the stress concentration formula above represents the stress concentration factor in purebending for round bar with shoulder fillet, whereas the second part includes the short beam correction.
5.6 Guide block
5.6.1 The guide block is exposed to compression loads and is normally designed without dominant stressrisers. Hence a static consideration of the surface pressure inside guide block is sufficient.
5.6.2 Static surface pressure (yielding)In order to verify that the surface pressure inside the guide block does not exceed yield strength of material,it is sufficient to calculate nominal surface pressure. This is because some minor compressive deformations inthe guide block are not considered critical for the function of the pitch mechanism.
The following formula shall be used for static nominal surface pressure pgb of guide block:
In case effective height of guide block is significantly less than height of crank pin (Hcrp) due to chamfers orsimilar, a corresponding reduction in Hcrp for calculation purposes shall be done.
5.7 Retaining wall
5.7.1 The retaining wall is exposed to bending and shear, as well as local compression due to pressure fromguide block acting close to the point of maximum bending stress. For prediction of bending stresses, thereaction point of the resulting force acting on retaining wall may be assumed to be at a height 35% up thewall.Hence, stress in retaining wall shall be taken as described in the following.
5.7.2 Static stress (yielding)In order to comply with yielding requirements, a prediction of nominal equivalent static stress, serw shallbe carried out. The combined effect of bending, compression and shear on the retaining wall shall beconsidered:
Where pressure distribution correction factor, βcrw, bending stress σbrw and shear stress, τrw, are taken fromthe following formulae:
Section 3
Class guideline — DNV-CG-0041. Edition September 2021 Page 42Ice strengthening of propulsion machinery and hull appendages
DNV AS

Where trw is thickness of retaining wall (mm) and Bgb is breadth of guide block (mm)The above reflects the assumption that when considering nominal stresses, it is relevant to distribute theload over an area corresponding to the guide block profile.Additionally, it shall be verified that surface pressure from guide block on retaining wall does not exceed yieldstrength. The following formula for surface pressure on retaining wall, prw shall be used.
Where βrw is the height wise pressure concentration factor (local increase in pressure near the edges of theguide block are not considered). Assuming that the surface pressure has a triangular height wise distributionover the crank pin, βrw shall be taken as 2.0.In case effective height of retaining wall is significantly less than height of crank pin (Hcr) due to chamfers orsimilar, a corresponding change in Hcr for calculation purposes shall be done.
5.7.3 Dynamic stress and mean stress (fatigue)In order to predict the maximum principal stress for fatigue calculation, σprw, it is relevant to consider theinfluence of (short beam) bending. Hence, σprw should be taken as follows:
The above reflects the assumption that when considering local stresses, it is relevant to distribute the loadover an area corresponding to the crank pin profile.Influence from stress concentration and local compression should be represented in fatigue calculations bythe total geometrical stress concentration Kt = βcrw · αbrw , as described in [6.2].
Section 3
Class guideline — DNV-CG-0041. Edition September 2021 Page 43Ice strengthening of propulsion machinery and hull appendages
DNV AS

Influence factor for local compression, βcrw shall be taken as for the static case above, whereas the (shortbeam) stress concentration factor, αbrw shall be found from the following empirical expression, unlessotherwise substantiated:
Where rfrw is retaining wall fillet radius (mm).The first part in the stress concentration formula above represents the stress concentration factor in purebending for flat bar with shoulder fillet, whereas the second part includes the short beam correction.
5.8 Push-pull rod
5.8.1 The push-pull rod may include many design features which need to be assessed for the axial load.Depending on the direction of the load and the crank pin arrangement, the push-pull rod may be exposed toboth compression and tension loads.
5.8.2 Static stressThe push-pull rod needs to be checked for yielding at static peak loads. This may be critical for the followingparts:
— minimum section diameter— threaded connections— bolted connections.
Further, under the same condition the push-pull rod shall not be exposed to buckling, and if the crosshead isshrink-fitted onto the push-pull rod, the connection shall be able to take the crank pin force without slipping.
Stresses in the minimum section diameter, σppmin are calculated according to:
Where Dppmin is minimum section diameter of push-pull rod (mm) and Dppo is inner diameter of push pullrod (mm). In case parts of the push-pull rod are connected by sleeves, stresses in sleeves are calculatedcorrespondingly, using outer and inner diameter of sleeves instead.
For threaded connections, the same approach is used to find stress in threaded section, σppthr (N/mm2)as for the minimum section diameter, replacing Dppmin with the thread diameter Dppthr (mm). In case of asleeve, the relevant diameters for sleeve and sleeve threads shall be used.When considering shear yielding of all threads, the following formulation shall be used for allowable stress:
Section 3
Class guideline — DNV-CG-0041. Edition September 2021 Page 44Ice strengthening of propulsion machinery and hull appendages
DNV AS

Where σppy (N/mm2) is yield strength of push-pull rod (or sleeve as relevant), Lppthr is length of threadedpart (mm) and ρppthr is part of thread carrying load, found from the following empirical relation:
Stresses in push-pull rod bolts, σppblt are calculated according to:
Where σpppre is bolt pre-tension stress (N/mm2) in minimum section diameter, Dppmin (mm), Kppblt isbolt factor for part of external load taken up as tension in bolts – to be taken as 0.25, unless otherwise issubstantiated and Nppblt is number of clamping bolts.In order to avoid buckling of the push-pull rod, the distance between radial support points, Lppsupport (mm)shall not be less than derived from the following formula:
Where Epp is E-modulus of push pull rod (= 2.05×10⁵ N/mm2 for steel) and Dpp is representative diameterof push-pull rod.If the connection between the cross head and push-pull rod is by means if shrinkage only, the minimumshrinkage pressure shall be:
Where Ssf is additional safety factor for shrink fit = 1.25, μ is friction coefficient, to be taken as 0.15 for dryconnections, Dpp is push-pull rod diameter in way of shrink fit (mm) and tcrh is effective cross head thickness(mm).The reason for including the additional factor of 1.25 is because slippage will happen immediately upon anoverload, and the general safety factors (if any) applied on the crank pin force as described in the rules referto yielding criteria, and are considered too small for shrink fit connections.General formulations for cylindrical shrink-fitted connections shall be used as follows:
— Diameter of outer member, Dhub (cross head) shall for simplicity and safety be taken as the width of thecross head, not including retaining walls for guide block or crank pin (as relevant).
— For maximum allowable interference / shrinkage pressure between push-pull rod and cross head, themembrane stresses due to the shrinkage pressure shall not exceed 70% of cross head material yieldstrength.
Section 3
Class guideline — DNV-CG-0041. Edition September 2021 Page 45Ice strengthening of propulsion machinery and hull appendages
DNV AS

Figure 9 Illustration of diameter of outer member for push-pull rod shrink fit
5.8.3 Dynamic stress and mean stress (fatigue)The push-pull rod needs to be checked for fatigue in way of significant stress risers. This is typically criticalfor the following parts:
— fillets— radial borings.
Figure 10 Typical stress raisers in push-pull rod
Principal stresses in way of the stress riser, σapp are calculated as for the static case with minimum sectiondiameter, using relevant diameters.Influence from local stress concentration should be represented in the fatigue calculations with geometricalstress concentration, Kt = αapp, as described in [6.2].Unless otherwise substantiated αapp shall be taken as 3.0 for radial borings and according to the followingempirical formulation (relevant for axial loading) for shoulder fillets:
Where rfpp is shoulder fillet radius (mm) and Dpps is diameter of shoulder/flange (mm).
Section 3
Class guideline — DNV-CG-0041. Edition September 2021 Page 46Ice strengthening of propulsion machinery and hull appendages
DNV AS

Also for welded connections of various types, the push-pull rod needs to be checked for fatigue. Principalstresses may be calculated as above, excluding the influence of stress risers (influence of increased stress inweld is included in the fatigue strength, see [3.2]).
6 Material strength
6.1 Static strength6.1.1 Static strength vs. yielding (maximum ice load) criterionWith reference to [2.2], the yielding criterion for maximum ice load is complied with when the predictednominal equivalent stress for the considered component is less than yield strength, σy. A safety factor of1.3 (as specified in DNV-RU-SHIP Pt.6 Ch.6 Sec.3 and DNV-RU-SHIP Pt.6 Ch.6 Sec.7) is included in themaximum ice load.
6.1.2 Static strength vs. permanent deflection (blade bending) criterionWith reference to chapter [2.1], the yielding criterion for blade failure load is complied with when thepredicted nominal equivalent stress for the considered component is less than yield strength, σy.
6.2 Fatigue (dynamic) strength6.2.1 Fatigue strength basic formulationWith reference to [2.3], the fatigue strength criterion is complied with when the Miner sum is less than 1.0.The safety factor of 1.5 (as specified in DNV-RU-SHIP Pt.6 Ch.6 Sec.3 and DNV-RU-SHIP Pt.6 Ch.6 Sec.7) isthen applied on the acting dynamic ice load amplitudes.Fatigue strength for components in pitch mechanism is influenced by a number of effects. In general, thefollowing applies for fatigue strength in non-corrosive environment at Ei number of cycles:
Where σfatEi is fatigue strength in rotating bending in air for un-notched test piece, frough is influence factorfor influence of surface roughness (-), q equals the notch sensitivity factor (-), Kt is the geometrical stressconcentration factor (-) as found in previous sections, Kmean is correction factor for influence of mean stress,Ksize is correction factor for influence of size, Kvar is correction factor for influence of variable loading andKload is correction factor for other type of loading than bending. These factors are addressed in the following.For welded connections (push-pull rod), none of the above influence factors shall be included.
6.2.2 Fatigue strength at given No. of cyclesThe initial fatigue strength, σfatEi for common materials applied in components for hub and pitch mechanismnot exposed to sea water is derived from SN-curves as described below, unless otherwise substantiated.The initial SN-curves are limited to / described by linear curves in a log-log diagram as described in thefollowing:
σfatEi ≤ σuWhere σu is ultimate tensile strength of material.The SN curve is determined with two slopes, which may be different above and below a defined knucklepoint, NHC.
Section 3
Class guideline — DNV-CG-0041. Edition September 2021 Page 47Ice strengthening of propulsion machinery and hull appendages
DNV AS

Where Ni is considered number of cycles, σFat E7 is material fatigue strength in rotating bending at 107cycles for un-notched test piece, σFat NHC is corresponding fatigue strength at knuckle point and σFat Ei iscorresponding fatigue strength at 10i cycles. Slopes of SN curve, mLC (low cycle) and mLH (high cycle) arematerial dependent (see Table 2 below).For parts exposed to sea water, such as propeller hub and blade carrier bearing in way of- or outside ofsealing, fatigue properties shall be taken as for propeller blades (see Sec.2 [3.1]).
For welded connections (push-pull rod) made of steel the fatigue strength for Ni No. of cycles shall be takenas follows:
Where the welding parameters Awld and Bwld are tabulated in Table 3.σFat Ei ≤ σu of the base material.
6.2.3 Material parameters for calculation of S-N curveFatigue parameters for some materials commonly applied in propellers and pitch mechanisms are tabulatedin Table 2. These parameters correspond to mean fatigue strength in rotating bending (R = -1) for un-notched, polished specimen with a diameter of 25 mm or less.
Table 2 Material fatigue parameters for some common materials
Material σFat E7 NHC
Bronze alloy 0.30 σu 108
Cast steel 0.40 σu 108
Forged and rolled steel 0.50 σu 107
Nodular cast iron 0.35 σu ∞
Fatigue values for other materials may be agreed upon special consideration.
Section 3
Class guideline — DNV-CG-0041. Edition September 2021 Page 48Ice strengthening of propulsion machinery and hull appendages
DNV AS

Slope of SN curve in the low cycle part, mLC is calculated from the following:
Slope of the S-N curve in the high cycle part, mHC shall be taken as 50 for all materials.Note that for nodular cast iron, no knuckle point is defined. Hence the low cycle slope applies for the wholecycle range. Also note that DNV-RU-SHIP Pt.6 Ch.6 Sec.3 and DNV-RU-SHIP Pt.6 Ch.6 Sec.7 call for a CharpyV impact strength of minimum 20J at –10°C for propeller materials. Nodular cast iron will normally notcomply with this requirement, but is included in Table 2 for the sake of good order. The above formulationsinclude the effect of variable loading by moving the knuckle point from 107 to 108 cycles for bronze and caststeel materials. For forged steel, the influence of variable loading is small and hence knuckle point is taken at107 cycles.
Hence Kvar is taken as 1.0 for all materials.For typical material parameters, an example of initial S-N curves is given in the figure below:
Figure 11 Example of typical initial S-N curve for some materials
For welded connections, the S-N curve is generated (depending on welding type) from the following weldingparameters, unless otherwise substantiated:
Section 3
Class guideline — DNV-CG-0041. Edition September 2021 Page 49Ice strengthening of propulsion machinery and hull appendages
DNV AS

Table 3 Fatigue parameters for common types of welded connections
Weld type Awld Bwld
Butt weld,grinding
+ NDT
8100 -0.29
Butt weld,general
10500 -0.33
Transverse butt weldgrinding + NDT
8500 -0.33
Other/unspecified weld 5300 -0.33
Figure 12 S-N curve for welded connections (tensile strength taken as 600 N/mm2)Section 3
Class guideline — DNV-CG-0041. Edition September 2021 Page 50Ice strengthening of propulsion machinery and hull appendages
DNV AS

6.2.4 Influence factor for surface roughnessThe influence factor for surface roughness shall be taken from the following empirical formula, unlessotherwise substantiated:
Where Ra is average surface roughness (mm) and σu is ultimate tensile strength of material (N/mm2). Forprediction of roughness influence, number of load cycles, Ni shall not be taken lower than 103 or higher than107.
Figure 13 Illustration of influence factor for surface roughness
6.2.5 Influence factor for notch sensitivityBasis for the prediction of notch sensitivity, q is the Neuber-equation for high cycle axial/bending fatigue.This is used for all materials relevant for propeller hub and pitch mechanism.
The Neuber-equation is modified to include an empirical dependency of number of cycles, Ni, taking intoaccount that high tensile materials show some notch sensitivity even at very low number of cycles:
Where Nq is Number of cycles below which material is assumed to have zero notch sensitivity, taken as:
Section 3
Class guideline — DNV-CG-0041. Edition September 2021 Page 51Ice strengthening of propulsion machinery and hull appendages
DNV AS

For prediction of notch sensitivity, Ni shall not be taken lower than Nq or higher than 107. In the same way,yield strength σy shall not be taken less than 400 N/mm2.
Further, r is notch radius (mm) and is material parameter, empirically depending on material yield
strength, σy (N/mm2).
Unless otherwise substantiated, the values of shall as a simplification be based on reported values forsteel according to the following empirical formulation:
The formulations for notch sensitivity may be somewhat on the safe side for some materials such as copperalloys and nodular cast iron, in particular when notches are very sharp.
Figure 14 Illustration of Notch sensitivity factor
Section 3
Class guideline — DNV-CG-0041. Edition September 2021 Page 52Ice strengthening of propulsion machinery and hull appendages
DNV AS

6.2.6 Influence of mean stressInfluence factor for mean stress, Kmean shall be found according to one of the following formulas:For components in a non-corrosive environment:
For components in a corrosive environment:
Where σmean is nominal mean stress (N/mm2), i.e. not including geometrical stress concentration, Kt and σuis ultimate tensile strength (N/mm2). Note that for prediction of mean stress, safety factor needs not to beadded on the acting load.
6.2.7 Influence of component sizeUnless otherwise substantiated, the following empirical formulation shall be used for size influence, Ksize forbronze, cast steel and nodular cast iron:
Where the component thickness, t shall refer to a representative thickness or diameter of the loaded part ofthe component (thickness of bearing/retaining wall, diameter of crank pin/ push-pull rod diameter, etc), notto be taken less than 25mm.
For prediction of size influence, number of load cycles, Ni shall not be taken lower than 103 or higher than107.The influence of component size on fatigue strength for cast materials is illustrated as follows:
Section 3
Class guideline — DNV-CG-0041. Edition September 2021 Page 53Ice strengthening of propulsion machinery and hull appendages
DNV AS

Figure 15 Influence of component size for cast materials
For forged steel, Ksize is closely connected to mechanical properties and shall therefore be taken as 1.0.
6.2.8 Influence of variable loadingThe effect of variable loading on fatigue strength is included by extending fatigue curve with low cycle slope(mLC) from 10
7 cycles to 108 cycles for materials influenced by variable loading.
Hence Kvar is taken as 1.0.
6.2.9 Influence of loading typeFor components where bending stresses are not dominating, this shall be compensated for.If axial stresses are dominating:
For prediction of load type influence, number of load cycles, Ni shall not be taken lower than 103 nor higherthan 107.This is illustrated in the following figure:
Section 3
Class guideline — DNV-CG-0041. Edition September 2021 Page 54Ice strengthening of propulsion machinery and hull appendages
DNV AS
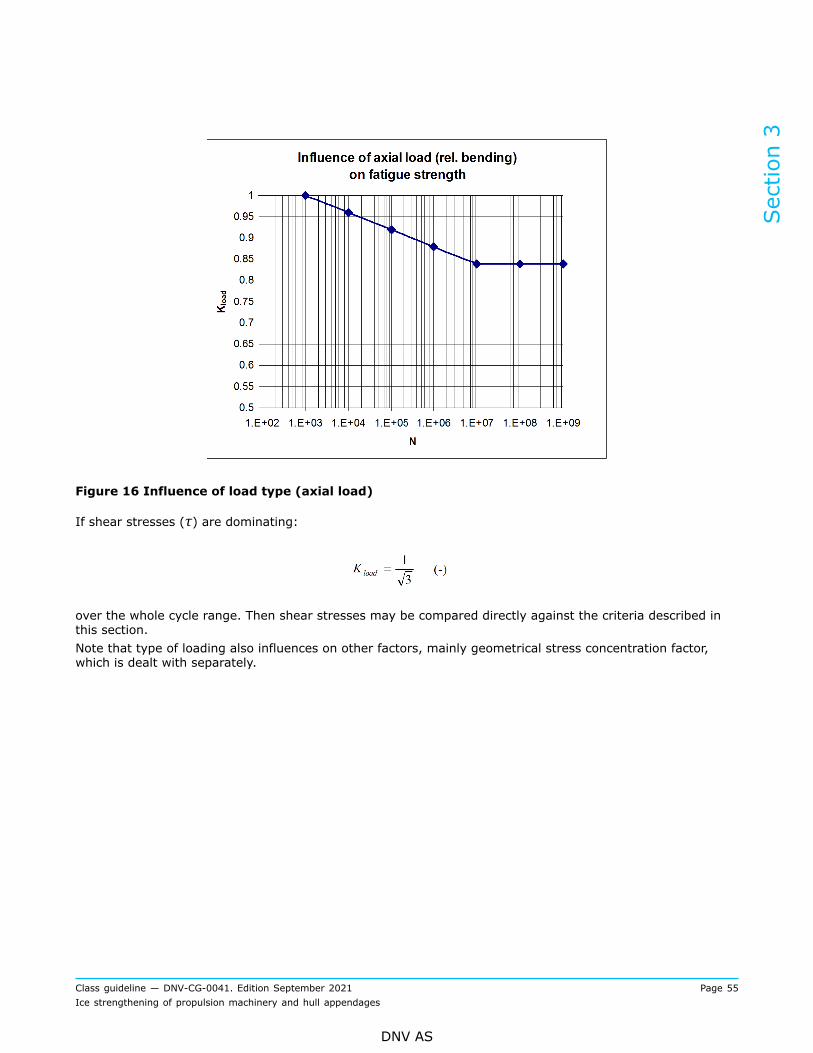
Figure 16 Influence of load type (axial load)
If shear stresses (τ) are dominating:
over the whole cycle range. Then shear stresses may be compared directly against the criteria described inthis section.Note that type of loading also influences on other factors, mainly geometrical stress concentration factor,which is dealt with separately.
Section 3
Class guideline — DNV-CG-0041. Edition September 2021 Page 55Ice strengthening of propulsion machinery and hull appendages
DNV AS

SECTION 4 GUIDANCE ON SIMULATION CALCULATIONS
1 The lumped mass-elastic systemSimulation of responses in a propulsion shafting system, which are caused by ice impacts on the propellerblades, shall be made by solving differential state-equations in the time domain. The basis for the mass-elastic system is found in the ordinary torsional vibration calculations (TVC). Since the step time in a numerictime integration should not exceed a few % (< 5%) of the period of the highest natural frequency (ofnumeric stability reasons), it is strongly advised to simplify the model into a minimum of lumped masses.This simplification process should aim at the following:
— keeping the total inertia constant (in order to have a representative deceleration of the system during iceimpact loads)
— maintain the lowest natural frequencies (the separation margins between the resonance speeds and thereal speed are important)
— to minimise total computer calculation time and to avoid numeric challenges introduced by local highfrequent vibrations.
This would lead to some corrections (normally an increase) of the stiffness between the various new lumpedmasses. For elements with linear stiffness this is no problem. However, for nonlinear elements care should betaken.
— a progressive stiffness may be slightly increased, but in such a way that the coefficients describing theprogressive characteristics also are modified in the same proportion
— an element with a twist limiter such as a buffer in a steel spring coupling or an emergency claw device ina rubber coupling should be described as correctly as possible. Hitting such limiters can cause extra highpeak torque in adjacent elements. Thus the torque-twist characteristic should not be altered, unless it isensured that the highest twist will not reach the limiter.
The simulation of ice impacts starts from a steady state condition, normally at full load. The coupling twist atthis full load is determined by the torque and the static coupling stiffness (use of the dynamic stiffness wouldlead to a faulty initial twist). During the impact vibrations it would be correct to use the dynamic stiffness forthe dynamic part and the static stiffness for the static part. This is hardly possible in practice and it is advisedto calculate with the static stiffness only. Alternatively the calculation may be performed with the dynamicstiffness, but then the twist angle when reaching the buffer/claw device shall be reduced correspondingly.All essential branches shall be included, e.g. PTO/PTI. On the other hand, a torsional vibration damper branchin a 4-stroke engine can simply be added to the engine mass because it hardly will have any influence on thelow frequent ice shock vibrations.The propeller inertia in a TVC will include the entrained water relevant for operation in open water or bollardcondition. When hitting large ice blocks the effective propeller inertia may be altered, but due to uncertaintiesit is suggested to keep the inertia as given in the TVC.
2 Damping in the mass-elastic system
2.1 Relative damping - GeneralRelative damping, i.e. damping between masses (parallel with the springs), is modelled as in ordinaryTVC. If any modification of the stiffness is made in order to have the correct natural frequencies, thedamping coefficient should be altered proportionally. With this recipe all 'linear' elastic couplings are covered('linear' means a torque-twist characteristic that is reasonably straight. The fact that most rubber couplingsbecome much softer when subjected to high amplitudes can be dealt with by a 'memory function' of the lastoscillation). If desired, steel shafts can also be modelled with a small damping (e.g. magnifier M = 180) butthis will have negligible influence on the results.For non-linear couplings the stiffness is not often described in such a way that it may be used directly in asimulation calculation. It is convenient to model the torque-twist function as a polynomial function with twist
Section 4
Class guideline — DNV-CG-0041. Edition September 2021 Page 56Ice strengthening of propulsion machinery and hull appendages
DNV AS

(φ) to the power of 1, 3, 5 etc. (Power of 2, 4, etc. should be avoided as problems would occur with negativetwist.):
Tel = A · φ + B · φ3 + C · φ5
The stiffness (K) is the derivative of this torque-twist function
K = A + 3 · B · φ2 + 5 · C · φ4
The damping coefficient (DRel) can relate to that stiffness:DRel = K/(M · ω)
where 'M' is the magnifier, i.e. M ≈ 2π/ψ ≈ 1/κ ≈ 1/tanε ≈ 1/2ζ etc., and ω is the major excitationfrequency (rad/s).
2.2 Absolute damping - GeneralAbsolute damping, i.e. damping on mass, is not directly modelled in a system that has a variable rpm. Adamping torque is the product of the damping coefficient and the vibration velocity. This works well in asystem with constant speed and a superimposed vibration. However, when the speed is altered the systemcannot clearly distinguish between a vibration and a change in speed, see Figure 1.
Figure 1 Rotational speed incl. vibrations as function of time
Incorporating absolute damping requires therefore a filtering of the speed signal. Figure 2 shows the samereal speed as above, but now the (new) blue curve represents the filtered signal.
Section 4
Class guideline — DNV-CG-0041. Edition September 2021 Page 57Ice strengthening of propulsion machinery and hull appendages
DNV AS

Figure 2 Filtered rotational speed as function of time
A filtered signal has a time lag (as can be seen above). The damping torque is determined as the product ofdamping coefficient DAbs (kNms/rad) and the difference between unfiltered and filtered speed signal, i.e:
Ideally the filtered signal should have been in the middle of the oscillating speed signal. The differencebetween the real filtered (blue) signal and this ideal filtered signal (when multiplied with DAbs) will representa torque. Due to the necessary sign in the above equation, this torque will act as a kind of friction duringdeceleration of the system. Its magnitude will not be very significant for the final result, but nevertheless thefilter characteristics should be chosen so as to minimise this 'friction'. On the other hand, the filter shall notallow any oscillating output signal as that would falsify the damping action.
2.3 Propeller damping and demand torque characteristicsFor a propeller the damping is also a consequence of its torque-speed characteristic. Modelling the propellerdemand torque as the square of the rpm or (e.g. close to bollard condition would be relevant in ice) willautomatically result in a damping action (corresponding to an Archer coefficient of about 20), see Figure3. (For any driven component the damping coefficient is the tangent to the demand torque versus speedcharacteristic).
Section 4
Class guideline — DNV-CG-0041. Edition September 2021 Page 58Ice strengthening of propulsion machinery and hull appendages
DNV AS
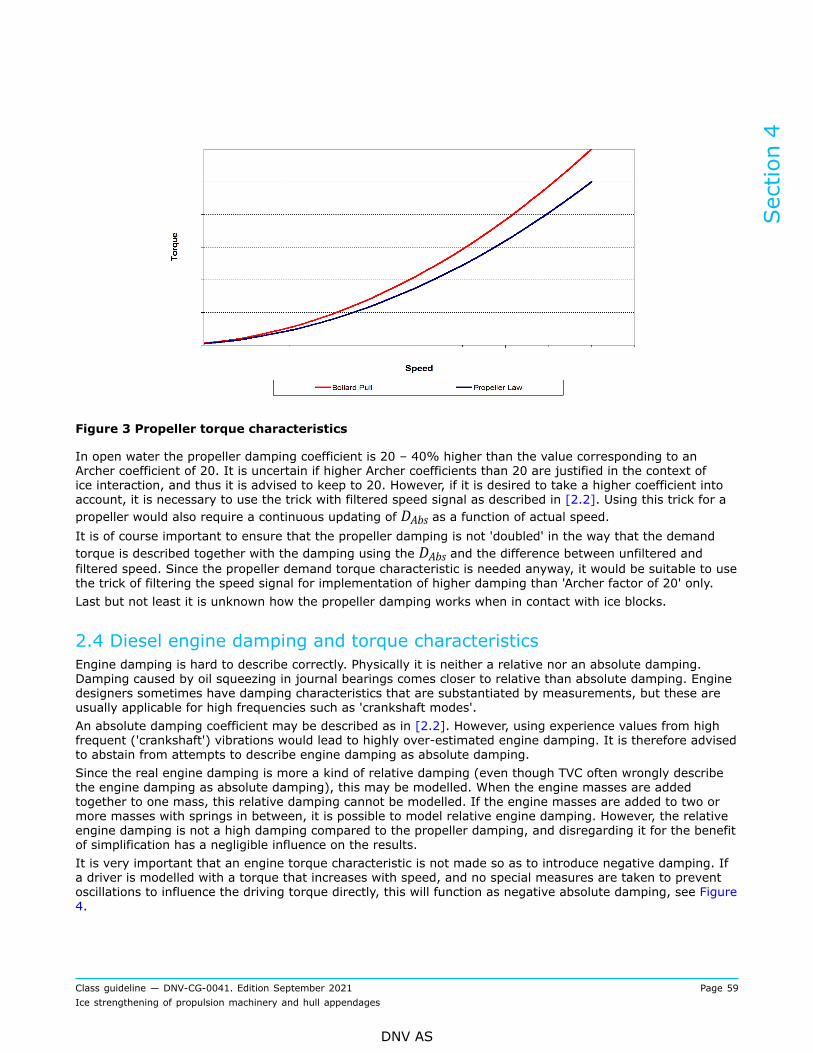
Figure 3 Propeller torque characteristics
In open water the propeller damping coefficient is 20 – 40% higher than the value corresponding to anArcher coefficient of 20. It is uncertain if higher Archer coefficients than 20 are justified in the context ofice interaction, and thus it is advised to keep to 20. However, if it is desired to take a higher coefficient intoaccount, it is necessary to use the trick with filtered speed signal as described in [2.2]. Using this trick for apropeller would also require a continuous updating of DAbs as a function of actual speed.It is of course important to ensure that the propeller damping is not 'doubled' in the way that the demandtorque is described together with the damping using the DAbs and the difference between unfiltered andfiltered speed. Since the propeller demand torque characteristic is needed anyway, it would be suitable to usethe trick of filtering the speed signal for implementation of higher damping than 'Archer factor of 20' only.Last but not least it is unknown how the propeller damping works when in contact with ice blocks.
2.4 Diesel engine damping and torque characteristicsEngine damping is hard to describe correctly. Physically it is neither a relative nor an absolute damping.Damping caused by oil squeezing in journal bearings comes closer to relative than absolute damping. Enginedesigners sometimes have damping characteristics that are substantiated by measurements, but these areusually applicable for high frequencies such as 'crankshaft modes'.An absolute damping coefficient may be described as in [2.2]. However, using experience values from highfrequent ('crankshaft') vibrations would lead to highly over-estimated engine damping. It is therefore advisedto abstain from attempts to describe engine damping as absolute damping.Since the real engine damping is more a kind of relative damping (even though TVC often wrongly describethe engine damping as absolute damping), this may be modelled. When the engine masses are addedtogether to one mass, this relative damping cannot be modelled. If the engine masses are added to two ormore masses with springs in between, it is possible to model relative engine damping. However, the relativeengine damping is not a high damping compared to the propeller damping, and disregarding it for the benefitof simplification has a negligible influence on the results.It is very important that an engine torque characteristic is not made so as to introduce negative damping. Ifa driver is modelled with a torque that increases with speed, and no special measures are taken to preventoscillations to influence the driving torque directly, this will function as negative absolute damping, see Figure4.
Section 4
Class guideline — DNV-CG-0041. Edition September 2021 Page 59Ice strengthening of propulsion machinery and hull appendages
DNV AS
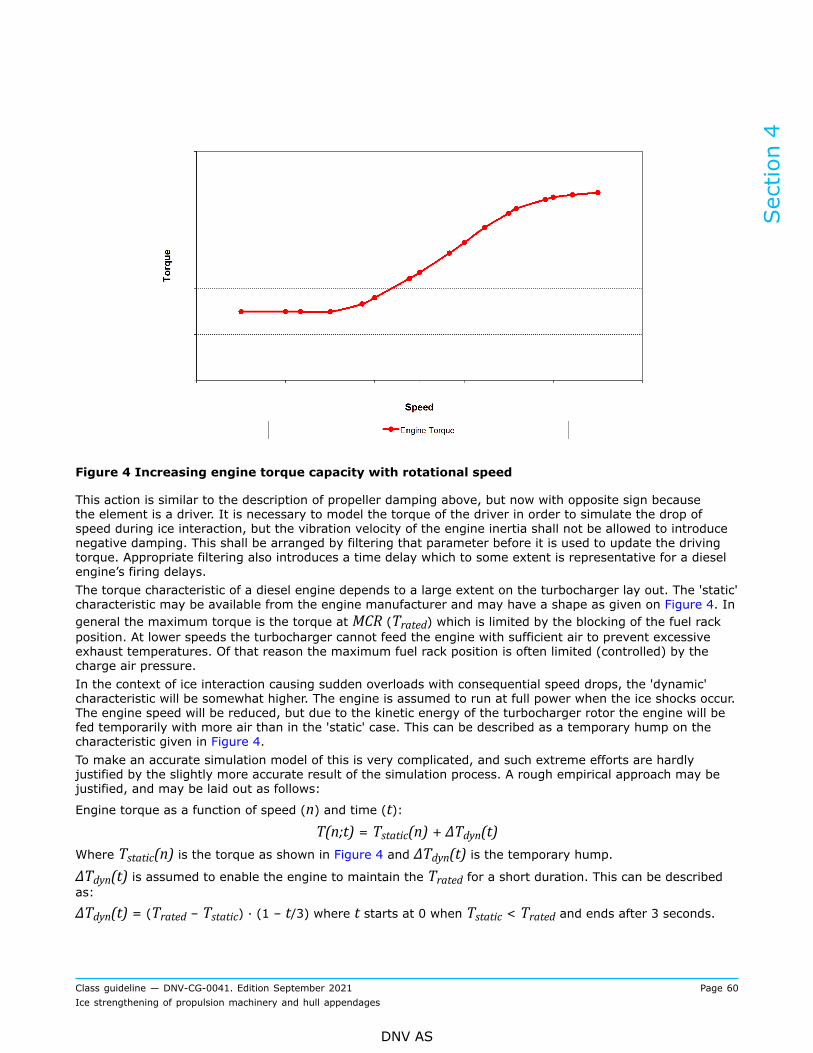
Figure 4 Increasing engine torque capacity with rotational speed
This action is similar to the description of propeller damping above, but now with opposite sign becausethe element is a driver. It is necessary to model the torque of the driver in order to simulate the drop ofspeed during ice interaction, but the vibration velocity of the engine inertia shall not be allowed to introducenegative damping. This shall be arranged by filtering that parameter before it is used to update the drivingtorque. Appropriate filtering also introduces a time delay which to some extent is representative for a dieselengine’s firing delays.The torque characteristic of a diesel engine depends to a large extent on the turbocharger lay out. The 'static'characteristic may be available from the engine manufacturer and may have a shape as given on Figure 4. Ingeneral the maximum torque is the torque at MCR (Trated) which is limited by the blocking of the fuel rackposition. At lower speeds the turbocharger cannot feed the engine with sufficient air to prevent excessiveexhaust temperatures. Of that reason the maximum fuel rack position is often limited (controlled) by thecharge air pressure.In the context of ice interaction causing sudden overloads with consequential speed drops, the 'dynamic'characteristic will be somewhat higher. The engine is assumed to run at full power when the ice shocks occur.The engine speed will be reduced, but due to the kinetic energy of the turbocharger rotor the engine will befed temporarily with more air than in the 'static' case. This can be described as a temporary hump on thecharacteristic given in Figure 4.To make an accurate simulation model of this is very complicated, and such extreme efforts are hardlyjustified by the slightly more accurate result of the simulation process. A rough empirical approach may bejustified, and may be laid out as follows:
Engine torque as a function of speed (n) and time (t):T(n;t) = Tstatic(n) + ΔTdyn(t)
Where Tstatic(n) is the torque as shown in Figure 4 and ΔTdyn(t) is the temporary hump.ΔTdyn(t) is assumed to enable the engine to maintain the Trated for a short duration. This can be describedas:
ΔTdyn(t) = (Trated – Tstatic) ∙ (1 – t/3) where t starts at 0 when Tstatic < Trated and ends after 3 seconds.
Section 4
Class guideline — DNV-CG-0041. Edition September 2021 Page 60Ice strengthening of propulsion machinery and hull appendages
DNV AS

2.5 Electric-motor damping and torque characteristicsAn electric-motor damping is associated with its torque characteristic. When viewed in a torque-speeddiagram, a characteristic increasing from left to right in the diagram will correspond to a 'negative' damping.A characteristic decreasing from left to right will correspond to 'positive' damping.
Figure 5 Possible torque characteristics of electric motors (constant power or torque)
The above statements are valid for immediate torque response as a function of the momentary velocity. Anytime lag will alter this and introduce a phase angle that may change 'negative' to 'positive' damping and viceversa. (That is similar to diesel engines where the speed governor and firing system introduce a phase shiftof an oscillating fuel rack that can lead to negative, positive or 0 damping.)Unless the torque response is immediate, it is advised to filter the speed signal and therewith the dampinginfluence.E-motors may have an overload capacity when the rated speed is suppressed, e.g. having constant poweras indicated in Figure 5 with the hyperbolic shape. However, using this overload capacity may lead to motoroverheating within short time. The simulation model utilising such overload capacity should also include atime limit function corresponding to the automatic action in the monitoring system.
3 ExcitationsThe major excitation source is the ice interaction. The ice impacts in the rules are described as sequences ofhalf-sinus waves of blade passing frequency as well as the double frequency.The start and end of these waves are ramped up respectively down over a given angle of rotation.A simple way of describing this excitation is to multiply the (constant) sinus waves with a ramp function from0 to 1 over the specified ramp length. A similar ramp function from 1 to 0 applies at the end.If the ordinary torsional vibrations cannot be disregarded, e.g. as for direct coupled crosshead engines, it isnecessary to have this superimposed to the ice interaction. Such engines usually have a barred speed rangeor, if not barred, a range where the vibration response is quite significant. These speed ranges are usuallybelow 60% of MCR speed and an engine speed drop into these ranges should (or must) be avoided. It istherefore important to model the available driving torque as a function of rpm (see Figure 5) as correctly aspossible. The main engine excitation (normally of the order equal to the number of cylinders) is applied atthe lumped engine inertia.
Section 4
Class guideline — DNV-CG-0041. Edition September 2021 Page 61Ice strengthening of propulsion machinery and hull appendages
DNV AS

SECTION 5 PROPULSION SHAFT DESIGN AGAINST FATIGUE
1 NomenclatureOnly SI units are used.
2 GeneralThis section describes a recommended method for fatigue analysis of propulsion shafts considering theexpected long term ice loads as defined in DNV-RU-SHIP Pt.6 Ch.6 Sec.7.The other design criteria involving ice loads, which also shall be fulfilled like 'pyramid bending strengthcriterion' for the propeller shaft and prevention of shaft bending/yielding due to peak ice torque, areconsidered to be self explanatory in DNV-RU-SHIP Pt.6 Ch.6 Sec.7 and are not elaborated further here.Even though propulsion shafts are exposed to a wide spectrum of other open water'-loads (torsion andbending loads), just a few of the dominating load cases need to be considered instead of including them allin the Palmgren-Miner cumulative 'damage sum'. The applicable 'open water' load cases and their respectiveacceptance criteria are described in the Society's document DNV-CG-0038. For most of the propulsion shaftdesigns and applications known in marine applications, only one of these load cases will really form thedesign condition (i.e. the load case that will be decisive for the dimensions and material properties of theconsidered shaft). Therefore, it is normally adequate to assess the strength capacity of these load casesseparately. However, in cases where two or more of these load cases are close to their acceptable limits, theirdegree of cumulative 'damage' shall be added by using Palmgren-Miner’s approach. The fatigue analysis isbased on the permissible stress levels as presented in the design S-N-data/curves in the Society's documentDNV-CG-0038 and the validity of the method is given in the same reference.
Figure 1 Typical load cases to be assessed for an ice classed vessel with direct coupled 2 strokeplant
Section 5
Class guideline — DNV-CG-0041. Edition September 2021 Page 62Ice strengthening of propulsion machinery and hull appendages
DNV AS

3 Method for fatigue analysisFatigue design of propulsion shafts subject to variable amplitude stresses due to ice loads are assessed byusing the Palmgren-Miner linear damage hypothesis:
where:
τv ice = is a constant stress amplitude in the shaft due to ice interaction on the propellerni(τv ice) = is the discrete number of cycles with a constant stress amplitude τv ice.Ni(τv ice) = is the number of cycles to failure due to the constant stress amplitude τv ice based on the
relevant part of the design S-N-curve= degree of cumulative 'damage' of a constant stress amplitude τv ice
I = number of different load magnitudes (load blocks)m = negative inverse slope of the relevant part (for τv ice) of the design S-N curveā = intercept with the log(N) axis of the relevant part (for τv ice) of the design S-N curveη = accept usage factor or 'damage sum' = 1.
Applying a histogram to express the stress distribution, the number of stress blocks, I, shall be largeenough to ensure reasonable numerical accuracy, and should not be less than 10. If integration is used, dueconsideration should be given to selection of integration method as the position of integration points mayhave a significant influence on the result.
The stress cycles interaction effect is taken into account by conservative safety factors and continuous slopein the high cycle end of the S-N curve.
3.1 Ice loadsThe ice load spectrum (exceedance diagram of ice load history) is by DNV-RU-SHIP Pt.6 Ch.6 postulated by
a two-parameter Weibull distribution with shape parameter k = 1 and scale parameter , see
Figure 2:
The corresponding Weibull probability density function:
Section 5
Class guideline — DNV-CG-0041. Edition September 2021 Page 63Ice strengthening of propulsion machinery and hull appendages
DNV AS

The highest shaft response torque in the load spectrum, TA max shall be based on the transient torsionalvibration analysis of the propulsion system (simulation calculations) as described in Sec.4.
Figure 2 Example of an ice load spectrum (cumulative distribution) with total number of ice loads;Z·Nice = 3·108, presented in a semi-log scale
With , the same can be expressed in terms of stress:
Weibull scale parameter:
Stress amplitude distribution:
Stress amplitude probability function:
Section 5
Class guideline — DNV-CG-0041. Edition September 2021 Page 64Ice strengthening of propulsion machinery and hull appendages
DNV AS

3.2 Design S-N curveThe design S-N curve for the shaft section in question is established according to the Society's documentDNV-CG-0038, which takes into account the materials fatigue strength including the mean stress influence,geometrical stress concentration (if any), notch influence/sensitivity, size factor and the required safetyfactors for low and high cycle fatigue respectively. For each shaft section and load case, this leads to a set of3 points describing the bi-linear design S-N curve, see Figure 3:
τvLC = permissible low cycle torsional stress amplitude corresponding to 104 cycles (with safety factor1.25)
τvHC = permissible high cycle torsional stress amplitude corresponding to 3·106 cycles (with safety factor1.5)
τf/S = fatigue strength amplitude corresponding to 109 cycles (with safety factor 1.5) τf/S → τf includes asafety factor of 1.5.τf includes a safety factor of 1.5.
The rest of the S-N- curve is found by linear interpolation/extrapolation in a log(t)-log(N) scale.
Figure 3 Example of a design S-N curve for steel in air condition
The following bi-linear S-N curve can be used for fatigue assessment:
For N ≤ 3·106 cycles:
For N > 3·106 cycles:
Section 5
Class guideline — DNV-CG-0041. Edition September 2021 Page 65Ice strengthening of propulsion machinery and hull appendages
DNV AS

Where:
3.3 Fatigue damage due to ice interactionThe degree of damage accumulated from the stress amplitudes due to ice loads may be calculated by a directintegration of each part of the S-N curve:In terms of torsional stress:
Section 5
Class guideline — DNV-CG-0041. Edition September 2021 Page 66Ice strengthening of propulsion machinery and hull appendages
DNV AS

Figure 4 Example of a typical ice stress distribution and design S-N curve for steel in air condition
Since the permissible ice stress amplitude below 1000 cycles is limited by the shaft bending/yieldingcriterion:
and the shape of the Weibull distribution is as indicated in Figure 4, it can be seen that the fatigue damagedue to ice will by far be dominated by the second integral:
If the highest response torque amplitude on the shaft during a sequence of ice impacts on the propeller, τv icemax, is lower than the design knee point of the design resistance S-N curve, τvHC, the fatigue life of the shaftdue to ice impacts can be assumed as verified and no ice damage calculation is necessary.
It is also possible to calculate an equivalent constant ice stress amplitude, τeq ice associated with a certainaccumulated number of cycles, which will give the same fatigue damage, Dice as the long term stressdistribution calculated above. The equivalent ice stress amplitude associated with 106 accumulated stresscycles will be, see Figure 5:
Section 5
Class guideline — DNV-CG-0041. Edition September 2021 Page 67Ice strengthening of propulsion machinery and hull appendages
DNV AS

Figure 5 Equivalent ice stress amplitude, τeq ice associated with 106 accumulated stress cyclesgiving the same fatigue damage as the ice stress distribution τv ice(N)
3.4 Bending stress influenceThe influence on the fatigue damage by significant bending stresses due to ice impacts should be consideredin the following shafts:
a) in propeller shafts aft of the 2nd aftermost bearing caused by maximum propeller blade forces Fb/Ffb) in gear- and thruster shafts due to the coupled torsional-lateral mode through the gear mesh.
Section 5
Class guideline — DNV-CG-0041. Edition September 2021 Page 68Ice strengthening of propulsion machinery and hull appendages
DNV AS
SECTION 6 REDUCTION GEARS
1 GeneralThe general procedure in appendix A may be used in combination with te Society's document DNV-CG-0036for tooth root fracture and pitting of flanks. Scuffing calculations may be carried out according to DNV-CG-0036 based on the maximum response torque.Subsurface fatigue safety can be roughly estimated by the following:
1) Apply the response torque according to the Weibull distribution at 3 · 106 cycles.2) Calculate high cycle subsurface safety factor according to DNV-CG-0036.3) If the calculated safety factor is somewhat higher than required by DNV-RU-SHIP Pt.6 Ch.6, further
detailed sub-surface calculations can be omitted.
Section 6
Class guideline — DNV-CG-0041. Edition September 2021 Page 69Ice strengthening of propulsion machinery and hull appendages
DNV AS

SECTION 7 PODDED PROPULSORS OR AZIMUTHING THRUSTERS
1 Ice loads on pod/thruster body and propeller hub
Figure 1 Typical podded propulsor
1.1 IntroductionIce loads may be calculated for the entire exposed area of pod/thruster, or any other actual partial areaseparately. The method may also be applied on icebreakers and deeply submerged 'under bottom mounted'units.Both axial and transversal ice load cases shall be covered. Following cases shall normally be calculated:
1) transversal force on strut2) transversal force on pod3) axial force on strut4) axial force on pod, or propeller hub for pulling propeller5) transversal force on nozzle if any6) axial force on nozzle if any.
In addition, total transversal and axial forces using the sum of projected areas for pod, strut and nozzle (ifapplicable), shall be considered.In calculation of total axial force for pulling propeller case, the projected propeller blade area and ditto hubarea shall be used.
Section 7
Class guideline — DNV-CG-0041. Edition September 2021 Page 70Ice strengthening of propulsion machinery and hull appendages
DNV AS

Figure 2 Illustration of actual load cases to be considered
1.2 Ice load definition
1.2.1 Ice load on a defined area may be expressed by:
where:
p0 = ice pressure, in MPa, see Table 1
Section 7
Class guideline — DNV-CG-0041. Edition September 2021 Page 71Ice strengthening of propulsion machinery and hull appendages
DNV AS

Table 1 Reference ice thickness and –pressure. Ref. technical background note and in accordancewith IACS UR I2
Ice Class Hice (m) p0 (MPa)
PC-1 4.0 6
PC-2 3.5 4.2
PC-3 3.0 3.2
PC-4 2.5 2.45
PC-5 2.0 2
PC-6 1.75 1.4
PC-7 1.5 1.25
A = considered projected area exposed to ice pressure in m2 if less than 2Hice2
= 2Hice2otherwiseexp = 0.3 when area is 1 m2 and more
= 0.85 when A < 1 m2
C = A / 2Hice2, or minimum 1Hice = reference ice thickness for machinery strength design, see Table 1C1 = location and propeller type factor for hub and strut loads
= 1 in general= 1.5 for pulling and pushing 'front propeller' strut loads and pushing propeller axial pod loads= 2.2 for pulling propeller axial load ('hub load') calculated based on projected hub area
C2 = factor that reduces pod ice loads by 1/3 for under bottom mounted units= 1 in general= 2/3 for “deeply submerged” under bottom located propellers
C3 = ship type factor= 1 in general= 1.25 for icebreakers and ice management vessels
C4 = statistical factor for expected maximum load during 20 years lifetime= 1.2 in general.
1.2.2 Dynamic loadAxial load on the propeller hub exceeding propeller thrust will push the shaft 'backwards' and cause dynamicresponse in the thrust bearing in excess of what is reflected in the factor C1 above. The magnitude isdepending on thrust bearing design and axial clearance. For a spherical roller bearing this factor shall betaken minimum 1.1. This load is normally transmitted from the thrust bearing to its supporting structure andshall be included into the peak load transmitted via thruster support bearing (slewing bearing) to supportinghull structure.
Deep submerged under bottom located propellers – C2.Maximum ice load on propeller is not depending on submerged depth of propeller, only on total number ofice loads. This is reasonable for propellers, where ice impacts are mainly caused by propeller blades hittingice blocks and not reversely. Propeller blade rotational speed is much higher than ship speed - normally tipspeed is in the range of 20 to 40 m/s. Therefore it will not make any difference for a propeller blade if it hitsice under the bottom, or close to the surface.
Section 7
Class guideline — DNV-CG-0041. Edition September 2021 Page 72Ice strengthening of propulsion machinery and hull appendages
DNV AS

The selected 1/3 load reduction reflects to some degree reduction applied to ice loads acting on ship bottom.However, since a thruster penetrating ship hull forms an obstruction for ice moving mutually along thebottom, there will always be crushing of ice against the thruster strut, pod and propeller hub. The given loadreduction is not based on measurements, but is selected based on our best knowledge.A deep submersion must also be seen in relation to ice class. The following may be applied as criterion whena unit may be considered as 'deeply submerged':
Depth of propeller shaft centreline at LIWL (ho) > Hice + Dwhere D is propeller diameter in m.Propellers located in areas Mb, Sb and Bib (see DNV-RU-SHIP Pt.6 Ch.6 Sec.7 Figure 1) are considered as'under bottom located propellers' for PC. Propellers located under bottom, but in area BIl, or B shall bespecially considered. For such thrusters, pod and strut parts may belong to different location categories.A propeller may be considered as located under bottom when it is in flat bottom area, '5 frame spacings' orequivalent distance aft from 'fore foot' as defined in DNV-RU-SHIP Pt.6 Ch.6 Sec.3 Figure 1.
Section 7
Class guideline — DNV-CG-0041. Edition September 2021 Page 73Ice strengthening of propulsion machinery and hull appendages
DNV AS

SECTION 8 ICE LOAD ON APPENDAGES AND OTHER SPECIALSTRUCTURES
1 Ice load on nozzle, rudder and shaft brackets
1.1 GeneralThis section gives guidance on how to calculate and apply ice load on appendages for ships with PC classnotation.
1.2 Ice load - rudder below ice hornIce force on rudder shall be calculated for PC(7) to PC(1) as follow:
h = effective patch height in [m], see Table 1σice = ice strength in [MPa], see Table 1Z = distance from rudder bottom to the centre of the assumed ice load area in [m]ZBL = distance from rudder bottom to the ballast water line (LIWL) in [m]lR = cord length of rudder in [m]L = rule length in [m]C = area mode factor, where
= 0,6 in general= 0,8 for Icebreaker.
Table 1 Ice thickness and strength for different PC class notations
Class notation PC σice [MPa] h [m]
PC(1) 10 1,2
PC(2) 8,5 0,8
PC(3) 7,3 0,7
PC(4) 7 0,6
PC(5) 5,6 0,4
PC(6) 4,8 0,28
PC(7) 4,2 0,2
In addition to the ice load expressed above, ice load on appendages for PC(6) and PC(7) shall be alsocalculated for respectively Ice(1A*) and Ice(1A), whichever is greater.
Section 8
Class guideline — DNV-CG-0041. Edition September 2021 Page 74Ice strengthening of propulsion machinery and hull appendages
DNV AS

1.3 Ice load - upper part of rudder, ice horn and other appendagesIce force on appendages such as upper part of rudder, ice horn, nozzle, shaft and shaft bracket shall becalculated for PC(7) to PC(1) as follows:
Where:
k = 0,6 in general= 0,8 for Icebreaker
A = patch contact area in [m2] as defined in Table 1, Figure 3, Figure 4 and Figure 5.
1.4 Nozzles, Pt.6 Ch.6 [7.5]The nozzle force F shall be considered in the position that maximizes bending moment and shear on nozzleand its connection to the hull structure and shall be calculated as expressed by equation (2) considering icepatch areas listed in Table 1.The nozzle shall be assessed as follows.Global check includes:
— the integrity of the whole nozzle— struts connection to both nozzle and hull structure— shaft and shaft brackets.
Section 8
Class guideline — DNV-CG-0041. Edition September 2021 Page 75Ice strengthening of propulsion machinery and hull appendages
DNV AS

Figure 1 Load cases to be considered for ice load on nozzle
Section 8
Class guideline — DNV-CG-0041. Edition September 2021 Page 76Ice strengthening of propulsion machinery and hull appendages
DNV AS

1.5 Rudder, Pt.6 Ch.6 [7.2]1.5.1 Ice horn arrangementTo protect the upper edge of the rudder and to prevent wedging of ice between the ship and rudder top, anice horn shall be arranged as described by Figure 2.To avoid extreme dimensions of ice horn in the case of large vessel with PC class, the extension of the icehorn below the upper edge of the rudder shall not be more than 25% rudder height H.
Figure 2 Ice horn arrangement
1.5.2 Ice force on rudderRudder force FR shall be considered in the position that maximize bending moment and shear on rudderstock, rudder blade, rudder horn and ice horn, and shall be calculated as expressed by equation (1).The scantlings of rudders, rudder stocks and shafts, pintles, rudder horns and rudder actuators shall becalculated considering the formulae given in DNV-RU-SHIP Pt.3 Ch.14 Sec.1, inserting the torque QR,bending moments M and rudder force FR resulting from the load cases listed in Figure 3.
Section 8
Class guideline — DNV-CG-0041. Edition September 2021 Page 77Ice strengthening of propulsion machinery and hull appendages
DNV AS

Figure 3 Load cases to be considered for ice load on rudder blade
A grillage including girder system supporting the rudder trunk, rudder horn and ice horn may be necessaryconsidering the load cases listed in Figure 4.
Section 8
Class guideline — DNV-CG-0041. Edition September 2021 Page 78Ice strengthening of propulsion machinery and hull appendages
DNV AS

Figure 4 Load cases to be considered for ice load on upper part of rudder blade, including ice horn
1.6 Shaft and shaft bracketsIce force on shaft and shaft brackets F shall be considered in the position that maximize bending momentand shear, and shall be calculated as expressed by equation (2) considering the Ice patch areas listed inFigure 5.
Section 8
Class guideline — DNV-CG-0041. Edition September 2021 Page 79Ice strengthening of propulsion machinery and hull appendages
DNV AS

Figure 5 Load cases to be considered for ice load on propeller shaft and brackets
2 Ice load on bow thrusters gridsBow thrusters grids should be reinforced and evaluated to take ice patch load that corresponds to the areathe bow trusters are situated in. Patch loads should be las described in Figure 6.
Section 8
Class guideline — DNV-CG-0041. Edition September 2021 Page 80Ice strengthening of propulsion machinery and hull appendages
DNV AS

Figure 6 Bow thruster ice patch load
Where:Q =
Pavg = average peak pressure as given in DNV-RU-SHIP Pt.6 Ch.6 Sec.7 [4.6]sG = grid spacing
The nominal von Mises stress shall not exceed ReH, where ReH denotes the specified minimum yield stress ofthe material in N/mm2.
Section 8
Class guideline — DNV-CG-0041. Edition September 2021 Page 81Ice strengthening of propulsion machinery and hull appendages
DNV AS

APPENDIX A GENERAL GUIDANCE ON FATIGUE ANALYSIS OFPROPULSION MACHINERY SUBJECT TO ICE LOADS
1 Cumulative Damage by Palmgren-Miner’s RuleIn general, fatigue design of machinery components may be carried out by methods based on fatigue tests(S-N data) and estimation of cumulative damage ratio (Linear Damage Rule or Palmgren – Miner’s Rule). Thetheory of the Palmgren – Miner’s linear cumulative damage rule is that the total damage of the consideredcomponent or more precise the considered section of a component, may be expressed as the accumulateddamage from each load cycle at different stress levels, independent of their sequence of occurrence:
where:
MDR = Miner Palmgrens accumulated fatigue damage rationi = number of cycles in stress block i with constant stress amplitude (component stress history, see
[3])Ni = number of cycles to failure at constant stress amplitude (design S-N curve, see [2])I = total number of stress blocks in the components stress history.
The damage ratio (MDR) also called usage factor, represents the ratio of the consumed life of thecomponent. Theoretically, a MDR = 0.35 means that 35% of the component’s life is consumed. Ideally,failure due to fatigue occurs when the damage ratio exceeds 1.0.
The general procedure to calculate the damage ratio is as shown in Figure 1:
1) establish the relevant S-N curve for the section of the component in question, taking into account therequired safety factor, material of the component, mean stress and notch influence, size effect, stressinteraction effect, etc., see [2]
2) establish the long term stress amplitude distribution (stress amplitude exceeding spectrum) by relevantWeibull parameters, which are calculated based on the ice impact loads prescribed by convention for theapplicable ice class notation and their response to the component in question, duly taking care of thedynamic properties of the system where the component is installed, see [3]
3) check if detailed fatigue analysis can be omitted, see [5]4) depending on item 3. collate the S-N curve and the Weibull distributed stress amplitudes from step 1 and
2, respectively, by calculating the resulting damage ratio by Palmgren-Miner’s rule (MDR), see [4].
Appendix A
Class guideline — DNV-CG-0041. Edition September 2021 Page 82Ice strengthening of propulsion machinery and hull appendages
DNV AS

Figure 1 The Palmgren-Miner’s rule for one particular stress block i with stress exceedancediagram according a) and design S-N curve b)
Considerable test data has been generated in an attempt to verify Palmgren-Miner's Rule. Most of the'original' test cases for this rule have been using a two step stress history. This involves testing at an initialstress level S1 for a certain number of cycles and then the stress level is changed to a second level S2 untilfailure occurs. If S1 > S2, often referred to as a 'high-low' stress test, and opposite if S1 < S2, a 'low-high'stress test. The observed results of these tests are that the damage ratio - MDR corresponding to failureranged from 0.61 to 1.45. Other researchers have shown variations as large as 0.18 to 23.0, with mostresults tending to fall between 0.5 and 2.0. In most cases, the average value is close to Palmgren-Miner'sproposed value of 1.0.
One problem with two-level step tests is that they do not accurately represent many service load/stresshistories. Most load/stress histories do not follow any step arrangement and instead are made up of arandom distribution of loads of various magnitudes. However, tests using random histories with several stresslevels show good correlation with Miner's rule.
Appendix A
Class guideline — DNV-CG-0041. Edition September 2021 Page 83Ice strengthening of propulsion machinery and hull appendages
DNV AS

The Palmgren-Miner’s linear damage rule has two main shortcomings when it comes to describing observedmaterial behaviour:
1) Load sequence and interaction effects are ignored. The theory predicts that the damage caused by astress cycle is independent of where it occurs in the load history. Fatigue is a consequence of cycle-by cycle plastic strains locally at a notch. The state of stress and strain in the damage area is a resultof the preceding stress-strain history. Hence, the damage in one cycle is not a function of that stresscycle only, but also of the preceding cycles, leading to interaction or stress memory effect. An exampleof this discrepancy was discussed above regarding 'high-low' and 'low-high' tests. It has also beendemonstrated by such two step tests that the stress state at the end of the last cycle of first 'high' cyclesbefore the second 'low cycles starts has a considerable influence on the total number of cycles to failure,see Figure 2.
2) The rate of damage accumulation is independent of the stress level. However, observed behaviourindicates that a crack initiate in a few cycles at high strain amplitudes, whereas almost all the life isspent on initiating a crack at low strain amplitudes (i.e. very little propagation fatigue).Despite these limitations, the Palmgren-Miner’s linear damage rule is still widely used. This is due toits simplicity and the fact that more sophisticated methods do not always result in better predictions.The proposed value of MDR = 1.0 can be used as long as the above limitations are acknowledged bytaking them into account with conservative estimates of the design S-N curve for the component. Inthis respect by extending the slope of the S-N curve, m1 (i.e. adjusting the fatigue limit at the 'knucklepoint'), introducing a proper second slope m2 in the high cycle end (see Sec.2 Figure 5) and selecting aproper safety factor.
Figure 2 Stress interaction effect
2 Design S-N curveAn illustrative S-N curve is shown in Figure 3. The Y-axis represents the alternating stress amplitude (Sa) andthe X-axis represents the number of cycles (N) required to cause failure.
Appendix A
Class guideline — DNV-CG-0041. Edition September 2021 Page 84Ice strengthening of propulsion machinery and hull appendages
DNV AS

Figure 3 Schematic S-N curve (semi-logarithmic scale)
S-N curves are normally presented for small test specimens as mean fatigue life (50% probability of failure)or for a given probability of failure. Generating an S-N curve for a certain material requires many tests tostatistically vary the stress (regular sinusoidal) and count the number of cycles to failure. The type of stressvariation has a major effect on the fatigue performance and the S-N curves are normally determined for onespecific stress ratio value, which is defined as minimum peak stress divided by the maximum peak stress:
The mean stress, Sm and stress amplitude, Sa is then defined as
Sm = (1 + R)/2 and Sa = (1 - R)/2 , see Figure 4.
It is most common to test at a ratio close to 0, e.g. 0.1 (≈ pulsating load) or -1 (= alternating load, e.g.push-pull). However, it shall be noted that testing with mean stress Sm = constant and stress ratio R =constant will in general give different S-N curves. Therefore, it is important that the experimental basisfor the reference S-N curve corresponds to the type of alternating stress applicable for the component inquestion.
Appendix A
Class guideline — DNV-CG-0041. Edition September 2021 Page 85Ice strengthening of propulsion machinery and hull appendages
DNV AS

Figure 4 Definition of terms related to fatigue testing
The design S-N curve for the considered section of the component in question is then derived by adjustingthe mean S-N curve with the following as found relevant:
— notch influence:
a) geometrical stress concentrationb) notch sensitivity/stress gradient influence.
— surface condition (roughness)
— surface hardening
— mean stress influence
— size influences:
a) metallurgical (if the mechanical properties used for the fatigue limit is not achieved fromrepresentative test specimens)
b) statistical (if not already accounted for by a reduction of the mean S-N curve for probability of failure≠ 50%, i.e. reduction by one or more standard deviations).
— required safety factor.
The design S-N curve is then linearised into a curve with two slopes in a double logarithmic chart (log-logscale), see Figure 5. The bi-linear S-N curve for N ≥ 103 stress cycles may be expressed as:
or:
Appendix A
Class guideline — DNV-CG-0041. Edition September 2021 Page 86Ice strengthening of propulsion machinery and hull appendages
DNV AS
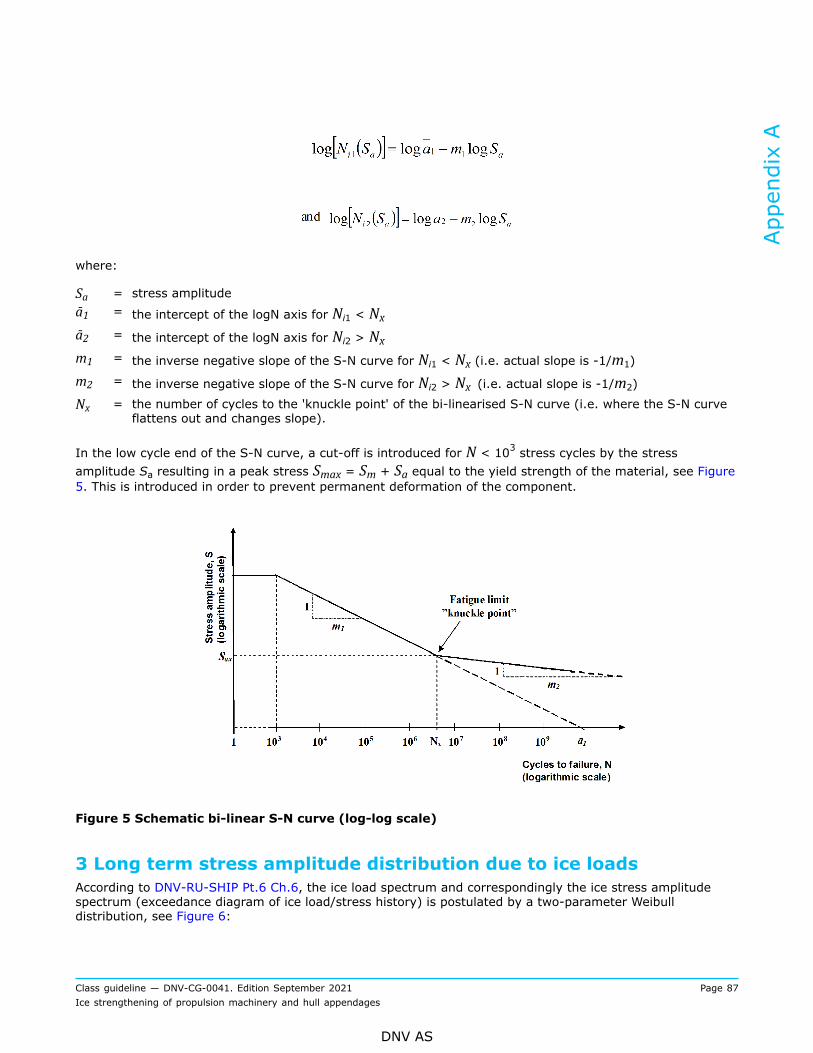
where:
Sa = stress amplitudeā1 = the intercept of the logN axis for Ni1 < Nxā2 = the intercept of the logN axis for Ni2 > Nxm1 = the inverse negative slope of the S-N curve for Ni1 < Nx (i.e. actual slope is -1/m1)
m2 = the inverse negative slope of the S-N curve for Ni2 > Nx (i.e. actual slope is -1/m2)
Nx = the number of cycles to the 'knuckle point' of the bi-linearised S-N curve (i.e. where the S-N curveflattens out and changes slope).
In the low cycle end of the S-N curve, a cut-off is introduced for N < 103 stress cycles by the stressamplitude Sa resulting in a peak stress Smax = Sm + Sa equal to the yield strength of the material, see Figure5. This is introduced in order to prevent permanent deformation of the component.
Figure 5 Schematic bi-linear S-N curve (log-log scale)
3 Long term stress amplitude distribution due to ice loadsAccording to DNV-RU-SHIP Pt.6 Ch.6, the ice load spectrum and correspondingly the ice stress amplitudespectrum (exceedance diagram of ice load/stress history) is postulated by a two-parameter Weibulldistribution, see Figure 6:
Appendix A
Class guideline — DNV-CG-0041. Edition September 2021 Page 87Ice strengthening of propulsion machinery and hull appendages
DNV AS

where:
Sa(n) = load/stress amplitude spectrum as a function of load/stress cyclesk = Weibull shape parameter as given by DNV-RU-SHIP Pt.6 Ch.6n = number of load/stress cyclesn0 = total number of load/stress cycles in the Weibull distribution as calculated for the component in
question according to DNV-RU-SHIP Pt.6 Ch.6 App.A
qw = Weibull scale parameter is defined from the highest stress amplitude, Sa0, as:
Sa0 = the highest stress amplitude out of n0 cycles, i.e. the highest stress amplitude in the Weibull
distribution calculated for the component in question according to DNV-RU-SHIP Pt.6 Ch.6 App.A.This load/stress has a probability for being exceeded equal to 1/n0, see Figure 7 b).
Figure 6 Weibull stress distribution with k = 1.0 and n0 = 5·107 cycles
Appendix A
Class guideline — DNV-CG-0041. Edition September 2021 Page 88Ice strengthening of propulsion machinery and hull appendages
DNV AS

The corresponding probability density function and probability of exceedance function of the two-parameterWeibull distribution are:
where:
f(Sa) = probability density function of the stress amplitude Sa, see Figure 7 a)Q(Sa) = probability for exceedance of the stress amplitude Sa, see Figure 7 b)
Figure 7 Probability density and Probability functions of Weibull distribution with k = 1.0, n0 =5·107 cycles and qw = 3.38
Appendix A
Class guideline — DNV-CG-0041. Edition September 2021 Page 89Ice strengthening of propulsion machinery and hull appendages
DNV AS

4 Calculation of the Palmgren-Miner’s damage sum
4.1 By using stress histogramsIf the general procedure described in [1] for calculating the damage sum shall be applied, the Weibull stressdistribution described in [3] shall be transformed to a representative histogram with I columns (i.e. discretefrequency spectrum). The numerical accuracy of the damage sum depends on the transformation method(distribution of columns) and the total number of columns, I used.
For the method described below, the total number of columns, I, should not be less than 10, see Figure 8.
The ordinate (stress amplitudes) of the Weibull stress distribution is divided into z equidistant stresscolumns. The stress amplitude in each of the column will then be:
which for 10 columns become:
where:
Sai = the stress amplitude of column iI = total number columns in the stress distribution histogramSa0 = the highest stress amplitude out of n0 cycles, i.e. the highest stress amplitude in the Weibull
distribution calculated for the component in question according to DNV-RU-SHIP Pt.6 Ch.6. Thisload/stress has a probability for being exceeded equal to 1/n0, see Figure 7 b).
Since the Weibull stress distribution is an accumulated continuous spectrum, the individual stress amplitudesof the columns are then calculated by:
where:
ni = number of stress cycles in column in0 = total number of stress cycles in the Weibull distribution as calculated for the component in question
according to DNV-RU-SHIP Pt.6 Ch.6I = total number columns in the stress distribution histogramk = Weibull shape parameter as given by DNV-RU-SHIP Pt.6 Ch.6.
The calculation of the damage sum will be on the safe side since the number of cycles in each of the columnsin the histogram is higher than given by the Weibull distribution, i.e. the height of the columns exceeds theWeibull distribution, see Figure 8. Consequently, the fewer stress blocks used the more conservative is thecalculated damage sum.
Appendix A
Class guideline — DNV-CG-0041. Edition September 2021 Page 90Ice strengthening of propulsion machinery and hull appendages
DNV AS

Figure 8 Stress amplitude distribution divided into I=10 stress blocks k = 1.0 and n0 = 8.8·107cycles
4.2 By using closed form solutionIf the component is subject to n0 number of randomly distributed stress cycles in total with a Weibullprobability function f(Sa), the number of cycles with stress amplitudes within Sa and (Sa + dSa) is n0· f(Sa)·dSa. Since the mathematical expression for the S-N curve S(Ni) is known, the fatigue damaged ratio MDRcan be expressed in a closed form by direct integration of damage below each part of the bi-linear S-N curve,see Figure 9:
where:
n0 = total number of load/stress cycles in the Weibull distribution as calculated for the componentin question according to DNV-RU-SHIP Pt.6 Ch.6 App.A
Sax = the fatigue limit (stress amplitude) at the change of slope ('knuckle point'), see Figure 5Sa0 = The highest stress amplitude out of n0 cycles, i.e. the highest stress amplitude in the Weibull
distribution calculated for the component in question according to DNV-RU-SHIP Pt.6 Ch.6App.A
f(Sa) = probability density function of the stress amplitude Sa, see [3]
Appendix A
Class guideline — DNV-CG-0041. Edition September 2021 Page 91Ice strengthening of propulsion machinery and hull appendages
DNV AS

Ni1(Sa) = S-N curve for 103 ≤ N ≤ Nx stress cycles, see [2]Ni2(Sa) = S-N curve for N ≥ Nx stress cycles, see [2]Nx = the number of cycles to the 'knuckle point' of the bi-linearised S-N curve (i.e. where the S-N
curve flattens out and changes slope), see [2].
These definite integrals can be numerically evaluated by various methods, e.g. Recursive Trapezoid rule,Romberg algorithm or Adaptive Simpson’s rule.
Figure 9 Direct integration of damage below each part of the bi-linear S-N curve
5 Guidance to when detailed fatigue analysis can be omittedA detailed fatigue analysis can be omitted if the largest stress amplitude in the Weibull distribution for theactual detail (section of the component in question) is less than the fatigue limit at the 'knuckle point', seeFigure 10 a).For components where a yield criterion is introduced, it would be meaningless to carry out detailed fatigueanalysis when the peak stress = largest stress amplitude in the Weibull distribution + the mean stress ishigher than the yield strength of the component (including the effect of any stress concentrations), seeFigure 10 b).
Appendix A
Class guideline — DNV-CG-0041. Edition September 2021 Page 92Ice strengthening of propulsion machinery and hull appendages
DNV AS
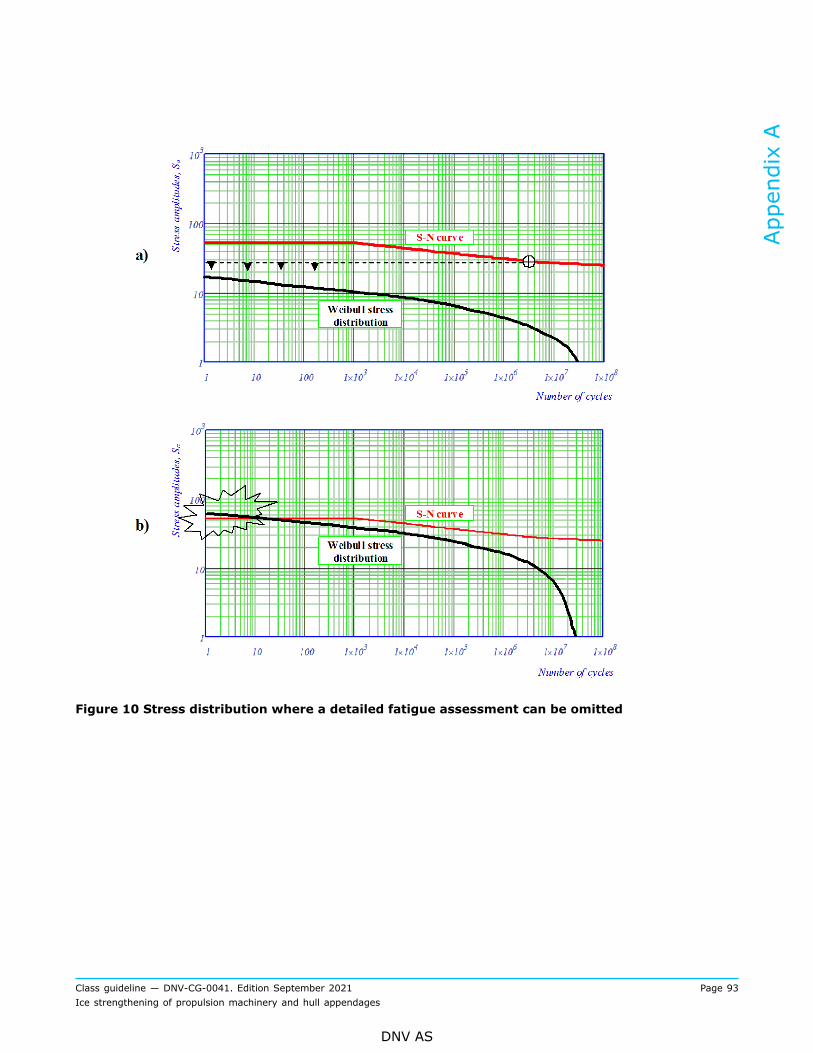
Figure 10 Stress distribution where a detailed fatigue assessment can be omitted
Appendix A
Class guideline — DNV-CG-0041. Edition September 2021 Page 93Ice strengthening of propulsion machinery and hull appendages
DNV AS

CHANGES – HISTORIC
July 2020 edition
Changes July 2020Topic Reference Description
Reinforcement and ice load ontunnel thruster grid
Sec.8 [2] Methods and possible loading conditions have been included asguidelines.
July 2019 edition
Changes July 2019Topic Reference Description
Front page Title changed to Ice strengthening of propulsion machinery andhull appendages to include rudders and propeller nozzles, seenew Sec.8.
Defining class current practicefor calculation of ice loads onappendages for vessels withclass notation PC.
Sec.8 New section on ice load calculation for ships with class notationPC explaining how loads should be applied for differentappendages such as rudder, nozzle and shaft brackets.
March 2016 editionThis is a new document.
Changes – historic
Class guideline — DNV-CG-0041. Edition September 2021 Page 94Ice strengthening of propulsion machinery and hull appendages
DNV AS

About DNVDNV is the independent expert in risk management and assurance, operating in more than 100countries. Through its broad experience and deep expertise DNV advances safety and sustainableperformance, sets industry benchmarks, and inspires and invents solutions.
Whether assessing a new ship design, optimizing the performance of a wind farm, analyzing sensordata from a gas pipeline or certifying a food company’s supply chain, DNV enables its customers andtheir stakeholders to make critical decisions with confidence.
Driven by its purpose, to safeguard life, property, and the environment, DNV helps tackle thechallenges and global transformations facing its customers and the world today and is a trustedvoice for many of the world’s most successful and forward-thinking companies.
WHEN TRUST MATTERS