dm - global marine freight
TRANSCRIPT

www.datamonitor.com Datamonitor USA 245 Fifth Avenue 4th Floor New York, NY 10016 USA t: +1 212 686 7400 f: +1 212 686 2626 e: [email protected]
Datamonitor Europe 119 Farringdon Road London EC1R 3DA United Kingdom t: +44 20 7551 9000 f: +44 20 7675 7500 e: [email protected]
Datamonitor Middle East and North Africa Datamonitor PO Box 24893 Dubai, UAE t: +49 69 9754 4517 f: +49 69 9754 4900 e: datamonitormena@ datamonitor.com
Datamonitor Asia Pacific Level 46, 2 Park Street Sydney, NSW 2000 Australia t: +61 2 8705 6900 f: +61 2 8705 6901 e: [email protected]
Global - Marine Freight 0199 - 2101 - 2010
© Datamonitor. This profile is a licensed product and is not to be photocopied Page 1
INDUSTRY PROFILE
Global Marine Freight
Reference Code: 0199-2101
Publication Date: November 2010

EXECUTIVE SUMMARY
Global - Marine Freight 0199 - 2101 - 2010
© Datamonitor. This profile is a licensed product and is not to be photocopied Page 2
EXECUTIVE SUMMARY
Market value
The global marine freight industry grew by 12.4% in 2010 to reach a value of $336.5 billion.
Market value forecast
In 2015, the global marine freight industry is forecast to have a value of $446.2 billion, an increase of 32.6% since 2010.
Market segmentation I
Sea is the largest segment of the global marine freight industry, accounting for 69.1% of the industry's total value.
Market segmentation II
Asia-Pacific accounts for 52.9% of the global marine freight industry value.
Market rivalry
Enterprises using freight transport for large quantities of raw materials, such as chemicals, petroleum products, and coal, have significant financial muscle, which together with the limited potential for service differentiation strengthens buyers’ power.

CONTENTS
Global - Marine Freight 0199 - 2101 - 2010
© Datamonitor. This profile is a licensed product and is not to be photocopied Page 3
TABLE OF CONTENTS
EXECUTIVE SUMMARY 2
MARKET OVERVIEW 7
Market definition 7 Research highlights 8 Market analysis 9
MARKET VALUE 10
MARKET SEGMENTATION I 11
MARKET SEGMENTATION II 12
FIVE FORCES ANALYSIS 13
Summary 13 Buyer power 14 Supplier power 15 New entrants 16 Substitutes 18 Rivalry 19
LEADING COMPANIES 20
A.P. Moller-Maersk Group 20 Nippon Yusen Kabushiki Kaisha 25 Kuehne + Nagel International AG 29 Mitsui O.S.K. Lines, Ltd. 34
MARKET FORECASTS 38
Market value forecast 38 APPENDIX 39
Methodology 39 Industry associations 40 Related Datamonitor research 40 Disclaimer 41
ABOUT DATAMONITOR 42

CONTENTS
Global - Marine Freight 0199 - 2101 - 2010
© Datamonitor. This profile is a licensed product and is not to be photocopied Page 4
Premium Reports 42 Summary Reports 42 Datamonitor consulting 42

CONTENTS
Global - Marine Freight 0199 - 2101 - 2010
© Datamonitor. This profile is a licensed product and is not to be photocopied Page 5
LIST OF TABLES Table 1: Global marine freight industry value: $ billion, 2006–10(e) 10
Table 2: Global marine freight industry segmentation I:% share, by value, 2010(e) 11
Table 3: Global marine freight industry segmentation II: % share, by value, 2010(e) 12
Table 4: A.P. Moller-Maersk Group: key facts 20
Table 5: A.P. Moller-Maersk Group: key financials ($) 22
Table 6: A.P. Moller-Maersk Group: key financials (DKK) 23
Table 7: A.P. Moller-Maersk Group: key financial ratios 23
Table 8: Nippon Yusen Kabushiki Kaisha: key facts 25
Table 9: Nippon Yusen Kabushiki Kaisha: key financials ($) 27
Table 10: Nippon Yusen Kabushiki Kaisha: key financials (¥) 27
Table 11: Nippon Yusen Kabushiki Kaisha: key financial ratios 27
Table 12: Kuehne + Nagel International AG: key facts 29
Table 13: Kuehne + Nagel International AG: key financials ($) 31
Table 14: Kuehne + Nagel International AG: key financials ($) 32
Table 15: Kuehne + Nagel International AG: key financial ratios 32
Table 16: Mitsui O.S.K. Lines, Ltd.: key facts 34
Table 17: Mitsui O.S.K. Lines, Ltd.: key financials ($) 35
Table 18: Mitsui O.S.K. Lines, Ltd.: key financials (¥) 36
Table 19: Mitsui O.S.K. Lines, Ltd.: key financial ratios 36
Table 20: Global marine freight industry value forecast: $ billion, 2010–15 38
CONTENTS
Global - Marine Freight 0199 - 2101 - 2010
© Datamonitor. This profile is a licensed product and is not to be photocopied Page 6
LIST OF FIGURES Figure 1: Global marine freight industry value: $ billion, 2006–10(e) 10
Figure 2: Global marine freight industry segmentation I:% share, by value, 2010(e) 11
Figure 3: Global marine freight industry segmentation II: % share, by value, 2010(e) 12
Figure 4: Forces driving competition in the global marine freight industry, 2010 13
Figure 5: Drivers of buyer power in the global marine freight industry, 2010 14
Figure 6: Drivers of supplier power in the global marine freight industry, 2010 15
Figure 7: Factors influencing the likelihood of new entrants in the global marine freight industry, 2010 16
Figure 8: Factors influencing the threat of substitutes in the global marine freight industry, 2010 18
Figure 9: Drivers of degree of rivalry in the global marine freight industry, 2010 19
Figure 10: A.P. Moller-Maersk Group: revenues & profitability 24
Figure 11: A.P. Moller-Maersk Group: assets & liabilities 24
Figure 12: Nippon Yusen Kabushiki Kaisha: revenues & profitability 28
Figure 13: Nippon Yusen Kabushiki Kaisha: assets & liabilities 28
Figure 14: Kuehne + Nagel International AG: revenues & profitability 33
Figure 15: Kuehne + Nagel International AG: assets & liabilities 33
Figure 16: Mitsui O.S.K. Lines, Ltd.: revenues & profitability 37
Figure 17: Mitsui O.S.K. Lines, Ltd.: assets & liabilities 37
Figure 18: Global marine freight industry value forecast: $ billion, 2010–15 38

MARKET OVERVIEW
Global - Marine Freight 0199 - 2101 - 2010
© Datamonitor. This profile is a licensed product and is not to be photocopied Page 7
MARKET OVERVIEW
Market definition
The marine freight sector is defined as consisting of revenues generated from freight transportation by ship, including the sea and inland waterways modes. The sector includes both domestic and international freight, which for the purposes of this report are counted in the country of origin. Any currency conversions used in the creation of this report have been calculated using constant 2009 annual average exchange rates.
For the purposes of this report, the global market consists of North America, South America, Western Europe, Eastern Europe, and Asia-Pacific.
North America consists of Canada, Mexico, and the United States.
South America comprises Argentina, Brazil, Chile, Colombia, and Venezuela.
Western Europe comprises Belgium, Denmark, France, Germany, Italy, the Netherlands, Norway, Spain, Sweden, and the United Kingdom.
Eastern Europe comprises the Czech Republic, Hungary, Poland, Romania, Russia, and Ukraine.
Asia-Pacific comprises Australia, China, India, Japan, Singapore, South Korea, and Taiwan.

MARKET OVERVIEW
Global - Marine Freight 0199 - 2101 - 2010
© Datamonitor. This profile is a licensed product and is not to be photocopied Page 8
Research highlights
The global marine freight industry is expected to have total revenue of $336.5 billion in 2010, representing a compound annual growth rate (CAGR) of 1.5% for the period spanning 2006-2010.
The sea segment is expected to be the industry's most lucrative in 2010, with total revenue of $232.4 billion, equivalent to 69% of the industry's overall value.
The performance of the industry is forecast to accelerate, with an anticipated CAGR of 5.8% for the five-year period 2010-2015, which is expected to drive the industry to a value of $446.2 billion by the end of 2015.
MARKET OVERVIEW
Global - Marine Freight 0199 - 2101 - 2010
© Datamonitor. This profile is a licensed product and is not to be photocopied Page 9
Market analysis
The global marine freight industry declined sharply in 2009, as a result of the global economic downturn. It is however expected to rebound strongly in 2010, showing double-digit growth, before settling in to steady growth towards the end of the forecast period.
The global marine freight industry is expected to have total revenue of $336.5 billion in 2010, representing a compound annual growth rate (CAGR) of 1.5% for the period spanning 2006-2010. In comparison, the European industry will decline with a compound annual rate of change (CARC) of -0.1%, while the Asia-Pacific industry is expected to increase with a CAGR of 2.8%, over the same period, to reach respective values of $70.6 billion and $178 billion in 2010.
The sea segment is expected to be the industry's most lucrative in 2010, with total revenue of $232.4 billion, equivalent to 69.1% of the industry's overall value. The inland waterways segment is forecast to contribute revenue of $104.2 billion in 2010, equating to 31% of the industry's aggregate value.
The performance of the industry is forecast to accelerate, with an anticipated CAGR of 5.8% for the five-year period 2010-2015, which is expected to drive the industry to a value of $446.2 billion by the end of 2015. Comparatively, the European and Asia-Pacific industries will grow with CAGRs of 3.2% and 8.2% respectively, over the same period, to reach respective values of $82.6 billion and $264.1 billion in 2015.
MARKET VALUE
Global - Marine Freight 0199 - 2101 - 2010
© Datamonitor. This profile is a licensed product and is not to be photocopied Page 10
MARKET VALUE
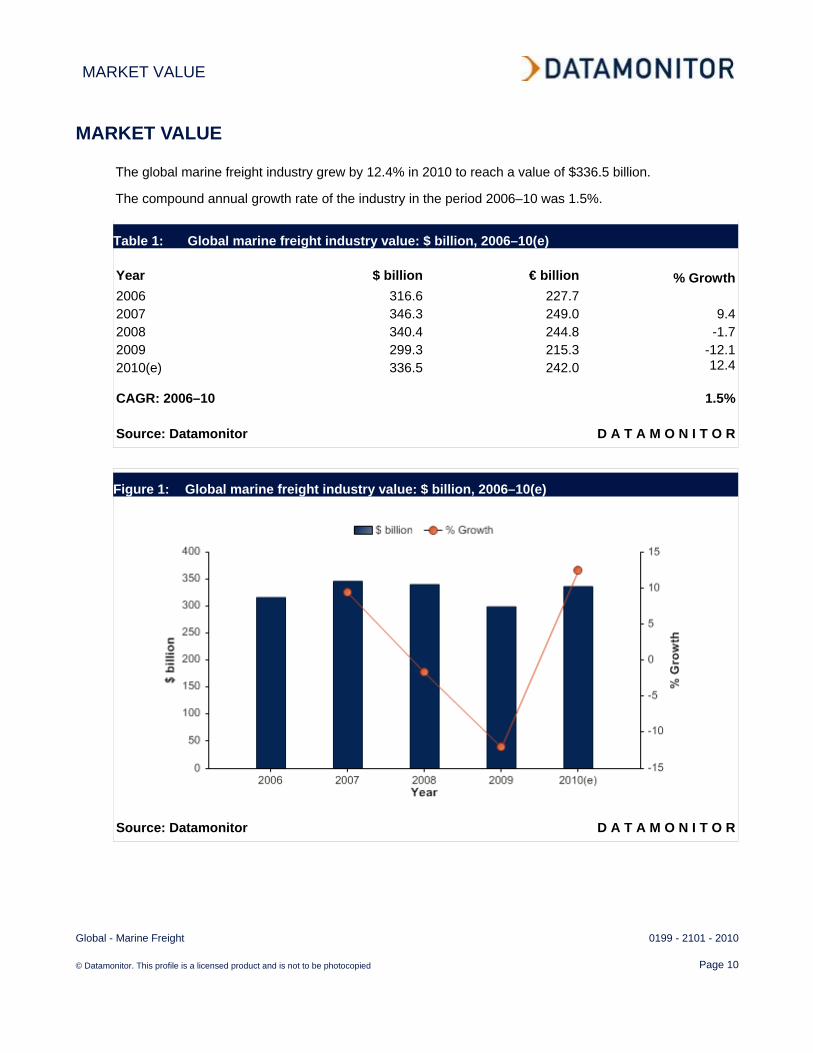
The global marine freight industry grew by 12.4% in 2010 to reach a value of $336.5 billion.
The compound annual growth rate of the industry in the period 2006–10 was 1.5%.
Table 1: Global marine freight industry value: $ billion, 2006–10(e) Year $ billion € billion % Growth2006 316.6 227.7 2007 346.3 249.0 9.42008 340.4 244.8 -1.72009 299.3 215.3 -12.12010(e) 336.5 242.0 12.4
CAGR: 2006–10 1.5%
Source: Datamonitor D A T A M O N I T O R
Figure 1: Global marine freight industry value: $ billion, 2006–10(e)
Source: Datamonitor D A T A M O N I T O R

MARKET SEGMENTATION I
Global - Marine Freight 0199 - 2101 - 2010
© Datamonitor. This profile is a licensed product and is not to be photocopied Page 11
MARKET SEGMENTATION I
Sea is the largest segment of the global marine freight industry, accounting for 69.1% of the industry's total value.
The inland waterways segment accounts for a further 31% of the industry.
Table 2: Global marine freight industry segmentation I:% share, by value, 2010(e) Category % ShareSea 69.1%Inland Waterways 31.0%Other 0.0%
Total 100%
Source: Datamonitor D A T A M O N I T O R
Figure 2: Global marine freight industry segmentation I:% share, by value, 2010(e)
Source: Datamonitor D A T A M O N I T O R
MARKET SEGMENTATION II
Global - Marine Freight 0199 - 2101 - 2010
© Datamonitor. This profile is a licensed product and is not to be photocopied Page 12
MARKET SEGMENTATION II
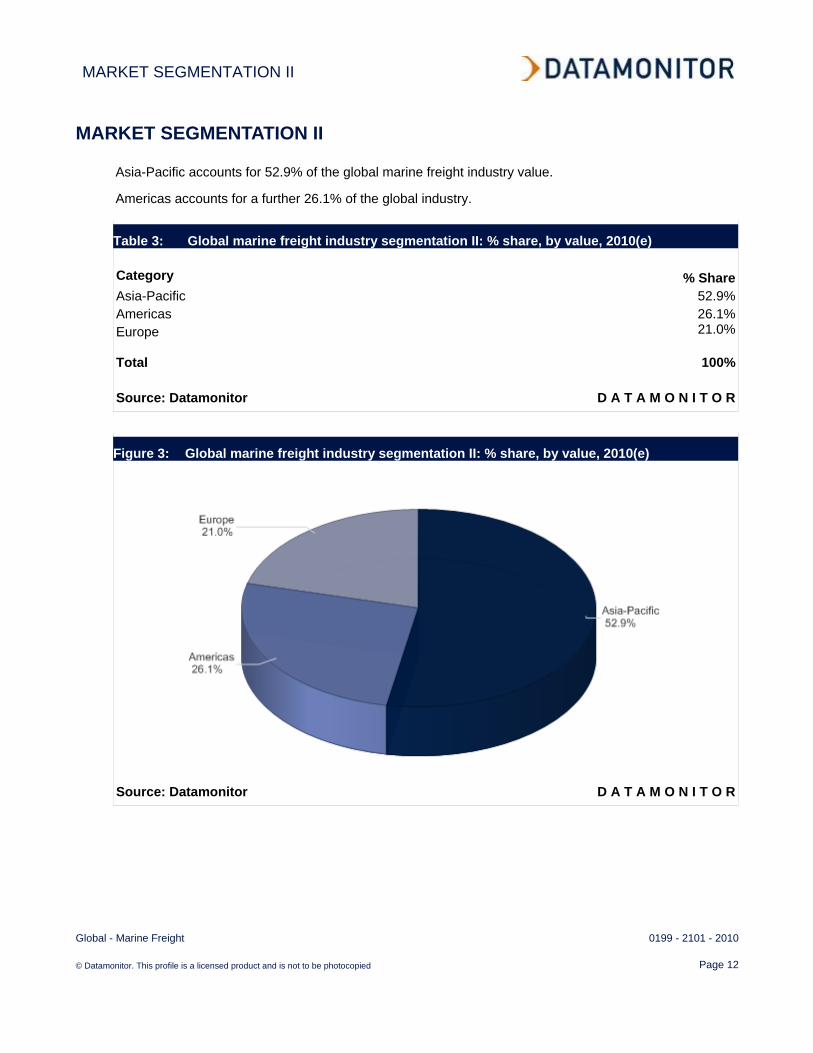
Asia-Pacific accounts for 52.9% of the global marine freight industry value.
Americas accounts for a further 26.1% of the global industry.
Table 3: Global marine freight industry segmentation II: % share, by value, 2010(e) Category % ShareAsia-Pacific 52.9%Americas 26.1%Europe 21.0%
Total 100%
Source: Datamonitor D A T A M O N I T O R
Figure 3: Global marine freight industry segmentation II: % share, by value, 2010(e)
Source: Datamonitor D A T A M O N I T O R
FIVE FORCES ANALYSIS
Global - Marine Freight 0199 - 2101 - 2010
© Datamonitor. This profile is a licensed product and is not to be photocopied Page 13
FIVE FORCES ANALYSIS
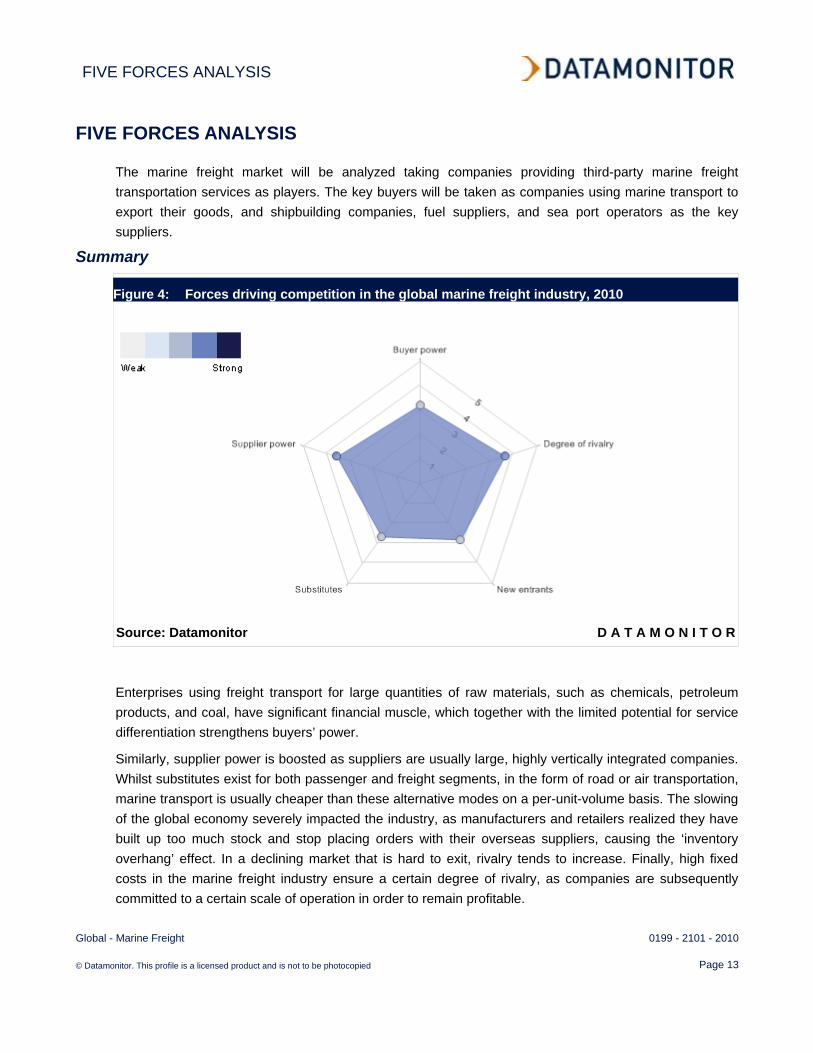
The marine freight market will be analyzed taking companies providing third-party marine freight transportation services as players. The key buyers will be taken as companies using marine transport to export their goods, and shipbuilding companies, fuel suppliers, and sea port operators as the key suppliers.
Summary
Figure 4: Forces driving competition in the global marine freight industry, 2010
Source: Datamonitor D A T A M O N I T O R
Enterprises using freight transport for large quantities of raw materials, such as chemicals, petroleum products, and coal, have significant financial muscle, which together with the limited potential for service differentiation strengthens buyers’ power.
Similarly, supplier power is boosted as suppliers are usually large, highly vertically integrated companies. Whilst substitutes exist for both passenger and freight segments, in the form of road or air transportation, marine transport is usually cheaper than these alternative modes on a per-unit-volume basis. The slowing of the global economy severely impacted the industry, as manufacturers and retailers realized they have built up too much stock and stop placing orders with their overseas suppliers, causing the ‘inventory overhang’ effect. In a declining market that is hard to exit, rivalry tends to increase. Finally, high fixed costs in the marine freight industry ensure a certain degree of rivalry, as companies are subsequently committed to a certain scale of operation in order to remain profitable.
FIVE FORCES ANALYSIS
Global - Marine Freight 0199 - 2101 - 2010
© Datamonitor. This profile is a licensed product and is not to be photocopied Page 14
Buyer power
Figure 5: Drivers of buyer power in the global marine freight industry, 2010
Source: Datamonitor D A T A M O N I T O R
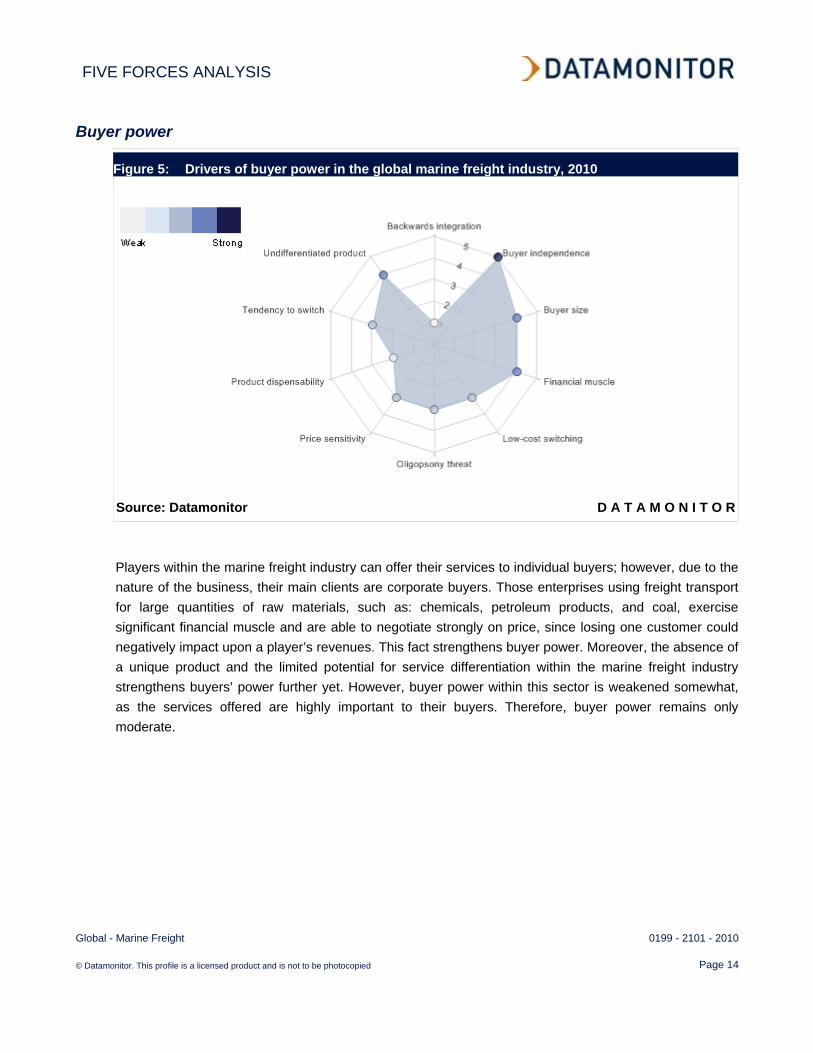
Players within the marine freight industry can offer their services to individual buyers; however, due to the nature of the business, their main clients are corporate buyers. Those enterprises using freight transport for large quantities of raw materials, such as: chemicals, petroleum products, and coal, exercise significant financial muscle and are able to negotiate strongly on price, since losing one customer could negatively impact upon a player’s revenues. This fact strengthens buyer power. Moreover, the absence of a unique product and the limited potential for service differentiation within the marine freight industry strengthens buyers’ power further yet. However, buyer power within this sector is weakened somewhat, as the services offered are highly important to their buyers. Therefore, buyer power remains only moderate.

FIVE FORCES ANALYSIS
Global - Marine Freight 0199 - 2101 - 2010
© Datamonitor. This profile is a licensed product and is not to be photocopied Page 15
Supplier power
Figure 6: Drivers of supplier power in the global marine freight industry, 2010
Source: Datamonitor D A T A M O N I T O R
There are various suppliers to marine freight industry; however; fuel is a key input. Due to the nature of the business, the marine industry is highly dependant on diesel fuel, thereby strengthening the power of its suppliers. Additionally, fuel providers are usually large sized, highly vertically integrated companies, boosting their power furthermore. Fluctuating fuel prices and USD exchange rates emerging from a slowing global economy are likely to impact negatively on suppliers revenues; whilst the lack of product differentiation will somewhat weaken supplier power. The rise of the process of ‘containerization’ whereby freight companies use standardized containers to load ships, trains, planes and trucks means that around 90% of all non bulk goods are transported in containers. The containers themselves are therefore important inputs. The marine freight industry must also shoulder acquisition of ships, which can require large capital outlay. Finally, companies must secure access to key ports and overcome the pressures of congestion; navigating these needs is not easy. Likelihood of forward integration is extremely low within this industry. Supplier power is strong overall within the marine freight industry.

FIVE FORCES ANALYSIS
Global - Marine Freight 0199 - 2101 - 2010
© Datamonitor. This profile is a licensed product and is not to be photocopied Page 16
New entrants
Figure 7: Factors influencing the likelihood of new entrants in the global marine freight industry,
2010
Source: Datamonitor D A T A M O N I T O R
Entering the marine freight industry is most likely to involve large capital outlay. Presently, large companies within this sector benefit from economies of scale; which may serve to deter many smaller, otherwise interested parties. High fixed costs can only be fruitfully overcome by a large volume of passengers or goods. This fact favors ships with higher capacities, which are more expensive to purchase initially and tends to discourage newcomers with insufficient capital. As marine freight is a highly regulated industry and shipping inherently international, the industry is subject to uniform regulations on matters, such as: construction standards, navigational rules and standards of crew competence amongst others. The marine freight regulator, The International Maritime Organization (IMO), which has been given a mandate by the UN to deal with subjects specific to maritime activity, imposes regulations to discourage or even legally forbid certain parties from entering the industry. In addition, most countries also have their own domestic laws and regulations. The United Nations Convention on Contracts for the International Carriage of Goods Wholly or Partly by Sea, known as the Rotterdam Rules (RR), which aims to harmonize the world’s legal framework for the maritime transport of goods, if ratified by member states will likely impact upon the marine freight industry’ trade flow and competition on the global stage. The Rotterdam Rules concern issues such as the responsibility of marine carriers for the safe delivery of freight. It is clear that the industry is highly regulated and this will continue.

FIVE FORCES ANALYSIS
Global - Marine Freight 0199 - 2101 - 2010
© Datamonitor. This profile is a licensed product and is not to be photocopied Page 17
However, these changes are generally predictable, as the authorities allow for an adaptation phase that is compatible with the realities of the marine industry. The changes are likely to consist of new technical rules applicable to new vessels in the area of emissions into the atmosphere; restrictions on navigation in certain regions; a hardening of controls and sanctions; the establishment of an environmental tax system, i.e. one already applied in Norway. Evidently, this excludes many potential entrants. Whilst new players are attracted by the low level of product differentiation- enticing potential players to replicate the success of current actors in the industry - the relatively weak branding exacerbates the problem. Overall, the threat of new entrants is moderate.
FIVE FORCES ANALYSIS
Global - Marine Freight 0199 - 2101 - 2010
© Datamonitor. This profile is a licensed product and is not to be photocopied Page 18
Substitutes
Figure 8: Factors influencing the threat of substitutes in the global marine freight industry, 2010
Source: Datamonitor D A T A M O N I T O R
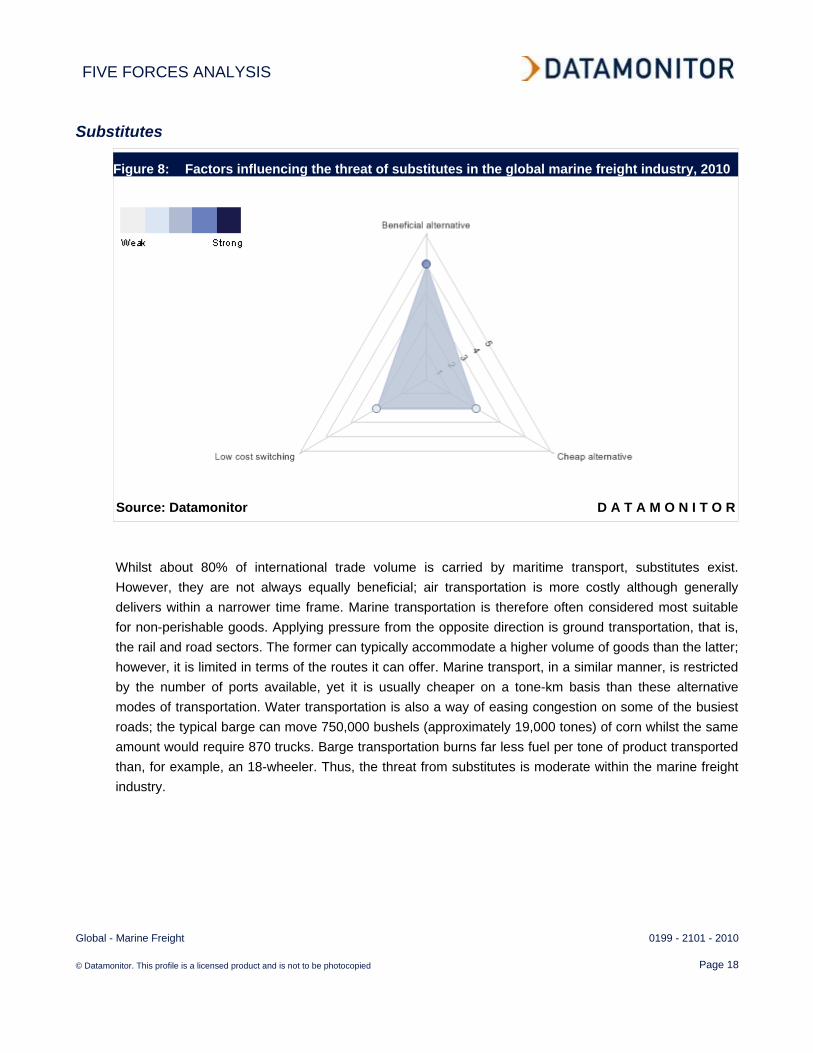
Whilst about 80% of international trade volume is carried by maritime transport, substitutes exist. However, they are not always equally beneficial; air transportation is more costly although generally delivers within a narrower time frame. Marine transportation is therefore often considered most suitable for non-perishable goods. Applying pressure from the opposite direction is ground transportation, that is, the rail and road sectors. The former can typically accommodate a higher volume of goods than the latter; however, it is limited in terms of the routes it can offer. Marine transport, in a similar manner, is restricted by the number of ports available, yet it is usually cheaper on a tone-km basis than these alternative modes of transportation. Water transportation is also a way of easing congestion on some of the busiest roads; the typical barge can move 750,000 bushels (approximately 19,000 tones) of corn whilst the same amount would require 870 trucks. Barge transportation burns far less fuel per tone of product transported than, for example, an 18-wheeler. Thus, the threat from substitutes is moderate within the marine freight industry.

FIVE FORCES ANALYSIS
Global - Marine Freight 0199 - 2101 - 2010
© Datamonitor. This profile is a licensed product and is not to be photocopied Page 19
Rivalry
Figure 9: Drivers of degree of rivalry in the global marine freight industry, 2010
Source: Datamonitor D A T A M O N I T O R
High fixed costs in the marine freight industry ensure a certain degree of rivalry, as companies are subsequently committed to a certain scale of operations, in order to remain profitable. Additionally, leaving the sector would require substantial divestments, as main assets (i.e. container and bulk cargo ships) are highly specific to the business, which raises exit barriers. The low level of service differentiation and the heavy reliance on this industry by companies operating exclusively in the area further escalates competition. This is likely to be intensified by the recent economic turmoil - as the acquisition of goods slowed globally; it undermined growth within the transportation industry. Worldwide economic malaise will continue to affect the global shipping market in 2010, whilst recent imbalances in shipping supply and demand will continue to cause major fluctuations in freight rates. This disparity between capacity and demand is forecast to continue, affecting the global shipping industry in the future, which will significantly impact upon revenues and boost the competition. Rivalry, additionally boosted by recent decline in industry value, is estimated as strong within the marine freight industry. However, the industry is expected to rebound strongly this year, and this coupled with decent growth prognoses, may alleviate this threat to some extent.
LEADING COMPANIES
Global - Marine Freight 0199 - 2101 - 2010
© Datamonitor. This profile is a licensed product and is not to be photocopied Page 20
LEADING COMPANIES
A.P. Moller-Maersk Group
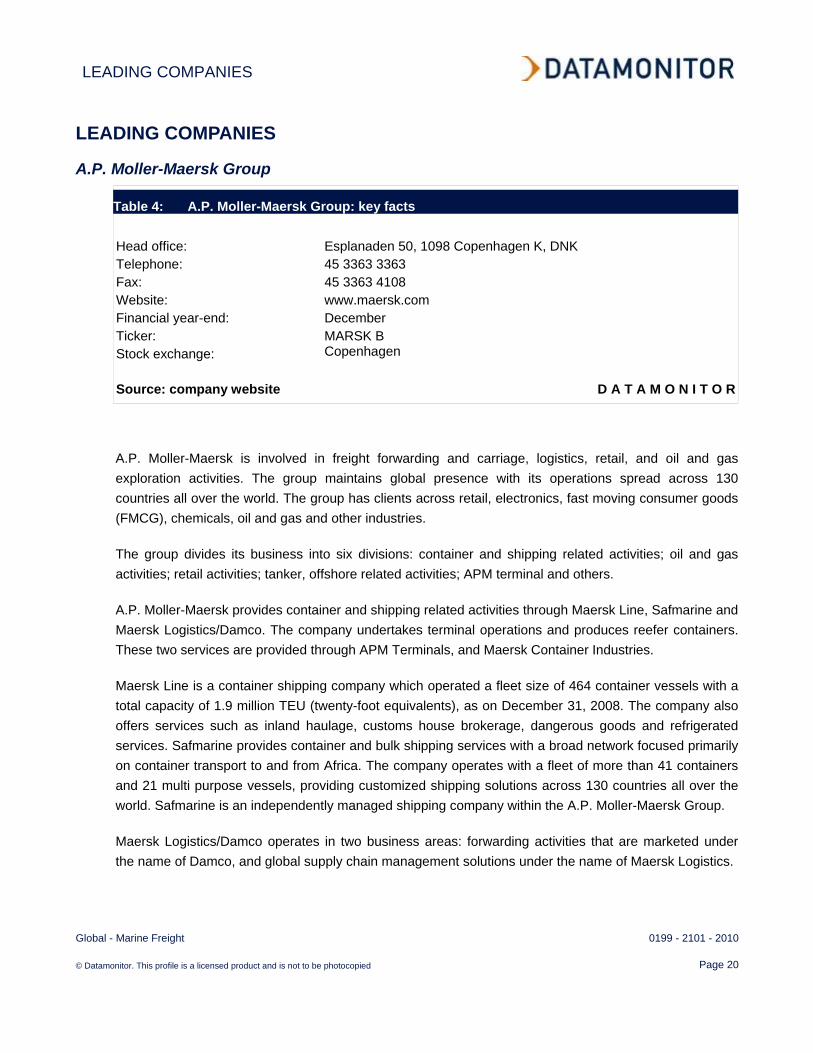
Table 4: A.P. Moller-Maersk Group: key facts Head office: Esplanaden 50, 1098 Copenhagen K, DNK Telephone: 45 3363 3363 Fax: 45 3363 4108 Website: www.maersk.com Financial year-end: December Ticker: MARSK B Stock exchange: Copenhagen Source: company website D A T A M O N I T O R
A.P. Moller-Maersk is involved in freight forwarding and carriage, logistics, retail, and oil and gas exploration activities. The group maintains global presence with its operations spread across 130 countries all over the world. The group has clients across retail, electronics, fast moving consumer goods (FMCG), chemicals, oil and gas and other industries.
The group divides its business into six divisions: container and shipping related activities; oil and gas activities; retail activities; tanker, offshore related activities; APM terminal and others.
A.P. Moller-Maersk provides container and shipping related activities through Maersk Line, Safmarine and Maersk Logistics/Damco. The company undertakes terminal operations and produces reefer containers. These two services are provided through APM Terminals, and Maersk Container Industries.
Maersk Line is a container shipping company which operated a fleet size of 464 container vessels with a total capacity of 1.9 million TEU (twenty-foot equivalents), as on December 31, 2008. The company also offers services such as inland haulage, customs house brokerage, dangerous goods and refrigerated services. Safmarine provides container and bulk shipping services with a broad network focused primarily on container transport to and from Africa. The company operates with a fleet of more than 41 containers and 21 multi purpose vessels, providing customized shipping solutions across 130 countries all over the world. Safmarine is an independently managed shipping company within the A.P. Moller-Maersk Group.
Maersk Logistics/Damco operates in two business areas: forwarding activities that are marketed under the name of Damco, and global supply chain management solutions under the name of Maersk Logistics.

LEADING COMPANIES
Global - Marine Freight 0199 - 2101 - 2010
© Datamonitor. This profile is a licensed product and is not to be photocopied Page 21
These companies primarily provide customized and integrated solutions for operations such as supply chain management, warehousing and distribution, ocean freight and air freight. The company primarily provides its services to retail, electronics, FMCG and chemical industries.
Maersk Oil is a midsize international oil and gas company operating an oil production of about 650,000 barrels per day and gas production of nearly 1,000 million cubic feet per day. The company has a net equity production exceeding 550,000 barrels of oil equivalents per day from fields in the Danish and British part of the North Sea (Denmark, Norway, Great Britain, Germany); Middle East (Qatar and Oman); South America (Brazil and Suriname); and the US sector of the Gulf of Mexico. In FY2008, the oil and gas production operated by Maersk Oil grew by 7% to 286 million barrels of oil equivalents.
The group operates the retail business through Dansk Supermarked. Dansk Supermarked is a chain of food and general merchandise stores based in Denmark. The company has its operations across England, Germany, and Poland. F. Salling (with 37.7% stake) and A.P. Moller-Maersk (with 62.3% stake) jointly own the company. The Dansk Supermarked group comprises a range of retail concepts such as, Bilka (hypermarkets in Denmark), Fotex (quality supermarkets in Denmark), Salling (department stores in Denmark) and Netto (discount supermarkets in Denmark, Germany, Great Britain, Poland and Sweden). During 2008, the Dansk Supermarket group opened 99 new stores, to raise its total number to 1270 stores.
The company operates its offshore related business through Maersk Tankers, Maersk Contractors and Maersk Supply Service. The company offers solutions for the transport of crude oil, refined products and gas, various supply vessel activities (including anchor-handling, platform supply and cable laying), and door-to-door transport and inter-European freight and passenger transport.
Maersk Tankers owns and operates a fleet of double hulled crude oil carriers, product tankers, gas carriers, LNG carriers and car carriers. The company has a total of 118 tankers (both own and chartered) in the global market for transport of crude oil, refined oil products, petrochemical gases and natural gas.. With the acquisition of Brostrom (a leading logistics companies for the oil and chemical industry), the fleet size of the company increased to 180 vessels.
Maersk contractors provide drilling and production services to oil companies. The company owns and operates a fleet of 18 drilling rigs on a worldwide basis. The company also operates two floating production storage and offloading (FPSO's) ships in the North Sea and one FGSO offshore Congo. Maersk Supply Services is primarily engaged in the field of tow-out and installation of large offshore installations, and other chartering services. The company maintains more than 600 offshore support vessels.
APM Terminals is one of the world's largest operators of container terminals with over 50 terminals spanning 34 countries and five continents. The company is primarily engaged in the development of port infrastructure necessary to meet the future demands of the global container trade.

LEADING COMPANIES
Global - Marine Freight 0199 - 2101 - 2010
© Datamonitor. This profile is a licensed product and is not to be photocopied Page 22
APM Terminals works with governments, country leaders, customers, truckers and the entire shipping industry's players. The division provides services to around 60 customers.
The other businesses of the group are carried through Odense Staalskibsvaerft, Rosti, Norfolkline and SvitzerWijsmuller. Odense Staalskibsvaerft (Odense steel shipyard) operates the Lindo Shipyard in Denmark and is the parent company of the Yard Group, which maintains shipyards across Denmark, Estonia, Lithuania and Germany. The company is primarily engaged in the shipbuilding, ship repair and maintenance, container manufacturing and engineering. During 2008, the Odense Steel Shipyard Group delivered one 11,000 TEU and four 7,000 TEU container vessels to Maersk Line. At the end of 2008 Odense Staalskibsvaerft held orders for two 7,000 TEU container vessels, eight Ro-Ro vessels, eight Cape Size dry cargo vessels and three frigates for the Danish Navy.
Rosti produces and sells a wide range of plastic based products. The company primarily serves electronics, medical, automotive and packaging industries. The company operates through 15 sites in 10 countries on three continents.
Norfolkline, a European logistics company, operates ferry service and Ro-Ro (roll on -roll off) vessels and runs logistics activities in Europe. In 2007, the company transported more than 2.4 million passengers, more than 700,000 vehicles and 1.3 million trailers. SvitzerWijsmuller provides interrelated services in the fields of harbor, coastal, terminal, LNG/Offshore, and ocean towage and salvage services. Svitzer is represented in more than 100 ports and operates more than 500 tugboats and standby vessels.
Key Metrics
The company recorded revenues of $48,550 million in the fiscal year ending December 2009, a decrease of 16.6% compared to fiscal 2008. Its net loss was $1,025 million in fiscal 2009, compared to a net income of $3,293 million in the preceding year.
Table 5: A.P. Moller-Maersk Group: key financials ($) $ million 2005 2006 2007 2008 2009Revenues 38,967.2 48,570.2 52,068.8 58,220.7 48,550.0Net income (loss) 3,751.0 2,904.7 3,328.9 3,293.2 (1,024.9)Total assets 53,315.3 58,570.6 61,259.9 64,062.8 64,452.8Total liabilities 30,147.5 33,045.0 33,871.4 34,488.7 34,790.2Employees 67,498 108,530 117,319 119,599 115,000 Source: company filings D A T A M O N I T O R
LEADING COMPANIES
Global - Marine Freight 0199 - 2101 - 2010
© Datamonitor. This profile is a licensed product and is not to be photocopied Page 23
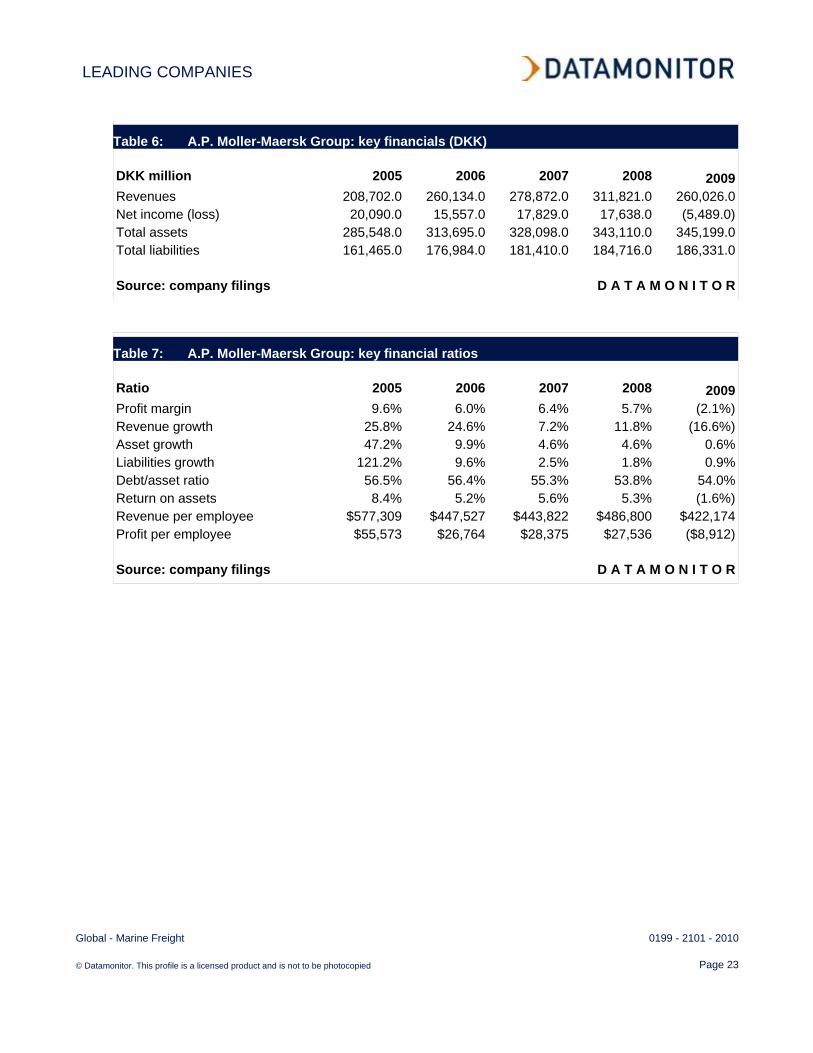
Table 6: A.P. Moller-Maersk Group: key financials (DKK) DKK million 2005 2006 2007 2008 2009Revenues 208,702.0 260,134.0 278,872.0 311,821.0 260,026.0Net income (loss) 20,090.0 15,557.0 17,829.0 17,638.0 (5,489.0)Total assets 285,548.0 313,695.0 328,098.0 343,110.0 345,199.0Total liabilities 161,465.0 176,984.0 181,410.0 184,716.0 186,331.0 Source: company filings D A T A M O N I T O R
Table 7: A.P. Moller-Maersk Group: key financial ratios Ratio 2005 2006 2007 2008 2009Profit margin 9.6% 6.0% 6.4% 5.7% (2.1%)Revenue growth 25.8% 24.6% 7.2% 11.8% (16.6%)Asset growth 47.2% 9.9% 4.6% 4.6% 0.6%Liabilities growth 121.2% 9.6% 2.5% 1.8% 0.9%Debt/asset ratio 56.5% 56.4% 55.3% 53.8% 54.0%Return on assets 8.4% 5.2% 5.6% 5.3% (1.6%)Revenue per employee $577,309 $447,527 $443,822 $486,800 $422,174Profit per employee $55,573 $26,764 $28,375 $27,536 ($8,912) Source: company filings D A T A M O N I T O R

LEADING COMPANIES
Global - Marine Freight 0199 - 2101 - 2010
© Datamonitor. This profile is a licensed product and is not to be photocopied Page 24
Figure 10: A.P. Moller-Maersk Group: revenues & profitability
Source: company filings D A T A M O N I T O R
Figure 11: A.P. Moller-Maersk Group: assets & liabilities
Source: company filings D A T A M O N I T O R

LEADING COMPANIES
Global - Marine Freight 0199 - 2101 - 2010
© Datamonitor. This profile is a licensed product and is not to be photocopied Page 25
Nippon Yusen Kabushiki Kaisha
Table 8: Nippon Yusen Kabushiki Kaisha: key facts Head office: 3-2 Marunouchi 2-chome, Chiyoda ku, Tokyo 100 0005 JPN Telephone: 81 3 3284 5151 Website: www.nyk.com Financial year-end: March Ticker: 9101 Stock exchange: Tokyo Source: company website D A T A M O N I T O R
Nippon Yusen Kabushiki Kaisha (NYK Line) is a Japanese group engaged in providing marine transportation services and logistics solutions. The group has its presence in Asia, Europe, and North America.
The group operates through eight business segments: bulk shipping, liner trade, logistics, terminal and harbor transport, air cargo transport, cruise, real estate, and others.
The bulk shipping segment provides car transport, bulk transport, and energy resources transport services. The car transportation services include transportation of automobiles. In FY2009, the group operated a fleet of 112 vessels of pure car carriers. The bulk transportation services include transportation of iron-ore, coal, grain, steel, wood, cement, and woodchip. The group operates a fleet of various vessel types, including Capesize, Panamax, Handymax, and Handysize bulk carriers, specialized ore and wood-chip carriers, open hatch carriers, and reefer carriers.
The energy resources transportation services of the group include transportation of crude oil, petroleum products, chemical products, inorganic chemicals, animal and plant oils, and methanol, as well as liquefied petroleum gas tankers. In FY2009, the group operated 81 tankers, and it provides transport service based on both long-term and short-term transport contracts with major petroleum companies, petrochemical companies, and energy companies worldwide.
The liner trade segment comprises of the container transport division and the conventional cargo transport division. The group operates these divisions through its two consolidated subsidiaries, Tokyo Senpaku Kaisha and NYK-Hinode Line, respectively. Tokyo Senpaku Kaisha offers services linking Asia to Europe, North America, Australia, Latin America, and Africa, as well as those across the Atlantic. NYK-Hinode Line primarily engages in transporting heavy-lift cargo and steel through the conventional liner trade.

LEADING COMPANIES
Global - Marine Freight 0199 - 2101 - 2010
© Datamonitor. This profile is a licensed product and is not to be photocopied Page 26
It links Asia to Southeast Asia, India, the Middle East, Europe, the Mediterranean, East Africa, Australia, and the South Pacific. In FY2009, the group operated about 154 container ships with a capacity of 5,948,165 dead weight tons (DWT).
The logistics operations of the group is carried out by NYK Logistics, whose operations are centered on overland transport, warehousing, delivery and ocean freight forwarding, and Yusen Air & Sea Service (YAS), which handles air freight forwarding. NYK Logistics and YAS offer supply-chain management services, including product pickup, warehouse storage, value-added services, such as inspection, sorting, labeling and repackaging, delivery to designated recipients, and IT-based data management.
The terminal and harbor transport segment provides terminal services for containerships, pure car carriers, and cruise ships. It operates a wide range of terminals at major ports in Japan, Asia, North America, Europe, and Australia. The segment operates a total of 14 terminals in Japan and overseas.
The group operates its air cargo transportation business through its subsidiary, Nippon Cargo Airlines (NCA), which handles the international air cargo business in North America, Europe, and Asia. NCA operates the Boeing 747-400F aircraft. It also plans to introduce a next-generation freighter, namely the Boeing 747-8F, into its fleet.
The cruise segment offers cruising services. NYK Line is engaged in the cruise business through operating subsidiaries established in Japan and the US. It operates three cruise ships: Asuka II, mainly for guests in Japan, as well as Crystal Symphony and Crystal Serenity for guests overseas, centered on the US.
The real estate segment focuses on the management of real estate owned by NYK Line.
The other segment comprises NYK Trading, which primarily handles the sale of petroleum products and ship equipment. It also includes businesses of consolidated subsidiaries engaged in shipping agency services, and restaurant and sightseeing operations.
Key Metrics
The company recorded revenues of $25,957 million in the fiscal year ending March 2009, a decrease of 6.0% compared to fiscal 2008. Its net income was $600 million in fiscal 2009, compared to a net income of $1,219 million in the preceding year.
LEADING COMPANIES
Global - Marine Freight 0199 - 2101 - 2010
© Datamonitor. This profile is a licensed product and is not to be photocopied Page 27
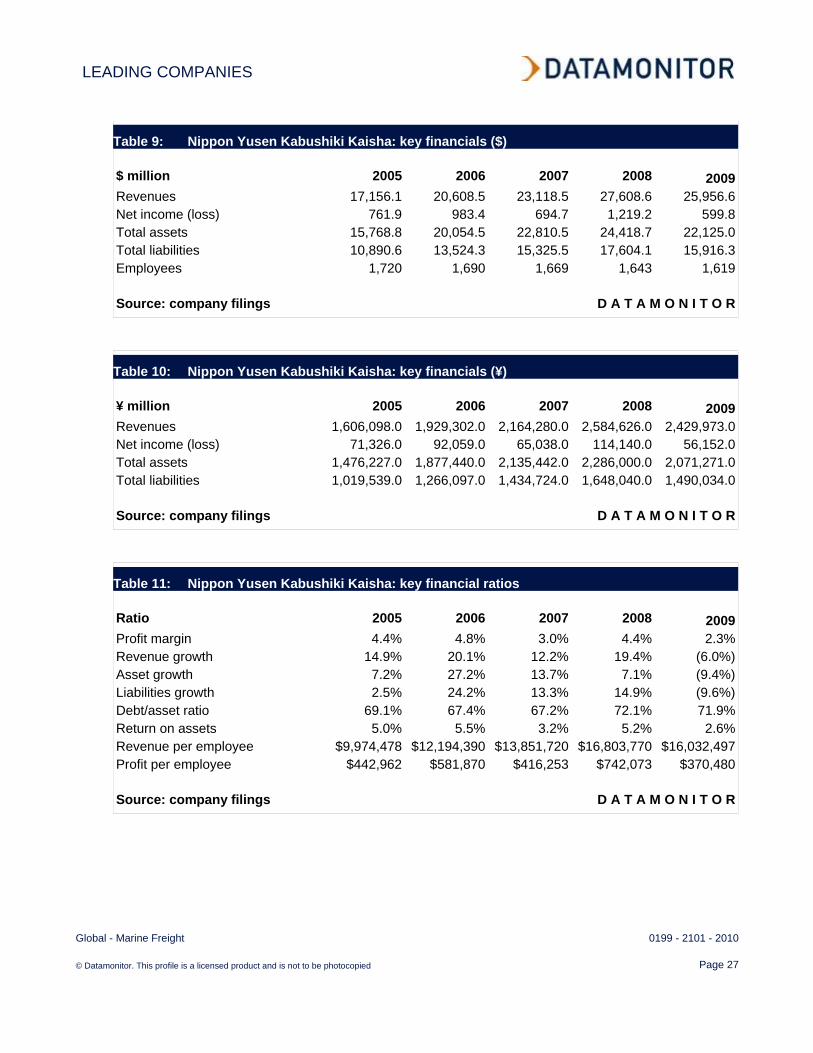
Table 9: Nippon Yusen Kabushiki Kaisha: key financials ($) $ million 2005 2006 2007 2008 2009Revenues 17,156.1 20,608.5 23,118.5 27,608.6 25,956.6Net income (loss) 761.9 983.4 694.7 1,219.2 599.8Total assets 15,768.8 20,054.5 22,810.5 24,418.7 22,125.0Total liabilities 10,890.6 13,524.3 15,325.5 17,604.1 15,916.3Employees 1,720 1,690 1,669 1,643 1,619 Source: company filings D A T A M O N I T O R
Table 10: Nippon Yusen Kabushiki Kaisha: key financials (¥) ¥ million 2005 2006 2007 2008 2009Revenues 1,606,098.0 1,929,302.0 2,164,280.0 2,584,626.0 2,429,973.0Net income (loss) 71,326.0 92,059.0 65,038.0 114,140.0 56,152.0Total assets 1,476,227.0 1,877,440.0 2,135,442.0 2,286,000.0 2,071,271.0Total liabilities 1,019,539.0 1,266,097.0 1,434,724.0 1,648,040.0 1,490,034.0 Source: company filings D A T A M O N I T O R
Table 11: Nippon Yusen Kabushiki Kaisha: key financial ratios Ratio 2005 2006 2007 2008 2009Profit margin 4.4% 4.8% 3.0% 4.4% 2.3%Revenue growth 14.9% 20.1% 12.2% 19.4% (6.0%)Asset growth 7.2% 27.2% 13.7% 7.1% (9.4%)Liabilities growth 2.5% 24.2% 13.3% 14.9% (9.6%)Debt/asset ratio 69.1% 67.4% 67.2% 72.1% 71.9%Return on assets 5.0% 5.5% 3.2% 5.2% 2.6%Revenue per employee $9,974,478 $12,194,390 $13,851,720 $16,803,770 $16,032,497Profit per employee $442,962 $581,870 $416,253 $742,073 $370,480 Source: company filings D A T A M O N I T O R

LEADING COMPANIES
Global - Marine Freight 0199 - 2101 - 2010
© Datamonitor. This profile is a licensed product and is not to be photocopied Page 28
Figure 12: Nippon Yusen Kabushiki Kaisha: revenues & profitability
Source: company filings D A T A M O N I T O R
Figure 13: Nippon Yusen Kabushiki Kaisha: assets & liabilities
Source: company filings D A T A M O N I T O R

LEADING COMPANIES
Global - Marine Freight 0199 - 2101 - 2010
© Datamonitor. This profile is a licensed product and is not to be photocopied Page 29
Kuehne + Nagel International AG
Table 12: Kuehne + Nagel International AG: key facts Head office: Kuehne + Nagel House, CH-8834 Schindellegi, CHE Telephone: 41 44 786 9511 Fax: 41 44 786 9595 Website: www.kuehne-nagel.com Financial year-end: December Ticker: KNIN Stock exchange: Switzerland Source: company website D A T A M O N I T O R
Kuehne + Nagel is engaged in providing sea freight, airfreight, overland and contract logistics services. The company provides information technology (IT) based logistics services across various industries. The company primarily operates through Kuehne + Nagel International, Kuehne + Nagel Management, Kuehne + Nagel Internationale Transporte, Kuehne + Nagel Liegenschaften, Kuehne + Nagel Treasury, Nacora Holding, Nacora Agencies, and Kuehne + NagelAsia Pacific Holding. It operates from 850 locations in more than 100 countries across Europe, Americas, Asia-Pacific, and Middle East, Central Asia and Africa.
The company primarily operates through six segments: sea freight, airfreight, contract logistics, road and rail logistics, insurance brokers and real estate.
The sea freight segment provides sea freight solutions to customers all across the world. The company offers these services by partnering with other firms. The sea freight services of the company include: less-than-container load (LCL), customs clearance/brokerage, automotive supplier networks, beverage logistics, forest products, reefer/perishables, oil and energy and project logistics. The company carries an annual LCL volume of more than 1.5 million cubic meters. It offers cargo handling services on both the sending and receiving sides through more than 2,000 operated lanes. Kuehne + Nagel provide web-enabled visibility to all cargo movement. KN Login, the company's shipment and order visibility monitoring tool provides access to the latest shipment and order information. This segment shipped more than 2,670,000 twenty foot equivalent units in FY2008, an increase of 2% over the previous year.
The airfreight segment offers a range of standard and customized air logistics solutions. Annually the segment handles more than 800,000 tons of freight, across international markets, as well as through individual transportation solutions to remote places.

LEADING COMPANIES
Global - Marine Freight 0199 - 2101 - 2010
© Datamonitor. This profile is a licensed product and is not to be photocopied Page 30
The company's air services include KN Express, express airfreight product; KN Expert, time defined delivery service; KN Extend for time-extended supply chain requirements; and KN Extreme for special cargo transportation. It works in partnership with air carriers for its airfreight transportation capabilities.
The contract logistic segment provides services with more than seven million square meters of warehouse space across 55 countries. This segment offers inbound, warehousing, outbound and aftermarket logistics. Its logistic services include all aspects such as planning, control and execution starting from point of origin to consumption. The operations of inbound logistics services include vendor management; order management; visibility, monitoring and reporting; consolidations; international transport; and customs brokerage. The warehousing solutions include in-house logistics such as on-site management, execution, and dedicated and multi-client (shared) warehousing.
The operations of outbound logistics include transportation management, freight audit and payment, and proof of delivery. The aftermarket logistics operations include Critical Service Logistics solutions, which handle complicated service-parts requirements; and reverse logistics, which include returned-goods management, inventory repair/return, testing and billing. It also includes cross-docking, network and supply chain management services. The company manages distribution through load optimization, network analysis, shipment visibility and management reporting. The contract logistics segment provides various industry specific solutions. The main sectors served by the company include high-tech, retail/consumer goods, automotive and pharmaceutical/healthcare.
The rail and road transportation segment offers products and services across Europe. It provides a portfolio of dedicated and individual delivery services. This segment is primarily engaged in rail and road logistics analysis, optimization, implementation and management services.
The rail transportation products include pre and post-carriage logistics options, including cargo handling, warehousing, distribution and customs clearance. The company designs and integrates the necessary logistics services including packaging, cargo insurance, customs clearance, and complex projects such as dismantling and reconstructing entire plant. The company provides all these services with the help of a team of 200 specialists at more than 40 operational service centers. The rail transportation services primarily specialize in block train, single-car and intermodal transport, and shipment of hazardous goods and oversized shipments. In addition, its special services include supplying raw materials to manufacturers, rail-connected consolidation hubs for retailers, and complete management of industrial projects.
The road logistics network provides coverage across 38 countries for Groupage, LTL and FTL shipments. The company provides these services through continental hub-and-spoke structure with one central and five regional hubs. Direct line hauls supplement the network with terminal-to-terminal and door-to-door connections. The company's scheduled services offer fixed transit times and ensure reliable door-to-door transport across Europe.

LEADING COMPANIES
Global - Marine Freight 0199 - 2101 - 2010
© Datamonitor. This profile is a licensed product and is not to be photocopied Page 31
It provides lead time and rate information for optimal logistics planning and online tracking services for its customers. The rail and road logistics products of the company are supported by web-based tracking and tracing capabilities along with in-depth local market expertise.
The insurance brokers segment provides services through its in-house insurance company, the Nacora Group that tailors insurance solutions for every shipment. The company provides these insurance solutions to marine cargo, marine liability, third-party liability, and special projects.
The real estate business unit manages the company's real estate portfolio and owns logistic centers, warehousing and cross-docking facilities, and office properties. These are leased to the company's operational segments.
Key Metrics
The company recorded revenues of $16,012 million in the fiscal year ending December 2009, a decrease of 19.4% compared to fiscal 2008. Its net income was $539 million in fiscal 2009, compared to a net income of $538 million in the preceding year.
Table 13: Kuehne + Nagel International AG: key financials ($) $ million 2005 2006 2007 2008 2009Revenues 12,924.0 16,737.0 19,295.3 19,869.4 16,012.1Net income (loss) 289.8 421.6 493.1 538.2 539.3Total assets 3,883.4 5,257.3 5,923.1 5,110.2 5,457.9Total liabilities 2,416.0 3,445.7 3,755.9 3,211.4 3,406.5Employees 25,607 46,290 51,075 53,871 54,680 Source: company filings D A T A M O N I T O R

LEADING COMPANIES
Global - Marine Freight 0199 - 2101 - 2010
© Datamonitor. This profile is a licensed product and is not to be photocopied Page 32
Table 14: Kuehne + Nagel International AG: key financials ($) $ million 2005 2006 2007 2008 2009Revenues 14,049.0 18,194.0 20,975.0 21,599.0 17,406.0Net income (loss) 315.0 458.3 536.0 585.0 586.3Total assets 4,221.4 5,714.9 6,438.7 5,555.0 5,933.0Total liabilities 2,626.3 3,745.6 4,082.8 3,491.0 3,703.0 Source: company filings D A T A M O N I T O R
Table 15: Kuehne + Nagel International AG: key financial ratios Ratio 2005 2006 2007 2008 2009Profit margin 2.2% 2.5% 2.6% 2.7% 3.4%Revenue growth 21.5% 29.5% 15.3% 3.0% (19.4%)Asset growth 48.5% 35.4% 12.7% (13.7%) 6.8%Liabilities growth 28.3% 42.6% 9.0% (14.5%) 6.1%Debt/asset ratio 62.2% 65.5% 63.4% 62.8% 62.4%Return on assets 8.9% 9.2% 8.8% 9.8% 10.2%Revenue per employee $504,705 $361,569 $377,784 $368,832 $292,834Profit per employee $11,316 $9,108 $9,654 $9,990 $9,864 Source: company filings D A T A M O N I T O R
LEADING COMPANIES
Global - Marine Freight 0199 - 2101 - 2010
© Datamonitor. This profile is a licensed product and is not to be photocopied Page 33
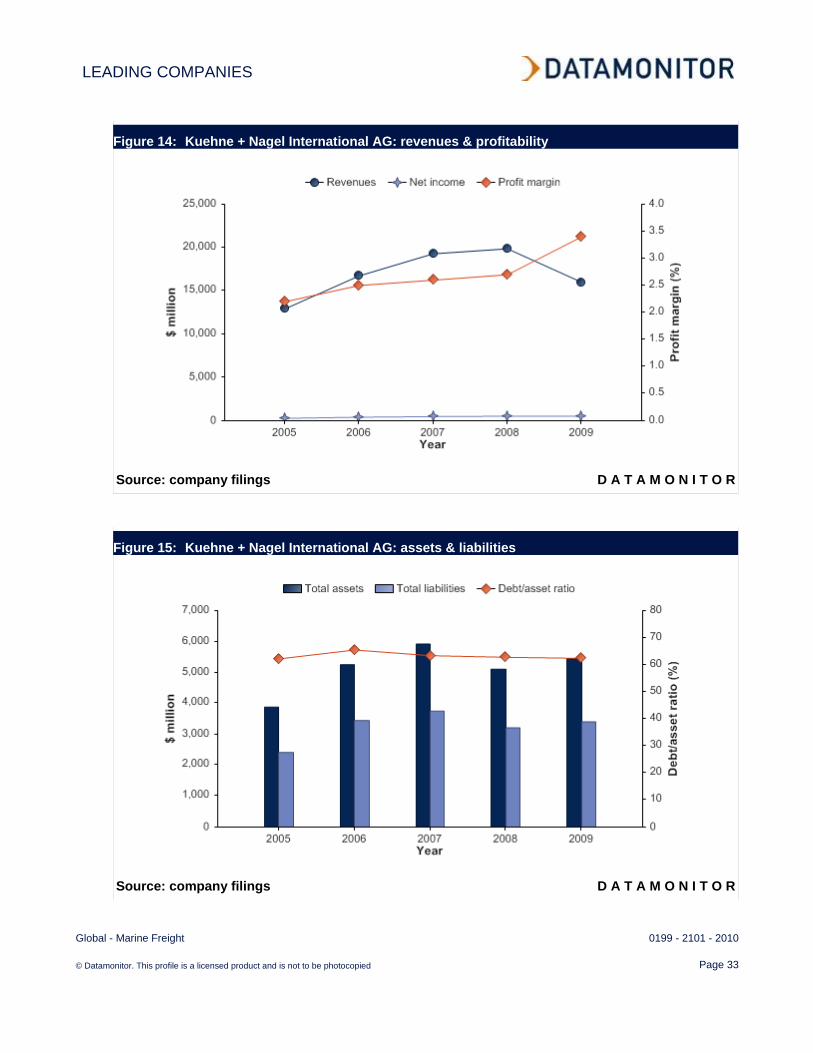
Figure 14: Kuehne + Nagel International AG: revenues & profitability
Source: company filings D A T A M O N I T O R
Figure 15: Kuehne + Nagel International AG: assets & liabilities
Source: company filings D A T A M O N I T O R

LEADING COMPANIES
Global - Marine Freight 0199 - 2101 - 2010
© Datamonitor. This profile is a licensed product and is not to be photocopied Page 34
Mitsui O.S.K. Lines, Ltd.
Table 16: Mitsui O.S.K. Lines, Ltd.: key facts Head office: 1-1, Toranomon 2-chome, Minato-ku, Tokyo 105 8688, JPN Telephone: 81 3 3587 6224 Fax: 81 3 3587 7734 Website: www.mol.co.jp Financial year-end: March Ticker: 9104 Stock exchange: Tokyo Source: company website D A T A M O N I T O R
Mitsui O.S.K. Lines (MOL), a provider of international shipping services, operates about 861 vessels worldwide with overall carrying capacity of 59.6 million deadweight tons. The group's containerships, carriers, and tankers transport products such as cars, oil, chemicals, lumber and iron. The group also operates cruise ships, domestic ferries and liners, and provides logistics services, such as warehousing and freight forwarding.
The group operates through six business segments: bulkships, containerships, logistics, ferry and domestic transport, associated businesses, and others.
The bulkships segment is engaged in the transportation of iron ore, cooking and steaming coal, wood chips, grain and other cargo. This segment includes a fleet of dry bulkers, tankers, liquefied natural gas (LNG) carriers and car carriers. It operates a fleet of 356 bulk ships, of which 136 supply iron ore and coal to steel industry; 37 are specialized steaming coal carriers; 48 supply wood chips to paper industry; eight are heavy lifters; and another 127 are general cargo bulkers transport all kinds of bulk cargo, ranging from grain to industrial goods.
The group also operates a fleet of 89 car carriers, which are engaged in the transport of finished vehicles to market. It operates a fleet of 178 tankers to carry crude oil; refined products; and chemicals and liquefied petroleum gas (LPG). Of these 178 tankers, 42 are crude oil tankers, 49 are product tankers, 27 carry LPG and methanol, and 60 carry chemicals. MOL also has 72 LNG tankers assigned to specific projects.
The containerships segment operates containerships to transport cargo. This segment has a fleet of 115 containerships with overall carrying capacity of 5.4 million deadweight tons.

LEADING COMPANIES
Global - Marine Freight 0199 - 2101 - 2010
© Datamonitor. This profile is a licensed product and is not to be photocopied Page 35
It operates in the east-west routes linking Asia to North America and Asia to Europe, and also serves north-south or intra-Asia routes. The containerships segment also maintains container terminal operations in Japan, the US and Thailand.
The logistics segment provides the logistic solutions for distribution and storage of cargo to support the shipping services of the group. The segment also manages the logistic services of the group in China, through a partnership with Kintetsu World Express (KWE). The alliance of the group with KWE provides air forwarding, sea forwarding and logistics businesses. MOL also offers a buyers' consolidation service which transports all the products purchased by European and the US retailers and apparel companies from several suppliers in China and Southeast Asia, from ports in Asia.
The ferry and domestic shipping segment offers various transportation services to sea travelers and cargo transportation, primarily at Seto Inland Sea and the coastal areas of Pacific Ocean in Japan. This segment also includes domestic transport of bulk cargoes, such as coal, steel and salt. The ferry service provides several types of accommodations, from luxury suites to staterooms suitable for business travel. The group's ferries also feature restaurants, baths, shops, and other facilities.
The associated businesses segment comprises leasing of office and residential building through Daibiru, a subsidiary of the group. This segment also includes marine consulting, maritime engineering, temporary staffing, trading and many other activities, most of which are related to ocean transport. The segment also operates a cruise ship business that includes the Nippon Maru and other cruise liners.
Key Metrics
The company recorded revenues of $14,399 million in the fiscal year ending March 2010, a decrease of 27.8% compared to fiscal 2009. Its net income was $136 million in fiscal 2010, compared to a net income of $1,356 million in the preceding year.
Table 17: Mitsui O.S.K. Lines, Ltd.: key financials ($) $ million 2006 2007 2008 2009 2010Revenues 14,599.2 16,753.8 20,783.6 19,930.2 14,398.8Net income (loss) 1,214.9 1,291.9 2,033.0 1,356.5 136.4Total assets 15,711.1 17,517.6 20,301.4 19,303.0 19,882.3Total liabilities 10,447.1 10,884.3 12,272.4 11,878.8 12,023.6Employees 8,351 8,621 9,626 10,012 9,891 Source: company filings D A T A M O N I T O R
LEADING COMPANIES
Global - Marine Freight 0199 - 2101 - 2010
© Datamonitor. This profile is a licensed product and is not to be photocopied Page 36
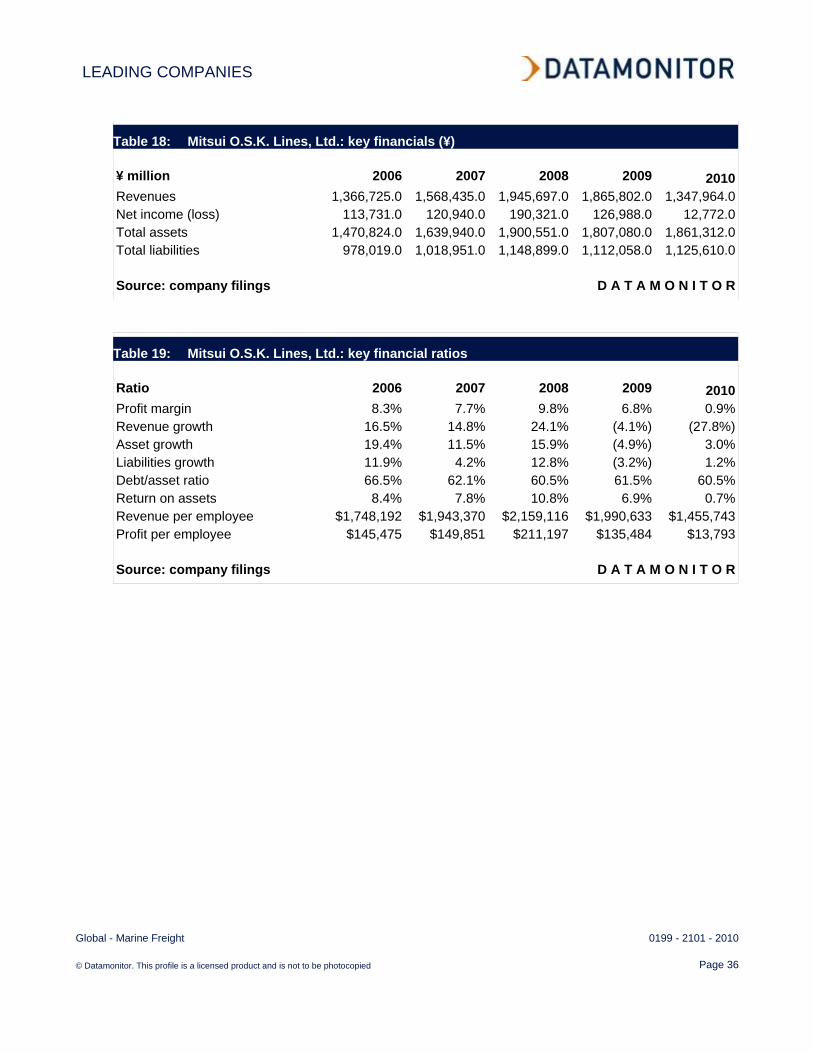
Table 18: Mitsui O.S.K. Lines, Ltd.: key financials (¥) ¥ million 2006 2007 2008 2009 2010Revenues 1,366,725.0 1,568,435.0 1,945,697.0 1,865,802.0 1,347,964.0Net income (loss) 113,731.0 120,940.0 190,321.0 126,988.0 12,772.0Total assets 1,470,824.0 1,639,940.0 1,900,551.0 1,807,080.0 1,861,312.0Total liabilities 978,019.0 1,018,951.0 1,148,899.0 1,112,058.0 1,125,610.0 Source: company filings D A T A M O N I T O R
Table 19: Mitsui O.S.K. Lines, Ltd.: key financial ratios Ratio 2006 2007 2008 2009 2010Profit margin 8.3% 7.7% 9.8% 6.8% 0.9%Revenue growth 16.5% 14.8% 24.1% (4.1%) (27.8%)Asset growth 19.4% 11.5% 15.9% (4.9%) 3.0%Liabilities growth 11.9% 4.2% 12.8% (3.2%) 1.2%Debt/asset ratio 66.5% 62.1% 60.5% 61.5% 60.5%Return on assets 8.4% 7.8% 10.8% 6.9% 0.7%Revenue per employee $1,748,192 $1,943,370 $2,159,116 $1,990,633 $1,455,743Profit per employee $145,475 $149,851 $211,197 $135,484 $13,793 Source: company filings D A T A M O N I T O R

LEADING COMPANIES
Global - Marine Freight 0199 - 2101 - 2010
© Datamonitor. This profile is a licensed product and is not to be photocopied Page 37
Figure 16: Mitsui O.S.K. Lines, Ltd.: revenues & profitability
Source: company filings D A T A M O N I T O R
Figure 17: Mitsui O.S.K. Lines, Ltd.: assets & liabilities
Source: company filings D A T A M O N I T O R

MARKET FORECASTS
Global - Marine Freight 0199 - 2101 - 2010
© Datamonitor. This profile is a licensed product and is not to be photocopied Page 38
MARKET FORECASTS
Market value forecast
In 2015, the global marine freight industry is forecast to have a value of $446.2 billion, an increase of 32.6% since 2010.
The compound annual growth rate of the industry in the period 2010–15 is predicted to be 5.8%.
Table 20: Global marine freight industry value forecast: $ billion, 2010–15 Year $ billion € billion % Growth2010 336.5 242.0 12.4%2011 357.2 256.9 6.2%2012 376.1 270.4 5.3%2013 397.6 285.9 5.7%2014 420.7 302.5 5.8%2015 446.2 320.9 6.1%
CAGR: 2010–15 5.8%
Source: Datamonitor D A T A M O N I T O R
Figure 18: Global marine freight industry value forecast: $ billion, 2010–15
Source: Datamonitor D A T A M O N I T O R
APPENDIX
Global - Marine Freight 0199 - 2101 - 2010
© Datamonitor. This profile is a licensed product and is not to be photocopied Page 39
APPENDIX
Methodology
Datamonitor Industry Profiles draw on extensive primary and secondary research, all aggregated, analyzed, cross-checked and presented in a consistent and accessible style.
Review of in-house databases – Created using 250,000+ industry interviews and consumer surveys and supported by analysis from industry experts using highly complex modeling & forecasting tools, Datamonitor’s in-house databases provide the foundation for all related industry profiles
Preparatory research – We also maintain extensive in-house databases of news, analyst commentary, company profiles and macroeconomic & demographic information, which enable our researchers to build an accurate market overview
Definitions – Market definitions are standardized to allow comparison from country to country. The parameters of each definition are carefully reviewed at the start of the research process to ensure they match the requirements of both the market and our clients
Extensive secondary research activities ensure we are always fully up-to-date with the latest industry events and trends
Datamonitor aggregates and analyzes a number of secondary information sources, including: - National/Governmental statistics - International data (official international sources) - National and International trade associations - Broker and analyst reports - Company Annual Reports - Business information libraries and databases
Modeling & forecasting tools – Datamonitor has developed powerful tools that allow quantitative and qualitative data to be combined with related macroeconomic and demographic drivers to create market models and forecasts, which can then be refined according to specific competitive, regulatory and demand-related factors
Continuous quality control ensures that our processes and profiles remain focused, accurate and up-to-date
APPENDIX
Global - Marine Freight 0199 - 2101 - 2010
© Datamonitor. This profile is a licensed product and is not to be photocopied Page 40
Industry associations
International Maritime Organization 4 Albert Embankment London SE1 7SR United Kingdom Tel.: 44 20 7735 7611 Fax: 44 20 7587 3210 www.imo.org European Intermodal Association www.eia-ngo.com Inland Navigation Europe www.inlandnavigation.org
Related Datamonitor research
Industry Profile
Marine Freight in the United States
Marine Freight in Canada
Marine Freight in France
Marine Freight in Germany

APPENDIX
Global - Marine Freight 0199 - 2101 - 2010
© Datamonitor. This profile is a licensed product and is not to be photocopied Page 41
Disclaimer
All Rights Reserved.
No part of this publication may be reproduced, stored in a retrieval system or transmitted in any form by any means, electronic, mechanical, photocopying, recording or otherwise, without the prior permission of the publisher, Datamonitor plc.
The facts of this report are believed to be correct at the time of publication but cannot be guaranteed. Please note that the findings, conclusions and recommendations that Datamonitor delivers will be based on information gathered in good faith from both primary and secondary sources, whose accuracy we are not always in a position to guarantee. As such Datamonitor can accept no liability whatever for actions taken based on any information that may subsequently prove to be incorrect.

ABOUT DATAMONITOR
Global - Marine Freight 0199 - 2101 - 2010
© Datamonitor. This profile is a licensed product and is not to be photocopied Page 42
ABOUT DATAMONITOR
The Datamonitor Group is a world-leading provider of premium global business information, delivering independent data, analysis and opinion across the Automotive, Consumer Markets, Energy & Utilities, Financial Services, Logistics & Express, Pharmaceutical & Healthcare, Retail, Technology and Telecoms industries.
Combining our industry knowledge and experience, we assist over 6,000 of the world’s leading companies in making better strategic and operational decisions.
Delivered online via our user-friendly web platforms, our market intelligence products and services ensure that you will achieve your desired commercial goals by giving you the insight you need to best respond to your competitive environment.
Premium Reports
Datamonitor's premium reports are based on primary research with industry panels and consumers. We gather information on market segmentation, market growth and pricing, competitors and products. Our experts then interpret this data to produce detailed forecasts and actionable recommendations, helping you create new business opportunities and ideas.
Summary Reports
Our series of company, industry and country profiles complements our premium products, providing top-level information on 30,000 companies, 3,000 industries and 100 countries. While they do not contain the highly detailed breakdowns found in premium reports, profiles give you the most important qualitative and quantitative summary information you need - including predictions and forecasts.
Datamonitor consulting
We hope that the data and analysis in this profile will help you make informed and imaginative business decisions. If you have further requirements, Datamonitor’s consulting team may be able to help you. For more information about Datamonitor’s consulting capabilities, please contact us directly at [email protected].