division of waste managementwaste.ky.gov/annual reports/dwm annual report for 2016.pdf · division...
TRANSCRIPT

An
nu
al R
epo
rt
Fis
ca
l Y
ea
r 2
016
Div
isio
n o
f W
ast
e M
an
ag
em
en
t
Cover Photograph
Hydraulic Fracturing Operations
Lawrence County, KY
Courtesy of Marvin Combs
Commonwealth of Kentucky
Department for Environmental Protection
Division of Waste Management
502.564.6716
waste.ky.gov
i
Message from the Director
As the director for the Division of Waste Management,
I am committed to serving the commonwealth and
working toward the mission of this agency. Our
primary mission is protecting human health and the
environment. I admire the division staff as their
continued hard work and commitment further
preserves and improves our environment.
It is my pleasure to submit the eleventh edition of our
annual report for fiscal year 2016. Now residing at
the new 300 Sower Boulevard address, the division is
able to collaborate in a centralized location with
other divisions within the cabinet. Collaboration
within our cabinet and outside of our cabinet has
been a key element to success this year. Currently,
representatives from the Energy and Environment Cabinet, Cabinet for Health and Family
Services, environmental groups, oil and gas transporters and producers, owners and operators
of waste disposal facilities, along with others are convening as the Oil and Gas Workgroup to
develop a review process, recommendations, and propose amendments to existing statutes and
regulations as directed by House Bill 563 from this past legislative session.
I am pleased to report the success of many our programs this year. The Brownfield’s
Redevelopment Program, under KRS 224.1-415 is a continued success redeveloping hundreds of
properties and improving thousands of acres of land across the commonwealth. After the success
of the rubberized asphalt pilot project last year, and the abundance of qualified applicants, the
division expanded the number of grants that were awarded for the new rubber-modified asphalt
chip seal grant. Additionally, division staff has been busy developing a state Coal Combustion
Residual (CCR) regulatory program in light of the new federal CCR rule, which became effective
in October of 2015. The division is also amending the Hazardous Waste Branch regulations to
reduce and eliminate inconsistencies between the state and federal rules regarding the Resource
Conservation and Recovery Act. Lastly, the division continues to make significant progress in the
cleanup of leaking underground petroleum storage tanks. These and the many other division
accomplishments are discussed in this annual report.
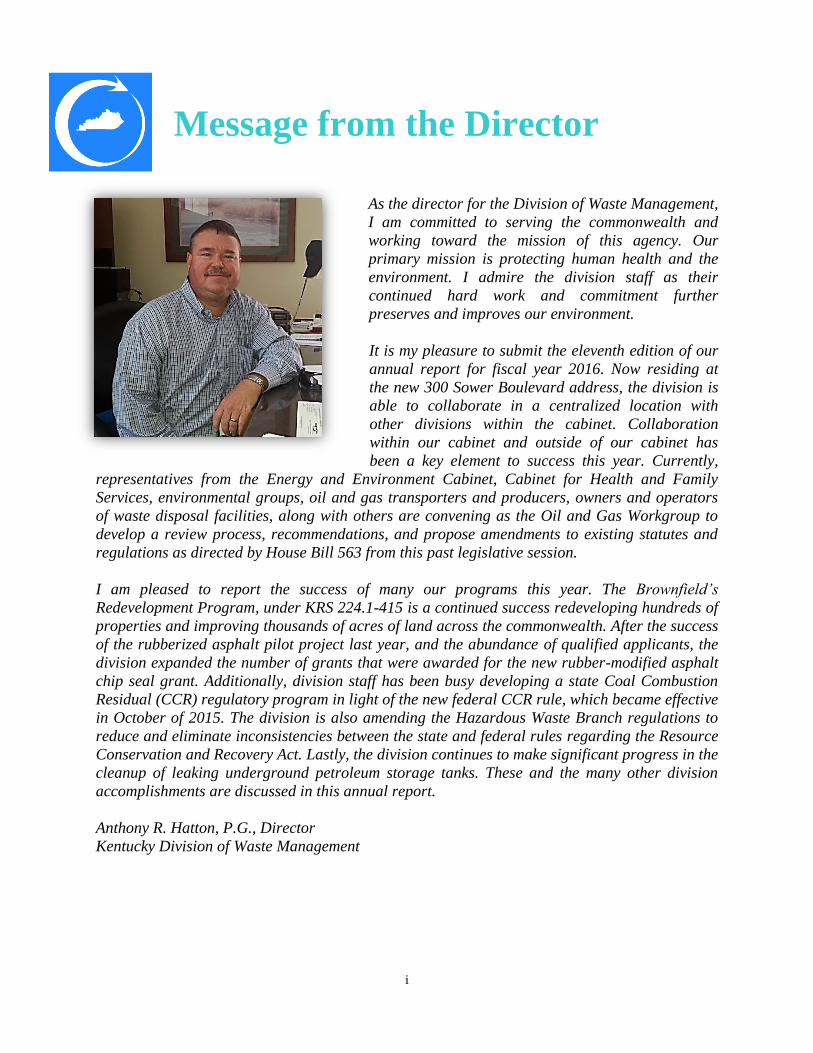
Anthony R. Hatton, P.G., Director
Kentucky Division of Waste Management
ii
Highlight Stories
New 300 Building at Sower Boulevard by John Maddy, Page 15
Inspection Schedule for River Cities Disposal by Brian Osterman, Page 19
Hazardous Waste Regulation Changes by Dale Burton, P.G., Page 23
Rubber-Modified Asphalt Chip Seal Pavement Grant by Christopher Tuttle, Page 34
Naturally Occurring Radioactive Materials by Robin Green, Page 43
State Lead Superfund Emergency Remedial Action-Arsenic Tank Sites by Cliff Hall,
P.G., Page 53
Optimizing Approaches and Moving Forward by Edward J. Winner, Ph.D., Page 59
TABLE OF CONTENTS
Selected Figures iii
Executive Summary 1
Introduction 4
Program Planning and Administration 9
Field Operations 17
Hazardous Waste 21
Recycling and Local Assistance 25
Solid Waste 36
Superfund 44
Underground Storage Tanks 56
Acknowledgments 61

iii
SELECTED FIGURES
1. Division of Waste Management Budget Analysis 9
2. Division of Waste Management Funded Positions 10
3. DWM Profile of Employee Years of Service in FY16 10
4. DWM Inspections 17
5. DWM Compliance Rates 18
6. Hazardous Waste Permits Pending 22
7. Kentucky Tons Recycled 25
8. State Office Paper Recycling Totals 26
9. Fiber Recyclables Market ($/ton) 27
10. Plastic Recyclables Market (cents/lb.) 28
11. Glass Recyclables Market ($/ton) 28
12. Metal Recyclables Market 29
13. Litter Abatement 31
14. Illegal Open Dump Cleanups and Expenditures 32
15. Total Population of Kentucky 37
16. Municipal Solid Waste Generated in Kentucky 37
17. Municipal Solid Waste Disposal and Recycling 38
18. U.S. and Kentucky Recycling Rates 38
19. Kentucky Households Participating in MSW Collection 39
20. Permit Reviews Completed by Fiscal Year 40
21. ERF Reporting Compliance 41
22. Superfund Sites Remediated and Characterized 44
23. State Cleanup Responsibility Outlives Company Responsibility by
400%
47
24. No Further Actions Letters Issued per Year 57
25. UST Cleanups Remaining 57

1
EXECUTIVE SUMMARY
The Kentucky Division of Waste Management (DWM) is the second largest division, with 236
staff positions, in the Department for Environmental Protection with seven branches:
Field Operations
Hazardous Waste
Program Planning and Administration
Recycling and Local Assistance
Solid Waste
Superfund
Underground Storage Tank
2015 calendar year and 2016 state fiscal year selected achievements and challenges:
Brownfield Redevelopment Program, KRS 224.1-415:
The program has achieved early success. In FY16, the division reviewed 40 brownfield sites
and issued 41 Notice of Eligibility letters and 35 Notification of Concurrence letters to
applicants who have entered the program. There were two sites pending review at the end of
the fiscal year.
Crumb rubber grants awarded:
In FY16 a total of 19 grants totaling $249,256 were awarded for the application of
landscaping mulch derived from recycled Kentucky tires. This is more than double the
amount awarded the previous year.
State Government Office Paper Recycling Program thrives:
This program serves more than 115 agencies in Frankfort. Office paper, computer paper,
newsprint, and cardboard are collected, sorted, shredded, baled and sold to a paper mill,
allowing this program to operate primarily on its own receipts. State employees recycled 1262
tons of waste paper in 2015, approximately 232 pounds per state employee. Confidential
document destruction is provided at no charge, adding to the economic benefit of this
program.

2
Household municipal solid waste (MSW) collection:
Participation in household MSW collection has remained steady since legislation in 2002
began requiring waste haulers and recycling haulers to register and report to each county in
which they provide service. The 2015 statewide household participation rate for MSW
collection was 85.3 percent.
Illegal open dumpsites:
More than 25,800 illegal open dumpsites have been cleaned up since 1993. In 2015, counties
cleaned 102 illegal open dumps at a cost of $761,347. The average cost to clean up each
dumpsite was $7,524.
Litter along public roads:
The Kentucky Pride Fund, Eastern Kentucky PRIDE, Bluegrass Greensource, Kentucky
Transportation Cabinet, Adopt-A-Highway, and cities and counties across the commonwealth
contributed to the cleanup of 10,303,820 pounds of litter at a cost of $8.1 million during 2015.
The average cost of litter picked up in 2015 was 79 cents per pound.
Maxey Flats Project Final Capping:
The construction contractor for building the final cap, The Walker Group (TWG) from Mt.
Sterling, KY, was selected in September 2014. United States Environmental Protection
Agency approved the final cap design in October 2014. TWG began final cap construction in
January of 2015. By May 2015, wooded areas were cleared and a haul road and drainage
features constructed. A total of 421,255 cubic yards of leveling fill and 75,500 cubic yards of
protective cover soil were placed. Seventy-six percent of the landfill area has been covered
with geosynthetic clay liner and high density polyethylene, final completion is projected by
December 2016.
Methamphetamine Lab Cleanup Program:
Through the division’s Superfund Branch, 94 contaminated residences were reported as
having suspected methamphetamine contamination and 49 residences were decontaminated
through the Methamphetamine Lab Cleanup Program in FY16.

3
Recycling:
Kentuckians recycled 2,656,517 tons of common household recyclables (aluminum,
cardboard, steel, plastic, newspaper, glass, and paper) for a recycling rate of 36.6 percent in
2015. Kentuckians recycled a total of 3,357,008 tons of municipal solid waste in 2015
including sludge, concrete, compost and asphalt.
Underground Storage Tank (UST) Program Success:
The UST program emphasizes immediate and effective remediation. The number of open
UST sites continues to drop. The total number of UST cleanups remaining has decreased
substantially over the last few years, from 757 in FY15 to 675 in FY16. There were 303 No
Further Action letters issued.
Waste Tire Program:
In FY 2016, waste tire collection events (formerly referred to as “tire amnesties”) were
conducted in 35 counties in the Lincoln Trail, Lake Cumberland and Bluegrass Area
Development Districts (ADDs). The equivalents of 711,057 waste tires were recovered
through FY 2016 collection events at a cost of $1,123,470.

4
INTRODUCTION
The Division of Waste Management (DWM) is one of six divisions of the Department for
Environmental Protection in the Energy and Environment Cabinet. The departmental strategic
operational plan for state fiscal year 2016 describes the mission of the agency:
Preserve and restore Kentucky’s land through the development and
implementation of fair, equitable and effective waste management programs.
To accomplish this mission, the department has developed a set of objectives to be implemented
by each division; the objectives, tactics, and measures germane to DWM are:
Objective 1 - Ensure programs adhere to federal and state statutory and
regulatory requirements.
Tactic 1.1: Review and revise administrative regulations, and propose legislative
amendments to comply with federal regulatory requirements.
Measures:
Number of legislative proposals drafted in the current fiscal year.
Number of regulatory packages developed, promulgated and finalized in
the current fiscal year.
Tactic 1.2: Provide resources and oversight to the regulated community to achieve
compliance with federal and state regulations.
Measures:
Number of underground storage tank owners/operators that completed the
Kentucky Tank Operator Online Learning System (KY TOOLS) training.
Percentage of underground storage tank owner/operators in compliance
with the requirement to have Designated Compliance Managers.
Number and percentage of solid waste sites submitting the Environmental
Remediation Fee in accordance with KRS 224.43-500.
The percentage of authorized hazardous waste facilities in compliance.
The percentage of registered underground storage tanks in compliance.

5
Number of facility inspections completed by staff to ensure regulatory
compliance.
Tactic 1.3: Review and revise quality assurance documents annually and update as
necessary.
Measures:
Number of Standard Operating Procedures and guidance documents
developed or revised in the current fiscal year.
Number of Quality Assurance Project Plans developed or revised in the
current fiscal year.
Tactic 1.4: Ensure waste management programs are fiscally and administratively viable.
Measures:
The division staffing levels as compared to cap and budgeted amounts.
The Number of grant programs administered and completed.
Objective 2 - Ensure permits are protective of human health and Kentucky’s
land resources.
Tactic 2.1: Issue appropriate, lawful permits in a timely manner.
Measures:
Number of hazardous waste permit applications received.
Number of hazardous waste permits pending review.
Percentage of hazardous waste permit reviews completed within
regulatory timeframes.
Number of solid and special waste permit applications received.
Number of solid and special waste permits pending review.
Percentage of solid and special waste permit reviews completed within
regulatory timeframes.
Number of training classes completed by DWM staff.
Tactic 2.2: Reduce, eliminate, and maintain zero permits and permit activity backlogs.
Measures:
Number of hazardous waste permits pending review outside regulatory
timeframes.

6
Percentages of hazardous waste permit reviews completed outside
regulatory timeframes.
Number of solid and special waste permits pending review outside
regulatory timeframes.
Percentages of solid and special waste permit reviews completed outside
regulatory timeframes.
Objective 3 - Ensure remedial investigation, restoration, and management in
place decisions are site specific, risk based, and environmental
performance standards prone.
Tactic 3.1: Restore sites or manage contamination at sites with known or suspected
releases to soil or groundwater.
Measures:
The number of sites with known or suspected releases with potential
human exposures where no further action is required or otherwise
controlled because of implementing a management in place technique:
Number of underground storage tank cleanups conducted that resulted in a
no further action being issued and number remaining.
Number of hazardous waste program corrective actions completed and
number remaining.
Number of EPA indicators corrective action measures achieved.
Number of historic landfills remediated and number remaining.
Number of solid and special waste facilities in groundwater assessment.
Number of illegal open dumps remediated under the Kentucky PRIDE
Program and number remaining.
Number of tire dumps remediated under the Waste Tire Trust Fund and
number remaining.
Number of PRP-Lead State Superfund sites characterized and number
remediated.
Number of State-Lead sites remediated utilizing the Hazardous Waste
Management Fund.
Number of sites with a release of petroleum or a petroleum product
remediated from a source other than a petroleum storage tank and number
awaiting review.
Number of methamphetamine-contaminated properties reported and
number decontaminated.
Number of emergency or incident responses made and number of cases
closed.

7
Tactic 3.2: Plan, design and execute Final Closure Period activities at Maxey Flats while
maintaining regulatory compliance.
Measures:
Substantial completion of final cap construction by October 2016.
Complete Institutional Control Period Work Plan by April 2016.
Objective 4 - Support and encourage economic redevelopment of property with
real or perceived contamination.
Tactic 4.1: Provide oversight to the investigation, remediation, management, or
redevelopment of properties with real or perceived contamination.
Measures:
Number of cleanups conducted under state oversight via the Voluntary
Environmental Remediation Program (see also DCA Brownfields
measure).
Number of brownfield sites assessed under the Targeted Brownfield
Assessment Program and number awaiting review.
Number of brownfield sites reviewed under KRS 224.01-415, number of
eligibility letters issued, and number of concurrence letters issued.
Objective 5 - Minimize waste generation and disposal.
Tactic 5.1: Assure proper management and disposal of waste.
Measures:
The compliance rates for authorized solid waste management facilities.
The amounts, by weight, of litter, open dump waste, and household
hazardous waste collected by counties through the Kentucky Pride
program.
Objective 6 - Encourage beneficial reuse and recycling.
Tactic 6.1: Encourage reduced waste generation and disposal by promoting beneficial
reuse, recycling, waste minimization, and pollution prevention.

8
Measures:
Tonnage of municipal solid waste recycled or reused, by type.
Tonnage of material recycled through the State Government Recycling
Program.
Tonnage of solid or special waste used as Alternate Daily Cover (ADC).
Percentage of solid or special waste used as Alternate Daily Cover (ADC).
Number of waste tires used in tire-derived fuel projects, crumb rubber
grants and other beneficial reuse purposes as a percentage of number of
tires generated.
Number of solid waste beneficial reuse determinations.
Number of registered special waste beneficial reuse sites.
Number of land farming and composting facilities.
Number of recycling grants and total amount of funding administered.

9
PROGRAM PLANNING &
ADMINISTRATION
The mission of the Program Planning and Administration Branch (PPA) is to promote sound
waste management programs by providing administrative and operational support to all branches
in the division through efficient and effective financial administration, personnel management,
and regulatory development.
Budget
The budget for DWM is very complex; covering a host of programs and activities, as well as,
partially funding work charged by the Division of Enforcement and the Environmental Response
Team. The division is financially supported by general funds, federal grants and restricted funds,
including fees collected for permits and registration activities, the Petroleum Storage Tank
Environmental Assurance Fund (PSTEAF), the waste tire fee, the environmental remediation fee,
and an annual appropriation from the road fund. The division must utilize available funding
sources in the most resourceful and equitable manner possible, while striving to achieve the
cabinet’s environmental goals and division priorities.
Figure 1
The DWM had the budget to employ 236 full-time permanent employees in 2016. The number of
employees the division could fiscally maintain has decreased nearly 14 percent since 2010. This
$0
$10
$20
$30
$40
$50
$60
$70
$80
2010 2011 2012 2013 2014 2015 2016
Mil
lio
ns
Division of Waste Management Budget Analysis
General Funds Federal Funds Restricted Funds
PSTEAF (fuel account) PSTEAF (bond account)

10
reduction in personnel continues to challenge the division programs to operate more efficiently
and identify program priorities.
Figure 2
Figure 3
210
220
230
240
250
260
270
280
2010 2011 2012 20132014
20152016
2017
274
253 253250
239237
236 236
Division of Waste Management Funded Positions
2010 2011 2012 2013 2014 2015 2016 2017
15%
19%
23%
22%
10%
9%2%
DWM Profile of Employee Years of Service in FY16
0 - 5 Years
5- 10 Years
10-15 Years
15-20 Years
20-25 Years
25-30 Years
30+ Years

11
Project Administration Section
The Project Administration Section performs the division’s procurement, contract administration
and grant management. This section also handles the division’s accounts payable functions and
payment processing for major fee-supported programs.
This section typically manages a number of personal service contracts and memoranda of
agreements with other government entities each year. In FY16, the division issued a request for
proposals (RFP) and awarded a new personal service contract to engineer George Gilbert as a
consultant assisting the division’s Waste Tire Program with the on-going development of pilot
rubber-modified asphalt projects. Also new in FY16, the division entered into a memorandum of
agreement contracting Western Kentucky University to perform geophysical services related to
site assessment and characterization of Superfund, Underground Storage Tank, and Solid Waste
sites.
Many of the division’s programs are completely supported by federal funds, while others are
only partially or not supported by federal funds at all. Currently, DWM receives funding from a
total of 13 federal grants. This financial support includes:
The Assembled Chemical Weapons Alternative (ACWA) Grant from the U.S.
Department of Defense (DoD) provides financial support for the division’s efforts to
ensure the compliance of storage regulations; review, amend and approve permit
applications; keeping stakeholders and the community informed of activities; and to
ensure compliance during construction and operation of the Bluegrass Chemical Agent-
Destruction Pilot Plant (BGCAPP) and the Explosive Destruction Technology (EDT)
processes.
The Agreement in Principle (AIP) with the U.S. Department of Energy (DOE) funding
allows DWM to conduct independent and impartial assessments of potential
environmental impacts of DOE activities at the Paducah Gaseous Diffusion Plant
(PDGP). Through the support of the agreement, DWM is able to manage independent
environmental monitoring and research. The funds also allow DWM to enhance
communications with concerned citizens.
Under Section 128(a) of the Comprehensive Environmental Response, Compensation and
Liability Act (CERCLA), the U.S. Environmental Protection Agency (EPA) provides
financial support to the Brownfield Redevelopment Program to address the assessment,
cleanup, and redevelopment of brownfield sites and other sites with actual or perceived
contamination.
Financial assistance from the EPA’s Core Program Cooperative Agreement (Core) helps
the division’s Superfund Program carry out its activities and responsibilities under
CERCLA. Furthermore, the Core grant supports DWM in identifying, investigating and
addressing environmentally contaminated sites under CERCLA.

12
The Department of Defense and State Memorandum of Agreement (DSMOA) provides
funding to improve communication, coordination, and cooperation between DOD and
DWM in providing protection of human health and the environment on DOD installations
in Kentucky. The DSMOA program ensures environmental restoration at DOD
installations occur in compliance with applicable state and federal law.
The Federal Facilities Agreement (FFA), a three-party agreement between DOE, EPA,
and Kentucky, was developed to ensure compliance with and avoid duplication between
the corrective action provisions of the Resource Conservation and Recovery Act (RCRA)
permitting program and the corrective action requirements under CERCLA at the PGDP
site. The FFA outlines regulatory structure and guides interactions between the three
parties.
The Five-Year Review Cooperative Agreement (FYR) provides funding from the EPA to
the Superfund Program to perform five-year reviews of remedial action at National
Priority List Sites (NPLs) in Kentucky. The purpose of a five-year review is to determine
whether a site’s ongoing or completed remedial actions will remain protective of human
health and the environment.
The Leaking Underground Storage Tank (LUST) Cleanup Cooperative Agreement with
the EPA provides financial assistance to the Underground Storage Tank (UST) program
with funding to oversee the cleanup of leaking underground storage tanks by responsible
parties and to ensure the cleanup at sites where an owner or operator is unwilling or
unable to take necessary corrective action.
The LUST Prevention Assistance Agreement with the EPA provides financial support for
the development, implementation, and maintenance of the UST program and the
promotion of the detection, prevention, and enforcement of leaky USTs in Kentucky.
With financial support from the Preliminary Assessment/Site Investigation Cooperative
Agreement (PASI), the Superfund Program assists the EPA with the evaluation of sites
with known or suspected releases of hazardous substances, pollutants, or contaminants.
Under PASI, DWM assists the EPA through all aspects of the site assessment process and
helps identify candidate sites for the NPL list, consisting of CERCLA sites that represent
the most significant risk to human health and the environment.
The Resource Conservation and Recovery Grant (RCRA) provides the division’s
Hazardous Waste Management Program with the financial support necessary to
implement RCRA permitting, corrective action, closure, compliance and enforcement in
accordance with the EPA’s performance expectations.
The Support Agency Cooperative Agreement (SACA) provides additional financial
support to the Superfund Program to perform five-year reviews of remedial action at
National Priority List Sites (NPLs) in Kentucky.

13
The EPA’s Substances Control Act (TSCA) Compliance Monitoring Cooperative
Agreement provides financial support to the division to implement the polychlorinated
biphenyls (PCBs) compliance monitoring program. The agreement allows the Field
Operation Branch to perform PCB inspections, generate inspection reports, and track
facility information in the PCB Transformer Registration Database.
Personnel and Administrative Support Section
The Personnel and Administrative Support Section performs support-related duties for PPA and
DWM. These duties include the coordination and procurement of goods and services on state
contracts such as office supplies, equipment, furniture, uniforms, and boots for DWM’s Central
Office. This section provides support in identifying facility needs for division personnel
including workspace logistics and new phone installation.
In addition, this section is tasked with the coordination of employee training and development
along with in-state and out-of-state travel logistics and reimbursement. In FY16, division
personnel completed approximately 5,050 trainings and career development opportunities. This
large increase, over last year, was largely a result of the implementation of new departmental
safety and supervisory training requirements.
In FY16, DWM began full implementation of the Kentucky Enterprise Learning Management
System (KELMS). This new statewide system allows the division to customize learning plans,
track employee progress toward certification plans and programs, participate in eLearning
delivery with automatic transcript reconciliation, and self-registration for agency instructor-led
training. As part of the new department training requirements, DWM employees were enrolled in
various curricula in KELMS based upon their job function. The curricula consist of a series of
required online-training modules and instructor-led courses. All DWM employees were required
to complete the DEP safety training curriculum while field and technical personnel were also
required to complete an additional training curriculum. Expanding on cabinet requirements, the
division also began to implement departmental training requirements for managers and
supervisors.
This section also works closely with the Environmental Response Team (ERT) processing
invoices and payments related to emergency responses and cleanups. In FY16, 44 new ERT
contracts were awarded to vendors, 26 of which were done so under an emergency declaration.
Moreover, this section provides support in pursuing the recovery of response costs when a viable
responsible party is available. For FY16, DWM was able to recover a total of $144,014 in
emergency response costs. These funds were deposited back into the Hazardous Waste
Management Fund, to be utilized again for the remediation of environmental contaminations
throughout Kentucky.

14
Program Development Section
The Program Development Section performs a variety of functions related to the division's future
such as managing planning initiatives and development of regulations along with coordinating
review of proposed bills during the legislative session.
Regulation Development:
The division is currently drafting two regulatory packages to incorporate federal rulemakings.
The Hazardous Waste Program’s administrative regulations are incorporating several federal
rulings including the change to the definition of solid waste. These changes will then be
incorporated into a new authorization package for EPA submittal and approval. Regulations are
also being developed for the Solid Waste Program to permit coal combustion residual facilities
that are generating electricity in response to the federal ruling on April 17, 2015.
Amendments to administrative regulations currently in progress within the division include
revisions to the Recycling and Local Assistance Program (RLA) and the Underground Storage
Tank (UST) Program. RLA amendments include the revisions to several forms to streamline the
reporting process. UST amendments include additional requirements related to delivery
prohibition in an effort to increase compliance.
Legislation:
During 2016 Legislative Session there were amendments for KRS Chapter 224 Environmental
Protection.
KRS 224.50-130 directs the Energy and Environment Cabinet to reclassify any residues of the
demilitarization process (secondary wastes) to ensure proper management and disposal
consistent with the toxicity and hazard potential of those residual waste streams. Before, these
secondary wastes carried the same waste codes. 401 KAR 31:040 was amended to address House
Bill 106 of the General Assembly, which provided for the destruction of chemical munitions at
Bluegrass Army Depot. This administrative regulation also reclassified aluminum processing
wastewater from the automotive industry as a nonacute hazardous waste under specific
circumstances, including that the waste shall not be placed on the land. This statute became
effective April 6, 2016.
The new tire fee established in KRS 224.50-868 was extended as a part of the budget bill until
June 30, 2018, to provide funding for waste tire amnesties, crumb rubber grants, tire-derived fuel
projects, grants to counties for tire recycling and disposal, and to administer the waste tire and
solid waste programs. The previous deadline was June 30, 2016.
KRS 224.60-130 requires the cabinet to make reimbursements of corrective action projects
performed under the petroleum storage tank account shall be carried out on or before July 15,
2024. The previous deadline was July of 2019.

15
KRS 224.60-142 extended the deadline for the owners of any petroleum storage tanks to register
for participation in the fund, submit affidavits and file applications for their tanks in the
Petroleum Storage Tank Environmental Assurance fund July 15, 2021. The previous deadline
was July of 2019.
KRS 224.60-145 extended the small operator assistance account and small operator tank removal
account programs July 15, 2021. The previous deadline was July of 2016. Also, “sunsetting of
account claims activity” was added to the title of the statute.
Reports:
Two legislative reports were prepared in FY16. The Hazardous Waste Management Fund Report
provided information related to the commonwealth’s Hazardous Waste Management Fund
(HWMF) including information related to the expenditures and revenues of the HWMF for fiscal
years 2015 and 2016. The Waste Tire Trust Fund Report discussed the expenditures and
revenues, effectiveness in developing markets and the fee in funding the cabinet’s
implementation of the waste tire program and recommendations for improvement for Kentucky’s
Waste Tire Program.
Additional reports prepared included the division’s Strategic Operational Plan and mid-year
status updates of planning initiatives for 2016, and DWM’s portion of the Quality Assurance
Annual Report.
BRANCH HIGHLIGHT
New 300 Building at Sower Boulevard By John Maddy
On June 19, 2015, former Secretary Leonard Peters officially announced the Energy and
Environment Cabinet (EEC) had been selected as the primary occupants of a new facility being
constructed at 300 Sower Boulevard, located on the south side of Frankfort, with a completion
date of June 30, 2016. The announcement was significant as it would be the first time all
Frankfort EEC agencies would be located in one building.
By August 2015, cabinet and department committees were established to plan and facilitate the
eventual move to the Sower location deemed the 300 Building. The committees met on a routine
basis to discuss issues, make necessary assignments, and recommend policy decisions to the
Cabinet Secretary related to the new facility and move. As the Department for Environmental
Protection (DEP) had accumulated files, supplies, furniture and personal items over the years at
the Fair Oaks campus, it was obvious that cleaning efforts would be necessary in order to ready
the agency for the move. As a result, DEP had to accelerate its ongoing Paper Elimination
Project, with staff putting in extra hours to ensure paper files were accurately scanned and
archived into the TEMPO enterprise system. Several cleanup days were also held during the
spring and fall seasons to downsize the amount of agency files and equipment.

16
The primary construction of the new facility would be completed ahead of schedule. This
allowed EEC agencies to begin moving in on June 1, 2016, a full month before originally
planned. Over a series of four weeks, agencies transferred personnel, files and equipment from
various EEC facilities within Frankfort and Franklin County. In most cases, EEC personnel
experienced less than a 24-hour downtime as they were relocated, minimizing any interruption to
business operations. The Kentucky Education and Workforce Development Cabinet and the
Kentucky Department of Education have joined EEC in the new office building.
The new building, a five-story, 371,160 square foot structure, was constructed to house 1,457
employees. In February of 2015, the Finance and Administration Cabinet signed a design-build-
finance-operation agreement with CRM/Wilburn LLC, a building management company based
in Lexington. As a public-private partnership, also referred to as a P3, the state would lease the
building for the next 35 years before taking ownership under the agreement.
As a LEED (Leadership in Energy and Environmental Design) certified facility, the building was
designed to have a 19 to 26 percent reduction in utility expenditures compared to existing
offices. A large number of energy efficiency and sustainability items were installed, including
natural day lighting, LED fixtures, high-efficiency mechanical equipment and low-flow
plumbing. The building also included a one-mile walking trail around the building, wildlife
habitat areas with native grass and plant landscaping, a fleet parking lot and five inclement
weather shelters to provide protection for employees. Still to come, the building will include a
food service area with a capacity for up to 200 employees, a snack bar and an on-site employee
health clinic. In addition to the several amenities scheduled to be completed in the coming
months, a 4,000 square foot building that will house fleet management offices and equipment
storage will be constructed.
New State Office Building at 300 Sower Blvd., Frankfort, Kentucky
EEC Photo

17
FIELD OPERATIONS
The mission of the Field Operations Branch is to identify and abate imminent threats to human
health and the environment through fair and equitable inspections, technical assistance and
education.
This branch performs inspections at sites managing solid waste, hazardous waste, underground
storage tanks (USTs) and polychlorinated biphenyls (PCBs). The primary duty of a regional
inspector is to inspect for the compliance of regulated facilities.
This branch includes a central office and ten waste management regional offices located
throughout Kentucky. Regional personnel are familiar with the local waste management issues
and can respond to questions and concerns.
Figure 4
During FY16, the Field Operations Branch conducted a total of 6,722 UST, solid waste, and
hazardous waste inspections. There was a two percent decrease over FY15 (Figure 4).
This branch conducted 3,558 UST inspections, fifty-three percent of the overall totals this fiscal
year. This was one percent higher than the previous fiscal year. The compliance rate for UST
inspections increased one percent over the previous year, to 52%. The increase in compliance
0
100
200
300
400
500
600
700
800
Ju
l-1
5
Au
g-1
5
Sep
-15
Oct
-15
No
v-1
5
Dec
-15
Jan
-16
Feb
-16
Mar-
16
Ap
r-1
6
May
-16
Ju
n-1
6
DWM Inspections
Underground Storage Tank Hazardous Waste Solid Waste

18
rates can be attributed, in part, to awareness of the new regulations which incorporated
provisions of the Energy Policy Act of 2005. There was a nine percent decrease of UST Notices
of Violations in FY16 compared to FY15.
There were 1,644 solid waste inspections conducted. The compliance rate for solid waste
facilities was 68%, remaining the same as the previous fiscal year.
This branch conducted 1,524 hazardous waste inspections during FY16, a six percent decrease
from the previous year. This decrease was due, in part; to reduced inspections for conditionally
exempt small quantity generators. These generators are typically in compliance with fewer
requirements and are not required to be inspected by DWM’s grant. The compliance rate
remained at the previous year’s rate, 82%.
There were 2,009 complaint investigations conducted; an eight percent decrease from fiscal year
2015.
Overall, there were a total of 8,731 inspections and investigations conducted, an eight percent
decrease from the previous year.
Figure 5
Note: “Compliance Rate” means the percent of total inspections when an inspector recorded no
violation had occurred. This does not include investigations triggered by citizen complaints.
“UST TCI” means a technical compliance inspection for a site’s USTs.
0%
10%
20%
30%
40%
50%
60%
70%
80%
90%
100%
Ju
l-1
5
Au
g-1
5
Sep
-15
Oct
-15
No
v-1
5
Dec
-15
Jan
-16
Feb
-16
Mar-
16
Ap
r-1
6
May
-16
Ju
n-1
6
DWM Compliance Rates
Solid Waste Compliance Rates UST TCI Compliance Rates
Hazardous Waste Compliance Rates

19
Emergency Response
KRS 224.1-400 establishes the cabinet as the lead agency for
hazardous substance, pollutant or contaminant emergency spill
response. The Department for Environmental Protection maintains
a roster of field personnel who serve as part of the Environmental
Response Team (ERT). They are the first to respond to
environmental emergencies. In FY16, the ERT Team had 12,943
incidents, 531 emergency responses and closed 525 cases.
ERT is part of the Kentucky Natural Disaster Plan, which was
formed after the severe tornados of 1974. They respond to natural disasters such as floods,
tornados and other severe weather, earthquakes, forest fires, landslides and water shortages.
During natural disasters, ERT helps ensure the stability of hazardous materials and works to limit
environmental damage.
BRANCH HIGHLIGHT
Inspection Schedule for River Cities Disposal By Brian Osterman
An Agreed Order of
Judgment was entered by
Boyd Circuit Court between
the Citizens of Boyd County
Environmental Coalition,
Inc. and River Cities
Disposal, LLC, and the
Energy and Environmental
Protection Cabinet (EEC) on
November 24, 2015. One of
the provisions was for the
cabinet to provide the
equivalent of one full-time
Department of
Environmental Protection
staff member to monitor
conditions at River Cities
Disposal’s facility at Big
Run Landfill until
completion of the final cap.
The location and acreage was
also stipulated in the agreement.
Big Run Landfill, Installation of Final Cap, South Slope, Units 1 & 2, Phase
2
Photo by DWM’s Morehead Regional Field Office

20
The Division of Waste Management’s (DWM) Morehead Regional Field Office was tasked with
preparing an inspection rotation schedule; Monday through Friday and also including Saturdays,
until September 1st, 2016, per the agreed order.
Big Run Landfill is scheduled to complete final construction of the cap by September 1st as
ordered. The Morehead Regional Field office personnel have conducted 71 inspections resulting
in 443 hours worked to ensure compliance with the Agreed Order. Thirteen of the inspections
were held on Saturday. This branch’s employees voluntarily worked several Saturdays at the
landfill, cooperating as a team for maximum effectiveness. DWM was required to provide staff
onsite during the construction phase of the final cap. Twenty-five acres were being closed and
rail waste was no longer being accepted. Big Run Landfill is on schedule to complete the final
construction phase of the cap by September 1st per the agreed order.

21
HAZARDOUS WASTE
The Hazardous Waste Branch oversees the management of hazardous waste from generation to
disposal. This involves the promotion of hazardous waste minimization, hazardous waste
management, and remediation of hazardous waste releases. These activities are accomplished
through permitting, corrective action (cleanup), registration and reporting requirements.
Hazardous Waste Corrective Actions
The Corrective Action Section completed several significant activities of interest during the 2016
fiscal year are described below. It is noteworthy that, through many years of work, all state-lead
sites have now attained the “Human Exposures Controlled” and “Groundwater Releases
Controlled” Environmental Indicators (EI) designation; two measures of progress tracked by the
U.S. Environmental Protection Agency (EPA) and Congress. This section has continued to meet
or exceed U.S. EPA progress goals for EI’s determinations, groundwater monitoring system
inspections, renewal and issuance of post-closure permits, and the review of work plans and
reports.
Environmental Indicators Determinations Completed:
In FY 2016, sixteen EIs were completed. A “Human Exposures Controlled” and a “Groundwater
Releases Controlled” determination were completed for the Federal Mogul facility. There was a
“Remedy Selected” accomplishment for the former Rohm and Haas site. Two “Remedy
Constructed” determinations were completed for: Dyno Nobel and Huntington Alloys.
Determinations were made documenting “Corrective Action Performance Standards Attained” or
“Corrective Action Terminated” for eleven facilities.
Groundwater Monitoring System Evaluations Conducted:
Six groundwater monitoring system evaluations were conducted during FY 2016. Operations and
Maintenance (OAMs) inspections were conducted at these sites: Ashland Route 3, Ashland
Viney Branch, Dow Corning, Hallmack and Luvata Franklin. A Groundwater Monitoring
Evaluation was conducted at Fort Knox. No major problems were discovered with any of the
monitoring programs inspected.
Post-Closure Permits Renewed/Issued/Tentatively Terminate:
The post-closure permit for the Luvata facility was renewed during FY 2016. The former Collis
facility’s post-closure permit was officially terminated.
22
Investigation and Remediation Work Plans and Reports Found Deficient or Approved:
During FY 2016, forty-five investigations and remediation work plans, reports and associated
documentation submittals were acted on. Nine Approvals or Notices of Technical Inadequacies
were completed for Corrective Measures Study/Corrective Measures Implementation Plans.
Three Interim Measures Work Plans were approved. The relatively high number of CMS/CMI
activities is indicative of the maturation of the program with more facilities reaching the
remediation phase, as many investigations are complete or near completion. Significant progress
in the planning, physical or legal phases of the remedial process was made at the Philips
Lighting, Lexmark, Arkema, Continental Refining, Federal Mogul, Rail Services, and Rohm and
Haas sites.
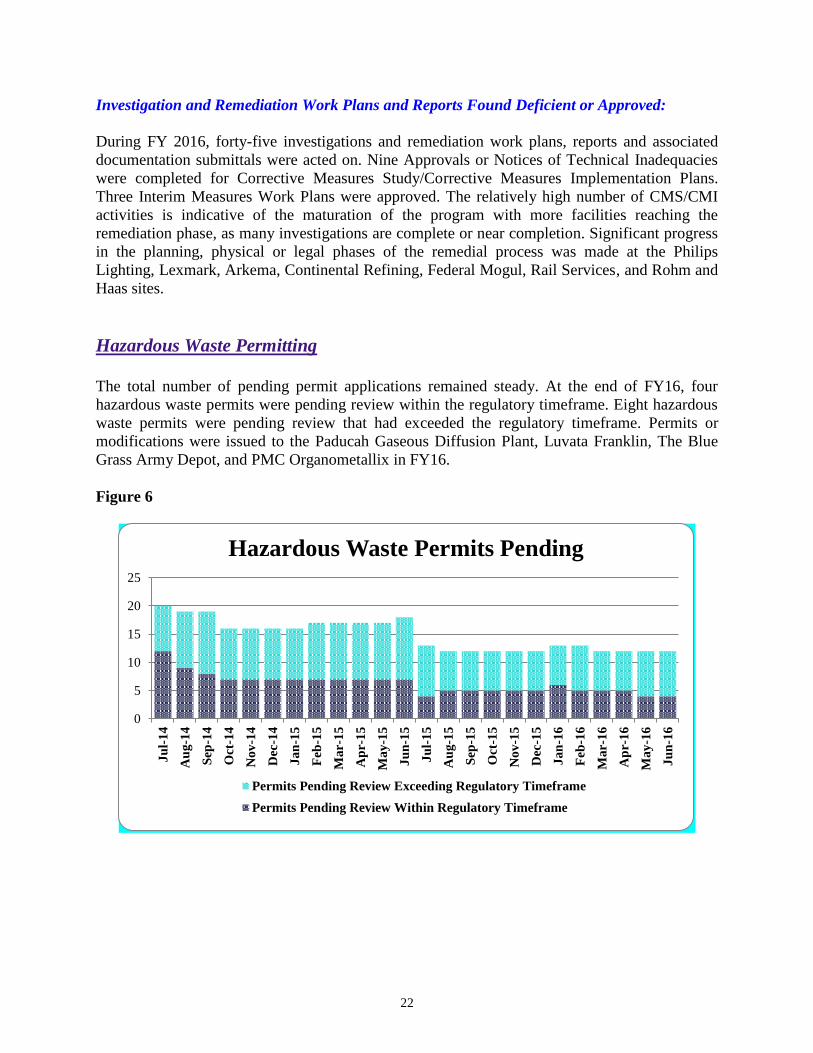
Hazardous Waste Permitting
The total number of pending permit applications remained steady. At the end of FY16, four
hazardous waste permits were pending review within the regulatory timeframe. Eight hazardous
waste permits were pending review that had exceeded the regulatory timeframe. Permits or
modifications were issued to the Paducah Gaseous Diffusion Plant, Luvata Franklin, The Blue
Grass Army Depot, and PMC Organometallix in FY16.
Figure 6
0
5
10
15
20
25
Ju
l-1
4
Au
g-1
4
Sep
-14
Oct
-14
No
v-1
4
Dec
-14
Jan
-15
Feb
-15
Mar-
15
Ap
r-1
5
May
-15
Ju
n-1
5
Ju
l-1
5
Au
g-1
5
Sep
-15
Oct
-15
No
v-1
5
Dec
-15
Jan
-16
Feb
-16
Mar-
16
Ap
r-1
6
May
-16
Ju
n-1
6
Hazardous Waste Permits Pending
Permits Pending Review Exceeding Regulatory Timeframe
Permits Pending Review Within Regulatory Timeframe

23
BRANCH HIGHLIGHT
Hazardous Waste Regulation Changes By Dale Burton, P.G.
On March 25, 2016, House Bill 106, which proposed changes to KRS 224.50-130, was passed by
the Kentucky General Assembly. The bill was signed into law by Governor Matthew G. Bevin
on April 6. This bill included an emergency provision, and thus became effective upon the
governor’s signature.
KRS 224.50-130 is a Kentucky statute, originally approved in 1988, that specifies requirements
related to the storage and treatment of nerve and blister agents at the Blue Grass Army Depot in
Richmond. The 2016 changes to the statute consisted of two main parts:
1) The Energy and Environment Cabinet is directed to reclassify secondary
wastes, created by the destruction of the chemical weapons, to ensure
proper management and disposal of those waste streams. All of these
secondary wastes will have already met strict treatment standards to
destroy the chemical agents. Previously, the secondary wastes would have
carried the same waste codes as the agent-filled weapons themselves, and
could have led to confusion in the event of an emergency response
incident.
2) The destruction facility, which consists of the Blue Grass Chemical Agent
Disposal Pilot Plant (BGCAPP) and the Explosive Destruction
Technology (EDT) operation, is required to provide assurance of chemical
agent destruction and removal efficiency (DRE) of 99.9999% (“six
nines”). Previously, the requirement was to meet “six nines” destruction
efficiency (DE). The technical change from DE to DRE is consistent with
the approach used at other stockpile destruction facilities, and will allow
the facility to include removal of agent using carbon filtration as part of
the efficiency measurement. The older DE standard would have been
virtually impossible to measure accurately due to the extremely low levels
of agent involved.
Both changes necessitated revising the associated regulations. Change number one resulted in the
cabinet’s promulgation of an emergency regulation, 401 KAR 31:040E, which was signed by
Governor Bevin on April 24, 2016, and immediately became effective. The regulation specifies
16 new secondary waste codes which result from the destruction of the chemical weapons.
Change number two affected 401 KAR 34:350, which is scheduled to be revised later this year as
part of a larger regulation update package. However, these changes can be implemented in the

24
meantime as a statute takes precedence over a regulation, and the corresponding regulation only
requires a technical change.
The changes to 401 KAR 31:040 also included two unrelated updates that were needed to keep
Kentucky’s Hazardous Waste Program equivalent to the federal Resource Conservation and
Recovery Act (RCRA):
1) Hazardous waste listing F019 was updated to match the federal regulation,
which exempted wastewater treatment sludges from zinc phosphating
when used in motor vehicle manufacturing.
2) The regulation excluding comparable/syngas fuels from the Hazardous
Waste Program was deleted because the U.S. Environmental Protection
Agency removed the rule due to an order issued by the D.C. Court of
Appeals on June 27, 2014.
In summary, the statutory changes will streamline the management of secondary wastes, and will
allow more accurate calculation of the chemical agent destruction and removal efficiency.
Neither change will affect the safety or protectiveness of the mission to destroy the chemical
weapons.

25
RECYCLING & LOCAL
ASSISTANCE
The Recycling and Local Assistance Branch provides technical and financial assistance and
training to public and private entities on solid waste and recycling, while promoting individual
responsibility and accountability for proper solid waste management.
In accordance with KRS 224.43-315, recyclers are required to report annually to their county the
amount of municipal solid waste collected for recycling by volume, weight, or number of items,
and the type of items recycled. Data received for the 2015 report year showed a statewide
recycling rate of 36.6 percent, which is a small decrease from 37.7 percent in 2014. This
fluctuation may be due to market forces (low commodity prices) or simply reflect minor
inconsistencies in data collection and reporting methodologies from year to year. This branch
relies on individual counties and recycling operations to report accurate data. A strong effort is
made to confirm and cross check these numbers, however, it is not always possible to ensure that
entities are generating their data consistently and uniformly.
Figure 7
While recycling of metals and paper has grown significantly, statewide data shows a large drop
in total glass, plastics and electronic scrap recycling since 2014. Specific recyclable commodity
markets are discussed below.
0%
5%
10%
15%
20%
25%
30%
35%
40%
0
500,000
1,000,000
1,500,000
2,000,000
2,500,000
3,000,000
2006 2007 2008 2009 2010 2011 2012 2013 2014 2015
Kentucky Tons Recycled
Tons Recycled Percentage of Total Waste Recycled

26
The State Office Paper Recycling Program
The Government Recycling Section continues to operate the State Office Paper Recycling
Program, serving more than 115 agencies in Frankfort. This program continues to be self-
supporting; funding nine full-time and two temporary employee positions.
The program offers free pickup and document destruction of governmental office paper. Their
location on Northgate Drive in Frankfort offers a secure environment to ensure proper processing
of confidential documents. Office paper represents 80 percent of the waste stream in the office
environment. Since 2006, state employees recycled more than 15,062 tons of waste paper,
generating approximately $2.5 million in revenue. In 2015, state employees recycled 1,262 tons
of waste paper, an average of approximately 232 pounds per state employee. It is notable that
this section saw a significant increase in revenue in 2015. This is likely due to improved sorting
techniques that resulted in a higher market value for the processed paper.
Figure 8
The Marketplace
Through publication of The Marketplace
newsletter, the division reports on the
prevailing prices paid for aggregate
recyclable materials. The charts in figures
nine through twelve demonstrate the trends
for various commodities.
$0
$50
$100
$150
$200
$250
$300
$350
$400
0
200
400
600
800
1,000
1,200
1,400
1,600
1,800
2,000
2006 2007 2008 2009 2010 2011 2012 2013 2014 2015
Rev
enu
e (T
ho
usa
nd
s)
To
ns
State Office Paper Recycling Totals
Total Amount of Recycled Paper Revenue

27
Figure 9
Notes:
“Corrugated Containers” (OCC) means, typically, brown cardboard boxes.
“Mixed Paper” means a lower grade of material that includes slick advertising inserts, junk mail,
paperboard containers and other types of paper mixed together.
“Newsprint #6” (ONP) means baled newspaper that typically has more advertising slicks, paper
and plastic bags, magazines, and types of paper other than newsprint.
“Newsprint #8” (ONP) means baled sorted newspaper, with no sun exposure, with the typical
amount of slick advertising inserts, as would be delivered to a home or at a newsstand.
“Sorted Office” (SOP) means an assortment of white, colored and coated, ground wood-free
copier and printer paper.
“Sorted White Ledger” (SWL) means white paper.
Recycled paper will continue to be critical to the shipping industry (cardboard containers), some
media (news, magazines, junk mail and bills), commerce/business, and tissue/toweling. All of the
producers of these items are heavily invested in using recycled content and must have reliable
volumes of quality fiber to support their production. There is no alternative in the foreseeable
future. The available tonnage of recyclable paper/paperboard will continue to dwindle, but
demand is expected to stay consistent, leading to increasing prices for recovered paper.
Bulk grades such as Mixed Paper, ONP, and OCC are actively, if slowly, moving upward. Slow
growth is good and drastic declines are not likely. SOP and SWL are stagnant but on the verge of
coming back to previous levels.
National and international overcapacity of processed commodities and the strength of the U.S.
dollar against foreign currencies are affecting the recycled fiber market.
0
50
100
150
200
250
Ju
l-1
4
Au
g-1
4
Sep
-14
Oct-
14
No
v-1
4
Dec
-14
Jan
-15
Feb
-15
Mar-1
5
Ap
r-1
5
May
-15
Ju
n-1
5
Ju
l-1
5
Au
g-1
5
Sep
-15
Oct-
15
No
v-1
5
Dec
-15
Jan
-16
Feb
-16
Mar-1
6
Ap
r-1
6
May
-16
Ju
n-1
6
$/T
on
Fiber Recyclables Market ($/ton)
Mixed Paper Sorted Office Newsprint #6
Newsprint #8 Sorted White Ledger Corrugated Containers

28
Figure 10
The depressed price of natural gas/petroleum has kept pricing for recycled resins down, but
export movement has increased substantially, particularly to China, so increased pricing is
anticipated to follow in the future.
Figure 11
Residential glass recycling remains problematic due to single stream/curbside collection results
in cross contamination of materials (co-mingled colors and glass with paper mixed in) which
greatly diminishes its market value. Glass prices are “break-even” at best. Many recycling
operations find the best uses are in local projects such as roadbed amendment, landscaping
0
10
20
30
40
50
60J
ul-
14
Au
g-1
4
Sep
-14
Oct
-14
No
v-1
4
Dec
-14
Jan
-15
Feb
-15
Mar-
15
Ap
r-1
5
May
-15
Ju
n-1
5
Ju
l-1
5
Au
g-1
5
Sep
-15
Oct
-15
No
v-1
5
Dec
-15
Jan
-16
Feb
-16
Mar-
16
Ap
r-1
6
May
-16
Ju
n-1
6
cen
ts/l
b.
Plastic Recyclables Market (cents/lb.)
PET HDPE
0
5
10
15
20
25
30
35
Ju
l-1
4
Au
g-1
4
Sep
-14
Oct
-14
No
v-1
4
Dec
-14
Jan
-15
Feb
-15
Mar-
15
Ap
r-1
5
May
-15
Ju
n-1
5
Ju
l-1
5
Au
g-1
5
Sep
-15
Oct
-15
No
v-1
5
Dec
-15
Jan
-16
Feb
-16
Mar-
16
Ap
r-1
6
May
-16
Ju
n-1
6
$/T
on
Glass Recyclables Market ($/ton)
Clear Amber Green

29
mulch or decorative art projects. It is difficult to avoid taking glass in community recycling
programs, and minimizing the handling cost of this material is often the best option.
Figure 12
Both ferrous and non-ferrous metals are in weak demand. Ferrous value increased to $50/metric
ton in April 2016 and there is hope this represents the start of a consistent upward climb in the
industry.
Scrap steel (including white goods, i.e., appliances), steel cans, aluminum and copper bearing
scrap will continue to be in demand, especially as the global economy continues to improve.
Most of these items require little or no processing which makes them valuable additions to a
community recycling program.
Waste Tire Trust Fund
The Waste Tire Trust Fund (WTTF)
was reauthorized by the General
Assembly in their 2016 session and
will remain effective until June 30,
2018. A one dollar fee on the sale of all
new motor vehicle tires sold in
Kentucky provides WTTF funding.
This fund is used to conduct waste tire
collection events, provide annual
funding directly to counties for waste
tire management, award crumb rubber
0
10
20
30
40
50
60
70
80
90
0
20
40
60
80
100
120
140
160
Ju
l-1
4
Au
g-1
4
Sep
-14
Oct
-14
No
v-1
4
Dec
-14
Jan
-15
Feb
-15
Mar-
15
Ap
r-1
5
May
-15
Ju
n-1
5
Ju
l-1
5
Au
g-1
5
Sep
-15
Oct
-15
No
v-1
5
Dec
-15
Jan
-16
Feb
-16
Mar-
16
Ap
r-1
6
May
-16
Ju
n-1
6
cen
ts/l
b.
$/G
ross
To
n
Metal Recyclables Market
Steel Cans($/gross ton) Aluminum (¢/lb.)
Tires Used at Former Race Track as Barrier, Gallatin County
Photo by Chris Craig

30
grants, facilitate market development for the use of waste tires, and clean up waste tires at
mismanaged sites. In 2011, House Bill 433 established a Waste Tire Working Group to advise
the cabinet on administering and implementing alternative methods for controlling waste tires,
develop a formula to apportion money in the WTTF and prepare an annual report for the General
Assembly. Beginning in 2011, the cabinet offered a $3,000 annual grant available to counties for
recycling or disposal of waste tires; which has increased and is now $4,000.
Crumb Rubber Grants:
From 2004 to 2016, the cabinet awarded 441 grants totaling more than $7.78 million to local
governments, schools, daycares, churches and other entities for the use of crumb rubber made
from recycled tires. It can be used for athletic fields, playgrounds, walking trails, landscaping
and gym floors, etc. Nineteen grants were awarded for a total of $249,526, primarily for
landscaping applications, in FY16.
Henderson County Crumb Rubber Mulch Project
Photos provided by Henderson County
Pursuant to KRS 224.50-855, The Waste Tire Working Group (WTWG) is a committee
appointed by the governor to discuss and research topics in waste tire management and make
recommendations to the cabinet for proposed changes to applicable statutes and regulations in an
effort to improve Kentucky’s programs. The WTWG consists of the director or their designee,
and the manager of DWM’s Recycling and Local Assistance Branch, Gary Logsdon. Members
appointed include Harlan Hatter, representative of the Kentucky Department of Agriculture;
Kelly Bowlin, Boone County Solid Waste Coordinator and Scott Tussey, Madison County Solid
Waste Coordinator, Mayor Martin Voiers of Flemingsburg, and Joe Durkin, a representative of
retail tire sales in private industry. Judge Jim Townsend resigned and will be replaced with a
county judge/executive. Their meetings are open to the public.

31
Rubber Modified Asphalt:
In the spring of 2016, the Recycling and Local Assistance Branch launched the Rubber-Modified
Asphalt Chip Seal Grant program. The grant was open to counties for the application of chip seal
on county roads utilizing rubber-modified asphalt (RMA). Chip seal is a process that combines
one or more layers of asphalt with one or more layers of aggregate used to extend the life of an
existing road surface. In June 2016, DWM announced that up to $500,000 would be awarded for
RMA chip seal projects in the counties of Fleming, Hart, Metcalfe, Trigg, Webster, and Whitley.
Kentucky Pride Fund
The Kentucky Pride Fund (KPF) is supported by an environmental remediation fee of $1.75 per
ton of waste disposed in Kentucky landfills. This money is used for closure of historical landfills,
recycling grants, household hazardous waste management grants, and remediation of illegal open
dumps. Additionally, the fund receives $5 million annually from the Transportation Cabinet
specifically for distribution to counties and incorporated cities for litter abatement activities.
Litter Abatement:
DWM began tracking the cost of litter activities and the amount of litter collected in 2001. State
litter abatement grant funding through the KPF began in FY2002. In 2015, counties removed
515,191 bags of litter (10,303,820 pounds) from 170,478 miles of Kentucky roadways. Litter
collection costs totaled $8.1 million, an average cost of 79 cents per pound. Litter collection is
costly, at $1,576 per ton, when compared to the average landfill disposal rate of $39.05 per ton.
The most common items found on roadways are plastic bottles and food containers.
Figure 13
Note: The amount of litter collected on public roads may not include litter collected by state road crews as part of
the Department of Transportation’s efforts to maintain state roads.
$0
$2
$4
$6
$8
$10
0
100,000
200,000
300,000
400,000
500,000
600,000
700,000
800,000
900,000
2006 2007 2008 2009 2010 2011 2012 2013 2014 2015 Do
lla
rs S
pen
t C
oll
ecti
ng
(M
illi
on
s)
Nu
mb
er o
f B
ag
s C
oll
ecte
d
Litter Abatement
Number of Bags Collected Dollars Spent Collecting

32
There is a significant variation of dollars spent per number of bags collected over the last ten
years (Figure 13). Collection and recordkeeping procedures may not be uniform among the
counties and expenses, such as education and outreach that do not contribute to the number of
bags collected, can vary considerably from year to year.
Recycling and Household Hazardous Waste:
In 2006, the KPF Fund was amended to provide grants for the development and expansion of
recycling programs and household hazardous waste (HHW) management. In FY16, 71 entities
were awarded grants for over $3.3 million. Forty-six recycling grants were awarded to cities,
counties, and universities. These grants help fund the establishment or expansion of recycling
operations. The goal of the Recycling Grant Program is to build recycling infrastructure, often in
areas where few of these opportunities for citizens exist, with an emphasis on regional
cooperative efforts.
Twenty-five counties were awarded HHW grants. In FY16, over 366,000 tons of HHW was
collected by counties through the HHW Grant Program. Materials collected included electronic
scrap, pesticides, solvents, mercury and other potentially hazardous products from residences.
One pilot composting grant was also awarded in FY 2016, and more composting projects may
possibly be funded in the future. The cities or counties receiving the grant award are required to
provide a 25 percent local match, in the form of cash or “in-kind” personnel, educational
activities/materials or advertising to promote the program.
Figure 14
0.0
0.5
1.0
1.5
2.0
2.5
3.0
0
100
200
300
400
500
600
700
800
900
2006 2007 2008 2009 2010 2011 2012 2013 2014 2015
Co
st o
f C
lea
nu
ps
(Mil
lio
ns)
Nu
mb
er o
f D
um
ps
Illegal Open Dump Cleanups and Expenditures
New Dumps Dumps Cleaned Up Dumps Remaining Cost
33
Cleanup of Illegal Open Dumps:
Financial assistance through the Kentucky Pride Fund Illegal Open Dump Grant Program has
provided counties the incentive and necessary resources to identify and rid their communities of
old dumpsites. Since the current format of this program was developed in 2006, more than $16.9
million has funded the cleanup of 1,805 dumpsites. In 2015, counties cleaned 102 illegal open
dumps at a cost of $761,347, collecting 3,713 tons of waste. The twelfth round of grants was
awarded in January 2016 for the remediation of 139 dumpsites at a projected cost of $1.75
million. There were 121 known dumpsites remaining at the end of 2015.
Figure l4 shows all documented dump cleanups, including many sites cleaned with funding
sources other than the Illegal Open Dump Grant. Overall, more than 25,800 illegal open
dumpsites have been cleaned at a cost of $77.9 million dollars since 1993.
E-Scrap Recycling
The challenging issue of properly managing waste computer and electronic parts and equipment
(e-scrap) continues to be emphasized throughout the state. Over 50 counties reportedly offer
some type of e-scrap collection, whether year-round drop-off programs or periodic events.
Nearly 2,300 tons of e-scrap was reported to have been collected in 2015. This is significantly
less than the nearly 3,000 tons in 2014, possibly due to issues with the statewide e-scrap
collection contract.
Since 2009, the state has had an e-scrap contract awarded by the Finance and Administration
Cabinet. This “all-agency” contract allowed the executive, judicial, and legislative branches of
government, school districts, universities, and any other public not-for-profit organizations
convenient access to e-scrap recycling. The contract provided for statewide pickup and recycling
services and was unique in that the vendor would typically pay the generator a small
reimbursement for the items collected. From January 2009 to September 2015 over 7,937 tons of
e-scrap was collected and refurbished or recycled in an environmentally sound and data-secure
manner. Payments to generators netted over $494,000 during that period.
However, in late 2015 the statewide e-scrap contractor, Global Environmental Services, was
found to be in violation of several environmental regulations and their contract voided. This was
the second vendor to go out of business while holding the statewide contract. While management
and internal issues likely played a significant role in both instances, it became clear that the e-
scrap management industry as a whole was struggling. DWM is exploring different models for
another statewide e-scrap contract that offers value and convenience to generators while also
attractive to potential vendors.
DWM also promotes proper management of e-scrap through their HHW Grant Program. Since
2006, the Kentucky Pride Fund has provided grants awards for the management of HHW, a
category that includes e-scrap and mercury.

34
BRANCH HIGHLIGHT
Rubber-Modified Asphalt Chip Seal Pavement Grant By Christopher “Kitt” Tuttle
One of the many duties of the Recycling and Local Assistance Branch (RLA) of the Division of
Waste Management (DWM) is to aid in the development of markets for recycled tires. A recently
successful example is the rubber mulch industry, which became firmly established in Kentucky
over the past 12 years with the aid of state grants for the application of rubber mulch
manufactured by Kentucky processors using Kentucky waste tires.
RLA set forth to increase
its portfolio of grants to
expand markets for waste
tires after the success of the
rubber mulch grants. After
extensive research, the next
endeavor would be to test
the efficacy of adding
ground rubber from waste
tires to asphalt for roadway
applications. Rubber-
modified asphalt (RMA) is
utilized in the same manner
as conventional asphalt,
except it has been amended
with processed tire rubber.
The rubber that is added to
the asphalt is very finely
ground (typically 30-mesh),
which gives the rubber a
similar appearance to coffee
grounds. Application of Conventional-Asphalt Chip Seal in Whitley County, 2016
Photo by Christopher “Kitt” Tuttle
As of 2016, 25 states in the U.S. have performed road projects utilizing RMA. While it was
originally implemented due to its superior durability, it was also discovered that it served as a
sound dampener as well. States as far south as Florida and Texas, and as far north as Alaska have
utilized RMA on their roads. While it is used across the country, many states have performed
their own research on specifications since climate, elevation, geology, and building materials can
affect asphalt performance. Since 2005, RMA has been the end-use of one to two percent of all
waste tires that go to market in the U.S. (Rubber Manufacturers Association Annual Report
2013).

35
In September of 2013, RLA and Kentucky’s Transportation Cabinet (KYTC) performed a pilot
project using RMA in Campbell County. The project involved paving one lane of Kentucky
Route 8 (KY-8) with RMA, and the adjacent lane with conventional asphalt. KYTC funded the
project, with DWM providing additional funding to cover the difference in cost of the RMA
from the conventional asphalt. Multiple quality control and comparison tests have been
performed and the study is on-going. Preliminarily, the RMA section of the road was found to be
less permeable than the conventional asphalt. Lowered permeability is a key benefit, as this
prevents water intrusion which leads to pothole formation.
After the successes of the KY-8 pavement project, RLA determined that a grant program for the
application of chip seal with RMA would be beneficial to Kentucky counties and also serve as a
research project in a little used application of RMA. Chip seal is a process that combines one or
more layers of asphalt with one or more layers of aggregate and is applied to an existing road
surface. It is routinely used to extend pavement life, typically on lower traffic roads.
After several months researching RMA and the chip seal process, the grant application was
finalized. The state would provide funding for a section of county road to be chip sealed utilizing
RMA, while the grantees would fund the chip seal of an equal distance of road with conventional
asphalt to provide a proper comparison for study. Metrics for judging the applications included
the county’s prior experience with chip seal, availability of a road suitable for a pilot project and
condition of the proposed road. Additionally, due to Kentucky having varied geology and
topography across its landscape, at least one project would be selected from each of the north,
south, east and west regions of the state.
DWM received 13 grant applications from all over the Commonwealth. After review of the
applications, representatives from DWM visited all of these counties to meet with project
coordinators and tour the proposed roads. Originally, only four grants were planned to be
awarded; due to the abundance of qualified applicants the number of awards was expanded to
six.
In June 2016, DWM announced that up to $500,000 dollars would be awarded to the grantees in
these counties: Fleming, Hart, Metcalfe, Trigg, Webster and Whitley. The grantees immediately
began their bid processes to find RMA contractors for their respective projects. In accordance
with the grant agreement, the projects must be completed by the December 31, 2016, deadline.
Most recipients are expected to be completed by September and October.
This grant not only promotes recycling of waste tires, but also provides funding for counties to
make improvements for distressed roadways. It is anticipated that this grant will grow in
popularity, dependent on available funding, and there are plans to expand the program to include
more grantees in the future.

36
SOLID WASTE
The mission of the Solid Waste Branch is to ensure Kentucky’s waste is managed properly. This
is accomplished by implementing a comprehensive program for solid and special waste disposal
facilities. This branch reviews permit applications, issues permits, and monitors construction and
operational activities at solid and special waste facilities.
The Solid Waste Branch is responsible for reviewing technical applications and reports for all
types of landfills, including residential garbage, construction debris, industrial waste, and coal
ash, in addition to land application and composting facilities. Of these waste streams, they may
be grouped into solid waste or special waste. Solid waste may be household, commercial, or
industrial solid waste. Municipal solid waste is household and commercial solid waste. Special
waste is specifically defined by KRS 224.50-760. The most commonly managed special wastes
in Kentucky are wastewater treatment and water treatment sludges and utility-generated coal ash.
This branch issues or denies construction and operation permits based on information provided
by the applicant and verified by its own personnel. This branch is also responsible for the
registration of solid waste permit-by-rule facilities and closure of abandoned historic landfills.
As the total population in Kentucky has increased, so has waste generation (Figures 15 and 16).
In 2015, Kentucky’s population reached 4,425,092. It is imperative for residents to have easily
assessable collection services, disposal facilities, and recycling facilities.
It is encouraging that Kentucky’s recycling rate is increasing as well. Kentucky’s recycling rate
in Figure 18 also shows a small decrease, from 37.7 percent in 2014 to 36.6 percent in 2015.
In 2015, Kentucky experienced a 6.7 percent increase in Kentucky municipal solid waste (MSW)
disposed of in Kentucky landfills and an 11.3 percent decrease in the amount of out-of-state
MSW disposed of in Kentucky landfills. Kentucky disposed of 4,519,264 tons of MSW in 2015,
an increase of 204,452 tons from 2014.
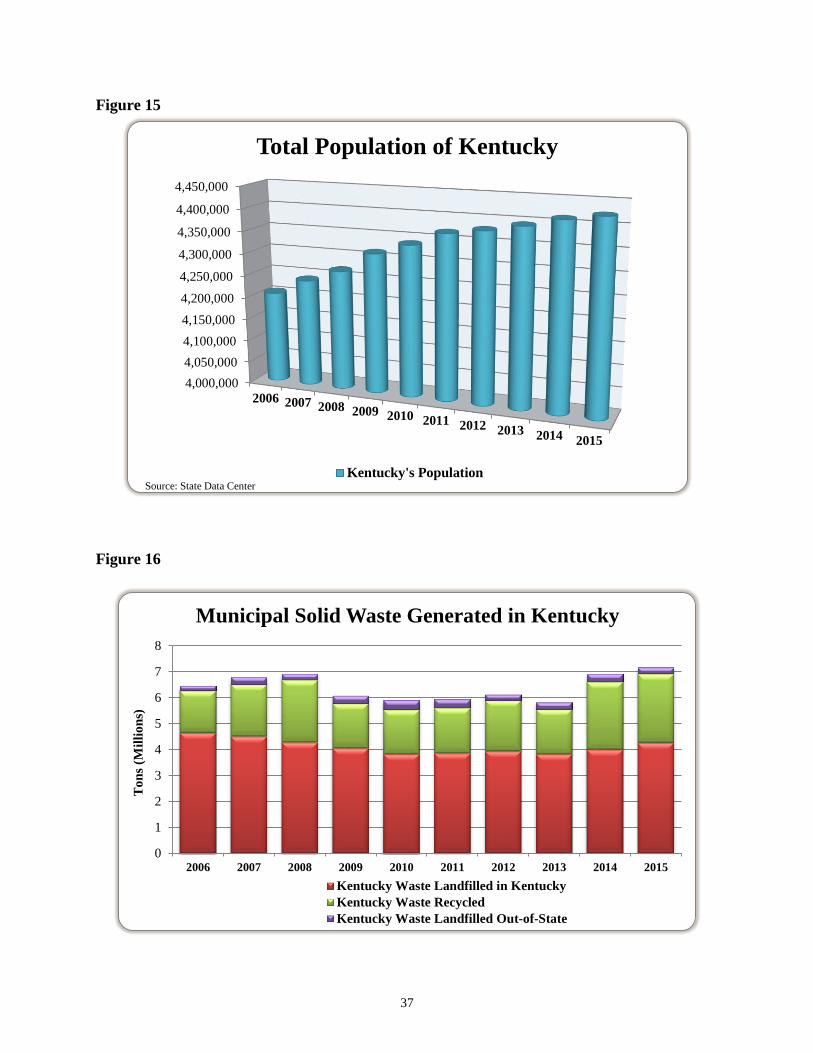
37
Figure 15
Figure 16
4,000,000
4,050,000
4,100,000
4,150,000
4,200,000
4,250,000
4,300,000
4,350,000
4,400,000
4,450,000
2006 2007 2008 2009 2010 2011 2012 2013 2014 2015
Total Population of Kentucky
Kentucky's PopulationSource: State Data Center
0
1
2
3
4
5
6
7
8
2006 2007 2008 2009 2010 2011 2012 2013 2014 2015
To
ns
(Mil
lio
ns)
Municipal Solid Waste Generated in Kentucky
Kentucky Waste Landfilled in Kentucky
Kentucky Waste Recycled
Kentucky Waste Landfilled Out-of-State

38
Figure 17
A small increase in the total tonnage of waste generated in Kentucky in 2015 is shown.
Figure 18
0
1,000,000
2,000,000
3,000,000
4,000,000
5,000,000
6,000,000
7,000,000
8,000,000
To
ns
Municipal Solid Waste Disposal and Recycling
Kentucky Waste
Landfilled in Kentucky
Out-of-State Waste
Landfilled in Kentucky
Total Waste Landfilled
in Kentucky
Kentucky Waste
Landfilled Out-of-State
Total Kentucky Waste
Landfilled
Recycled
Total Waste Generated
in Kentucky
0%
5%
10%
15%
20%
25%
30%
35%
40%
Per
cen
tage
of
Tota
l W
ast
e R
ecycl
ed
U.S. and Kentucky Recycling Rates
National
Recycling Rate
Kentucky
Recycling Rate
Linear (Kentucky
Recycling Rate)

39
All of the counties in Kentucky offer a system of universal waste collection through a
combination of curbside collection, drop-off collection centers and transfer stations.
“Universal collection” is defined by KRS 224.1-010(45) as:
“… a municipal solid waste collection system which is established by ordinance
and approved by the cabinet and requires access for each household or solid
waste generator in a county. A commercial or industrial entity which transports
or contracts for the transport of the municipal solid waste it generates or which
operates a solid waste management facility for its exclusive use may be excluded
from participation.”
In accordance with KRS 224.43-315, waste haulers are required to report annually the number of
households serviced and the monthly cost of service. The reported participation rate in approved
MSW collection systems has remained steady since 2006 with an average of 86 percent.
Figure 19
In 2015, Kentucky counties reported that 1,485,016 households were participating in approved
MSW collection services. The average reported household participation rate for MSW collection
systems in 2015 was 85.2 percent. Approximately 14.8 percent of households (251,561) were not
accounted for by current tracking methods. Self-haul to transfer stations and convenience centers
are often not tracked. Multi-unit apartments comprise of approximately 17.7 percent Kentucky
households. Most of these are serviced by dumpsters via commercial accounts and consequently
do not show up as individual house counts. As a result of these tracking limitations, actual
90%
87% 87% 87% 87% 87%86%
85% 85% 85%
0.0
0.2
0.4
0.6
0.8
1.0
1.2
1.4
1.6
1.8
2.0
2006 2007 2008 2009 2010 2011 2012 2013 2014 2015
Mil
lio
ns
Kentucky Households Participating in MSW Collection
Households Participating
Households not Participating
Percentage of Households Participating

40
participation rates could be five to ten percentage points higher than what was reflected by
county reporting. The average cost per month for household curbside MSW collection was
$15.99 in 2015, a dollar higher than 2014.
Solid Waste Permitting
The Solid Waste Branch continues to issue the majority of permits within regulatory timeframes.
This includes permits for new landfills, permit modifications for existing landfills, and permits
for various other facilities, including land application and composting facilities.
There were 57 solid waste permits pending at the end of FY16, with 48 within and nine
exceeding regulatory timeframes. In FY16 of the 140 solid waste permit reviews completed, 128
(91 percent) were within the regulatory timeframe. Additionally, branch personnel reviewed
documentation for and approved the closure of 26 solid waste facilities. For the past five years,
this branch has completed no less than 90% of permit application reviews within the time frame
designated by regulation (RTF).
Figure 20
This branch permits a variety of facilities that divert waste from disposal and reuse it in ways
that preserve natural resources and prevent pollution. The facilities include locations where solid
and special wastes are beneficially reused, landfarm facilities where solid and special wastes are
used to promote soil structure and fertility, and composting facilities where organic materials are
turned into compost and distributed for use.
0
20
40
60
80
100
120
140
160
180
20112012
20132014
2015
139 142132
116154
3 6
5
3
12
Permit Reviews Completed by Fiscal Year
Within RTF Past RTF

41
There are 41 active landfarm facilities, 33 active compost facilities, and 80 sites where special
wastes are being beneficially reused. Sites where solid waste are beneficially reused are
designated permit-by-rule, which means that the operator may begin beneficial reuse activities
without having obtained written authorization from the cabinet, as long as the operation meets
regulatory requirements. Some operators choose to get written authorization from the cabinet,
and in FY2015, five facilities for beneficial reuse of solid waste were approved.
Environmental Remediation Fee
The environmental remediation fee (ERF) was established by Kentucky Revised Statute 224.43-
500. This statute requires all generators of waste in Kentucky to pay $1.75 per ton of waste
disposed in a municipal solid waste disposal facility and this fee is collected by municipal solid
waste facilities or transfer stations. This fee is deposited into the Kentucky Pride Fund and used
to fund grants for the cleanup of illegal open dumps, recycling, and household hazardous waste
management. The ERF form which accompanies the fee compliance is shown in Figure 21.
Figure 21
Groundwater Monitoring
Groundwater assessment requires the owner or operator of a facility to determine the existence,
extent, and depth of groundwater degradation, and the rate and direction of migration of
contaminants in the groundwater. Groundwater assessment is triggered if the analysis of
0%
10%
20%
30%
40%
50%
60%
70%
80%
90%
100%
2nd Qtr 20153rd Qtr 2015
4th Qtr 20151st Qtr 2016
229228 231
96
62 63 6011
ERF Reporting Compliance
Did not Report
Sent in Form

42
groundwater at the facility shows one or more parameters exceeding the maximum contaminant
levels (MCL) specified by regulation, or an increase over the naturally occurring background
levels of parameters lacking promulgated MCLs. Of the 78 facilities currently required to
monitor groundwater, 15 are in groundwater assessment (19%).
Corrective action requires the owner or operator of a facility to abate groundwater contamination
and prevent further groundwater contamination from the facility, and restore or replace public or
private water supplies affected by contamination from the special waste facility. Groundwater
corrective action is currently being carried out by 13 facilities (17%).
Historical Landfills
A total of 90 historic landfills have been closed through construction and remediation projects or
by a no further action determination due to intensive site studies. Total costs associated with the
closure projects exceed $54 million, excluding branch personnel’s direct and indirect expenses.
Phase I of the Butler County landfill has completed construction and is within the warranty
period. Costs are estimated to be approximately $2.7 million.
Three historical landfill closure projects are in the design phase and will be scheduled for
construction once the design has been completed. Construction and engineering oversight costs
are estimated to be approximately $6 million.
Bullitt County Landfill
Johnson County Landfill
Trigg County Landfill
Four historic landfill projects are in the site characterization phase at an estimated cost of
$400,000.
Harlan Drum Site
Henderson Drum Site
McCracken County Landfill
Mercer County Landfill
Four historic landfill closure projects are in the process of being awarded through the Division of
Engineering and Contract Administration of the Finance and Administration Cabinet. These
projects consist of site characterizations and designs. The site characterization and design costs
are estimated to be approximately $1.1 million.
Butler County Landfill (Phase II)
City of Covington Landfill
Foothills Landfill
Goodridge Avenue Landfill

43
Initial characterization of 288 landfills has been completed. The landfills are being prioritized
based on the perceived threat to human health and the environment. The approximate cost for the
initial site characterization of these sites is $3.9 million. There are 531 historical landfills
remaining to be closed.
BRANCH HIGHLIGHT
Naturally Occurring Radioactive Materials By Robin Green
In January of 2016, the Energy
and Environment Cabinet (EEC)
became aware that shipments of
technologically enhanced
naturally occurring radioactive
materials (TENORM) were being
received by landfills in the state.
During the 2016 Regular Session,
the Kentucky House passed an act
related to naturally occurring
radioactive materials (NORM)
and their management. House Bill
563 created a new statute, KRS
211.893, which became effective
April 13, 2016. The statute
identifies the various state
agencies with regulatory authority
over the management of NORM
and their specific responsibilities.
The EEC and the Cabinet for
Health and Family Services are
specifically directed in the statute to review and revise their existing regulations to ensure the
proper management of oil and gas wastes containing NORM. They were additionally charged
with making recommendations for any other statutes that should be amended in order to
“facilitate management of oil and gas production wastes in a manner commensurate with the
risks that those wastes may pose to the public health and the environment”.
As encouraged by the statute, the cabinets have sought input from a variety of groups including
those that produce and transport oil and gas wastes, environmental groups, owners and operators
of waste disposal facilities, other state bodies, and the public at large. The EEC reconvened the
Oil and Gas Workgroup with these groups to facilitate the review process, draft
recommendations, and propose amendments to regulations and statutes.
Hydraulic Fracturing Operation in Lawrence County, KY
Photo courtesy of Marvin Combs
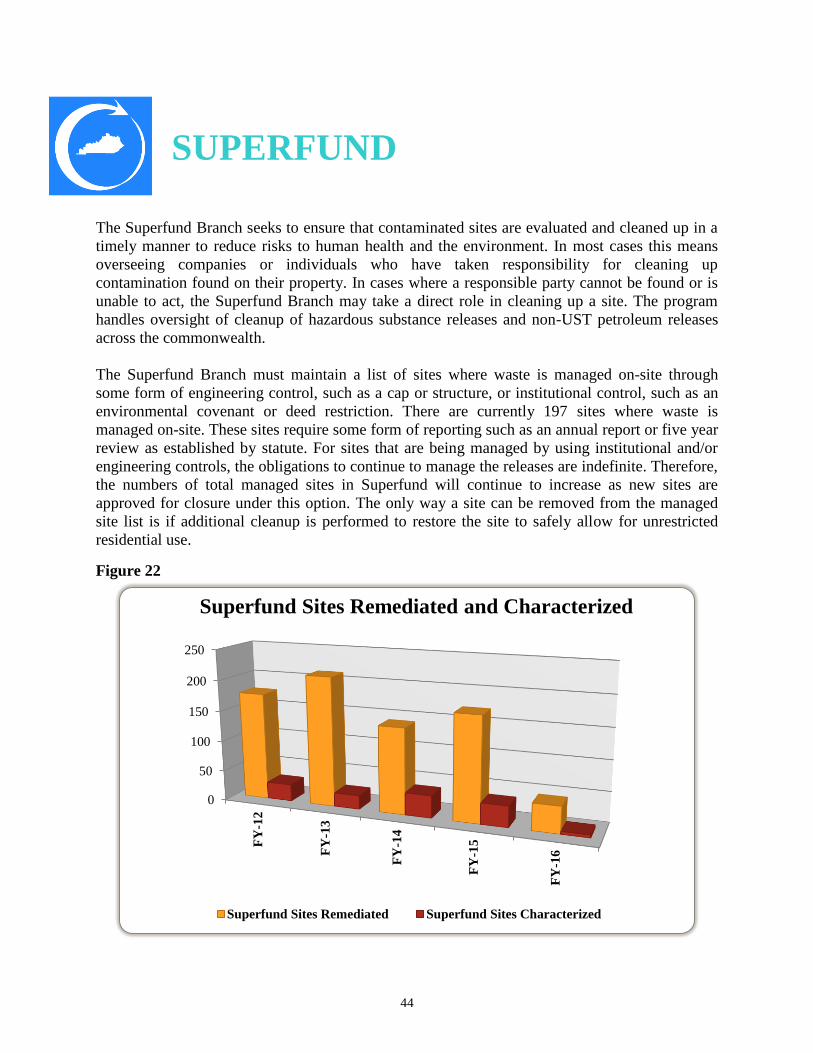
44
SUPERFUND
The Superfund Branch seeks to ensure that contaminated sites are evaluated and cleaned up in a
timely manner to reduce risks to human health and the environment. In most cases this means
overseeing companies or individuals who have taken responsibility for cleaning up
contamination found on their property. In cases where a responsible party cannot be found or is
unable to act, the Superfund Branch may take a direct role in cleaning up a site. The program
handles oversight of cleanup of hazardous substance releases and non-UST petroleum releases
across the commonwealth.
The Superfund Branch must maintain a list of sites where waste is managed on-site through
some form of engineering control, such as a cap or structure, or institutional control, such as an
environmental covenant or deed restriction. There are currently 197 sites where waste is
managed on-site. These sites require some form of reporting such as an annual report or five year
review as established by statute. For sites that are being managed by using institutional and/or
engineering controls, the obligations to continue to manage the releases are indefinite. Therefore,
the numbers of total managed sites in Superfund will continue to increase as new sites are
approved for closure under this option. The only way a site can be removed from the managed
site list is if additional cleanup is performed to restore the site to safely allow for unrestricted
residential use.
Figure 22
0
50
100
150
200
250
FY
-12
FY
-13
FY
-14
FY
-15
FY
-16
Superfund Sites Remediated and Characterized
Superfund Sites Remediated Superfund Sites Characterized

45
In FY16, the Superfund Branch remediated 44 sites and characterized five sites. There were 101
new sites registered. Three state-lead sites were remediated utilizing the Hazardous Waste
Management Fund and three sites are in the process. There were no cleanups conducted under
state oversight via the Voluntary Environmental Remediation Program.
There were also 31 sites with a release of petroleum or a petroleum product remediated from a
source other than a petroleum storage tank, with 114 pending review.
Brownfields
Brownfields are abandoned, idled, or underutilized industrial and commercial facilities/sites
where expansion or redevelopment is complicated by real or perceived environmental
contamination. They can be in urban, suburban, or rural areas. The Brownfield redevelopment is
a joint effort between the Division of Waste Management and the Division of Compliance
Assistance.
Five Targeted Brownfields Assessments were conducted, and four are awaiting review.
Multiple other sites have been reviewed and technical assistance was provided for
recipients of various USEPA 128(a) Brownfields Grants.
Forty brownfield sites were reviewed under KRS 224.1-415, 41 Notice of Eligibility
letters issued, 35 Notification of Concurrence letters issued and two sites are pending
review at the end of the fiscal year.
Methamphetamine Lab Cleanup
In cases where homes are contaminated with meth waste, the Kentucky Division of Waste
Management works in conjunction with law enforcement and health departments to remediate
structures through the division’s Methamphetamine Lab Cleanup Program. Because meth waste
is so toxic, especially to small children, and absorbs into home surfaces and structures, it must be
remediated by certified contractors. In FY16, 94 contaminated residences were reported and 49
residences were decontaminated through the Methamphetamine Lab Cleanup Program.
Future of the Hazardous Waste Management Fund
The Hazardous Waste Management Fund (HWMF) was created to provide the Energy and
Environment Cabinet with the funds necessary to protect the health of the citizens and natural
resources of the commonwealth from threats associated with releases of hazardous substances,
pollutants and contaminants. The cabinet uses this fund to provide technical reviews, oversight
of responsible party driven, and state-lead investigation and remediation projects. The HWMF is
the Commonwealth’s sole source financial support for contaminated sites where there is either
no known responsible or financially solvent party available to take action. The HWMF finances
regulatory oversight, emergency responses, state-lead and time-critical remediation projects at
sites across Kentucky. These projects range from large industrial sites and persistent dry
cleaner’s plumes to small projects such as roadside drums, orphan wastes and transformers.

46
Presently there are no other available funding sources to conduct emergency response, state-lead
cleanup actions, or regulatory oversight.
As a result of decreases to the HWMF through exemptions, decreases to general and federal
funds available to the cabinet since 2008, increased costs to cleanup, and increasing number of
non-viable and financially insolvent responsible parties from which to recover cost, this fund
cannot credibly address the existing and projected superfund backlog, let alone sustain sufficient
funding to mount large scale emergency remedial projects that arise unpredictably year to year.
The perceived “typical” and historical superfund sites are: large industrial complex sites, large
caches of illegally buried drums by large companies, or otherwise highly visible and news
making sites (e.g. “Love Canal”, “Maxey Flats” and “Valley of the Drums”). Such sites usually
either have potential responsible parties (PRPs) with large sustainable financial resources or
federal funding through the NPL program to address the problem. While these types of sites still
exist they no longer reflect the greater more ubiquitous threat to human health and the
environment in the commonwealth. The more common type of sites that are entering into
superfund are smaller sites that have geological, technical or chemical/contaminant
characteristics that are complex and financially difficult to address. There is general agreement
among practicing remediation professionals in government and private industry that this
substantial population of sites (which are being recognized across the U.S.) are unlikely to
achieve restoration within the next 50 to 100 years. By far, it is the smaller entity sites which
pose the greatest and increasing threat to human health and the environment, and mainly
comprise the growing number of sites to the state Superfund Program.
The concern over the impact of these sites is increased because smaller contaminated properties
are generally collocated where we live, eat and play; in commercial urban, suburban and rural
settings throughout our state. Such sites do not have the usual control or restricted access
common to larger industrial sites. Because of the small lot-size of these sites, many times
contamination extends off-site under neighboring properties, including residential homes,
schools, recreational areas and other locations that a person would generally not expect to be an
environmental problem. Furthermore, many of the small sites from which hazardous substances
have been released, such as dry cleaners, are small “mom and pop” businesses. Most dry
cleaning operators do not have adequate assets or insurance to pay for the cleanup costs, which
easily could exceed the equity in the entire retail center.
Most hazardous substances and contaminants released into the environment have scientifically-
proven persistence as a risk to human health and the environment for 50 to 100 plus years and in
many cases (such as metals) exist forever. Large multi-national S & P Fortune 500 companies
have upper life spans of 40 to 50 years1, while most U.S. S & P Fortune 500 companies have
upper life spans of only 15 years 2 . These represent the most financially solvent types of
companies and their lifespans, which greatly outlive most local or regionally owned companies,
1 Crainer, Stuart. “The Living Company by Arie de Geus”. Third Quarter 1998, Issue 12. Strategy+Business.
http://www.strategy-business.com/article/18728?gko=8c8f1 2 Gittleson, Kim. (2012). “Can a Company Live Forever”. BBC News, New York - Business.
http://www.bbc.com/news/business-16611040. (accessed May 2016)
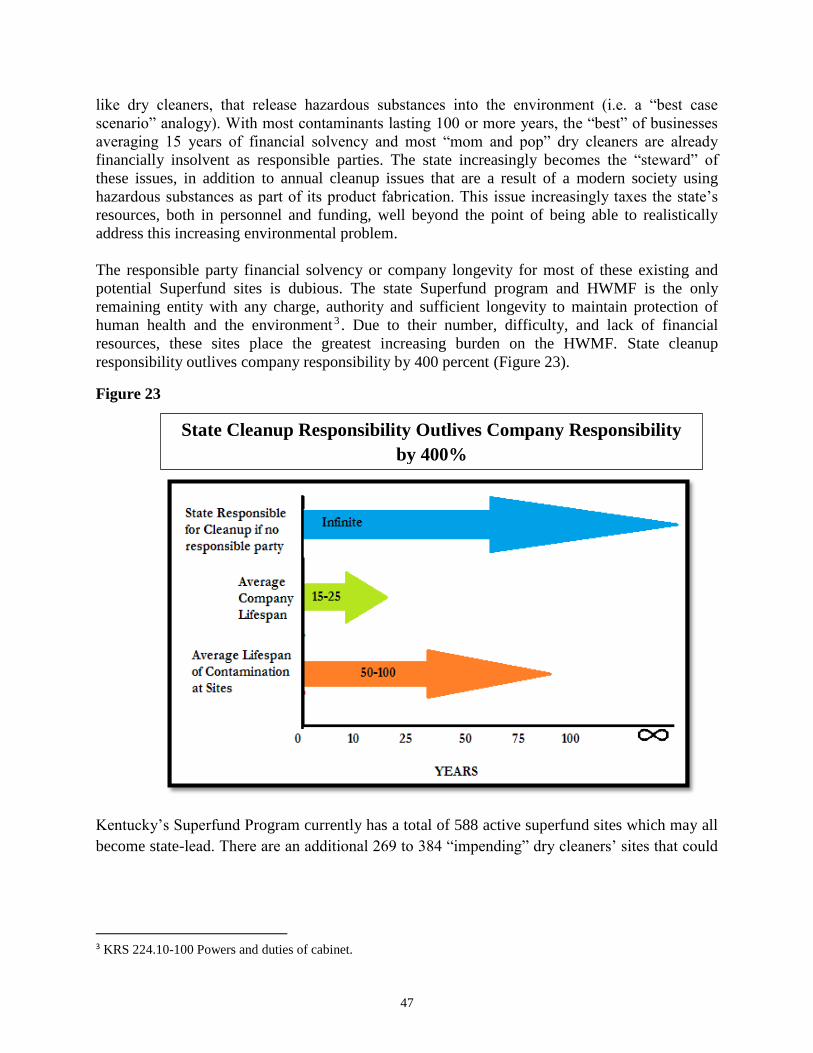
47
like dry cleaners, that release hazardous substances into the environment (i.e. a “best case
scenario” analogy). With most contaminants lasting 100 or more years, the “best” of businesses
averaging 15 years of financial solvency and most “mom and pop” dry cleaners are already
financially insolvent as responsible parties. The state increasingly becomes the “steward” of
these issues, in addition to annual cleanup issues that are a result of a modern society using
hazardous substances as part of its product fabrication. This issue increasingly taxes the state’s
resources, both in personnel and funding, well beyond the point of being able to realistically
address this increasing environmental problem.
The responsible party financial solvency or company longevity for most of these existing and
potential Superfund sites is dubious. The state Superfund program and HWMF is the only
remaining entity with any charge, authority and sufficient longevity to maintain protection of
human health and the environment3 . Due to their number, difficulty, and lack of financial
resources, these sites place the greatest increasing burden on the HWMF. State cleanup
responsibility outlives company responsibility by 400 percent (Figure 23).
Figure 23
Kentucky’s Superfund Program currently has a total of 588 active superfund sites which may all
become state-lead. There are an additional 269 to 384 “impending” dry cleaners’ sites that could
3 KRS 224.10-100 Powers and duties of cabinet.
State Cleanup Responsibility Outlives Company Responsibility
by 400%

48
also become state-lead4; totaling 680 to 972 potential state-lead sites which may not have a
viable or financially solvent responsible party.
Many variables affect cost to complete cleanups, which further depend on site-specific
characteristics such as amount and location of spill, geology and general location. Site cost
ranges from $10,000 to greater than several million dollars. Historic Kentucky superfund cost
demonstrates and supports this estimate as well. Studies including: Federal Department of
Defense, EPA, and national dry cleaner insurers’ estimates, and Kentucky’s historic database
from 1993 to 2013 indicate a trending range from $200,000 to over $700,000 per site. Using an
average from these studies, an estimated cost per site can be made for the total active superfund
sites and impending dry cleaner sites. An estimated average cost for the 680 to 972 active
superfund and impending dry cleaner sites ranges from $390,662,864 to $558,089,806.
Similar to cost, numerous variables control the time to complete a site’s cleanup. Programmatic
assessment of how long it would take to decrease the Superfund backlog and expected backlog
of sites can be made based on current funding levels, number of known sites and ranges of costs-
to-complete. After the annual fiscal year fixed costs are subtracted from the HWMF,
approximately $323,883 of funding per year is available to apply toward state-lead capital
projects. This does not include cost recovery which is unpredictable and generally decreasing
over time. Based on present funding levels, an estimate of time to complete the cleanup of the
known sites ranges from 1,206 to 1,723 years.
Another growing impact on the HWMF is the cost imposed on the agency for long-term
management sites. At many sites the responsible party has opted to not remediate the
contaminated site. This option is available under existing statues and regulations when full
restoration is technically impracticable. Under these conditions the responsible party may choose
to manage the site under “Managed Closure”. What this entails is that no further active remedial
efforts are necessary if the property remains under a certain land use controls and/or controlled
with engineered measures (e.g. a cap). Additionally, managed sites require an environmental
covenant to be placed on the property. This is necessary to avoid the same circumstances that
necessitated the Comprehensive Environmental Response, Compensation, and Liability Act
(CERCLA) enacted by Congress in 1980. These sites are required to be managed, monitored,
inspected and reviewed by the agency virtually in perpetuity. While the specific cost burden to
state regulatory agencies varies from state to state, an average of the imposed cost burden based
on several states’ input of $1,000 per site per year has been estimated (Association of State and
Territorial Solid Waste Management Officials, ASTSWMO, 2012)5. Presently the Superfund
branch manages a growing number of 220 sites under Option B “Management in Place”. Based
on the interstate cost per site per year estimate the imposed cost burden to the division to manage
these sites is currently $220,000 per year.
Additional cost burdens on the HWMF that are less predictable and intermittent in nature, but
due to their large capital costs have extended fiscal repercussions on the fund, are larger
4 Gary Keyes, “Cleaning Up After Dry Cleaners,” CIRE Magazine, CCIM Institute, http://www.ccim.com/cire-
magazine/articles/cleaning-after-dry-cleaners (accessed 23 Jun. 2014). 5 Interstate Technology Regulatory Council, “Long-Term Contaminant Management Using Institutional Controls”,
Draft Guidance Document, June 2016.

49
emergency and time-critical contamination removals. At most of these sites a responsible party
does not exist or they cease to be financially solvent through bankruptcy proceedings. In the past
three-year period, three projects alone have cost and are costing the agency approximately $1.6
million, $800 thousand and $172 thousand dollars, respectively. Presently, there are other known
similar large standing projects, in which there is no viable or financially solvent responsible
party. These sites will require state-lead action that will cost the agency a preliminary estimate of
$3.9 to $7.7 million dollars. The cost of these projects alone would burden the present HWMF
annual fiscal projected project funding for the next 10 to 20 years without any other projects.
The state of the HWMF in light of the reality of the volume, number, type and cost of sites
contaminated by hazardous substances, pollutants and contaminants has a direct negative impact
burden on the cabinet’s mandated omnibus to protect human health and the environment. The
cabinet is continually formulating very limited options to best address the situation under the
circumstances. However, increasing greater efficiency and resourcefulness can only offer so
much before the continued decrease in available funding combined with the continued influx of
contaminated properties and hazardous substance releases reach diminishing returns and make
acquiring more funding and financial resources currently, if not immediately, crucial.
Maxey Flats Project
The Maxey Flats Project (MFP), formerly known as the Maxey Flats Nuclear Disposal Site, is a
55-acre commercial disposal facility for radioactive waste that operated from 1962-1977. During
its operations, solid and liquid nuclear waste was buried in unlined earthen trenches. Upon the
discovery of nuclear materials in off-site groundwater, the facility was closed to alleviate the
environmental threat and protect human health. In 1978, the Commonwealth of Kentucky
purchased the facility to ensure immediate closure and proper remediation. The MFP was placed
on the National Priorities List (NPL) by USEPA in 1986.
After many years of monitoring and maintenance activities by DWM Maxey Flats employees,
and several phases of remedial work conducted under the oversight of USEPA, the Maxey Flats
Project, located in Fleming County, was placed into the Final Closure Period in November, 2012.
The final closure plan includes installation of a permanent vegetative cap over the disposal area,
installation of permanent surface water control features and installation of surface monuments to
identify concerns and location of buried waste.
Following an extensive planning, remedial design and contractor selection process, construction
of the permanent vegetative cap began in mid-January of 2015. Workers began by clearing a
portion of the southern hillside and built a haul road to enable soils to be transported from state-
owned borrow areas in the southern valleys to the landfill cap. Surface water management
features were also constructed from January through May 2015.
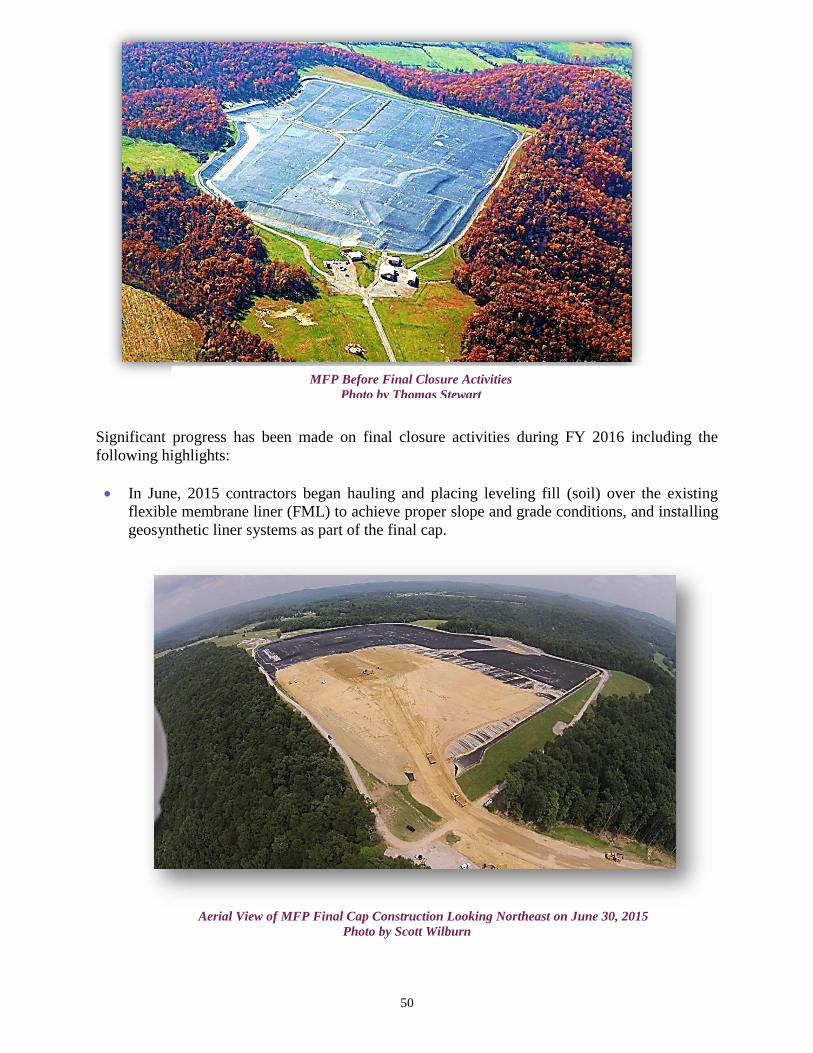
50
Significant progress has been made on final closure activities during FY 2016 including the
following highlights:
In June, 2015 contractors began hauling and placing leveling fill (soil) over the existing
flexible membrane liner (FML) to achieve proper slope and grade conditions, and installing
geosynthetic liner systems as part of the final cap.
Aerial View of MFP Final Cap Construction Looking Northeast on June 30, 2015
Photo by Scott Wilburn
MFP Before Final Closure Activities
Photo by Thomas Stewart

51
Aerial View of MFP Cap Construction Looking South on September 9, 2015
Photo by Scott Wilburn
Aerial View of MFP Cap Construction Looking Northeast on October 22, 2015
Photo by Scott Wilburn

52
Contractors continued making steady progress on the cap construction through December
18, 2015 when work was shut down for the winter. In December, the progress of
remediation was estimated at 54% complete. Nearly 400,000 cubic yards of leveling fill
was hauled and placed as part of the cap at this point. Approximately 20 acres of
Geosynthetic Clay Liner (GCL) and High Density Polyethylene (HDPE) geomembrane
liner had been deployed. Storm water and perimeter drainage work and inspections of Best
Management Practices (BMP) storm water control measures continued through the winter.
Some slumping of soils in the southern soil borrow areas was observed over the winter and
spring months. These areas were evaluated and repairs were made. These areas are
continuing to be monitored and actions will be taken to mitigate any effects as necessary.
Contractors resumed construction activities in March, 2016. A wet spring and summer
caused some delays in being able to complete work on the cap.
As of the end of June, 2016, a total of 421,255 cubic yards of leveling fill had been hauled
and placed for the cap and an estimated 75,500 cubic yards of protective cover soil had been
placed. Approximately 42 acres of the 55 total acres of landfill area have been covered with
GCL and HDPE.
Final completion of the construction of the final cap is projected for December 20, 2016.
After the work is certified to be complete, the MFP will enter into an Institutional Control
Period of 100 years which will include continued monitoring, maintenance and facility
control.
Plans are also being developed by the division to look at the most effective use and long-
term stewardship of the property at Maxey Flats, which includes over 1,000 acres of
woodlands, valleys and streams. The focus will be on uses which maintain the site but also
encourage sustainability and provide environmental educational opportunities for the
surrounding community and Commonwealth.
Aerial View of MFP Cap
Construction Looking South in
June 2016
Photo by Scott Wilburn
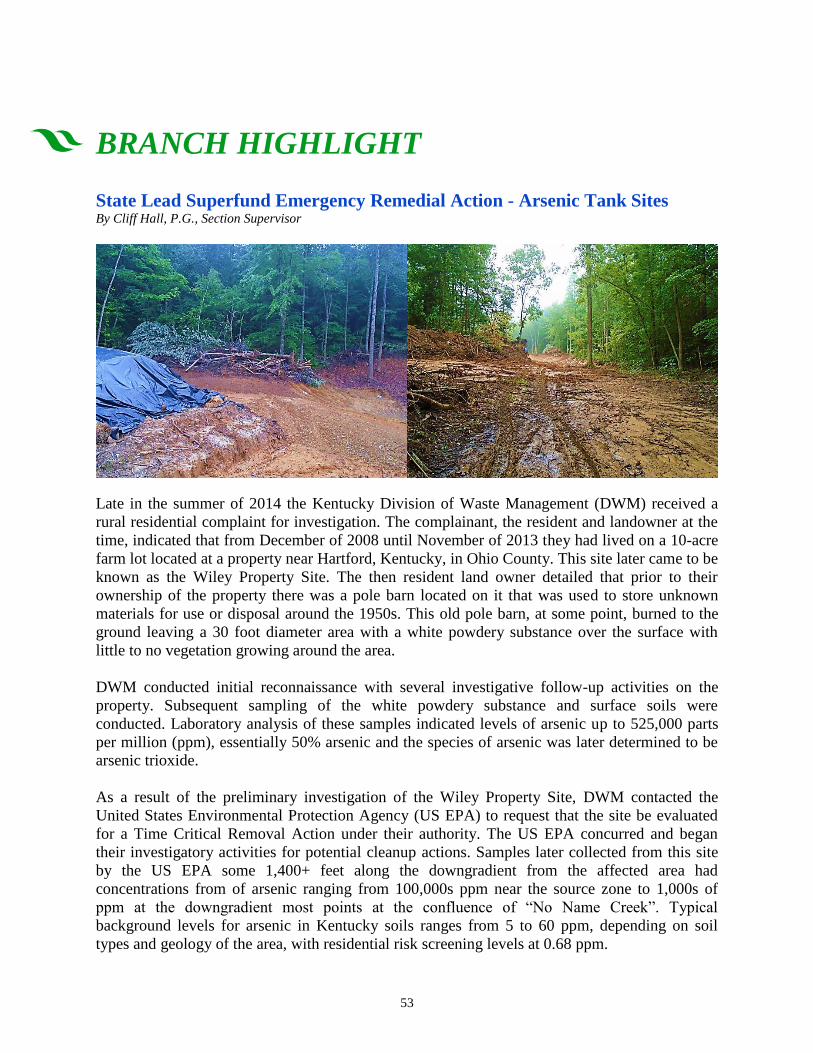
53
BRANCH HIGHLIGHT
State Lead Superfund Emergency Remedial Action - Arsenic Tank Sites By Cliff Hall, P.G., Section Supervisor
Late in the summer of 2014 the Kentucky Division of Waste Management (DWM) received a
rural residential complaint for investigation. The complainant, the resident and landowner at the
time, indicated that from December of 2008 until November of 2013 they had lived on a 10-acre
farm lot located at a property near Hartford, Kentucky, in Ohio County. This site later came to be
known as the Wiley Property Site. The then resident land owner detailed that prior to their
ownership of the property there was a pole barn located on it that was used to store unknown
materials for use or disposal around the 1950s. This old pole barn, at some point, burned to the
ground leaving a 30 foot diameter area with a white powdery substance over the surface with
little to no vegetation growing around the area.
DWM conducted initial reconnaissance with several investigative follow-up activities on the
property. Subsequent sampling of the white powdery substance and surface soils were
conducted. Laboratory analysis of these samples indicated levels of arsenic up to 525,000 parts
per million (ppm), essentially 50% arsenic and the species of arsenic was later determined to be
arsenic trioxide.
As a result of the preliminary investigation of the Wiley Property Site, DWM contacted the
United States Environmental Protection Agency (US EPA) to request that the site be evaluated
for a Time Critical Removal Action under their authority. The US EPA concurred and began
their investigatory activities for potential cleanup actions. Samples later collected from this site
by the US EPA some 1,400+ feet along the downgradient from the affected area had
concentrations from of arsenic ranging from 100,000s ppm near the source zone to 1,000s of
ppm at the downgradient most points at the confluence of “No Name Creek”. Typical
background levels for arsenic in Kentucky soils ranges from 5 to 60 ppm, depending on soil
types and geology of the area, with residential risk screening levels at 0.68 ppm.

54
After the initial field reconnaissance and investigations at the Wiley Property Site the same
property owner revealed they also were aware of two large tanks along Shinkle Chapel Road at
an adjacent property, the Polluck Property, with similar looking material found on the Wiley
Property. DWM followed up with further field reconnaissance. Seasonal thinning of vegetation
allowed DWM to find two illegally disposed of historic tanks of unknown age (estimated around
the 1950s to 1960s). These tanks were initially inspected and contained what was suspected at
the time as the same arsenic material found on the Wiley property. The tank material was
subsequently analyzed for constituents and characterized for disposal.
Analytical results indeed revealed that it was the same arsenic material and waste
characterization results for the arsenic exceeded the hazardous waste threshold by approximately
40 times the regulatory limit. No actual quantification of the percent arsenic was determined, but
it was assumed to contain roughly 50 percent arsenic similar to the Wiley property source area.
The two identified abandoned tanks were visually inspected and were identified to be of similar
design as tanks typically used for pressure treating lumber with chromated copper arsenate
(CCA). However, laboratory analysis did not indicate the presence of chromium or copper at
either site. This became the second arsenic property site known as the Polluck Property Site
adjacent to the Wiley Property Site.
Forensic evidence, corroborating information, and timelines reasonably draw the inference that
the arsenic-containing wastes found on both properties are from the same source material and
unknown responsible party(s), and this material and the tanks were emplaced sometime in the
1950s to 1960s.
Two exhaustive searches for potential responsible party(s) (PRP) were conducted both by the US
EPA and DWM to no avail. No visible, viable or reliable evidence was able to link the source of
the material or tanks to any existing or historic PRP.
Upon receiving the TCLP results from the tanks, DWM procured an environmental contractor
under its small purchase authority to remove and dispose of the two tanks, their contents and
immediate surface soils in contact with the tanks in early spring 2015. The two tanks were
emptied and cleaned of visible scale before being scrapped, and loaded on a transport vehicle for
recycling at Edwards Recycling in Caneyville, KY.
In late spring 2015, Superfund employees conducted additional reconnaissance and
characterization work extending from the area of the tanks draining into an ephemeral drainage
ditch some 1,300+ feet downgradient at the confluence of the No Name Creek. This location is
upgradient of the Wiley property confluence of the same. Field and analytical results indicated
runoff of arsenic had migrated over the decade’s downgradient from the former tank location at
very high levels.
Based on the field reconnaissance and the analytical data gathered, DWM procured an
environmental contractor to perform a full scope investigation and characterization of the
Polluck Property Site including the former tank area, the 1,300+ foot ephemeral drainage feature,
and the lower confluence of the drainage feature with Little No Creek, as well as, two adjacent
residential properties located along this lower confluence. This work was necessary to assess the

55
potential full scope of remedial and removal activities necessary to protect human health and the
environment. Analytical data collected from this effort indicated that surface soil arsenic levels
above Kentucky background and residential risk screening levels existed over the full length of
the ephemeral drainage feature, and decreased, as expected, in the downgradient direction from
the tank source area ranging from tens of thousands parts per million to few hundred parts per
million at the lower reach.
During the characterization phase of work a total of four downgradient private properties
impacted by the Polluck Property Site tanks were identified. The properties identified are the:
(1) Downgradient Polluck Property wooded/farmland ephemeral drainage;
(2) Felty Property wooded/farmland ephemeral drainage;
(3) Jones Residential ephemeral drainage and immediate adjacent property; and
(4) Kibbons Residential Property ephemeral drainage.
Based on the information gathered during the field reconnaissance, investigation and
characterization of the full reach of the arsenic impacts in surface soils located at two residential
areas; the presence of higher risk groups such as children, arsenic as a continual source from the
upgradient properties, risk levels above the residential land use, the species of arsenic being the
more toxic species of arsenic trioxide (AsO3), and the lack of a viable responsible party; DWM
deemed it necessary and essential to protect human health and the environment by conducting
cleanup and remedial measures at all four locations, including further work at the original source
zone of the tanks, as timely as possible.
Therefore, in accordance with its statutory authority stipulated in KRS 224.46 580(3), DWM
requested that the cabinet secretary approve the declaration of an environmental emergency so
the Superfund Branch could immediately retain an environmental contractor to plan and
implement immediate cleanup actions and to expedite the efforts to further limit existing or
potential human health or environmental impacts. Based on the need to protect human health and
the environment and information and data gathered to date, the request was deemed necessary
and approved by EEC Cabinet Secretary, Charles G. Snavely, on March 24, 2016.
The emergency declaration was implemented with the subsequent procurement of environmental
contractors. Due to rain events, initial excavation ground work began in the early summer of
2016, and is on-going. More than 4,102 tons of non-hazardous arsenic impacted soil material has
been excavated and disposed, approximately 90 tons hazardous waste as arsenic has been
excavated and staged in roll-offs for transport and treatment options at the hazardous waste
landfill in Emelle, Alabama. The initial excavation of the source area generated significantly
more non-hazardous waste than anticipated; however, generation amounts have been more in
line with estimations along the ditch. Non-hazardous waste arsenic impacted soils are being
transported to Republic’s Ohio County Landfill. This is approximately 80% of the entire
estimated remedial project. The project is within the anticipated design scope of work and budget
and expected to finish in August 2016.

56
UNDERGROUND STORAGE
TANKS
The mission of the Underground Storage Tank Branch is to provide for the prevention,
abatement and control of contaminants in regulated underground storage tanks (UST),
contaminants that may threaten human health, safety and the environment. This branch regulates
the registration, compliance, closure,
inspections and corrective actions of
UST systems. Through cleanup,
former UST sites become assets to
their communities. Vacant UST
properties in cities and towns are
often on busy street corners and main
roadways, making them potential
opportunities for economic and
community development, and
neighborhood revitalization.
Dental Office, Dr. Scott Bridges in Reidland, KY, 2016
Former Texaco Station, Photo by UST Branch
Two sections in the UST Branch are responsible for cleaning up UST sites: the Additional
Evaluation and Corrective Action. There is no functional difference between these two sections.
The name, Additional Evaluation, is a relic. This section will be renamed the Corrective Action
II section when a formal reorganization occurs. Both sections review and process closure
assessment reports, site characterizations and site remedies; also, phase II reports upon request.
In FY16, these sections reviewed 174 closure applications; 26 site checks and phase II reports;
issued 993 directives for site investigation/corrective action activities, and issued 303 No Further
Actions (NFA) letters. This work was performed by this section’s 14 geologists and scientists.
While the number of NFAs (303 this fiscal year) has been decreasing in the past few years, these
totals are drawn from a smaller total number of ongoing cleanups. Forty-five percent of the
cleanup workload received NFAs in FY16. Only the sites that received a NFA in a given year are
included. The spike of NFA letters issued in FY08 was due, in part, to regulatory changes in the
FY07 account (Figure 24).
As a direct result of changes in the regulatory process in 2006 and 2011, the total number of UST
cleanups remaining has decreased substantially. At the end of FY16, there were 675 UST
cleanups requiring further work before they receive NFA letters (Figure 25).

57
Figure 24
Figure 25
0
100
200
300
400
500
600
700
FY07 FY08 FY09 FY10 FY11 FY12 FY13 FY14 FY15 FY16
Nu
mb
er o
f S
ites
No Further Actions Letters Issued per Year
NFAs Issued
0
500
1,000
1,500
2,000
2,500
FY07 FY08 FY09 FY10 FY11 FY12 FY13 FY14 FY15 FY16
Nu
mb
er o
f S
ites
UST Cleanups Remaining
UST Cleanups Remaining

58
Kentucky is fortunate to have a funding mechanism that provides recurring financial assistance
to eligible UST owners and operators for cleanup costs and, in certain cases, the removal of old
UST systems. This facilitates removal and cleanups that may not otherwise take place as it helps,
in many cases, UST owners who are not able to self-fund the cost. This is provided from the
PSTEAF that is funded by the petroleum environmental assurance fee, $0.014 assessed on each
gallon of gasoline and special fuels received in Kentucky.
While these charts reveal the clear success of the changes in the UST cleanup program and
regulatory process, USTs and piping will continue to leak. Kentucky has over 800 facilities with
UST systems that are in excess of 25 years old, while the expected lifespan of a system is 30
years. New UST releases will occur and the need for a cleanup program will continue. The
number of new cases added to the cleanup list the past ten years averaged 245 UST sites per
year, although there were only 200 sites in FY16.
The Underground Storage Tank Branch publishes and maintains the UST Quarterly and the UST
Branch website. These are focused on aiding UST owners, operators, contractors and companies
with timely information regarding the regulatory aspects of owning and managing USTs and the
cleanup of UST-related contamination. http://waste.ky.gov/ust/USTQuarterly/Pages/default.aspx
Kentucky Underground Storage Tank Operator Online Learning System (KY TOOLS) has been
operational since it began May of 2013. Since that time, approximately 2,849 of Kentucky’s
3,311 active facilities have successfully designated a compliance manager and completed online
training in order to satisfy state and federally mandated training requirements for UST personnel.
Successful completion of the training is required annually. Per federal law, states are to ensure
that UST operators are trained according to state-specific requirements.

59
BRANCH HIGHLIGHT
Optimizing Approaches and Moving Forward By Edward J. Winner, Ph.D.
Over the past year, the Underground Storage Tank (UST) Branch has continued to improve and
refine its approach to (UST) site restoration, processing and controlling Petroleum Storage Tank
Environmental Assurance Fund (PSTEAF) expenditures. The PSTEAF expenditures are stable,
and compliance rates are improving. This branch also provides assistance to Kentucky’s UST
owners and operators. Maintaining an emphasis upon these core duties of the program has
continued to pay dividends. The number of UST sites being actively managed is around 700.
Environmental restoration of UST sites continues to progress. Both the state’s project managers
and the UST contractors continue to develop their skills and add to their experience in the use of
new tools and technologies. UST contractors, primarily Kentucky companies, who thoroughly
participate in use of new technologies, will gain skills and experience that will keep them
competitive nationwide. While this is not the intent of the UST program, it is an added bonus.
Multiple remedial strategies are used to address contaminated UST sites located throughout
Kentucky. For sites unencumbered by shallow utilities, where soil contamination is relatively
shallow, a typical remedial approach might involve digging out the contaminated soil. In deeper
or generally more challenging environments substances meant to trap, degrade or destroy
contamination may be injected into the soil. Depending upon the unique characteristics of the
site, this approach may include injection of oxidants, biological amendments or adsorptive media
(i.e., activated carbon) into the subsurface. In cases where petroleum is present in an undissolved
form, pumping the petroleum from the ground may be attempted. Some sites may require a
combination of these methods to successfully remove or treat the contamination.
Even with the numerous tools currently available to characterize and remediate contaminated
UST sites the work ahead will be challenging. Many of the more easily remediated sites have
been cleaned-up. The remaining sites may progress somewhat slower than desired for a few
possible reasons. These include sites being located in more geologically complex areas, having
larger releases, or having uncooperative owners. Nevertheless, it is believed that continued
reliance on a strategy of aggressive source characterization, early remedy implementation, and
employing a combination of treatment approaches will help to expedite UST cleanups statewide.
The administrative section invoices for tank fees, collects tank fees, and registers tanks. In 2016,
there were 1,867 invoices for tank fees, totaling $297,270.00, were mailed. Ninety-one percent
(91%) of the total invoiced was collected. A total of 754 new and amended registrations were
processed.
PSTEAF is meeting current needs of the cleanup program. Over obligations are being held to a
manageable level, claims are paid in a timely manner, and applications are processed without

60
delay. DWM is fully committed to moving work forward and properly accounting for the dollars
spent.
The Claims and Payments section, which manages the PSTEAF, obligated $15,926,841.37 for
small owner tank removal account (SOTRA) and Financial Responsibility Account (FRA) and
the Petroleum Storage Tank Account (PSTA) corrective actions. Claims are reviewed and
approved within an average of 10 days upon report approval. Reimbursements totaled
$15,553,420.64 from all PSTEAF accounts.
The efforts of the Claims and Payments Section personnel helped design and test a new database
that was successfully launched in June 2016. Three databases were consolidated into one system
which will increase overall efficiency. This system tracks dollars obligated to UST work and
claims for payment as a result of work completed.
Compliance personnel have been focused on building relations with the regulated community
while continuing to support the field inspectors with data input into TEMPO enterprise system.
They continue to assist Designated Compliance Managers with Kentucky Underground Storage
Tank Operator Online Learning System (KY TOOLS), the online compliance training program.
Presently, 88% of Kentucky’s UST facilities have a single individual responsible for compliance
that has taken the KY TOOLS online training. The Compliance Section is continuing to seek
additional ways to be of greater service to the regulated community by coordinating compliance
awards, the TEC Award, with the Kentucky Petroleum Marketers Association and participating
in Fuel Schools to educate the UST community on UST regulations. This branch is looking
forward to participating in compliance inspections with the field inspectors and gaining
additional hands-on training with UST equipment.

61
ACKNOWLEDGMENTS
Commonwealth of Kentucky
Governor Matthew G. Bevin
Energy and Environment Cabinet
Secretary Charles G. Snavely
Deputy Secretary R. Bruce Scott, P.E.
Kentucky Department for Environmental Protection
Commissioner Aaron Keatley
Kentucky Division of Waste Management
Director Anthony R. Hatton, P.G.
Assistant Director Jon Maybriar
This annual report is intended to provide a concise set of facts and measurements to support
environmental decision-making. We welcome your questions and comments to the contacts below.
Kentucky Division of Waste Management
300 Sower Blvd., 2nd Floor, Frankfort, KY 40601
Phone: 502-564-6716 Fax: 502-564-4245
waste.ky.gov
We acknowledge the contributions of management and personnel of the Division of Waste Management:
Sherri Adkins, P.G.
Heather Alexander
Danny Anderson, P.G
John Arnett
Brian Bentley
Lori Berry
Dale Burton, P.G.
Donna Conway
Kris Fink
Robbie Francis
Robin Green
Kim Greenidge
Cliff Hall, P.G.
Karen Hall
Nate Hancock, P.G.
Todd Hendricks, P.G.
Billy Hill
J. R. Holt
Tim Hubbard, P.G.
Larry Hughes, P.G.
John Jump, P.E.
Jim Kirby
Gary Logsdon
Lola Lyle
John Maddy
Rob Mauer
Ken Melton, P.E.
Jason Monarch
Todd Mullins, P.G.
Brian Osterman
Bill Schneider
Jill Stoltz
Christopher “Kitt” Tuttle
April Webb, P.E.
Edward J. Winner PhD.
Compiled by: Michelle Mitchell
Edited by: Louanna Aldridge
The Kentucky Division of Waste Management does not discriminate on the basis of race, color, religion, sex, national origin,
sexual orientation or gender identity, ancestry, age, disability or veteran status. The division provides, on request, reasonable
accommodations necessary to afford an individual with a disability an equal opportunity to participate in all services, programs,
and activities. Contact the division to request materials in an alternate format.
Printed with state funds on recycled paper, September 2016
Kentucky Division of Waste Management
300 Sower Blvd., 2nd Floor
Frankfort, KY 40601
Report an Environmental Emergency, 24-hours, to Environmental Response Team
502-564-2380 or 800-928-2380