division and subtraction by distinct cortical inhibitory...
TRANSCRIPT

ARTICLEdoi:10.1038/nature11347
Division and subtraction by distinctcortical inhibitory networks in vivoNathan R. Wilson1*, Caroline A. Runyan1*, Forea L. Wang1 & Mriganka Sur1
Brain circuits process information through specialized neuronal subclasses interacting within a network. Revealing theirinterplay requires activating specific cells while monitoring others in a functioning circuit. Here we use a new platformfor two-way light-based circuit interrogation in visual cortex in vivo to show the computational implications ofmodulating different subclasses of inhibitory neurons during sensory processing. We find that soma-targeting,parvalbumin-expressing (PV) neurons principally divide responses but preserve stimulus selectivity, whereasdendrite-targeting, somatostatin-expressing (SOM) neurons principally subtract from excitatory responses andsharpen selectivity. Visualized in vivo cell-attached recordings show that division by PV neurons alters response gain,whereas subtraction by SOM neurons shifts response levels. Finally, stimulating identified neurons while scanning manytarget cells reveals that single PV and SOM neurons functionally impact only specific subsets of neurons in theirprojection fields. These findings provide direct evidence that inhibitory neuronal subclasses have distinct andcomplementary roles in cortical computations.
Inhibition has fundamental and diverse roles in brain function, and isdelivered by specialized cell types with distinct intrinsic properties andconnectivity patterns1–3. This heterogeneity in cellular form and func-tion suggests that different inhibitory subtypes may actually underpindistinct computational functions and even hold specific relevance toneurological disorders4 based on their unique morphologies and func-tional positions within the network. Previous pharmacological orintracellular studies in primary visual cortex (V1), which necessarilyconsidered inhibition as a single entity, have produced diverse findingson the role of inhibition. On the one hand, inhibition has been pro-posed to sharpen neuronal responses by removing weak inputs5–7,though there have been conflicting reports on whether inhibition pre-dominantly targets non-preferred responses or preferred ones8–10. Onthe other hand, inhibition has been posited to control response gain, anetwork mechanism by which cortical networks rapidly ‘divide’ orscale their dynamic range of responses11. This mechanism has beenproposed as fundamental to processing across many brain systems,from primary sensory computations12 to attention13, multisensoryintegration14, and value estimation15.
Here we show that inhibition in the cerebral cortex can have either ofthese functions, depending on its cellular source. We propose that twokey inhibitory neuron subclasses, soma-targeting PV neurons anddendrite-targeting SOM neurons, which together comprise a substan-tial proportion of cortical inhibitory neurons in mice16,17, drive differ-ent kinds of inhibition. We combined optogenetic activation ofindividual or populations of PV or SOM neurons with monitoringthe effects in target cells using high-speed imaging of functional res-ponses18 as well as cell-attached electrophysiological recordings19.These methods complement both static wiring diagrams20 and wiringpatterns examined in tissue slices21–24 by revealing targeting specificityand functional consequences of inhibitory neuron activation in intactcircuits processing visual information.
Optical dissection of network interactionsTo measure the effects of distinct cell classes within a functioningnetwork, we built a custom system combining optogenetic stimulation
with in vivo two-photon imaging in the mammalian brain (Fig. 1a andSupplementary Fig. 1). Our imaging system (Supplementary Movie 1)sampled calcium responses from neurons loaded with a fluorescentreporter using a scan path customized for each image25, at high speedbut also high dwell times within neurons, yielding highly repeatablemeasurements of orientation-selective responses and clear tuningcurves (Fig. 1a–f, Supplementary Figs 2 and 3, and SupplementaryMovie 2).
To optically activate PV or SOM neurons, in parallel experiments,we used Cre/loxP recombination to express channelrhodopsin-2(ChR2) in PV or SOM neurons in the mouse visual cortex (Sup-plementary Fig. 4). This led to highly specific and reliable on-demandactivation of infected neurons in visual cortex that was verified bothin slices and during visual stimulation in vivo (Fig. 1g andSupplementary Fig. 4). PV or SOM neurons were photo-activatedfor a 1-s interval at the onset of visual stimulation (Fig. 1h), enablingus to compare the control visual responses of neighbouring, non-infected neurons during episodically presented drifting orientedgratings (Fig. 1i) to responses in interleaved trials in which thecells were inhibited through PV or SOM activation (Fig. 1j andSupplementary Fig. 5). Concurrent calcium imaging and optogeneticstimulation enabled us to quantify interneuron suppression ofneighbouring cells across the network (Fig. 1k).
Distinct functions of inhibitory cell classesUsing this system, we activated PV or SOM cells while recording thevisual responses of non-infected cells to oriented drifting gratings(Supplementary Movie 3, Fig. 2a–d and Supplementary Fig. 5).Control responses of target cells were similar in PV and SOM experi-ments (Supplementary Fig. 6), and suppression by ChR2 wascalibrated to a similar moderate range for all experiments (Supplemen-tary Fig. 6i). Interestingly, PV activation caused a larger suppressionwhen control responses were higher (Fig. 2e), whereas SOM activationcaused a relatively uniform suppression of the full response profile(Fig. 2f), particularly when the control responses or baseline levels werehigh relative to the suppression thereby avoiding a ‘floor effect’. Indeed,
*These authors contributed equally to this work.
1Department of Brain and Cognitive Sciences, Picower Institute for Learning and Memory, Massachusetts Institute of Technology, 77 Massachusetts Avenue, Cambridge, Massachusetts, 02139 USA.
1 6 A U G U S T 2 0 1 2 | V O L 4 8 8 | N A T U R E | 3 4 3
Macmillan Publishers Limited. All rights reserved©2012

the slope of the relationship between relative suppression and controlresponse was significantly greater when PV cells were activated(Fig. 2g, i) than when SOM cells were activated (Fig. 2h, i; PV,n 5 150 cells; SOM, n 5 77 cells; P , 0.001, Kolmogorov–Smirnovtest). Comparing the suppression at different response strengths forpooled cells further showed the asymmetric relationship between res-ponse and suppression when PV cells were activated (Fig. 2j; responsesat 40, 60 and 80% of the maximum were less suppressed than those atmaximum response strength; P , 0.05–0.001 for all pair-wise compar-isons with 100%). In contrast, SOM suppression affected weak andstrong responses similarly (Fig. 2k; responses at 40, 60 and 80% com-pared to responses at 100%; P . 0.2). Thus, suppression by SOM cells isrelatively uniform across responses of different strengths, whereassuppression by PV cells is non-uniform and proportional to the res-ponse level of the target neuron.
Proportionate suppression would ‘scale’ responses, reducing thetuning curve’s peak more strongly than its spontaneous response levelor baseline, whereas uniform suppression would ‘shift’ the entire
tuning curve downwards, including the baseline (SupplementaryFig. 7). Indeed, averaging the tuning curves of cells recorded duringPV-cell ChR2 activation revealed a scaled down version of the controltuning curve (Fig. 2l), whereas activating SOM-cell ChR2 yielded amore uniform downwards shift of the control curve (Fig. 2m).
The presence of a response ‘floor’ or threshold influences howdifferent forms of suppression impact the orientation tuning curve(Supplementary Fig. 7). Examining cells in which post-ChR2 res-ponses were largely above the ‘floor’, to accurately quantify the fulldistribution of suppression across the whole curve (SupplementaryFig. 7a), showed that PV and SOM activation both reduced thebaseline responses at non-preferred orientations (Fig. 2n; 1PV (PVneurons activated optically), 11 6 4% decrease in baseline, P , 0.05,n 5 52 cells; versus 1SOM, 19 6 6%, P , 0.001, n 5 25 cells). PV butnot SOM activation decreased the peak-baseline amplitude of cells’tuning functions (Fig. 2o; 1PV, 28.5 6 4.5% reduction, P , 0.001;1SOM, 19.8 6 11.2%, P 5 0.10), consistent with a larger reduction atthe peak relative to the baseline. PV activation did not affect theorientation selectivity index (OSI) of target cells (Fig. 2p; control,0.29 6 0.01; versus 1PV, 0.29 6 0.01; P 5 0.71; see alsoSupplementary Fig. 8), whereas SOM activation increased the OSI(Fig. 2p; control, 0.26 6 0.01; versus 1SOM, 0.30 6 0.01; P , 0.01).Similarly, PV activation did not affect the tuning width of target cells(Fig. 2q; control, half-width at half-height, 38.7 6 3.0 degrees; versus1PV, 35.2 6 3.0 deg; P 5 0.31), whereas SOM activation narrowed thetuning width (Fig. 2q; control, 45.7 6 4.1 deg; versus 1SOM,37.5 6 4.3 deg; P , 0.01). The effects on the direction selectivity index(DSI) were similar in trend (Fig. 2r; PV: 0.33 6 0.03 control DSI versus0.36 6 0.03 1PV DSI, P 5 0.44; SOM: 0.28 6 0.04 control DSI versus0.34 6 0.05 1SOM DSI, P 5 0.10). Thus, the relatively uniform sup-pression by SOM cells leads to a sharpening in response selectivity oftarget neurons, whereas the non-uniform but proportional suppres-sion by PV cells reduces response magnitude but does not changeresponse selectivity.
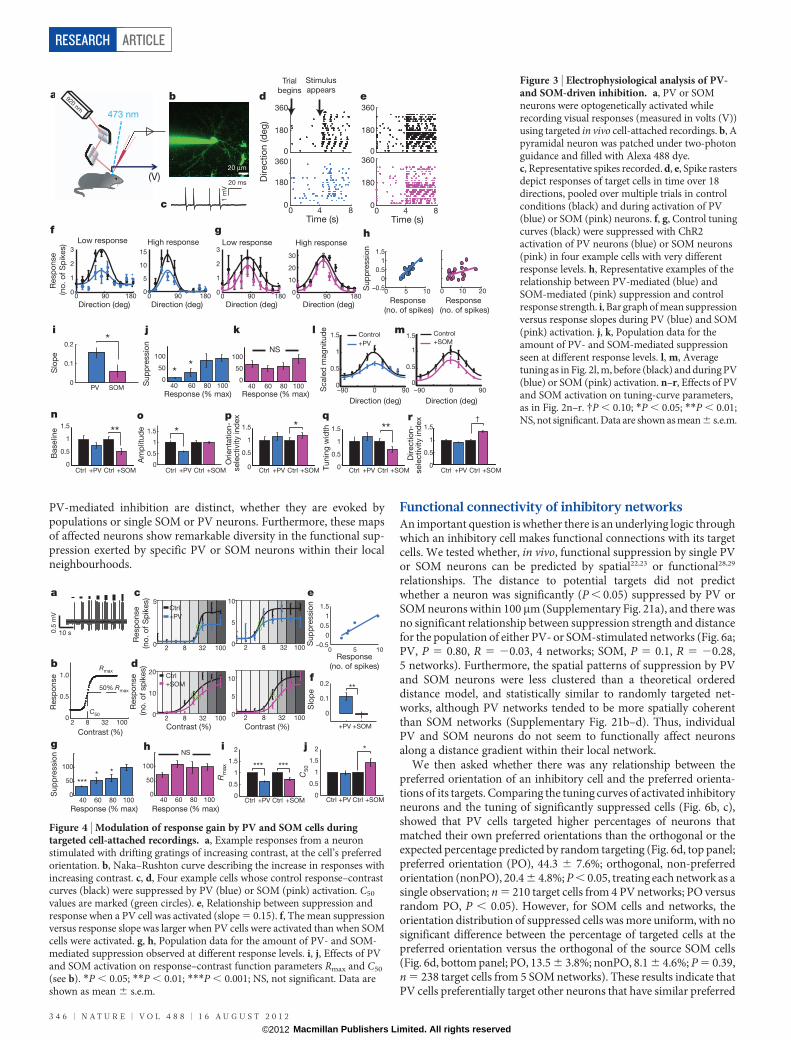
PV and SOM effects measured electrophysiologicallyWe examined further the different effects of PV and SOM activationusing electrophysiological cell-attached recordings in vivo (Fig. 3a).Putative pyramidal neurons (Fig. 3b) were identified by their regularspiking properties (Fig. 3c); the peak:trough ratio of individual spikeswas larger for all recorded cells than in identified fast-spikingPV-positive neurons (2.82 6 0.20 for all recorded cells, n 5 21;1.41 6 0.18 in PV-positive neurons, n 5 53; P , 0.001). Moderatelevels of PV- and SOM-mediated suppression (Supplementary Fig. 6i)had clearly different effects on spike responses of target cells andresultant orientation tuning curves (Fig. 3d, e), even in cells with verydifferent response levels (Fig. 3f, g). PV suppression depended on thelevel of control response, whereas SOM suppression shifted tuningcurves downwards more uniformly (Fig. 3h–k; PV, n 5 21 cells, SOM,n 5 17 cells). The changes in average tuning curves (Fig. 3l, m), andtheir parameters (Fig. 3n–r; Supplementary Fig. 8), showed that SOMbut not PV suppression sharpened response selectivity, consistentwith a model in which PV activation leads to a division of target cellresponses but in which SOM activation leads to a subtraction(Supplementary Fig. 9).
Differential inhibitory impact on target-cell gainThe divisive impact of PV activation suggests that PV neuronsimplement dynamic response gain control in cortex, which has beenpreviously attributed to intracortical inhibition26,27. We carried outcell-attached recordings and examined the effects of PV and SOMactivation on a canonical measure of response gain, the modulation ofresponses with increasing contrast (Fig. 4a, b). PV activation (Fig. 4c)led to contrast response curves with reduced gain (slope), whereasSOM activation (Fig. 4d) decreased responses relatively uniformly(with a floor effect at low response levels). The PV activation curves
In vivovisual cortex
50 μm
Targeted
scan
0 2 4 6 80
10
20
30
Time (s)
Trial no
. Visual stim
10 Hz
PV+
0 2 4 60
10
20
Trial no
. PV–
0 2 4 6 80
10
20
30
Time (s)
Trial no
.
Visual stim
10 Hz
g
h
20
d
e
0 90 180 270 3600
5
Resp
onse
(ΔF/
F %
)
0 90 180 270 3600
5f
k
0
10
20
30
40+PV
Ctrl
Visual
response
(ΔF/F %)
*
*
Direction (deg)
Visual stim
i
j
830 μm50 μm
10 sΔF/F
10%
Trial 1
Trial 210 sΔF/F
10%
2P
Optical stimulation
Fast scanning
Opticalrecording
Visual stimuli
Light-based
network
interface
Cortical network
a
b c
Figure 1 | All-optical network dissection of cortical subclasses during visualcomputations. a, Directed light, for optical recording and stimulation, wastargeted to the V1 of an animal being shown visual stimuli. b, A traditionalraster scan located cells in the network that were bulk-loaded with the calciumindicator dye OGB. c, Cells that were automatically identified were then imagedat high speed using targeted two-photon scanning along an arbitrary scan path.d, This enabled detection of robust cellular activity in response to episodicallypresented oriented drifting gratings, and this activity could be analysed asprimary signals or deconvolved to estimate action potentials (red lines).e, Evoked optical traces were highly consistent over repeated presentations ofvisual stimuli. f, The clear, repeatable responses enabled the resolution of well-defined responses (dots), fit by dual Gaussian curves (lines). Data are shown asmean 6 s.e.m. g, Image of an mCherry-ChR21 PV1 (channelrhodopsin-2-and PV-positive) cell targeted in vivo for cell-attached recording. h, Evokedaction potentials from an mCherry-ChR21 PV1 cell. PV1 neurons wereactivated at the onset (3.9 s) of 4 s of visual stimulation, through 10-Hzstimulation of the PV1 neuron. i, j, Recording of the visual response of a PV2
neuron in the control condition (i) and with PV activation (j). k, Left, cellpopulation loaded with OGB dye (top), and responses of a cell marked by anasterisk in the network shown in the top right panel (bottom). Right, cellscolour-coded by the magnitude of their visual response in the control condition(top) and when PV1 neurons were activated (bottom; colour bar, DF/F %). AChR21 PV neuron in the network is circled. 1PV, optical PV activation; Ctrl,control; PV2, PV-negative; PV1, PV-positive.
RESEARCH ARTICLE
3 4 4 | N A T U R E | V O L 4 8 8 | 1 6 A U G U S T 2 0 1 2
Macmillan Publishers Limited. All rights reserved©2012

were better fit by a divisive scaling model than a subtractive model,whereas SOM activation curves were better fit by the subtractivemodel (Supplementary Fig. 10). PV- but not SOM-mediated sup-pression was dependent on the response level, as shown by bothsuppression-response slopes (Fig. 4e, f; PV, 0.11 6 0.03, n 5 17 cells;versus SOM, 20.008 6 0.02, n 5 16 cells; P , 0.01; SupplementaryFig. 11a, b) and suppression-response strength comparisons (PV,P , 0.05–0.001 comparing suppression at 40%, 60% and 80% res-ponse to that at 100% (Fig. 4g); SOM, P . 0.2 comparing suppressionat 40%, 60% and 80% response to that at 100% (Fig. 4h)). PV activa-tion scaled response magnitude (Fig. 4i; 1PV: Rmax 64.1 6 3.5% ofcontrol; n 5 17 cells; P , 0.001) without affecting half-saturationcontrast (Fig. 4j; 1PV: C50 95.0 6 10% of control; P 5 0.65). SOMactivation significantly reduced Rmax (Fig. 4i; 1SOM: 73.6 6 5.3% ofcontrol; n 5 16 cells; P , 0.001), but unlike PV, also significantlyincreased C50 (Fig. 4j; 1SOM: 141 6 17.7% of control; P , 0.05), withno effect on the response gain (P 5 0.23 comparing slopes at C50
before and after SOM activation; versus P , 0.01 comparing slopesbefore and after PV activation; see also Supplementary Fig. 11). Thus,PV but not SOM activation contributes directly to controlling the gainof target-cell responses.
Single-cell circuit maps of network connections in vivoThe functional roles of inhibitory neurons are manifested through thespatial distribution and functional targeting of subclasses of inhibitiononto cortical cells in the local network. To define the output connec-tions of single inhibitory neurons, we developed a system to focally
stimulate an individual neuron while simultaneously imaging res-ponses from large numbers of cells to assess their functional coupling(Fig. 5a). The ChR2-stimulating 473-nm beam was narrowed to asmall effective radius and focused on sparsely distributed ChR2-pos-itive cells (Fig. 5b and Supplementary Figs 12–16). Thus, we couldoptically activate chosen PV or SOM neurons in vivo while concur-rently sampling population responses with targeted imaging (Fig. 5cand Supplementary Movie 4).
Mapping response modulation across a network while controlling aPV ChR2 cell or a SOM ChR2 cell (Fig. 5d, h), we found that visualresponses of some neighbouring neurons were significantly sup-pressed while other cells were unaffected (Fig. 5e, i), resulting in mapsof the functional suppression triggered during focal PV or SOMactivation (Fig. 5f, j). Similar non-uniform, heterogeneous maps offunctional PV and SOM cell connectivity were obtained from everyimaged animal (Supplementary Fig. 17; PV, n 5 4 networks; SOM, n5 5 networks). Focal PV activation resulted in the significant sup-pression of 43.1 6 2.1% of neurons within the field of view, whereasfocal SOM activation suppressed 16.2 6 2.9% of neurons. Electricalstimulation of a single cell through whole-cell patch recording in vivoyielded a similar suppression map (Supplementary Fig. 18). Single PVor SOM neuron activation rarely triggered observable dis-inhibition(Supplementary Fig. 19). The nature of suppression was very similarto that observed with full-field activation: the amount of suppressionby PV cells depended on the strength of the control response, whereasfocal SOM stimulation resulted in more uniform suppression (Fig. 5h,m; see also Supplementary Fig. 20). Thus, the effects of SOM- and
OGB1−AMPV−ChR2
OGB1−AMSOM−ChR2 0 36 72 108 144
020406080
+SOM
Time (s)
020406080
Control
Resp
onse (ΔF
/F %
)
0 90 1800
5
10
Direction (deg)
Resp
onse
(ΔF/
F %
)
0 90 1800
2
4
6
8
a b c d
f g
0 90 1800
20
40
Direction (deg)
8 10 12 14
0
0.5
1
1.5
Response
(ΔF/F %)
Sup
pre
ssio
n
0 5 10
0
0.5
1
1.5
Sup
pre
ssio
n
i k l
n
–90 0 90
0.4
0.6
0.8
1
Direction (deg)
–90 0 90
0.4
0.6
0.8
1
Direction (deg)
e
0 0.5 10
50
100
Suppression slope
Cells
(%
)
***
j
40 60 80 1000
50
100
Response (% max)
Sup
pre
ssio
n
******
*
40 60 80 1000
50
100
Response (% max)
Control
+SOM
m
0 90 1800
2
4
6
8
NS
Ctrl +PV Ctrl +SOM0
0.5
1
1.5
Baselin
e
0
0.5
1
1.5
Am
plit
ud
e
0
0.5
1
1.5
Orienta
tio
n-
sele
ctivity ind
ex
0
0.5
1
1.5
Tunin
g w
idth
0
0.5
1
1.5
Directio
n-
sele
ctivity ind
ex
* *** ***** **
o p q r †
h
0 36 72 108 144
0
10
20
Time (s)
+PV
0
10
20Control
Resp
onse (ΔF
/F %
)Response
(ΔF/F %)
Scale
d m
ag
nitud
e
Control
+PV
20 μm 20 μm
Ctrl +PV Ctrl +SOM Ctrl +PV Ctrl +SOM Ctrl +PV Ctrl +SOM Ctrl +PV Ctrl +SOM
Figure 2 | Impact of PV- and SOM-driven inhibition on the tuning ofneuronal responses. a, An imaging site showing neurons loaded with calciumindicator (OGB1-AM, green) and two PV1 neurons expressing mCherry-ChR2 (PV-ChR2, red) in visual cortex in vivo. b, Optical responses to visualstimuli, either without (Control) or with (1PV) simultaneous optical PVactivation in interleaved trials, recorded during episodically presented orienteddrifting gratings (see Fig. 1d). The photo-artefact from ChR2 stimulation hasbeen removed from these trials. c, d, Same as (a and b), but from an experimentwith mCherry-ChR2 expression in SOM neurons. e, f, Control tuning curves(black) were suppressed with ChR2 activation of PV neurons (blue) or SOM
neurons (pink) in four example cells. g, h, The normalized suppression plottedas a function of control response strength in two example cells (blue, PV; pink,SOM). i, Cumulative density functions of the distributions of suppressionversus response slopes for all cells suppressed by PV (blue) and SOM (pink)activation. j, k, Population data showing the amount of PV- and SOM-mediated suppression at different response levels. l, m, Average tuning curvesshowing control responses and effects of PV (blue) or SOM (pink) activation.n–r, Effects of PV and SOM activation on tuning, including baseline, peak-baseline amplitude, OSI, tuning width and DSI. NS, not significant. {P , 0.10;*P , 0.05; **P , 0.01; ***P , 0.001. Data are shown as mean 6 s.e.m.
ARTICLE RESEARCH
1 6 A U G U S T 2 0 1 2 | V O L 4 8 8 | N A T U R E | 3 4 5
Macmillan Publishers Limited. All rights reserved©2012
PV-mediated inhibition are distinct, whether they are evoked bypopulations or single SOM or PV neurons. Furthermore, these mapsof affected neurons show remarkable diversity in the functional sup-pression exerted by specific PV or SOM neurons within their localneighbourhoods.
Functional connectivity of inhibitory networksAn important question is whether there is an underlying logic throughwhich an inhibitory cell makes functional connections with its targetcells. We tested whether, in vivo, functional suppression by single PVor SOM neurons can be predicted by spatial22,23 or functional28,29
relationships. The distance to potential targets did not predictwhether a neuron was significantly (P , 0.05) suppressed by PV orSOM neurons within 100 mm (Supplementary Fig. 21a), and there wasno significant relationship between suppression strength and distancefor the population of either PV- or SOM-stimulated networks (Fig. 6a;PV, P 5 0.80, R 5 20.03, 4 networks; SOM, P 5 0.1, R 5 20.28,5 networks). Furthermore, the spatial patterns of suppression by PVand SOM neurons were less clustered than a theoretical ordereddistance model, and statistically similar to randomly targeted net-works, although PV networks tended to be more spatially coherentthan SOM networks (Supplementary Fig. 21b–d). Thus, individualPV and SOM neurons do not seem to functionally affect neuronsalong a distance gradient within their local network.
We then asked whether there was any relationship between thepreferred orientation of an inhibitory cell and the preferred orienta-tions of its targets. Comparing the tuning curves of activated inhibitoryneurons and the tuning of significantly suppressed cells (Fig. 6b, c),showed that PV cells targeted higher percentages of neurons thatmatched their own preferred orientations than the orthogonal or theexpected percentage predicted by random targeting (Fig. 6d, top panel;preferred orientation (PO), 44.3 6 7.6%; orthogonal, non-preferredorientation (nonPO), 20.4 6 4.8%; P , 0.05, treating each network as asingle observation; n 5 210 target cells from 4 PV networks; PO versusrandom PO, P , 0.05). However, for SOM cells and networks, theorientation distribution of suppressed cells was more uniform, with nosignificant difference between the percentage of targeted cells at thepreferred orientation versus the orthogonal of the source SOM cells(Fig. 6d, bottom panel; PO, 13.5 6 3.8%; nonPO, 8.1 6 4.6%; P 5 0.39,n 5 238 target cells from 5 SOM networks). These results indicate thatPV cells preferentially target other neurons that have similar preferred
0
180
360
0 4 80
180
360
Time (s)
Directio
n (d
eg
)
0
180
360
0 4 80
180
360
Time (s)
0 90 1800
5
10
15
Direction (deg)0 90 180
0
10
20
30
Direction (deg)
PV SOM0
0.1
0.2*
Slo
pe
Ctrl +PV Ctrl +SOM0
0.5
1
1.5
Baselin
e **
Tu
nin
g w
idth
Directio
n-
sele
ctivity in
dex
0
0.5
1
1.5
Am
plit
ud
e *
a b
c
d e
f g h
i j k
on p q r
l m
0
0.5
1
1.5
0.5
1
1.5
Direction (deg)
−90 0 90−90 0 900
Control
+SOMControl
+PV
Direction (deg)
Scale
d m
ag
nitu
de
**
0
0.5
1
1.5
0
0.5
1
1.5
Orien
tatio
n-
sele
ctivity in
dex
*
0
0.5
1
1.5
Low response High response Low response High response
0 90 1800
1
2
3
Direction (deg)
Resp
on
se
(no
. o
f S
pik
es)
0 90 1800
1
2
3
Direction (deg)
Trial
begins
Stimulus
appears
20 μm
1 m
V
20 ms
0 5 10–0.5
0
0.5
1
1.5
Su
pp
ressio
n
0 10 20
Response
(no. of spikes)
Response
(no. of spikes)
Su
pp
ressio
n
* *0
50
100
0
50
100
40 60 80 100
Response (% max)40 60 80 100
Response (% max)
**
NS
†
(V)
473 nm
920 nm
Ctrl +PV Ctrl +SOM Ctrl +PV Ctrl +SOM Ctrl +PV Ctrl +SOM Ctrl +PV Ctrl +SOM
Figure 3 | Electrophysiological analysis of PV-and SOM-driven inhibition. a, PV or SOMneurons were optogenetically activated whilerecording visual responses (measured in volts (V))using targeted in vivo cell-attached recordings. b, Apyramidal neuron was patched under two-photonguidance and filled with Alexa 488 dye.c, Representative spikes recorded. d, e, Spike rastersdepict responses of target cells in time over 18directions, pooled over multiple trials in controlconditions (black) and during activation of PV(blue) or SOM (pink) neurons. f, g, Control tuningcurves (black) were suppressed with ChR2activation of PV neurons (blue) or SOM neurons(pink) in four example cells with very differentresponse levels. h, Representative examples of therelationship between PV-mediated (blue) andSOM-mediated (pink) suppression and controlresponse strength. i, Bar graph of mean suppressionversus response slopes during PV (blue) and SOM(pink) activation. j, k, Population data for theamount of PV- and SOM-mediated suppressionseen at different response levels. l, m, Averagetuning as in Fig. 2l, m, before (black) and during PV(blue) or SOM (pink) activation. n–r, Effects of PVand SOM activation on tuning-curve parameters,as in Fig. 2n–r. {P , 0.10; *P , 0.05; **P , 0.01;NS, not significant. Data are shown as mean 6 s.e.m.
2 8 32 1000
0.5
1.0
C50
50% Rmax
Rmax
Resp
onse
*
Ctrl +PV Ctrl +SOM0
0.5
1
1.5
2
Rm
ax *** ***
Ctrl +PV Ctrl +SOM0
0.5
1
1.5
2
C5
0
+PV +SOM
0
0.1
0.2
Slo
pe
b
c
df
g i j
2 8 32 1000
5
10
2 8 32 1000
5Ctrl
+PV
2 8 32 1000
5
10
2 8 32 1000
10
20
Contrast (%)
Ctrl
+SOM
Resp
onse
(no
. o
f S
pik
es)
Contrast (%)
h
40 60 80 1000
50
100
Response (% max)
Sup
pre
ssio
n
**** *
40 60 80 100
Response (% max)
**
Contrast (%)
NS
0
50
100
10 s0.5
mV
a e
Sup
pre
ssio
n
Response
(no. of spikes)
0 5 10–0.5
0
0.5
1
1.5
Resp
onse
(no
. o
f sp
ikes)
Figure 4 | Modulation of response gain by PV and SOM cells duringtargeted cell-attached recordings. a, Example responses from a neuronstimulated with drifting gratings of increasing contrast, at the cell’s preferredorientation. b, Naka–Rushton curve describing the increase in responses withincreasing contrast. c, d, Four example cells whose control response–contrastcurves (black) were suppressed by PV (blue) or SOM (pink) activation. C50
values are marked (green circles). e, Relationship between suppression andresponse when a PV cell was activated (slope 5 0.15). f, The mean suppressionversus response slope was larger when PV cells were activated than when SOMcells were activated. g, h, Population data for the amount of PV- and SOM-mediated suppression observed at different response levels. i, j, Effects of PVand SOM activation on response–contrast function parameters Rmax and C50
(see b). *P , 0.05; **P , 0.01; ***P , 0.001; NS, not significant. Data areshown as mean 6 s.e.m.
RESEARCH ARTICLE
3 4 6 | N A T U R E | V O L 4 8 8 | 1 6 A U G U S T 2 0 1 2
Macmillan Publishers Limited. All rights reserved©2012

orientations, whereas SOM neurons seem to have a broader range oftargets.
DiscussionAlthough a growing literature has started to examine the input andfiring properties of specific inhibitory neuron classes19,20,30,31, little isunderstood about the functional nature of their output. By triggeringinhibition and measuring its effects on connected cells in the func-tioning cortex, we have shown the computational impact of differentforms of inhibition on sensory processing. PV neurons principallyimplement divisive normalization, whereas SOM neurons perform
relatively uniform subtraction of responses in their targets, leadingto complementary effects on neuronal responses: SOM neurons alterstimulus selectivity, whereas PV neurons preserve selectivity, and PVneurons modulate response gain, whereas SOM neurons shift res-ponse levels, leaving response gain unaffected. These effects aremediated by complementary local circuits: PV neurons preferentiallytarget iso-oriented neurons, whereas SOM neurons target cells with awide range of orientation preferences.
The role of inhibition in shaping stimulus selectivity of visual cortexneurons has been difficult to resolve with previous methods.Intracellular recordings from V1 neurons have found closely matchedtuning of excitatory and inhibitory synaptic conductances8,28,29,32,indicating that inhibition might not sharpen orientation selectivity,and intracellular blockade of inhibition indeed does not seem to affectorientation tuning33. However, broadly tuned or untuned inhibitioncan in principle sharpen neuronal responses; such inhibition hasalso been described in V1 neurons10,34,35, and pharmacologicalblockade of network inhibition broadens orientation selectivity5–7.We show that SOM-mediated inhibition targets cells with a rangeof preferred orientations, and its presence on dendrites probablyserves to sharpen the wide orientation preference of dendritic excit-atory inputs36. Consistent with SOM neurons having this role, geneticreduction of a subset of dendrite-targeting interneurons broadensorientation selectivity37.
Inhibition has long been proposed to regulate the gain of corticalresponses, and we now show that PV cells are crucial for this function.Consistent with our findings, a recent study26 has demonstrated thatactivating PV-interneuron populations in mouse visual cortex has adivisive scaling effect on responses of target neurons. Rapid PV-mediated inhibition matched to excitation in time could shape res-ponse gain as well as selectivity, as shown in the auditory9,38, soma-tosensory39,40 and prefrontal cortex41. Finally, the regulation ofresponse gain by PV cells makes them an attractive mechanism forthe developmental regulation of inputs during experience-dependentplasticity of cortical circuits42.
The distinctive effects of PV and SOM inhibition may arise fromtheir cellular regions of impact43, and possibly synaptic differences
RecordStim
Inhibition
50 μm
4
56
2
3
SuppressedNot
suppressed
SuppressedNot
suppressed
1
d e
f
h i
j
b
Spike probability
15 μm
PV network 1
SOM network 1
a
c
1
2
3
4
5
6
Resp
onse (d
F/F
%)
Direction (deg)
4
56
2
3
1
2
3
4
5
61
Direction (deg)
4
5
6
Resp
on
se (d
F/F
%)
4
52
1
3 6
Response (% max)
Response (% max)S
up
pre
ssio
nS
up
pre
ssio
n
g
k
* **
0
50
100
46 64 82 1000
50
100
46 64 82 100
**
NS
0% 20% 40% 60% 80% 100%
15 μm
50 μm
50 μm
(X1,Y1)
Targetedsampling
Targetedstimulation
(F)
473 nm
Control
+100 μm
Targeted
Full field
Control
2
1
3
0
10
20
0
5
10
0
6
12
0
5
10
090 1800
5
10
10
20
0 90 1800
10
20
0
10
20
90 1800
30
60
0
20
40
0
20
40
090 1800
3
6
0
0
00
920 nm
(X2,Y2)
Figure 5 | Dual-laser optical mapping of network connections to revealmaps of functional inhibition by single PV and SOM neurons. a, Two lasersystems are controlled independently and synchronized for concurrent high-speed imaging and targeted spatial stimulation of a ChR2-expressing inhibitoryneuron. b, A SOM ChR21 neuron in vivo was patched and recorded whilesystematically mapping target locations with a focused 473-nm laser; spikeswere elicited only when stimulation was targeted on or very near to the soma.The colour bar indicates the spike probability at each location (0–100%). c, All-optical circuit mapping. Optical activation of one neuron (blue spot) duringtargeted recording of another neuron (red spot). Activity in the recordedneuron was measured with no stimulation (Control, black), full-field activationof PV neurons (blue), targeted activation of the PV neuron (red), and whileaiming the stimulation beam 100 mm off-target (grey). Visual responses weresuppressed by both full-field and single PV-cell activation. d, Mapping theinfluence of targeted PV activation on neighbouring cells revealed some cellsthat were significantly suppressed by PV activation (red, 1–3) which wereclearly intermixed with other nearby cells that were not affected (white, 4–6).e, Tuning curves for cells 1–6 comparing cell responses during control (black)or targeted PV-cell activation (blue). f, Spatial distribution of all cells in thenetwork that were either significantly suppressed (red) or not (black).g, Population data for the amount of PV- and SOM-mediated suppressionobserved at cells’ different response levels across all single cell networks.h–k, Same as d–g, in experiments in which focal stimulation was targeted tosingle SOM neurons. *P , 0.05; **P , 0.01; NS, not significant. Data areshown as mean 6 s.e.m.
Orientation preference
0
40
80
PV
+ o
r SO
M+
resp
onse (Δ
F/F%
)
0
0.4
0.8
0
40
80
Targ
ete
d n
euro
ns/t
ota
l cells
0
0.4
0.8
PV networks
SOM networks
**NS
PO non
PORandom
PO
Random
nonPO
c d
*
NSNS NS
0 40 80 120 160
Direction (deg) Targ
ete
d/t
ota
l cells
b
50 μm50 100 150
Sup
pre
ssio
n
by S
OM
+ c
ell
(%)
Su
pp
ressio
n
by P
V+
cell
(%)
Distance (μm)
a
0
50
100
0
50
100
Targ
ete
d/t
ota
l cells
0
0.1
0.2
0.3
0
0.2
0.4
0.6
Figure 6 | Spatial and functional analysis of targeting by single PV and SOMneurons. a, The amount of suppression in significantly suppressed cells isplotted against their distance from the stimulated PV cell (top) or SOM cell(bottom). Best fit coloured lines show individual networks; black line depictspooled data. b, The orientation preferences of significantly suppressed cells arecolour-coded for two example networks (top, PV (blue); bottom, SOM (pink)).c, Distribution of preferred orientations of target cells (black lines) for theseexample networks, superimposed with the orientation tuning curve of thestimulated PV (blue line, top) or SOM (pink line, bottom) neuron. d, Bargraphs show the mean proportion of neurons that matched the preferredorientation of stimulated PV neurons (blue bars) or SOM neurons (pink bars),and the orthogonal, non-preferred orientation. Grey bars show the samecomparison when the preferred orientations were randomly re-sampled amongthe neurons in the fields of view (Random PO and Random nonPO). For PVbut not SOM, the actual percentage of targets at the PO was greater thanexpected with random targeting, indicating that PV cells may preferentiallysuppress cells with similar functional response properties. *P , 0.05;**P , 0.01; NS, not significant. Data are shown as mean 6 s.e.m.
ARTICLE RESEARCH
1 6 A U G U S T 2 0 1 2 | V O L 4 8 8 | N A T U R E | 3 4 7
Macmillan Publishers Limited. All rights reserved©2012

between the cell types44,45. The methods we have described provide abasis for ‘functional connectomics’ in active cortical circuits, and alsoreveal the complementary computational roles of specific inhibitorycell classes in vivo during sensory processing. In bridging the gapbetween cellular and network function, these methods should beapplicable to many cortical areas and cell types, to elucidate theirfunctional connectivity and embodied computational principles.
METHODS SUMMARYDetails of mice and viral constructs used, animal surgical preparations, in vitroslice characterization of ChR2 function, interneuron expression, in vivo two-photon guided cell-attached recording, development of high-speed targetedscanning of calcium responses, development of simultaneous two-photonimaging and optogenetic stimulation, the focal stimulation system, and detailsof data analysis are described in the Supplementary Methods.
Received 24 December 2011; accepted 25 June 2012.
Published online 8 August 2012.
1. Freund, T. F. & Buzsaki, G. Interneurons of the hippocampus. Hippocampus 6,347–470 (1996).
2. Markram, H. et al. Interneurons of the neocortical inhibitory system. Nature Rev.Neurosci. 5, 793–807 (2004).
3. Klausberger, T. & Somogyi, P. Neuronal diversity and temporal dynamics: theunity of hippocampal circuit operations. Science 321, 53–57 (2008).
4. Lewis, D. A. GABAergic local circuit neurons and prefrontal cortical dysfunction inschizophrenia. Brain Res. Brain Res. Rev. 31, 270–276 (2000).
5. Sillito, A. M. The contribution of inhibitory mechanisms to the receptive fieldproperties of neurones in the striate cortex of the cat. J. Physiol. (Lond.) 250,305–329 (1975).
6. Crook, J. M., Kisvarday, Z. F. & Eysel, U. T. Evidence for a contribution of lateralinhibition to orientation tuning and direction selectivity in cat visual cortex:reversible inactivation of functionally characterized sites combined withneuroanatomical tracing techniques. Eur. J. Neurosci. 10, 2056–2075 (1998).
7. Tsumoto, T., Eckart, W. & Creutzfeldt, O. D. Modification of orientation sensitivity ofcat visual cortex neurons by removal of GABA-mediated inhibition. Exp. Brain Res.34, 351–363 (1979).
8. Ferster, D. & Miller, K. D. Neural mechanisms of orientation selectivity in the visualcortex. Annu. Rev. Neurosci. 23, 441–471 (2000).
9. Wehr, M. & Zador, A. M. Balanced inhibition underlies tuning and sharpens spiketiming in auditory cortex. Nature 426, 442–446 (2003).
10. Monier, C., Chavane, F., Baudot, P., Graham, L. J. & Fregnac, Y. Orientation anddirection selectivity of synaptic inputs in visual cortical neurons: a diversity ofcombinations produces spike tuning. Neuron 37, 663–680 (2003).
11. Carandini, M. & Heeger, D. J. Summation and division by neurons in primate visualcortex. Science 264, 1333–1336 (1994).
12. Somers, D. C., Nelson, S. B. & Sur, M. An emergent model of orientation selectivityin cat visual cortical simple cells. J. Neurosci. 15, 5448–5465 (1995).
13. Reynolds, J. H. & Heeger, D. J. The normalization model of attention. Neuron 61,168–185 (2009).
14. Ohshiro, T., Angelaki, D. E. & DeAngelis, G. C. A normalization model ofmultisensory integration. Nature Neurosci. 14, 775–782 (2011).
15. Louie, K.&Glimcher, P.W.Separating value fromchoice: delaydiscounting activityin the lateral intraparietal area. J. Neurosci. 30, 5498–5507 (2010).
16. Rudy, B., Fishell, G., Lee, S. & Hjerling-Leffler, J. Three groups of interneuronsaccount for nearly 100% of neocortical GABAergic neurons. Dev. Neurobiol. 71,45–61 (2011).
17. Xu, X., Roby, K. D. & Callaway, E. M. Immunochemical characterization of inhibitorymouse cortical neurons: three chemically distinct classes of inhibitory cells.J. Comp. Neurol. 518, 389–404 (2010).
18. Schummers, J., Yu, H. & Sur, M. Tuned responses of astrocytes and their influenceon hemodynamic signals in the visual cortex. Science 320, 1638–1643 (2008).
19. Runyan, C. A. et al. Response features of parvalbumin-expressing interneuronssuggest precise roles for subtypes of inhibition in visual cortex. Neuron 67,847–857 (2010).
20. Bock, D. D. et al. Network anatomy and in vivo physiology of visual cortical neurons.Nature 471, 177–182 (2011).
21. Yoshimura, Y. & Callaway, E. M. Fine-scale specificity of cortical networks dependson inhibitory cell type and connectivity. Nature Neurosci. 8, 1552–1559 (2005).
22. Fino, E. & Yuste, R. Dense inhibitory connectivity in neocortex. Neuron 69,1188–1203 (2011).
23. Packer, A. M. & Yuste, R. Dense, unspecific connectivity of neocorticalparvalbumin-positive interneurons: a canonical microcircuit for inhibition?J. Neurosci. 31, 13260–13271 (2011).
24. Ko, H. et al. Functional specificity of local synaptic connections in neocorticalnetworks. Nature 473, 87–91 (2011).
25. Lillis, K. P., Eng, A., White, J. A. & Mertz, J. Two-photon imaging of spatially extendedneuronal network dynamics with high temporal resolution. J. Neurosci. Methods172, 178–184 (2008).
26. Atallah, B. V., Bruns, W., Carandini, M. & Scanziani, M. Parvalbumin-expressinginterneurons linearly transform cortical responses to visual stimuli. Neuron 73,159–170 (2012).
27. Katzner, S., Busse, L. & Carandini, M. GABAA inhibition controls response gain invisual cortex. J. Neurosci. 31, 5931–5941 (2011).
28. Anderson, J. S., Carandini,M.&Ferster, D.Orientation tuningof input conductance,excitation, and inhibition in cat primary visual cortex. J. Neurophysiol. 84, 909–926(2000).
29. Marino, J. et al. Invariant computations in local cortical networks with balancedexcitation and inhibition. Nature Neurosci. 8, 194–201 (2005).
30. Kerlin, A. M., Andermann, M. L., Berezovskii, V. K. & Reid, R. C. Broadly tunedresponse properties of diverse inhibitory neuron subtypes in mouse visual cortex.Neuron 67, 858–871 (2010).
31. Hofer, S. B. et al. Differential connectivity and response dynamics of excitatory andinhibitory neurons in visual cortex. Nature Neurosci. 14, 1045–1052 (2011).
32. Tan, A. Y., Brown, B. D., Scholl, B., Mohanty, D. & Priebe, N. J. Orientation selectivityof synaptic input to neurons in mouse and cat primary visual cortex. J. Neurosci.31, 12339–12350 (2011).
33. Nelson, S., Toth, L., Sheth, B. & Sur, M. Orientation selectivity of cortical neuronsduring intracellular blockade of inhibition. Science 265, 774–777 (1994).
34. Xing, D., Ringach, D. L., Hawken, M. J. & Shapley, R. M. Untuned suppression makesa major contribution to the enhancement of orientation selectivity in macaque v1.J. Neurosci. 31, 15972–15982 (2011).
35. Liu, B. H. et al. Broad inhibition sharpens orientation selectivity by expanding inputdynamic range in mouse simple cells. Neuron 71, 542–554 (2011).
36. Jia, H., Rochefort, N. L., Chen, X. & Konnerth, A. Dendritic organization of sensoryinput to cortical neurons in vivo. Nature 464, 1307–1312 (2010).
37. Mao, R. et al. Influence of a subtype of inhibitory interneuron on stimulus-specificresponses in visual cortex. Cereb. Cortex 22, 493–508 (2011).
38. Tan, A. Y., Zhang, L. I., Merzenich, M. M. & Schreiner, C. E. Tone-evoked excitatoryand inhibitory synaptic conductances of primary auditory cortex neurons.J. Neurophysiol. 92, 630–643 (2004).
39. Okun, M. & Lampl, I. Instantaneous correlation of excitation and inhibitionduring ongoing and sensory-evoked activities. Nature Neurosci. 11, 535–537(2008).
40. Gentet, L. J., Avermann, M., Matyas, F., Staiger, J. F. & Petersen, C. C. Membranepotential dynamics of GABAergic neurons in the barrel cortex of behaving mice.Neuron 65, 422–435 (2010).
41. Haider, B., Duque, A., Hasenstaub, A. R. & McCormick, D. A. Neocortical networkactivity in vivo is generated through a dynamicbalance of excitation and inhibition.J. Neurosci. 26, 4535–4545 (2006).
42. Yazaki-Sugiyama, Y., Kang, S., Cateau, H., Fukai, T. & Hensch, T. K. Bidirectionalplasticity in fast-spiking GABA circuits by visual experience. Nature 462, 218–221(2009).
43. Koch, C., Poggio, T. & Torre, V. Nonlinear interactions in a dendritic tree:localization, timing, and role in information processing. Proc. Natl Acad. Sci. USA80, 2799–2802 (1983).
44. Kulik, A. et al. Compartment-dependent colocalization of Kir3.2-containing K1
channels and GABAB receptors in hippocampal pyramidal cells. J. Neurosci. 26,4289–4297 (2006).
45. Nusser, Z., Sieghart, W., Benke, D., Fritschy, J.M. & Somogyi, P. Differential synapticlocalization of two major gamma-aminobutyric acid type A receptor alphasubunits on hippocampal pyramidal cells. Proc. Natl Acad. Sci. USA 93,11939–11944 (1996).
Supplementary Information is linked to the online version of the paper atwww.nature.com/nature.
Acknowledgements We thank J. Huang for providing the SOM–Cre mouse line; C. Lefor performing animal care support and viral injections; S. Yan and Y. Deng for help inthe development of optogenetics and imaging methods in vitro; S. El-Boustani forcollecting data for in vivo deconvolution; J. Sharma, M. Goard and A. Banerjee forcomments and discussions on the manuscript; L.-H. Tsai, K. Meletis and M. Carlen forearly provision of viral constructs and PV–Cre viral injections; and James Schummersand Hiroki Sugihara for participating in early pilot experiments testing optogeneticsstimulation in vivo. This work was supported by postdoctoral fellowships from the USNational Institutes of Health (NIH) and the Simons Foundation (N.R.W.), an NIHpredoctoral fellowship (C.A.R.) and grants from the NIH and the Simons Foundation(M.S.).
Author Contributions N.R.W. conceived experiments, designed and engineered circuitinterface and analysis systems, carried out in vivo and in vitro experiments, andperformed analyses. C.A.R. conceived experiments, performed surgeries and viralinjections, carried out in vivo experiments, and performedanalyses. F.L.W. carried out invivo experiments, and performed analyses. M.S. conceived experiments andcontributed to analysis of experiments. N.R.W., C.A.R. and M.S. wrote the paper.
Author Information Reprints and permissions information is available atwww.nature.com/reprints. The authors declare no competing financial interests.Readers are welcome to comment on the online version of this article atwww.nature.com/nature. Correspondence and requests for materials should beaddressed to M.S. ([email protected]) or N.R.W. ([email protected]).
RESEARCH ARTICLE
3 4 8 | N A T U R E | V O L 4 8 8 | 1 6 A U G U S T 2 0 1 2
Macmillan Publishers Limited. All rights reserved©2012