diversity of mtdna lineages in portugal: not a genetic...
TRANSCRIPT

Ann. Hum. Genet. (2000), 64, 491–506
Printed in Great Britain
491
Diversity of mtDNA lineages in Portugal:
not a genetic edge of European variation
L. PEREIRA",#, M. J. PRATA",# A. AMORIM",#
" Instituto de Patologia e Imunologia Molecular da Universidade do Porto (IPATIMUP),
R. Dr. Roberto Frias s}no, 4200 Porto, PORTUGAL#Faculdade de CieW ncias da Universidade do Porto, Pr. Gomes Teixeira, 4050 Porto, PORTUGAL
(Received 11.1.00. Accepted 26.7.00)
The analysis of the hypervariable regions I and II of mitochondrial DNA in Portugal showed that
this Iberian population presents a higher level of diversity than some neighbouring populations. The
classification of the different sequences into haplogroups revealed the presence of all the most
important European haplogroups, including those that expanded through Europe in the Palaeolithic,
and those whose expansion has occurred during the Neolithic. Additionally a rather distinct African
influence was detected in this Portuguese survey, as signalled by the distributions of haplogroups U6
and L, present at higher frequencies than those usually reported in Iberian populations. The
geographical distributions of both haplogroups were quite different, with U6 being restricted to
North Portugal whereas L was widespread all over the country. This seems to point to different
population movements as the main contributors for the two haplogroup introductions. We
hypothesise that the recent Black African slave trade could have been the mediator of most of the
L sequence inputs, while the population movement associated with the Muslim rule of Iberia has
predominantly introduced U6 lineages.
Since the description of the mitochondrial
DNA sequence by Anderson et al. (1981), this
peculiar genome, which is maternally inherited,
non-recombining and fast-evolving, has been
intensively investigated and applied to popu-
lation studies. The initial screening based on
restriction fragment length polymorphisms
spread all over the molecule, was soon enlarged
by direct sequencing of two hypervariable
regions located in the control region (D-Loop):
HVRI and HVRII.
Correspondence: Luı!sa Pereira, Instituto de Patologiae Imunologia Molecular da Universidade do Porto(IPATIMUP), R. Dr. Roberto Frias s}n, 4200 PortoPORTUGAL. Tel : 351 22 5570700; Fax: 351 225570799.E-mail : lpereira!ipatimup.pt
Present day sequence variation of mtDNA is a
valuable tool for making what Avise et al. (1987)
referred to as phylogeographic inferences.
MtDNA sequences can be used to construct
networks or used in other methodological
approaches which afford information about pre-
historic population size and patterns of gene
flow. The evolutionary history of haplogroups,
their inferred origin and expansion through the
world, provide the basis for reconstructing and
dating major prehistoric and historic population
movements.
Many published studies based on HVRI se-
quence diversity focus on the history of
European populations (Richards et al. 1996;
Co# rte-Real et al. 1996; Richards et al. 1998).
Richards et al. (1998), applying a phylo-
geographic approach to western Europe mtDNA
diversity, concluded that the majority (85%) of

492 L. P, M. J. P A. A
European sequences must have originated during
the Upper Palaeolithic and suffered a consider-
able post-glacial expansion; about 15% of the
sequences reflect a restricted Neolithic input,
from the Near East toward the West of Europe,
and only 1% of the sequences represent more
recent influences of Asian and African mtDNA
pools.
Focussing on the westernmost edge of Europe,
the Iberian Peninsula, some studies (Co# rte-Real
et al. 1996; Salas et al. 1998) have pointed to a
common origin of all Iberian populations in the
Upper Palaeolithic. For most populations, di-
versity levels were found to be lower than the
values reported for central European countries, a
feature that was thought to support the ex-
pansion model of modern humans from the
Middle East in the direction of Western Europe.
The lowest Iberian diversity value was observed
in Basques, reflecting the uniqueness of this
Iberian population (Co# rte-Real et al. 1996).
Another peculiarity of the Iberian mito-
chondrial pool is the presence of sequences
belonging to the U6 group (Richards et al. 1998),
signalling a North African influence that has not
been detected elsewhere in other European
populations.
In this work we have analysed HVRI and
HVRII diversity in Portugal, the westernmost
country of the Iberian Peninsula, with the aim of
obtaining a better characterisation of European
mtDNA variability. We have considered three
main regions in Portugal : North, Central and
South. This was done in parallel with a study of
Y chromosome biallelic markers that has
revealed statistical differences between the south
compared to the north and central regions
(Pereira et al. 2000).
Our main approach regarding the analysis of
mtDNA diversity was the evaluation of patterns
of mismatch distribution within the major haplo-
groups found in Portugal. We intended to assess
whether inferences regarding the history of
haplogroups were in agreement with those pre-
viously published based on network analysis,
and, simultaneously, to deepen the evolutionary
picture of mtDNA lineages in Europe.
Population samples
Three population samples from Portugal were
analysed: 100 unrelated individuals from the
North, 82 from the Central region and 59 from
the South, according to the country division by
the major rivers Douro and Tagus. A total of
15 µl of blood was used to extract DNA by the
resin Chelex-100 method (Lareu et al. 1994).
MtDNA amplification and sequencing
MtDNA was amplified using the primers
L15997 (5«-CACCATTAGCACCC AAAGCT-3«)and H16401 (5«-TGATTTCACGGAGGATGGT-
G-3«) for HVRI, and L48 (5«-CTCACGGGAGC-
TCTCCATGC-3«) and H408 (5«-CTGTTAAAAG-
TGCATACCG CCA-3«) for HVRII. The tem-
perature profile was 95 °C for 10 sec., 60 °C for
30 sec. and 72 °C for 30 sec., for 35 cycles of
amplification.
The amplified samples were purified with
Microspin4 S-300 HR columns (Pharmacia
Biotech), according to the manufacturer’s speci-
fications. The sequencing reactions were carried
out using the Kit Big-Dye4 Terminator Cycle
Sequencing Ready Reaction (Perkin-Elmer),
with one of the above described primers, in both
forward and reverse directions.
A protocol based on MgCl#}ethanol precipi-
tation was used for post-sequence reaction puri-
fication of samples, which were then applied to a
6% PAGE gel and run in an automatic sequencer
ABI 377.
Genetic analysis
The nucleotide positions considered for analy-
sis were between bp 16024 and 16383 for HVRI
and between 73 and 340 for HVRII (in the
numbering system of Anderson et al. 1981).
Sequence classification into haplogroups was
based on HVRI and position 00073 of HVRII,
and the nomenclatures of Richards et al.
(1998), Macaulay et al. (1999) and Rando et al.
(1999) were followed for European, Sub-Saharan
and North African clusters, respectively. Se-
quences are available in GenBank (accession

MtDNA diversity in Portugal 493
nos. AF277997–AF278237 and AF278238–
AF278478).
Molecular diversity indexes and mismatch
distributions were executed using the software
ARLEQUIN 1.1 (Schneider et al. 1997).
HVRI and HVRII diversity in Portugal
Some diversity parameters obtained in the
three Portuguese regions studied for HVRI
and}or II are presented in Table 1. HVRI
presented a higher mean number of nucleotide
differences than region II. However, when
corrected for fragment sizes both regions showed
a similar mean number of nucleotide pairwise
differences: HVRII}HVRI mean ratios were
0.87, 0.90 and 1.05 in North, Central and South
Portugal, respectively.
The proportion of polymorphic sites (Table 2)
was higher in HVRI than in HVRII, averaging
17.68% and 11.20%, respectively. However,
region II presented a slightly faster mutation
rate than the former, a conclusion that was based
on the comparison of estimates of the τ parameter
of Rogers & Harpending (1992) in both regions.
This parameter consists in τ¯µlt, where µ is
mutation rate per nucleotide, l is sequence length
and t is time in generations after a population
expansion. Since t is equal in HVRI and HVRII
in a certain population, and knowing the length
of both regions, we can obtain µII
}µI
from the
ratio τII
}τI. The µ
II}µ
Iratios for Portugal were
1.044, 0.984 and 1.273, in North, Central and
South respectively, with a mean value of 1.10, a
value close to that reported by Salas et al. (2000)
for other European populations (0.998 for
British, 1.216 for Austrian and 0.943 for Tuscan),
excepting Galicia, where the very high value
found (1.845) is related to the low mean of
nucleotide differences reported for HVRI in that
population.
Combining both sets of observations it is clear
that in HVRI mutations tend to occur more
homogeneously along different nucleotide
positions than in HVRII. Therefore, our data are
in agreement with previous studies (Meyer et al.
1999; Torroni et al. 1996) that have described
fast-mutating positions in the HVRII region:
positions 146, 150, 152 and 195 are very prone to
substitution events whereas at position 309 a
length polymorphism is frequently found.
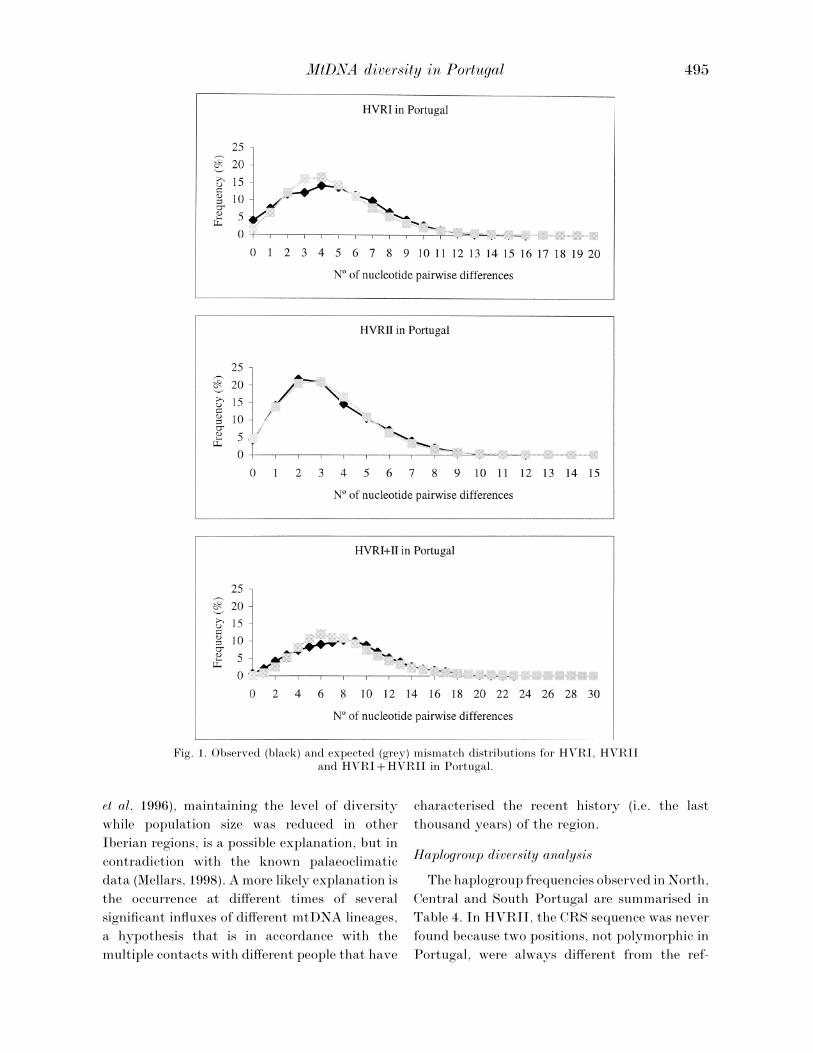
The differential mutational behaviour of
HVRI and HVRII is also reflected in the pattern
of mismatch distributions. The observed and
expected numbers of pairwise differences were
analysed in the three geographic regions, but as
the distribution patterns were basically identical
in the three regions, only those corresponding to
the overall Portuguese sample will be presented
(Figure 1). For HVRII, the observed distribution
closely matches the expected distribution. How-
ever, the observed distributions for HVRI and
HVRIHVRII are characterised by the pres-
ence of slight shoulders and higher number of
nucleotide differences compared to the expected
values.
It is widely accepted that the mismatch
distribution retains valuable information about
demographic episodes undergone during the
history of a population. Unimodal curves with
modes at a small number of differences have been
observed in western European populations
(Co# rte-Real et al. 1996; Salas et al. 1998) and were
interpreted as signatures of relatively recent
population expansions. By contrast, the tend-
ency of African populations (Mateu et al. 1997) to
display ragged and multimodal distributions has
supported the idea of their being more ancient
and stationary, or more diversified. It is worth
mentioning that making population demo-
graphic inferences from the analysis of mismatch
distributions must be tentative since several
factors have to be considered: time of expansion,
size before the expansion, gene flow between
populations and sub-structuring of populations.
Some simulation studies have shown that the
statistical effects of some factors can be quite
convergent (Marjoram & Donnelly, 1994).
In the presence of mismatch distributions
showing some deviations from regular charac-
teristic unimodal distributions, as we have found
for HVRI and HVRIHVRII in Portugal, we
may be facing a population in which one or more

494 L. P, M. J. P A. A
Table 1. MtDNA diversity parameters in North
(NP), Central (CP) and South (SP) Portugal,
considering HVRI and}or HVRII
% ofdifferent
haplotypes
Mean no. ofnucleotidepairwise
differencesNucleotidediversity
HVRINP 67±0 4±78 0±013CP 75±6 4±87 0±014SP 69±5 4±54 0±013
HVRIINP 47±0 3±09 0±012CP 50±0 3±26 0±012SP 61±0 3±55 0±013
HVRIHVRIINP 84±0 7±87 0±012CP 92±7 8±13 0±013SP 91±5 8±09 0±013
Table 2. HVRI and HVRII variability in North
(NP), Central (CP) and South (SP) Portugal
HVRI(360 bp)
HVRII(268 bp)
Polymorphic sites (%)NP 71 (19±7) 28 (10±5)CP 66 (18±3) 31 (11±6)SP 54 (15±0) 31 (11±6)
No. of substitutions (%)NP 73 (100±0) 25 (89±3)CP 69 (100±0) 30 (93±8)SP 54 (100±0) 29 (90±6)
No. of transitions (%)NP 66 (90±4) 24 (96±0)CP 62 (89±9) 28 (90±3)SP 50 (92±6) 27 (93±1)
No. of transversions (%)NP 7 (9±6) 1 (4±0)CP 7 (10±1) 2 (6±7)SP 4 (7±4) 2 (6±9)
No. of indels (%)NP 0 (0±0) 3 (10±7)CP 0 (0±0) 2 (6±3)SP 0 (0±0) 3 (9±4)
of those factors has played a significant role.
Even without discriminating which factors these
might be, the mismatch distribution observed for
HVRII suggests that this sequence stretch is
more resistant to their effects. We cannot exclude
the possibility that the regular unimodal dis-
tribution for HVRII could be the result of an
(unknown) selective effect. However, if this was
the case, this selection would also affect HVRI
(since they are linked on the same molecule).
Another explanation is related to the fact that,
as already mentioned, mutational events in
HVRII are more heterogeneously dispersed.
Since some HVRII sites present very high
mutation rates the nucleotide variation does not
tend to be so strongly associated in blocks as
happens in the HVRI region. Within HVRI,
substitutions are more often found to be specific
to certain haplogroups and, by turn, it is easier
to classify the observed variation into haplo-
groups, which manifestly tend to show geo-
graphic clustering. Attending to all these
features, we suggest that HVRI and HVRI
HVRII distributions are more sensitive to
demographic factors and consequently their
study seems to be more informative for making
population demographic inferences.
Diversity comparison with other populations
For population comparison purposes, we have
not considered the diversity values registered for
HVRII, since population data for this region are
more scarce.
Table 3 presents some diversity estimates for
several populations. The Portuguese samples
studied here display a mean number of nucleotide
pairwise differences typical of European popu-
lations, which are, in general, lower than the
values characteristic of Asian and African popu-
lations (Comas et al. 1998; Mateu et al. 1997).
However, compared to a neighbouring Iberian
population, namely Galicia (Salas et al. 1998), the
populations analysed here present a higher level
of diversity, even when assessed excluding the
African L sequences (data not shown), which, as
will be further discussed, are found at very low
frequency in other Iberian populations.
It is difficult to explain the higher mtDNA
diversity in Portugal compared to other Iberian
neighbouring populations. The data might
suggest an ancient settlement of this region of
the Iberian Peninsula, a hypothesis that is not
supported by historical or palaeonthological
records. Alternatively, the use of North Portugal
as a refuge zone during the last glacial maximum,
as has been suggested for Andalusia (Co# rte-Real
MtDNA diversity in Portugal 495
Fig. 1. Observed (black) and expected (grey) mismatch distributions for HVRI, HVRIIand HVRIHVRII in Portugal.
et al. 1996), maintaining the level of diversity
while population size was reduced in other
Iberian regions, is a possible explanation, but in
contradiction with the known palaeoclimatic
data (Mellars, 1998). A more likely explanation is
the occurrence at different times of several
significant influxes of different mtDNA lineages,
a hypothesis that is in accordance with the
multiple contacts with different people that have
characterised the recent history (i.e. the last
thousand years) of the region.
Haplogroup diversity analysis
The haplogroup frequencies observed in North,
Central and South Portugal are summarised in
Table 4. In HVRII, the CRS sequence was never
found because two positions, not polymorphic in
Portugal, were always different from the ref-

496 L. P, M. J. P A. A
Table 3. Sequence diversity observed in HVRI in several populations. N, sample size; K, number of
different sequences found; A, number of variable nucleotides positions; B, mean nucleotide pairwise
differences; C, percentage average pairwise difference per nucleotide; π, nucleotide diversity.
N K A B C π References
Basque 106 52 52 2±95 0±82 0±008 1, 2Galician 92 53 56 3±13 0±87 0±009 3Portuguese 54 38 46 3±60 1±00 0±010 2Catalonian 15 11 16 3±73 1±04 0±010 2British 100 71 67 4±45 1±24 0±012 4S. Portuguese 59 41 54 4±51 1±25 0±013 This studyN. Portuguese 100 67 71 4±78 1±33 0±013 This studyC. Portuguese 82 62 66 4±87 1±35 0±014 This studySpanish 89 70 69 5±02 1±39 0±014 2, 5Tuscan 49 40 55 5±03 1±40 0±014 6Turkish 96 79 82 5±45 1±51 0±015 7, 8Middle-Eastern 42 38 59 7±08 1±97 0±020 9S. Tomean 50 32 53 7±56 2±10 0±021 10
" Bertranpetit et al. (1995) ; # Co# rte-Real et al. (1996) ; $ Salas et al. (1998) ; % Piercy et al. (1996) ; & Pinto et al.(1996) ; ' Francalacci et al. (1996) ; ( Calafell et al. (1996) ; ) Comas et al. (1996) ; * Di Rienzo et al. (1991) ;"! Mateu et al. (1997).
Table 4. MtDNA haplogroup distributions (no. of
individuals and % values in parenthesis) in
North (NP), Central (CP) and South (SP)
Portugal
NP CP SP
H 401? (41.00) 31 (37.81) 251? (50.0)I 1 (1.00) — 1 (1.70)J* 2 (2.00) 4 (4.88) 3 (5.09)J1 2 (2.00) — —J1b — — 2 (3.39)J2 2 (2.00) 1 (1.22) —K 3 (3.00) 6 (7.32) 4 (6.78)L1b — 1 (1.22) 1 (1.70)L2 3 (3.00) 2 (2.44) 1 (1.70)L3* 2 (2.00) 5 (6.10) 2 (3.39)M1 — 1 (1.22) —T* 31? (4.00) 8 (9.76) 6 (10.17)T1 61? (7.00) 1 (1.22) —U* 13? (4.00) 21? (3.66) 1? (1.70)U2 — 2 (2.44) —U3 2 (2.00) — 1 (1.70)U4 2 (2.00) 2 (2.44) —U5 1 (1.00) — —U5a 2 (2.00) 1 (1.22) 1 (1.70)U5a1 2 (2.00) 1 (1.22) 1 (1.70)U5a1a 1 (1.00) 2 (2.44) 1 (1.70)U5a}b 1 (1.00) — —U5b 1 (1.00) 1 (1.22) 1 (1.70)U6 1 (1.00) — —U6a 4 (4.00) — —U6b 2 (2.00) — —U7 — — 1 (1.70)V 8 (8.00) 33? (7.32) 4 (6.78)W 2 (2.00) 1 (1.22) –X – 3 (3.66) 11? (3.39)
Note: Haplogroups where the classification presentedambiguity are assigned with a question mark (?).
erence sequence: at position 00263 we found a G,
and at position 00311 a length polymorphism
with one more C. A recent revision of the CRS
sequence (Andrews et al. 1999) confirmed the
presence of an A in 00263 and 5C in 00311, both
allelic states occurring at very low frequency.
Comparisons between North, Central and
South Portugal did not reveal statistical
differences between the three regions with respect
to mtDNA variability (p values of FST
pairwise
genetic distances between populations were
0.327, 0.673 and 0.921 for North-Central, North-
South and Central-South, respectively). Accord-
ingly, the sequences of the three regions could be
merged in a global Portuguese sample, for the
analysis that will be presented next.
In order to evaluate if the overall diversity in
Portugal was due to a high diversity within
particular haplogroups or, alternatively, to a
high diversity of haplogroups, after classifying
the different sequences into haplogroups we have
performed mismatch distribution analysis within
each of the major haplogroups. We will only
present the results based on HVRI diversity
(Figure 2), as when the less informative HVRII
region was used (data not shown) all clusters
exhibited clear unimodal curves with low modes.
In this section we will try to correlate the
inferences taken from the analysis of haplogroups
mismatch distributions with those made by
Richards et al. (1998) based on network analysis.
MtDNA diversity in Portugal 497
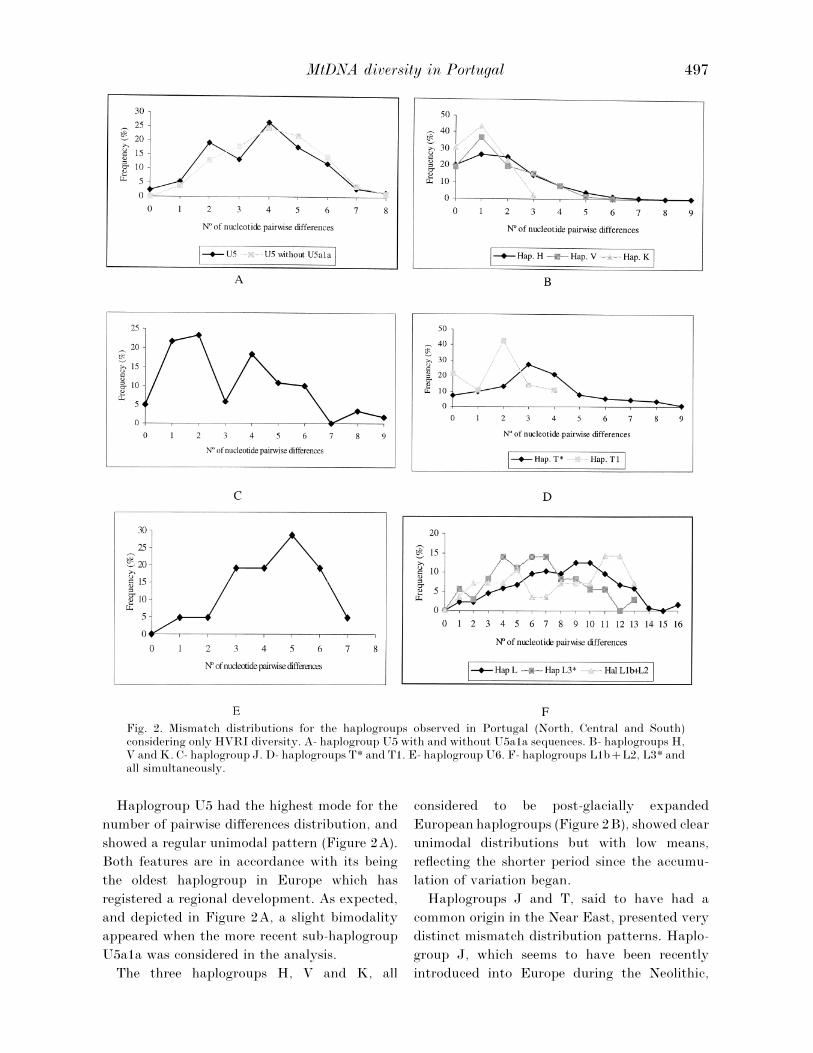
Fig. 2. Mismatch distributions for the haplogroups observed in Portugal (North, Central and South)considering only HVRI diversity. A- haplogroup U5 with and without U5a1a sequences. B- haplogroups H,V and K. C- haplogroup J. D- haplogroups T* and T1. E- haplogroup U6. F- haplogroups L1bL2, L3* andall simultaneously.
Haplogroup U5 had the highest mode for the
number of pairwise differences distribution, and
showed a regular unimodal pattern (Figure 2A).
Both features are in accordance with its being
the oldest haplogroup in Europe which has
registered a regional development. As expected,
and depicted in Figure 2A, a slight bimodality
appeared when the more recent sub-haplogroup
U5a1a was considered in the analysis.
The three haplogroups H, V and K, all
considered to be post-glacially expanded
European haplogroups (Figure 2B), showed clear
unimodal distributions but with low means,
reflecting the shorter period since the accumu-
lation of variation began.
Haplogroups J and T, said to have had a
common origin in the Near East, presented very
distinct mismatch distribution patterns. Haplo-
group J, which seems to have been recently
introduced into Europe during the Neolithic,

498 L. P, M. J. P A. A
Fig. 3. A most parsimonious tree of sequences belonging to cluster U6. Root motif 172-219 indicated withan asterisk. Branches are labelled by the nucleotide positions in HRVI (minus 16000) to designatetransitions; transversions are further specified and positions underlined represent parallel mutations.Numbers in brackets represent bibliographic reference (1) Co# rte-Real et al. (1996), (2) Mateu et al. (1996), (3)Rando et al. (1998), (4) Rando et al. (1999), (5) Salas et al. (1998), Watson et al. (1996), (7) this work.
showed a very irregular curve with a ragged
shape (Figure 2C). This pattern additionally
suggests a high level of diversification of the
founder sequences and also expresses the het-
erogeneity within the haplogroup: some well-
defined J sub-haplogroups are distinctively
spread through Europe, paralleling the clines
observed for Y chromosomal, and some auto-
somal, markers.
In contrast, haplogroup T presented a uni-
modal and bell-shaped curve (Figure 2D), which
can be explained by a more ancient introduction
into Europe with subsequent accumulation, in
loco, of homogenising mutations, starting from a
diversity level that must also have been lower
relatively to the initial package of J sequences.
When the sub-haplogroup T1 was analysed
separately, a slight bimodality and a low mean of
pairwise differences were registered. Those
features are quite compatible with its more
recent introduction, although we cannot exclude
some bias due to the low number of sequences
considered.
In the Portuguese sample analysed two haplo-

MtDNA diversity in Portugal 499
groups, U6 and L, that have been reported as
occurring sporadically in other European popu-
lations, were detected with comparatively high
frequency. Both haplogroups were characterised
by high levels of diversity and displayed very
irregular mismatch distributions (Figure 2E and
F). Moreover, haplogroup U6 was found to be
restricted to the North region of the country,
whereas the L sequences were spread all over the
country.
These haplogroups have been reported to be
characteristic of African populations, where their
frequency is inversely correlated with the North-
South axis : the frequency of U6 is high in North
Africa and decreases in a southerly direction,
being almost absent south of the equator; the L
cluster has an opposite distribution (Rando et al.
1998, 1999; Watson et al. 1996; Mateu et al.
1996).
In Portugal, as well as generally in Iberia,
many migration waves from both North and sub-
Saharan African populations are well docu-
mented. The geographical proximity of North
Africa and the Iberian Peninsula certainly
afforded many opportunities for mutual popu-
lation contacts. Among them, we stress the
movement of Berbers and Arabs that took place
during the very recent Muslim rule of Iberia
(from the 8th century to the end of the 15th, in
some regions). In addition, many sub-Saharan
individuals entered the region during the slave
trade period, from its very beginning (middle
15th century) until its total ban in the late 19th
century.
As it would be interesting to find out the origin
of the L and U6 sequences detected in Portugal,
we have tried to compare the motifs of the
sequences observed in Portugal with those de-
scribed in the literature for several populations
(Figures 3 and 4). However most of the matches
found for the Portuguese sequences were with
sequences widely distributed in Africa, and no
clear pattern of geographic clustering was
detected.
A striking aspect observed for the U6 haplo-
group was that 5 out of 7 of the Portuguese
sequences were unique to Portugal, not allowing,
therefore, any accurate assignment of their
geographical origin. The Canarian characteristic
sub-haplogroup U6b1 (Rando et al. 1999),
observed in other Iberian samples, was not
detected in the present study.
Admitting that U6 sequences could have been
at least partially introduced by Berber people
during the Muslim rule of Iberia, it is strange to
find them restricted to North Portugal. As a
matter of fact, most historical sources document
a deeper influence of Berber (as well as Arab)
people in Central and particularly South Iberia
(as judged from toponyms and general cultural
affinities), compared to North Iberia where the
Muslim presence is recorded to have been more
ephemeral and consequently to have made less
cultural and demographic impact. The data does
not exclude the possibility that U6 introductions
could have been additionally reinforced by later
sub-Saharan inputs mediated by the African
slave trade. Even if this mixed scenario is
plausible, the presence of U6 sequences exclus-
ively in North Portugal is a question that
deserves further analysis. The hypothesis of an
earlier introduction in the region does not seem
to be favoured, neither by its presence in a
restricted geographical area, nor by the high
level of heterogeneity that characterises the set of
sequences that were found among this haplo-
group.
With respect to the L sequences, it is widely
accepted that they have a sub-Saharan origin,
excepting some L3* lineages that, as analysis of
Figure 4 suggests, might indeed have a non-
African origin. The presence of L sequences in
North African regions does not allow us to
exclude the possibility that population influxes
from this region, namely the above referred
Berber}Arabmovement,haveintroducedasignifi-
cant fraction of L sequences into Iberia. How-
ever, it seems more likely that most of the L
lineages found nowadays in Portugal have been
carried by African slaves, since the country was
actively involved in the Transatlantic slave
trade. Nine out of 17 L sequences found in this
study showed matches with widespread African
sequences, and with regard to the 8 remaining
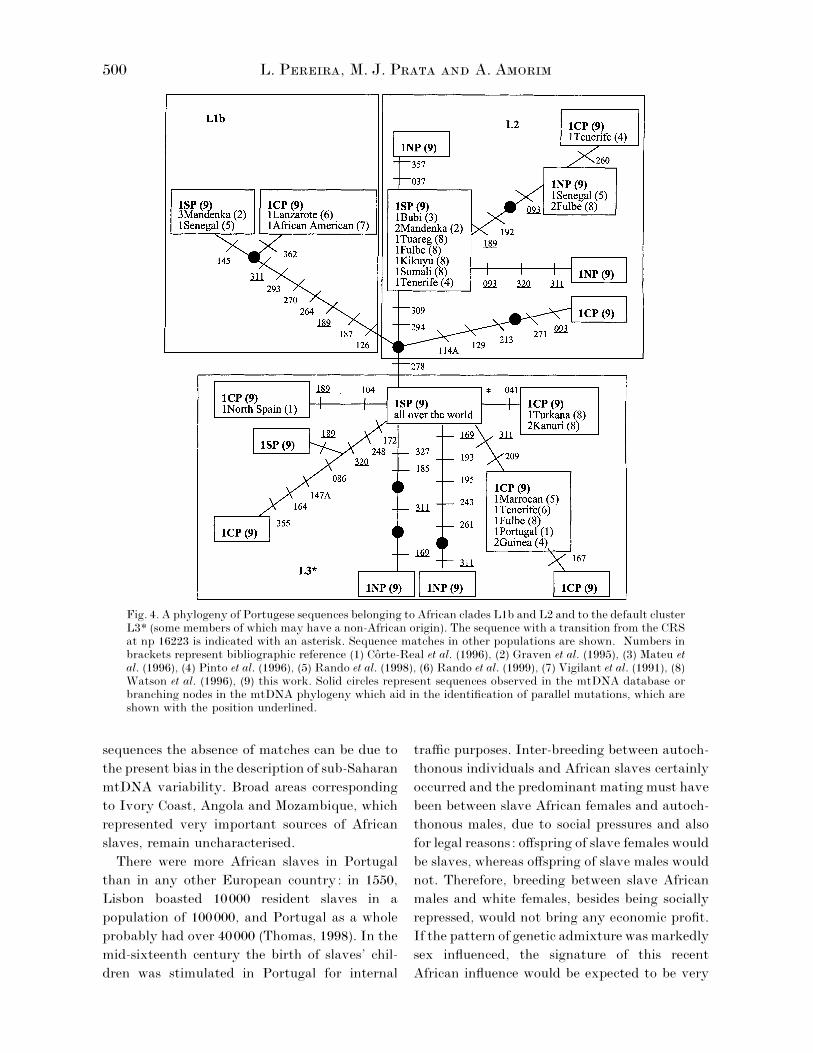
500 L. P, M. J. P A. A
Fig. 4. A phylogeny of Portugese sequences belonging to African clades L1b and L2 and to the default clusterL3* (some members of which may have a non-African origin). The sequence with a transition from the CRSat np 16223 is indicated with an asterisk. Sequence matches in other populations are shown. Numbers inbrackets represent bibliographic reference (1) Co# rte-Real et al. (1996), (2) Graven et al. (1995), (3) Mateu etal. (1996), (4) Pinto et al. (1996), (5) Rando et al. (1998), (6) Rando et al. (1999), (7) Vigilant et al. (1991), (8)Watson et al. (1996), (9) this work. Solid circles represent sequences observed in the mtDNA database orbranching nodes in the mtDNA phylogeny which aid in the identification of parallel mutations, which areshown with the position underlined.
sequences the absence of matches can be due to
the present bias in the description of sub-Saharan
mtDNA variability. Broad areas corresponding
to Ivory Coast, Angola and Mozambique, which
represented very important sources of African
slaves, remain uncharacterised.
There were more African slaves in Portugal
than in any other European country: in 1550,
Lisbon boasted 10000 resident slaves in a
population of 100000, and Portugal as a whole
probably had over 40000 (Thomas, 1998). In the
mid-sixteenth century the birth of slaves’ chil-
dren was stimulated in Portugal for internal
traffic purposes. Inter-breeding between autoch-
thonous individuals and African slaves certainly
occurred and the predominant mating must have
been between slave African females and autoch-
thonous males, due to social pressures and also
for legal reasons: offspring of slave females would
be slaves, whereas offspring of slave males would
not. Therefore, breeding between slave African
males and white females, besides being socially
repressed, would not bring any economic profit.
If the pattern of genetic admixture was markedly
sex influenced, the signature of this recent
African influence would be expected to be very

MtDNA diversity in Portugal 501
different in the maternally inherited gene pool
and in the paternally inherited one. In a recent
study based on Y chromosome biallelic markers
(Pereira et al. 2000) we have reported the absence
of typical sub-Saharan haplogroups in the Y
chromosome Portuguese pool. This finding, and
the detection of L sequences at 7.1% in the
mitochondrial pool, both seem to support the
above-mentioned pattern of admixture with
African slaves.
Studies of large population samples, designed
to characterise the molecular diversity in re-
stricted geographical contexts, can produce
valuable insights concerning specific demo-
graphic features that would remain undetectable
in broader scale surveys. In this work we have
studied mtDNA variability in Portugal, con-
sidering North, Central and South regions as
micro-screening sample units.
The level of mtDNA diversity found, although
characteristic of European populations, is high
when the westernmost location of the country in
Europe, and the reported European tendency for
reduction of diversity toward Western Iberia
(Corte-Real et al. 1996; Salas et al. 1998), are
considered. The observed HVRI and HVRI
HVRII mismatch distributions were unimodal
but smoother than others previously found in
neighbouring populations.
This finding, as well as the high level of
haplogroup diversity, suggests the influence of
specific demographic factors acting in the
Portuguese population, and led us to hypothesise
that an important modulator of the present
Portuguese mtDNA variability could have been
the influx of distinct mtDNA lineages at his-
torically quite different times.
Sharing the features of mtDNA diversity
generally registered in Europeans (all European
haplogroups were detected), Portugal has in
addition received significant North and sub-
Saharan African influences. Frequencies of haplo-
groups specific to these regions were higher than
those reported for other European populations:
7% of North African sequences were detected
(restricted to North Portugal and representing
almost 3% of the total sample), and sub-Saharan
African sequences were found to be spread
throughout the country, with frequencies be-
tween 5% and 9.8%. Although statistically
significant differences were not detected between
the three sub-samples considered, the geographic
distribution pattern observed for U6 and L
sequences strongly suggest that different popu-
lation movements were responsible for their
introduction into the country, although none of
them had enough demographic impact to induce
regional differentiation.
The introduction of L sequences in Portugal
was tentatively imputed mainly to the modern
slave trade that occurred between the 15th and
19th centuries. Both the great number of slaves
that entered Portugal and their very diverse
African geographic origin are consistent with the
data set now reported. However, we cannot
exclude some North-African contribution to
present-day Portuguese L lineages.
While the population movement associated
with the slave trade may be responsible by some
U6 inputs, we suggest that U6 sequences were
predominantly introduced into Portugal during
the Berber}Arab invasion of the Peninsula.
However, the observation that haplogroup U6 is
restricted to North Portugal is puzzling, con-
sidering the more pronounced impact of the
Muslin rule in south Iberia and the widespread
presence of African slaves throughout the
country, and deserves further investigation.
We are deeply in debt to Vincent Macaulay, whosecritical discussion of several aspects of this paper wasvery important for its improvement. We also thankMartin Richards for his assistance in the classification ofsome sequences. This work was partially supported by agrant (PRAXIS BD}13632}97) financed by Fundaça4 opara a Cie# ncia e a Tecnologia.
Anderson, S., Bankier, A. T., Barrell, B. G., de Bruijn,M. H. L., Coulson, A. R., Drouin, J., et al. (1981).Sequence and organisation of the human mitochondrialgenome. Nature 290, 457–465.
Andrews, R. M., Kubacka, I., Chinnery, P. F.,Lightowlers, R. N., Turnbull, D. M. & Howell, N.(1999). Reanalysis and revision of the Cambridge

502 L. P, M. J. P A. A
reference sequence for human mitochondrial DNA.Nature Genet. 23, 147.
Arnaiz-Villena, A., Martı!nez-Laso, J., Go! mez-Casado, E.,Dı!az-Campos, N., Santos, P., Martinho, A., Breda-Coimbra, H. (1997). Relatedness among Basques,Portuguese, Spaniards and Algerians studied by HLAallelic frequencies and haplotypes. Immunogenetics 47,37–43.
Avise, J., Arnold, J., Ball, R. M., Bermingham, E.,Lamb, T., Neigel, J. E. et al. (1987). Intraspecificphylogeography: the molecular bridge between popu-lation genetics and systematics. Ann. Ver. Ecol. Syst.18, 489–522.
Bertranpetit, J., Sala, I., Calafell, F., Underhill, P.,Moral, P. & Comas, D. (1995). Human mitochondrialDNA variation and the origin of the Basques. Ann.Hum. Genet. 59, 63–81.
Calafell, F., Underhill, P., Tolun, A., Aangelicheva, D. &Kaladjieva, L. (1996). From Asia to Europe: mito-chondrial DNA sequence variability in Bulgarians andTurks. Ann. Hum. Genet. 60, 35–49.
Comas, D., Calafell, F., Mateu, E., Pe! rez-Lezaun, A.,Bosch, E., Martı!nez-Arias, R. et al. (1998). Tradinggenes along the Silk Road: mtDNA sequences and theorigin of Central Asian populations. Am. J. Hum.Genet. 63, 1824–1838.
Comas, D., Calafell, F., Mateu, E., Pe! rez-Lezaun, A. &Bertranpetit, J. (1996). Geographic variation in humanmitochondrial DNA control region sequence: thepopulation history of Turkey and its relationship tothe European population. Mol. Biol. Evol. 13,1067–1077.
Co# rte-Real, H., Macaulay, V. A., Richards, M. B., Hariti,G., Issad, M. S., Cambon-Thomsen, A. et al. (1996).Genetic diversity in the Iberian Peninsula determinedfrom mitochondrial sequence analysis. Ann. Hum.Genet. 60, 331–350.
Di Rienzo, A. & Wilson, A. C. (1991). Branching patternin the evolutionary tree for the human mitochondrialDNA. Proc. Natl. Acad. Sci. USA 88, 1597–1601.
Forster, P., Harding, R., Torroni, A. & Bandelt, H. J.(1996). Origin and evolution of native AmericanmtDNA variation: a reappraisal. Am. J. Hum. Genet.59, 935–945.
Francalacci, P., Bertranpetit, J., Calafell, F. & Underhill,P. A. (1996). Sequence diversity of the control regionof mitochondrial DNA in Tuscany and its implicationsfor the peopling of Europe. Am. J. Phys. Anthrop. 100,443–460.
Graven, L., Passarino, G., Semino, O., Boursot, P.,Santachiara-Benerecetti, S., Langaney, A. & Excoffier,L. (1995). Evolutionary correlation between controlregion sequence and restriction polymorphisms in themitochondrial genome of a large Sengalese Mandenkasample. Mol Biol Evol. 12, 334–45.
Lareu, M. V., Phillips, C. P., Carracedo, A., Lincoln, A.J., Syndercombe-Court, D. & Thomson, J. A. (1994).Investigation of the STR locus HUMTH01 using PCRand two electrophoresis formats; UK and GalicianCaucasian population surveys and usefulness in pa-ternity investigations. Forensic Sci. Int. 66, 41–52.
Macaulay, V., Richards, M., Hickey, E., Vega, E.,Cruciani, F., Guida, V. et al. (1999). The emerging treeof west Eurasian mtDNAs: a synthesis of control-region sequences and RFLPs. Am. J. Hum. Genet. 64,232–249.
Marjoram, P. & Donnelly, P. (1994). Pairwise com-parisons of mitochondrial DNA sequences in sub-divided populations and implications for early humanevolution. Genetics. 136, 673–683.
Mateu, E., Comas, D., Calafell, F., Pe! rez-Lezaun, A.,Abade, A. & Bertranpetit, J. (1997). A tale of twoislands: population history and mitochondrial DNAsequence variation of Bioko and Sa4 o Tome! , Gulf ofGuinea. Ann. Hum. Genet. 61, 507–518.
Mellars, P. (1998). The Upper Paleolithic Revolution. InPrehistoric Europe: an illustrated history (ed. B. W.Cunliffe). Oxford: Oxford University Press.
Meyer, S., Weiss, G. & von Haeseler, A. (1999). Patternof nucleotide substitution and rate heterogeneity inthe hypervariable regions I and II of human mtDNA.Genetics 152, 1103–1110.
Pereira, L., Brio! n, M., Prata, M. J., Jobling, M. A.,Carracedo, A. & Amorim, A. (2000). Gradient of Ychromosome haplogroup 21 across the Western Iberia.Progress in Forensic Genetics 8, 281–283.
Piercy, R., Sullivan, K. M., Benson, N. & Gill, P. (1996).The application of mitochondrial DNA typing to thestudy of white Caucasian genetic identification. Int. J.Leg. Med. 106, 85–90.
Pinto, F., Gonza! lez, A. M., Herna! ndez, M., Larruga,J. M. & Cabrera, V. M. (1996). Genetic relationshipbetween the Canary Islanders and their African andSpanish ancestors inferred from mitochondrial DNAsequences. Ann. Hum. Genet. 60, 321–330.
Rando, J. C., Cabrera, V. M. Larruga, J. M., Herna! ndez,M., Gonza! lez, A. M., Pinto, F., & Bandelt, H.-J.(1999). Phylogeographic patterns of mtDNA reflectingthe colonization of the Canary Islands. Ann. Hum.Genet. 63, 413–428.
Rando, J. C., Pinto, F., Gonza! lez, A. M., Herna! ndez, M.,Larruga, J. M., Cabrera, V. M. & Bandelt, H.-J. (1998).Mitochondrial DNA analysis of Northwest Africanpopulations reveals genetic exchanges with European,Near-Eastern, and sub-Saharan populations. Ann.Hum. Genet. 62, 531–550.
Richards, M. B., Macaulay, V. A., Bandelt, H.-J. &Sykes, B. C. (1998). Phylogeography of mitochondrialDNA in western Europe. Ann. Hum. Genet. 62,241–260.
Richards, M. B., Co# rte-Real, H., Forster, P., Macaulay,V., Wilkinson-Herbots, H., Demaine, A. et al. (1996).Palaeolithic and Neolithic lineages in the Europeanmitochondrial gene pool. Am. J. Hum. Genet. 59,185–203.
Rogers, A. R. & Harpending, H. (1992). Populationgrowth makes waves in the distribution of pairwisegenetic differences. Mol. Biol. Evol. 9, 552–569.
Salas, A., Comas, D., Lareu, M. V., Bertranpetit, J. &Carracedo, A. (1998). mtDNA analysis of the Galicianpopulation: a genetic edge of European variation. Eur.J. Hum. Genet. 6, 365–375.
Salas, A., Lareu, M. V., Sa! nchez-Diz, P., Calafell, F. &Carracedo, A. (2000). mtDNA hypervariable region II(HVII) sequences in human evolution studies : impactof mutation rate heterogeneity. Progress in ForensicGenetics 8, 329–331.
Schneider, S., Kueffer, J. M., Roessli, D. & Excoffier, L.(1997). Arlequin ver.1.1: A software for populationgenetic data analysis. Genetics and Biometry Lab-oratory, University of Geneva, Switzerland.

MtDNA diversity in Portugal 503
Thomas, H. (1998). The slave trade – the history of theAtlantic slave trade 1440–1870. London: MacmillanPublishers Ltd.
Torroni, A., Bandelt, H.-J., D’Urbano, L., Lahermo, P.,Moral, P., Sellitto, D., et al. (1998). MtDNA analysisreveals a major late Palaeolithic population expansionfrom southwestern to northeastern European popu-lations. Genetics 62, 1137–1152.
Torroni, A., Huoponen, K., Francalacci, P., Petrozzi, M.,Morelli, L., Scozzari, R. et al. (1996). Classification of
Haplotypes and their geographical distribution in North (N), Central (C) and South (S) Portugal.
HVRI HVRII N C S Hap
051162 73 263 311.1 — 1 — H051257 152 263 303.1 311.1 1 — — H075183A/C 189 249 356 263 303.3 311.1 — — 1 H092129239 73 263 311.1 — — 1 H?093126 199 263 303.1 311.1 1 1 — H?093213 215 263T/A 263 303.1 311.1 1 — — H093263 263 311.1 — 1 — H124 146263 303.1 311.1 — 1 — H124256 146 263 303.1 311.1 — 1 — H129 146263 311.1 1 — — H129 152263 303.1 311.1 — 1 — H162209 73 263 311.1 — — 1 H162209293 73 263 303.1 311.1 — — 1 H163 263311.1 — — 1 H172 263311.1 1 — — H176 195204 263 311.1 1 — — H176218 200 251 263 303.1 311.1 1 — — H180278 263 303.1 311.1 1 — — H183A/C 189 356 362 263 311.1 1 1 — H183A/C 189 263 303.2 311 — — 2 H184 146263 303.2 311.1 — 1 — H189 263303.1 311.1 — 1 — H192274362 239 263 303.1 311.1 1 — — H192274362 152 239 263 303.1 311.1 1 — — H192 263303.1 311.1 — — 1 H209 263303.1 311.1 1 1 — H209304 263 311.1 — 1 — H218299 263 303.1 311.1 1 — — H248 257263 303.1 311.1 1 — — H248 257263 303.2 311.1 — 1 — H259 195263 303.1 311.1 1 — — H260 263303.1 311.1 — 1 — H261 93 263 311.1 — 1 — H265A/C 263 303.1 311.1 1 1 — H269270 263 311.1 — — 1 H272304 263 303.1 311.1 1 — — H274294C/G 152 263 311.1 1 1 — H274 263303.1 311.1 — 1 — H293311 195 263 303.1 311.1 —1 — H304 263311.1 1 — — H304327 263 311.1 1 — — H311 146195 263 311.1 — 1 — H320C/A 263 311.1 3 — — H335 263311.1 — — 1 H344 93 263 303.2 311 — — 1 H362 150239 263 311.1 — 1 — H362 263303.1 311.1 — — 1 HCRS 263311.1 11 3 2 HCRS 263303.1 311.1 1 3 3 H
European mtDNAs from an analysis of three Europeanpopulations. Genetics 144, 1835–1850.
Vigilant, L., Stoneking , M., Harpending, H. Hawkes, K.,Wilson, A. C. (1991) African populations and theevolution of human mitochondrial DNA. Science 253,1503–7.
Watson, E., Bauer, K., Aman, R., Weiss, G., vonHaeseler, A. & Paabo, S. (1996). mtDNA sequencediversity in Africa. Am. J. Hum. Genet. 59, 437–444.

504 L. P, M. J. P A. A
HVRI HVRII N C S Hap
CRS 152263 303.1 311.1 1 1 1 HCRS 151152 263 311.1 1 — — HCRS 152263 311.1 1 2 — HCRS 263269C/A 303.2 311.1 1 — — HCRS 185263 303.1 311.1 1 — — HCRS 195257 263 303.2 311.1 1 — — HCRS 263303.2 311.1 — 1 2 HCRS 146263 303.1 311.1 — 1 — HCRS 150263 311.1 — 1 1 HCRS 151262 263 303.2 311.1 — — 1 HCRS 151263 303.2 311.1 — — 1 HCRS 150263 303.1 311.1 — — 1 HCRS 195257 263 303.1 311.1 — — 1 HCRS 263303.2 311.1 338 — — 1 H129223278 311 (391) 73 199 204 250 263 303.2 311.1 1 — — I129172 223 311 73 199 203 204 250 263 311.1 — — 1 I063069 126 73 228 263 295 311.1 — 1 — J*069126 172 73 228 263 295 311.1 1 — — J*069126 286 73 185 228 263 295 303.1 311.1 1 — — J*069126 73 185 263 295 303.1 311.1 — 1 — J*069126 311 73 185 263 295 303.1 311.1 — 1 — J*069126 311 73 228 263 295 303.1 311.1 — 1 — J*069126 73 185 207 228 263 295 311.1 — — 1 J*069126 73 146 185 188 222 228
263 295 311.1— — 1 J*
069126 319 73 185 228 263 295 303.1 311.1 — — 1 J*069126 261 73 146 185 228 263 295 303.1 311.1 1 — — J1069126 261 73 146 185 228 263 295 311.1 1 — — J1069126 145 222 235 261 271 73 263 295 311.1 — — 1 J1b069126 145 222 256 261 278 73 199 263 295 311.1 — — 1 J1b069126 193 319 360 73 150 152 263 295 303.1 311.1 1 1 — J2069126 193 319 360 362 73 150 152 263 295 303.1 311.1 1 1 — J2093224 311 73 195 263 303.1 311.1 1 — — K093189224 311 73 195 263 311.1 — 1 — K093224311 73 152 263 311.1 — 1 — K093224290 311 73 263 303.1 311.1 — — 1 K093224311 73 150 195 263 303.1 311.1 — — 1 K224311 73 263 303.1 311.1 1 1 — K224311 73 263 303.2 311.1 1 — 1 K224256311 73 263 303.1 311.1 — 1 — K224311 73 146 152 263 311.1 — 1 — K224311 73 146 263 311.1 — 1 — K224311 73 195 263 303.1 311.1 — — 1 K126187189 223 264 270 278 293311 362
73 152 182 185G/T 195 247 263303.1 311.1
— 1 — L1b
126145 187 189 223 264 270 278293 311
73 152 182 185G/T 195 247 263311.1 357
— — 1 L1b
037223 278 294 309 357 (390) 73 143 146 152 195 263 311.1 1 — — L2093189 192 223 278 294 309 (390) 73 143 146 152 195 263 303.1 311.1 1 — — L2093223 278 294 309 311 320 (390) 73 143 146 152 195
263 311.11 — — L2
093114C/A 129 213 223 271 278 73 146 150 152 182 195 198 207263 311.1
— 1 — L2
093189 192 223 260 278 294 309 73 143 146 152 195 207 263303.1 311.1
— 1 — L2
223278 294 309 73 143 146 152 195 263 311.1 — — 1 L2041223 73 150 263 311.1 — 1 — L3*086147C/A 164 172 223 248 320 355 73 152 199 204 207 263 311.1 — 1 — L3*104183A/C189 223 73 263 311.1 — 1 — L3*167209 223 311 73 189 200 263 311.1 — 1 — L3*169185 223 311 327 73 150 185 189 200 263 311.1 1 — — L3*169193 195 223 243 261 311 73 150 200 235 249delA 263 303.1
311.11 — — L3*
172182A/C 183A/C 189 223 248 320 73 150 195 263 311.1 — — 1 L3*209223 311 73 189 200 263 311.1 — 1 — L3*

MtDNA diversity in Portugal 505
HVRI HVRII N C S Hap
223 73 150 195 263 303.1 311.1 — — 1 L3*129183A/C 189 223 249 311 73 195 263 303.1 311.1 — 1 — M1037126 186 189 222 73 152 263 303.1 311.1 1 — — T*?051126 294 296 304 73 151 204 263 303.1 311.1 1 — — T*093126 271 294 296 304 73 151 263 303.1 311.1 — 1 — T*114126 153 192 294 73 150 263 303.1 311.1 — 1 — T*126153 294 73 150 263 311.1 1 — — T*126192 294 296 304 73 151 263 311.1 1 — — T*126256 294 296 73 152 263 303.1 311.1 — 1 — T*126260 294 296 319 73 263 311.1 — 1 — T*126292 294 73 263 303.1 311.1 — 1 1 T*126294 296 304 73 263 311.1 — 1 1 T*126294 296 304 73 195 263 311.1 — 1 — T*126294 304 73 152 263 311.1 — 1 — T*126153 189 294 296 73 150 263 303.1 311.1 — — 1 T*126218 294 296 324 73 263 311.1 — — 1 T*126294 296 304 73 151 263 311.1 — — 1 T*126294 296 304 73 151 260 263 303.1 311.1 — — 1 T*037126 163 186 189 73 152 263 303.1 311.1 1 — — T1?126163 186 187 189 294 73 152 195 263 303.1 311.1 1 — — T1126163 186 189 294 73 195 263 303.1 311.1 3 — — T1126163 186 189 249 294 311 73 263 303.1 311.1 2 1 — T1CRS 73 263311.1 1 — — U*?CRS 73 263303.1 311.1 1 — — U*?CRS 73 152263 303.1 311.1 1 — — U*?142C/A 311 73 263 311.1 — 1 — U*179 73 195 263 303.1 311.1 — 1 — U*184264 291 73 263 303.1 311.1 316 1 — — U*189 73 263 303.1 311.1 — 1 — U*?189 73 263 311.1 — — 1 U*?051092 129G/C 174 183A/C 189 362 73 152 217 263 311.1 — 1 — U2051129G/C 189 256 311 73 152 217 263 311.1 340 — 1 — U2343 73 150 263 311.1 1 — — U3343356 (390) 73 150 263 311.1 1 — — U3343356 73 150 195 263 303.1 311.1 — — — U3134288356 73 152 195 263 311.1 — 1 — U4179356 73 150 195 263 311.1 1 — — U4179356 73 195 263 303.1 311.1 1 1 — U4224270 73 150 199 263 279 311.1 1 — — U5167192 270 311 318 356 73 150 263 303.1 311.1 1 — — U5a167192 270 311 356 73 150 263 303.1 311.1 — 1 — U5a192235 270 304 73 146 150 263 311.1 1 — — U5a192270 73 150 151 228 263 303.2 311.1 — — 1 U5a114C/A 192 270 294 73 263 303.1 311.1 1 — — U5a1189192 256 270 362 73 195 263 303.1 311.1 — 1 — U5a1192256 270 291 (399) 73 263 303.1 311.1 1 — — U5a1192256 270 73 263 303.2 311.1 — — 1 U5a1189256 270 362 73 185 204 263 303.1 311.1 1 — — U5a1a256 270 73 263 311.1 — 2 — U5a1a256 270 73 146 263 284A/C 311.1 — — 1 U5a1a183A/C 187 189 192 270 73 150 195 200 263 311.1 1 — — U5a}b093111 189 270 73 150 263 311.1 — — 1 U5b114189 192 270 73 140 150 263 311.1 — 1 — U5b189270 73 150 263 311.1 1 — — U5b051172 219 311 73 263 311.1 1 — — U6172182A/C 183A/C 189 219 278 73 263 303.1 311.1 1 — — U6a172183A/C 189 219 278 73 263 303.1 311.1 1 — — U6a172219 235 278 355 73 146 263 303.1 311.1 1 — — U6a172219 271 278 73 152 263 303.1 311.1 1 — — U6a172174 188 219 311 73 263 311.1 1 — — U6b172219 261 311 73 263 303.1 311.1 1 — — U6b309318A/T 73 152 263 303.2 311.1 — — 1 U7124298 311 319 (72) 263 311.1 — — 1 V129298 195 263 311.1 1 — — V183A/C 189 259C/G 298 263 303.2 311.1 — — 1 V

506 L. P, M. J. P A. A
HVRI HVRII N C S Hap
189298 (72) 263 311.1 — — 1 V242 (72) 152 263 303.1 311.1 — 1 — V?254298 (72) 263 303.1 311.1 — 1 — V264298 195 263 303.1 311.1 o — — V264298 (72) 195 227 263 311.1 — — 1 V298 (72) 131 263 303.2 311.1 1 — — V298 (72) 263 303.1 311.1 2 1 — V298 (72) 263 311.1 1 — — V298 (72) 195 263 303.1 311.1 1 1 — V298311 (72) 263 311.1 1 — — V298 73 263 311.1 — 1 — V?298344 73 263 311.1 — 1 — V?192223 292 325 73 189 194 195 204 207 263 303.1 311.1 — 1 — W223292311 73 189 195 204 207 263 311.1 1 — — W223292362 73 189 194 195 204 207 263 303.1 311.1 1 — — W048189223 255 278 73 146 153 195 225 263 303.1 311.1 — — 1 X172183A/C 189 278 73 146 152 185 263 303.1 311.1 — — 1 X?183A/C 189 223 260 278 73 153 195 225 226 263 303.1 311.1 — 1 — X189223255 278 73 146 153 172T/G 195 225 226 263
303.1 311.1— 1 — X
189223255 278 73 146 153 195 225 226 263 311.1 — 1 — XVariant positions from the Cambridge Reference Sequence (CRS) of Anderson et al. (1981) are shown (minus 16000in HVRI). Transversions are further specified by the appropriate base change. Haplogroups where the classificationpresents ambiguity are assigned with a question mark (?). In the case of positions 303 and 311, the presence of one,two or three Cs is referred by .1, .2 and .3, respectively, following the base position. In some cases, additional positionsoutside the referred regions are indicated inside brackets.