whole-mtdna genome sequence analysis of...
TRANSCRIPT
Whole-mtDNA Genome Sequence Analysis of Ancient African Lineages
Mary Katherine Gonder,* Holly M. Mortensen,* Floyd A. Reed,* Alexandra de Sousa,�� andSarah A. Tishkoff**Department of Biology, University of Maryland; �Center for the Advanced Study of Hominid Paleobiology and �Department ofAnthropology, George Washington University
Studies of human mitochondrial (mt) DNA genomes demonstrate that the root of the human phylogenetic tree occurs inAfrica. Although 2 mtDNA lineages with an African origin (haplogroups M and N) were the progenitors of all non-Africanhaplogroups, macrohaplogroup L (including haplogroups L0–L6) is limited to sub-Saharan Africa. Several L haplogrouplineages occur most frequently in eastern Africa (e.g., L0a, L0f, L5, and L3g), but some are specific to certain ethnicgroups, such as haplogroup lineages L0d and L0k that previously have been found nearly exclusively among southernAfrican ‘‘click’’ speakers. Few studies have included multiple mtDNA genome samples belonging to haplogroups thatoccur in eastern and southern Africa but are rare or absent elsewhere. This lack of sampling in eastern Africa makes itdifficult to infer relationships among mtDNA haplogroups or to examine events that occurred early in human history. Wesequenced 62 complete mtDNA genomes of ethnically diverse Tanzanians, southern African Khoisan speakers, andBakola Pygmies and compared them with a global pool of 226 mtDNA genomes. From these, we infer phylogeneticrelationships amongst mtDNA haplogroups and estimate the time to most recent common ancestor (TMRCA) for hap-logroup lineages. These data suggest that Tanzanians have high genetic diversity and possess ancient mtDNA haplogroups,some of which are either rare (L0d and L5) or absent (L0f) in other regions of Africa. We propose that a large and diversehuman population has persisted in eastern Africa and that eastern Africa may have been an ancient source of dispersion ofmodern humans both within and outside of Africa.
Introduction
Genetic analysis of mitochondrial (mt) DNA has beenan important tool in understanding human evolution due tocharacteristics of mtDNA, such as high copy number, lackof recombination, high substitution rate, and a maternalmode of inheritance (Ballard and Whitlock 2004). How-ever, most studies of human evolution that have includedmtDNA sequences have been confined to the d-loop, whichoccupies less than 7% of the mtDNA genome (e.g., Cannet al. 1987; Vigilant et al. 1991; Chen et al. 1995; Watsonet al. 1996; Quintana-Murci et al. 1999; Wallace et al. 1999;Chen et al. 2000; Jorde et al. 2000; Salas et al. 2002; Kivisildet al. 2004; Salas et al. 2004). Inferences drawn from thed-loop alone can be problematic given that the d-loopmutates rapidly and is subject to saturation due to excessivehomoplasy (Tamura and Nei 1993; Bandelt et al. 2006).Mutations are not randomly distributed across the lengthof the locus, making rate heterogeneity another important is-sue in calculating divergence date estimates (Excoffier andYang 1999; Meyer et al. 1999; Bandelt et al. 2006). In addi-tion, several equally likely gene trees can often be inferredfrom d-loop sequences, particularly when large numbersof samples are analyzed (Maddison et al. 1992; Ballardand Whitlock 2004).
Comprehensive studies of the human mtDNA genomehave been carried out by analyzing single nucleotide poly-morphisms (SNPs) determined by restriction fragmentlength polymorphism (RFLP) analysis and sequences ofthe first hypervariable region of the d-loop (Chen et al.1995, 2000; Salas et al. 2002, 2004). These studies have dem-onstrated that human mtDNA is geographically structuredand may be classified into groups of related haplotypes(i.e, haplogroups) (Chen et al. 1995; Wallace et al. 1999).
Only 2 mtDNA macrohaplogroups (M and N) and theirderivatives persisted in non-Africans after the migrationof modern humans out of Africa. Macrohaplogroup L isgeographically limited to sub-Saharan Africa and has beendivided into haplogroups L0–L6 (Mishmar et al. 2003; Salaset al. 2004; Kivisild, Metspalu, et al. 2006). The phylogenyofmacrohaplogroup L is largely based on d-loop sequence andRFLPanalysis and is, therefore,notwell resolved (fig.1AandB) particularly at basal tree nodes (Kivisild, Metspalu, et al.2006). In particular, African mtDNAs that belong to L0 andL1 fall into several distinctive subhaplogroups, but their his-tory is complex and poorly understood (Pereira et al. 2001;Kivisild, Metspalu, et al. 2006).
Haplogroup L0 is divided into subhaplogroupsL0a, L0d, L0f, and L0k (Salas et al. 2002; Mishmar et al.2003; Salas et al. 2004; Kivisild, Metspalu, et al. 2006)(fig. 1). Based on their geographic distribution throughoutAfrica (fig. 1C), Salas et al. (2002, 2004) suggested the fol-lowing scenario about the origin and diversification ofsubhaplogroups belonging to L0 and L1. L0a probably orig-inated ineastern Africaand is common in eastern, central, andsoutheasternAfrica,but isalmostabsent innorthern,western,and southern Africa (Salas et al. 2002). L0d is found almostexclusively among southern African Khoisan (SAK) speak-ers (Salas et al. 2002). There is only a single L0d haplotypefrom a Turkana of Kenya (Watson et al. 1997), as well as afew L0d haplotypes from Mozambique, which may havearisen by recent gene flow with the SAK (Pereira et al.2001). Similarly, L0k is found exclusively among theSAK (Salas et al. 2002). However, the phylogenetic relation-shipofL0dandL0kisuncertain(Watsonetal.1997;Kivisild,Metspalu, et al. 2006). L0f is rare and appears to be geograph-ically confined to east Africa (Salas et al. 2002). HaplogroupL1 is composed of L1b and L1c (fig. 1C). L1b is concentratedin western Africa, but it also occurs in central and northernAfrica (Watson et al. 1997; Rosa et al. 2004). L1c occurs fre-quentlyamong centralAfrican Bantuspeakers (Vigilant et al.1991; Destro-Bisol et al. 2004) and probably originatedamong peoples near the Atlantic coast in western equatorial
Key words: genetics, mtDNA genomes, Africa, mtDNA haplogroups,Homo sapiens, Tanzania, Khoisan speakers.
E-mail: [email protected].
Mol. Biol. Evol. 24(3):757–768. 2007doi:10.1093/molbev/msl209Advance Access publication December 28, 2006
� The Author 2006. Published by Oxford University Press on behalf ofthe Society for Molecular Biology and Evolution. All rights reserved.For permissions, please e-mail: [email protected]
at Pendlebury Library of M
usic on January 4, 2013http://m
be.oxfordjournals.org/D
ownloaded from

Africa (Salas et al. 2002, 2004). Both L1b and L1c are nearlyabsent in eastern and southern Africa. Haplogroup L5 (Kivi-sild et al. 2004) (previously referred to as L1e [Pereira et al.2001]) has been observed at low frequency only in easternAfrica (Salas et al. 2002), Egypt (Stevanovitch et al.2004), and among the Mbuti Pygmies (Kivisild, Shen,et al. 2006).
A global sample of complete mtDNA genome se-quences has become publicly available making it possibleto more precisely make phylogenetic inferences and calcu-
late divergence dates for these mtDNA haplogroups(Ingman et al. 2000; Torroni et al. 2001; Ingman andGyllensten 2003; Mishmar et al. 2004; Ruiz-Pesini et al.2004; Macaulay et al. 2005; Thangaraj et al. 2005; Kivisild,Metspalu, et al. 2006; Kivisild, Shen, et al. 2006). How-ever, these previous analyses have included few samplesrepresenting many of the African mtDNA subhaplogroups(L0a, L0d, L0f, L0k, L1b, L1c, and L5), particularly frompeople residing in eastern Africa. East African populationsmay provide important clues toward understanding modern
FIG. 1.—Evolutionary history of mtDNA haplogroup structure in African populations inferred from mtDNA d-loop and RFLP analysis. (A) Relation-ships among different mtDNA haplogroup lineages inferred from mtDNA d-loop sequences and mtDNA coding region SNPs from previous studies(Kivisild, Metspalu, et al. 2006). Dashed lines indicate previously unresolved relationships. (B) Relative frequencies of haplogroups L0, L1, L5,L2, L3, M, and N in different regions of Africa from mtDNA d-loop and mtDNA coding region SNPs from previous studies. (C) Relative frequenciesof haplogroups L0, L1, and L5 subhaplogroups (excluding L2 and L3) in different regions of Africa from mtDNA d-loop and mtDNA coding region SNPsfrom previous studies. Haplogroup frequencies from previously published studies include East Africans (Ethiopia [Rosa et al. 2004], Kenya and Sudan[Watson et al. 1997; Rosa et al. 2004]), Mozambique (Pereira et al. 2001; Salas et al. 2002), Hadza (Vigilant et al. 1991), and Sukuma (Knight et al. 2003);South Africans (Botswana !Kung [Vigilant et al. 1991]); Central Africans (Mbenzele Pygmies [Destro-Bisol et al. 2004], Biaka Pygmies [Vigilant et al.1991], and Mbuti Pygmies [Vigilant et al. 1991]); West Africans (Niger, Nigeria [Vigilant et al. 1991; Watson et al. 1997]; and Guinea [Rosa et al. 2004]).L1*, L2*, and L3* from previous studies indicate samples that were not further subdivided into subhaplogroups.
758 Gonder et al.
at Pendlebury Library of M
usic on January 4, 2013http://m
be.oxfordjournals.org/D
ownloaded from

human origins. Both paleobiological and archeological dataindicate that modern humans may have originated in easternAfrica (McBrearty and Brooks 2000; White et al. 2003),perhaps as early as 196,000 years ago (kya) (McDougallet al. 2005). In addition, the earliest migrations of modernhumans out of Africa are thought to have originated fromeastern Africa (Tishkoff et al. 1996; Quintana-Murci et al.1999; Kivisild et al. 2004). Despite the paleobiological ev-idence that modern humans originated in eastern Africa,previous genetic studies have observed that L0k andL0d, which are found primarily among the SAK, occurat the root of the human mtDNA gene tree (Chen et al.1995; Ingman et al. 2000; Mishmar et al. 2003; Ruiz-Pesiniet al. 2004; Kivisild, Metspalu, et al. 2006). However, thepresence of click-speaking populations in Tanzania (theHadza and Sandawe) as well as Y chromosome data fromthe Hadza (Knight et al. 2003), Ethiopian, and Sudanesepopulations (Underhill et al. 2000, 2001; Cruciani et al.2002; Semino et al. 2002) indicate that the SAK may haveoriginated in eastern Africa, although the divergence be-tween populations from these regions was quite ancient.Until now, no genetic data existed for the Sandawe.
In this study, we compare several complete mtDNAgenomes of Tanzanians with a global panel of mtDNA ge-nomes to clarify the evolutionary history of the AfricanmtDNA haplogroups and to better characterize the role thatpopulations in East Africa played in the origin and dispersalof modern humans across Africa. Generally, Tanzaniansappear to have a high level of mtDNA genome diversitythat is distributed among several mtDNA haplogroups thatoriginated at different times in modern human history. Thesedata suggest that populations in Tanzania have played animportant and persistent role in the origin and diversifica-tion of modern humans.
Materials and MethodsSample Collection
All Tanzanian samples were obtained from bloodsamples collected with informed consent and InstitutionalReview Board approval. The Ju-speaking !Xun (alsoknown as Vasekela) and Khoe-speaking Khwe sampleswere collected from individuals in the area of Schmidtsdriftin the northwest Cape of South Africa and were provided byDr M. Kotze. We obtained additional SAK samples fromthe Human Genome Diversity Panel–Centre d’Etude duPolymorphisme Humain (HGDP–CEPH). We selectedsamples for this study in 3 ways. First, we chose a sampleof Tanzanians from 5 linguistically and culturally diverseethnic groups (language classification is listed within paren-theses): Sandawe (Khoisan), Hadza (Khoisan), Burunge(Afro-Asiatic), Maasai (Nilo-Saharan), and Turu (Niger-Kordofanian). Samples were chosen to represent therelative frequencies of the mtDNA L2, L3, M, and N hap-logroups present in a much larger sample of d-loop sequen-ces and mtDNA SNP data collected from over 700Tanzanians (Gonder MK, Mortensen H, Reed F, TishkoffSA, unpublished data). Second, we sequenced a subset of25 Tanzanian samples to represent the most ancient mtDNAL0, L1, and L5 haplogroups (L0a, L0d, L0f, L1c, and L5).Third, we sequenced 10 samples from the SAK, 9 of which
belong to mtDNA haplogroups L0d (n 5 7) and L0k (n 52). Finally, we sequenced the mtDNA genomes of 4 Bakolapygmies to expand our sample size of haplogroup L1c.All samples were combined for analysis with a global dataset of 254 human sequences obtained from mtDB—HumanMitochondrial Genome Database (http://www.genpat.uu.se/mtDB/) and from GenBank. Complete mtDNA genome se-quences of a chimpanzee (Pan troglodytes) and a gorilla wereused as outgroups to the human mtDNA genomes for phylo-genetic analyses (GenBank accession numbers D38113 andX93347).
Sequencing
We amplified mtDNA genome sequences in two 8.5 ki-lobase (kb) using overlapping fragments, a touchdown poly-merase chain reaction (PCR) protocol (Don et al. 1991) andhigh-fidelity Platinum Taq polymerase following the manu-facturer’s protocol (Invitrogen Corporation, Carlsbad, CA).Sequencing was done using Big Dye Ready Reactions Kitsusing protocols specified by the manufacturer (Applied Bio-systems, Inc., Foster City, CA). We processed 48 sequencingreactions using an ABI 3100 Genetic Analyzer for each in-dividual, resulting in complete upstream and downstreammtDNA genome sequences (Rieder et al. 1998). PCR andsequencing primer sequences are given in table S1 (Supple-mentary Material online). We assembled sequences using Se-quencher 4.1 (GeneCodes Corporation, Ann Arbor, MI) andannotated them according to the Cambridge Reference Se-quence (Andrews et al. 1999). We prepared the mtDNA se-quences for phylogenetic analysis in ClustalX (Thompsonet al. 1997) by aligning them to the mtDNA genome se-quences from mtDB Web site. We improved the resultingalignment by visual inspection in MacClade version 4.05(Maddison WP and Maddison DR 2000).
Statistical Tests of Genetic Diversity and Neutrality
Because the d-loop is prone to problems with homo-plasy and has been shown to produce unreliable gene trees(Maddison et al. 1992; Ballard and Whitlock 2004), weexcluded the d-loop from all analyses shown in this study(except fig. S1, Supplementary Material online). We in-cluded sites corresponding to basepairs 577–16,023 of theCambridge Reference Sequence (Andrews et al. 1999) inour analysis. We calculated the following summary statisticsusing DnaSP version 3.99 (Rozas et al. 2003): numbersof sequences (n), segregating sites (S), nucleotide diversity(p), and average number of nucleotide differences (k) for var-ious subsets of the mtDNA genome sequences (Rozas et al.2003). We also tested for deviations from expectations ofneutrality, including Tajima’s D, D* of Fu and Li, and F*of Fu and Li using DnaSP.
Phylogenetic Analyses
We determined optimal models of nucleotide sequenceevolution by log likelihood ratio tests (Huelsenbeck andCrandall 1997) as implemented by PAUP* version 4.0b10(Swofford 2002). We calculated a distance matrix andNeighbor-Joining (NJ) tree for the 324 samples using theHKY85 substitution model, with gamma-distributed rates
Analysis of Ancient African mtDNA Lineages 759
at Pendlebury Library of M
usic on January 4, 2013http://m
be.oxfordjournals.org/D
ownloaded from

and 32 discrete nucleotide substitution rate categories. Wesubjected the resulting tree to 100,000 bootstrap replicateswith resampling to provide statistical support for the basalbranches of the mtDNA gene tree.
In order to better resolve the phylogenetic relation-ships of the African mtDNA lineages, we also analyzeda subset of the original data set using Bayesian analysis.Due to computational limitations, this data set includedall mtDNA genome sequences from sub-Saharan Africans(n 5 89), African representatives of the M and N hap-logroups (n 5 5), and a geographically diverse sampleof mtDNAs of non-Africans derived from haplogroupsM and N (n 5 18). We completed phylogenetic analysesof this smaller data set in MrBayes 3.1 (Ronquist andHuelsenbeck 2003) using the optimal model of sequenceevolution determined in PAUP* (i.e., HKY85). In MrBayes,we ran 4 chains simultaneously for one million genera-tions until the standard deviation (SD) of split frequencieswas less than 0.01 under the HKY85 model with gamma-distributed rates and 16 rate categories.
Time to Most Recent Common Ancestor
We tested for nucleotide substitution rate heterogene-ity for each gene tree using a likelihood ratio test (�2lnK)comparing constrained (molecular clock enforced) versusunconstrained (no clock) trees (Huelsenbeck and Crandall1997). Because we found significant rate heterogeneity inthe NJ and Bayesian trees, we estimated divergence timesfor the mtDNA haplogroup clades using a penalized likeli-hood (PL) model as implemented in the program r8s 1.07(Sanderson 1997, 2002, 2003) using the optimal smoo-thing value (S 5 320) obtained by a cross-validationprocedure in R8s.
We estimated confidence intervals (CIs) for each treenode using a 100 replicate bootstrap resampling procedure(Baldwin and Sanderson 1998) that was implemented byPerl scripts in the r8s-bootkit provided by Torsten Erikssonat http://www.bergianska.se/index_forskning_soft.html. Wegenerated 100 bootstrap replicate data sets from the treeobtained from MrBayes v. 3.1 using SEQBOOT in PHY-LIP (Felenstein 1993). In order to determine the 95% CI, weused a log likelihood decline of 2.0 units, which is roughlyequivalent to 2 SDs (Sanderson and Doyle 2001). We con-ducted all analyses using a discrete approximation of agamma distribution to accommodate for among-site rateheterogeneity. We calibrated our time to most recent com-mon ancestor (TMRCA) estimates by assuming that the
Pan and Homo lineages had separated from each other com-pletely by 6 MYA (Kumar et al. 2005; Patterson et al. 2006)and added 500 ky for lineage sorting (Macaulay et al. 2005).
Median-Joining Network Analysis
Networks of L0/L1 mtDNA genome haplogroupswere constructed using Network 4.1.1.1 (Fluxus Technol-ogy Ltd., 2004 [Bandelt et al. 1999]) in order to providea detailed analysis of nucleotide substitutions along branches.We prepared sequences for analysis in MacClade 4.06 OSX. We excluded all invariant nucleotide positions in ourL0/L1 alignment. We found 486 variable sites in the cod-ing region, which spanned basepairs 593–16,077 of theCambridge Reference Sequence (Andrews et al. 1999).These 486 variable sites were each assigned equal weightin the analyses (for contrasting method see Finnila et al.2001). Additionally, we constructed a median-joining(MJ) network including P. troglodytes as an outgroup (Gen-BankaccessionnumberD38113).AlthoughNetwork4.1.1.1is not intended for interspecies comparison, the chimpanzeewas included to root the network and to unambiguously inferbranching patterns at the base of the human mtDNA networkfor comparisons to our phylogenetic analyses.
Results
We sequenced a total of 62 African complete mtDNAgenomes for this study that have been assigned GenBankaccession numbers EF184580–EF184641. These mtDNAgenomes were from individuals belonging to several eth-nic groups in Tanzania (n 5 49), click-speaking !Xun andKhwe populations from South Africa (n5 10), and BakolaPygmies from Cameroon (n 5 4). These samples were se-lected in order to fully represent L0a, L0d, L0f, L0k, L1c,L5, L2, L3, M, and N haplogroup lineages (table S2, Sup-plementary Material online). These newly sequenced Afri-can mtDNA genomes were aligned and compared with aglobal assortment of 254 mtDNA genomes of peoples ofdiverse geographic origin. Table S3 (Supplementary Mate-rial online) lists the GenBank accession number, samplingprovenance, and major geographic region for these 254mtDNAs. Diversity statistics are given in table 1. The ge-netic diversity present in this sample was broadly consistentwith previous studies (Ingman et al. 2000; Ruiz-Pesini et al.2004). The amount of mtDNA sequence diversity (p) amongAfricans (3.92 3 10�3) and Tanzanians (3.80 3 10�3) wasmore than twice that among non-Africans (1.81 3 10�3).However, the level of variation in Africa may be artificially
Table 1Summary Statistics and Neutrality Tests of mtDNA Genomes (excluding the d-loop)
na Sb p 3 10�3c kd Tajima’s D D* of Fu and Li F* of Fu and Li
Global 320 1,545 2.69 41.4 �2.60* �7.74** �5.82**African 94 758 3.92 60.3 �2.05* �3.97** �3.75**Non-African 226 1,086 1.81 27.9 �2.71*** �7.81** �6.15**Tanzanian 49 483 3.80 58.5 �1.70 �2.55* �2.66*
a Numbers of sequences.b Segregating sites.c Nucleotide diversity.d Average number of nucleotide differences (k) for mtDNA genomes that correspond to basepairs 577–16,023 of the Cambridge Reference Sequence.
*P , 0.05; **P , 0.02; ***P , 0.001.
760 Gonder et al.
at Pendlebury Library of M
usic on January 4, 2013http://m
be.oxfordjournals.org/D
ownloaded from

elevated to some extent by the selection of genomes for se-quencing that would maximize haplogroup representation.
We detected significant departures from neutrality ex-pectations (table 1), as measured by Tajima’s D, in theglobal data set and the pooled African and non-African datasets, but not in Tanzanians. D* and F* statistics of Fu and Lirevealed significant departures from neutrality in all popu-lations. We also tested all mtDNAs belonging to subsets ofhaplogroups L0 and L1 for deviations from neutrality ex-pectations (results not shown). None of these subsets sig-nificantly deviated from neutrality expectations, except formtDNAs belonging to L5 (Tajima’s D 5 �1.29, P ,0.001; D* of Fu and Li 5 �1.26, P , 0.05; F* of Fuand Li 5�1.37, P, 0.05). Other studies of whole-mtDNAgenome diversity in Africa did not report significant devia-tions from neutrality expectations (Ingman et al. 2000;Mishmar et al. 2003; Ruiz-Pesini et al. 2004), with the ex-ceptions of Torroni et al. (2001) and Kivisild, Shen, et al.(2006). We speculate that these departures from neutralityexpectations may be attributed to several potential factorsincluding our larger sample of African mtDNAs comparedwith previous studies, artifacts of sampling from structuredpopulations (resulting in an excess of rare variants) (Ptakand Przeworski 2002; Hammer et al. 2004; Kivisild, Shen,et al. 2006), population expansion events, and/or an ancientselective sweep in African mtDNAs (Simonsen et al. 1995).
Due to the high frequency of homoplasy in themtDNA d-loop, we compared the topology of an NJ treereconstructed from the complete mtDNA sequences ofthe 322 samples (fig. S1, Supplementary Material online)with a tree reconstructed using the mtDNA sequences ex-cluding the d-loop (fig. 2). The topologies of the 2 trees weresimilar, but the basal branches of the complete mtDNAsequences had lower bootstrap values. In contrast, the NJtree of the mtDNA genomes that excluded the d-loophad higher statistical support for the basal branches sepa-rating the haplogroups (L0, L1, L5, L2, L3, M, and N), withbootstrap values ranging from 61% to 91%.
There are several notable characteristics of the NJ treeshown in figure 2. First, the L0/L5/L1/L2/L3 haplogroupsare African specific, as previously reported (Ingman et al.2000; Mishmar et al. 2003; Ruiz-Pesini et al. 2004;Kivisild, Shen, et al. 2006). Haplogroup L0 forms the basallineage of the human mtDNA gene tree followed by L1, L5,L2, L3, M, N, and the derivatives of haplogroups M and N.Unlike previous studies that report L0k as the most basalhaplogroup of the human mtDNA gene tree (Ingmanet al. 2000; Mishmar et al. 2003; Ruiz-Pesini et al. 2004),our data suggest that L0d forms the basal lineage of thehuman mtDNA gene tree (which has also been observedin a recent study of African mtDNA genome diversity[Kivisild, Shen, et al. 2006]). L0d is further subdivided into2 reciprocally monophyletic clades: one clade composed ofSAK and one clade composed of Tanzanians (all of whomare Sandawe, except for one neighboring Burunge). Fur-ther, our analysis shows that L0k forms a clade with L0fand L0a, suggesting independent origins of L0d and L0klineages. L1b, L1c, and L5 form a monophyletic clade,as do all L2 mtDNAs and all L3 lineages. These L3 mtDNAsequences all belong to Africans, with the exception of 2mtDNA genomes sampled from the Middle East, suggest-
ing some recent migration from Africa to the Middle East.mtDNAs belonging to haplogroups M and N form 2 mono-phyletic clades (fig. 2A). These 2 M and N haplogroup cladesincluded a few Tanzanians (belonging to haplogroups M1,M, N1, and J), suggesting possible recent gene flow backinto Africa and/or that ancestors of the Tanzanian popula-tions may have been a source of migration of modern hu-mans from Africa to other regions (fig. 2B).
In order to better resolve the evolutionary historyof the most ancient mtDNA haplogroup lineages usingBayesian maximum likelihood analyses, we next analyzeda smaller data set composed of all mtDNA genomesof peoplefrom sub-Saharan Africa and a subset of the samples ob-tained from GenBank. The subset of samples included aglobal panel representing all of the major non-African hap-logroup lineages. The Bayesian tree is shown in figure 3.The overall tree topologies of the Bayesian tree and NJ treewere similar. Clade credibility scores, which are a measureof the posterior probability of the tree branching structure,ranged from 73% to 100%. MtDNAs of Africans belongingto haplogroups L0 and L1 form the most basal lineages ofthe human mtDNA gene tree. Within L0, L0d forms themost basal branch of the tree and also contains 2 recipro-cally monophyletic clades composed of Tanzanians andSAK, respectively. L0k forms a clade with L0f and L0a,providing additional support of independent origins ofthe Khoisan-specific L0d and L0k haplogroup lineages.L1b and L1c form a clade that does not include L5. In con-trast to the NJ trees (fig. 2 and fig. S1, SupplementaryMaterial online), L5 occupies an intermediate phylogeneticposition between L1 and L2, as has been previously re-ported (Shen et al. 2004).
Using a log likelihood test (Huelsenbeck and Crandall1997), we found significant substitution rate heterogeneityin our phylogenetic analyses for the complete sample ofmtDNA genomes (n 5 320; �2lnK 5 750.9, v2 df 5318, P , 0.05, 100 permutations) and for the smaller dataset (n 5 114; �2lnK5 349.5, v2 df 5 112, P, 0.05, 100permutations). Simulations have shown that it is difficult toroot a phylogeny precisely when the outgroup is very dis-tant relative to the ingroup, as is the case in the present study(Penny et al. 1995; Sanderson and Shaffer 2002). This dif-ficulty could potentially explain the substitution rate hetero-geneity observed in our data set. Reanalysis of the data setusing a conservative midpoint root verified that the substi-tution rates in our data were heterogeneous for the completeset of mtDNA genomes (n5 319;�2lnK5 433.94, v2 df5317, P , 0.05, 100 permutations) and for the smaller dataset (n 5 113; �2lnK 5 150.41, v2 df 5 111, P , 0.05,100 permutations).
Subsequent to our discovery that these data do not fol-low a clock-like model, we applied a PL algorithm to ac-count for substitution rate heterogeneity among the mtDNAhaplogroup clades to calculate TMRCAs for various nodesin the gene tree shown in figure 3. Table 2 lists theseTMRCA dates and their 95% CIs. Our TMRCA estimatefor the global mtDNA genome tree is 194.3 6 32.55 kya,which is very close to the age of the earliest modern humansestimated from fossil data (McDougall et al. 2005) as well assome early studies of mtDNA diversity (e.g., Vigilant et al.1991; Horai et al. 1995 [when corrected for a Pan/Homo
Analysis of Ancient African mtDNA Lineages 761
at Pendlebury Library of M
usic on January 4, 2013http://m
be.oxfordjournals.org/D
ownloaded from

FIG. 2.—NJ trees based on mtDNA genomes (excluding the d-loop). (A) Samples are colored according to their haplogroup membership. (B) Samplesare colored according to their geographic origin (sub-Saharan Africa, North Africa/Middle East/Eurasia, Asia [northern, central, and eastern], SoutheastAsia/Oceania, and Americas). Samples from AF381984 (Morroco) and AF381996 (Jordan) that belong to African L3 haplogroups indicated by ‘‘1.’’Samples of Tanzanians belonging to haplogroup M are indicated by ‘‘*.’’ Samples of Tanzanians belonging to haplogroup N are indicated by ‘‘**.’’
762 Gonder et al.
at Pendlebury Library of M
usic on January 4, 2013http://m
be.oxfordjournals.org/D
ownloaded from

FIG. 3.—Phylogenetic tree of mtDNA genomes (excluding the d-loop) obtained by maximum likelihood Bayesian analysis.
Analysis of Ancient African mtDNA Lineages 763
at Pendlebury Library of M
usic on January 4, 2013http://m
be.oxfordjournals.org/D
ownloaded from
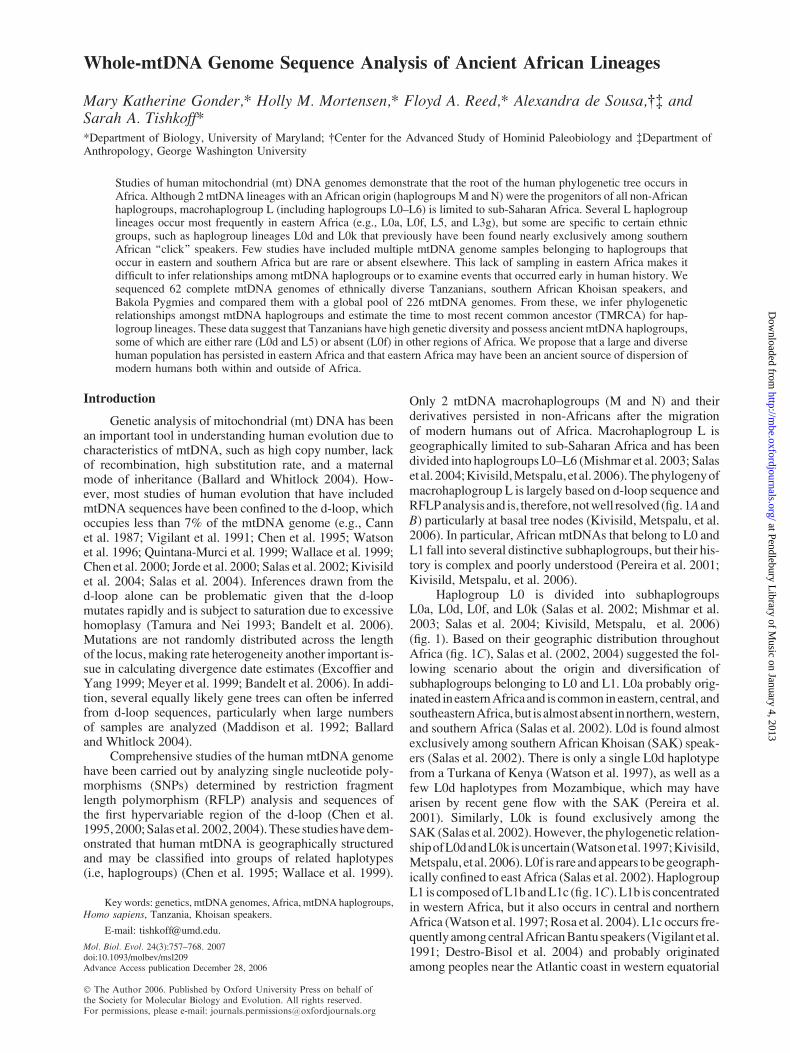
split 6.5 MYA]). We also observe an origin of L0 (146.4 625.1 kya) and L1 (140.4 6 33 kya), slightly more recentthan the appearance of modern humans based on the pale-ontological record (Clark et al. 2003; White et al. 2003;McDougall et al. 2005). The L0d mtDNAs have a TMRCAof 106 6 20.2 kya. The TMRCA of mtDNAs of the SAKbelonging to L0d is 90.4 6 18.9 kya, whereas the TMRCAof L0d mtDNAs belonging to Tanzanians is more recent(30.6 6 17.8 kya). The TMRCA of L0k, L0f, and L0ais 139.8 6 24.6 kya. The TMRCA of the SAK L0k is70.9 6 19.7 kya. The TMRCA of L0f, which is observedonly in eastern Africa, indicates that it is a relatively oldlineage (94.9 6 9.4 kya). The TMRCA of L0a (54.6 65.7 kya) is more recent than the TMRCA of L0f, eventhough these mtDNA samples originate from diverse re-gions in Africa. We attribute the relatively old TMRCA(and highly negative Tajima’s D) of L5 (129.4 6 22.1kya) to the divergent sequence of the L5 mtDNA from a sin-gle Tanzanian Mbugwe individual compared with the threeL5 mtDNAs from the Tanzanian Sandawe that differedfrom each other by very few basepairs. The TMRCAs ofL2 and L3 are more recent (96.7 6 10.7 kya) comparedwith those of L0, L1, and L5. The age of the youngest nodecontaining both African and non-African sequences (nodeS) is 94.3 6 9.9 kya and represents an upper bound timeestimate for an exodus out of Africa.
Phylogenetic analyses of mtDNA that assume a strictbifurcating tree topology may not be well suited to the studyof human mtDNA (Bandelt et al. 1999). Confounding phe-nomena, such as homoplasy and multifurcations (‘‘star’’phylogenies), have commonly been observed in studiesof human mtDNA gene genealogies (Posada and Crandall2001). Therefore, we complemented our phylogenetic anal-yses by also constructing mtDNA gene genealogies (fig. S2,Supplementary Material online) using a MJ network ap-proach. Generally, the results of our network analysis wereconsistent with haplogroup designations based on d-loopsequences and SNP analysis reported in other studies (Salas
et al. 2002, 2004; Kivisild et al. 2004). Using the networkanalysis, we investigated the substitutions in the mtDNAcoding region that occur along main branches of the net-work (fig. 4). Additional substitutions that occur alongthe terminal branches of the network are given in figuresS3 and S4 (Supplementary Material online). The mainbranches of the L0/L1 network are well supported by sev-eral substitutions across the mtDNA genome. Note thatL0d, L0f, L0k, and L1c haplogroups contain highly diver-gent lineages that are separated by several substitutions. Incontrast, the L0a haplogroup was characterized by severalshort branches, despite the fact that these mtDNAs comefrom a wide variety of African populations. We speculatethat the wide geographic distribution and short branches ofL0a result from recent population growth and/or a recentexpansion of L0a and could perhaps reflect the expansionof Bantu-speaking peoples into eastern Africa within thepast few thousand years (Salas et al. 2002).
Discussion
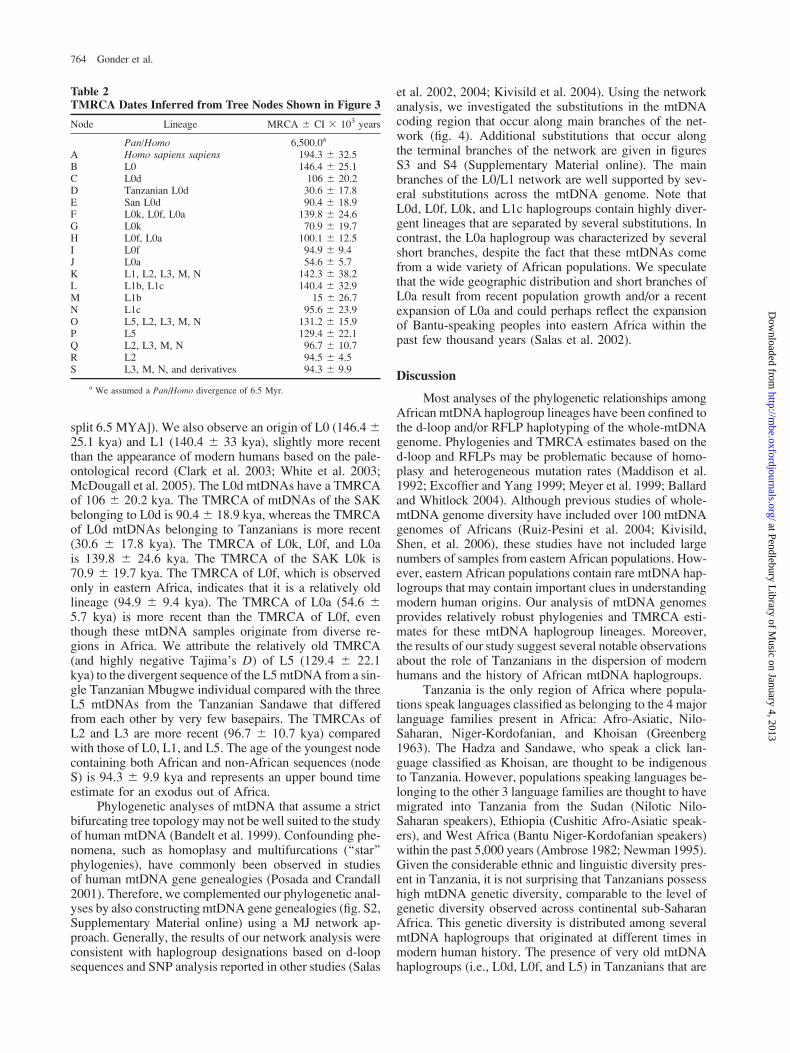
Most analyses of the phylogenetic relationships amongAfrican mtDNA haplogroup lineages have been confined tothe d-loop and/or RFLP haplotyping of the whole-mtDNAgenome. Phylogenies and TMRCA estimates based on thed-loop and RFLPs may be problematic because of homo-plasy and heterogeneous mutation rates (Maddison et al.1992; Excoffier and Yang 1999; Meyer et al. 1999; Ballardand Whitlock 2004). Although previous studies of whole-mtDNA genome diversity have included over 100 mtDNAgenomes of Africans (Ruiz-Pesini et al. 2004; Kivisild,Shen, et al. 2006), these studies have not included largenumbers of samples from eastern African populations. How-ever, eastern African populations contain rare mtDNA hap-logroups that may contain important clues in understandingmodern human origins. Our analysis of mtDNA genomesprovides relatively robust phylogenies and TMRCA esti-mates for these mtDNA haplogroup lineages. Moreover,the results of our study suggest several notable observationsabout the role of Tanzanians in the dispersion of modernhumans and the history of African mtDNA haplogroups.
Tanzania is the only region of Africa where popula-tions speak languages classified as belonging to the 4 majorlanguage families present in Africa: Afro-Asiatic, Nilo-Saharan, Niger-Kordofanian, and Khoisan (Greenberg1963). The Hadza and Sandawe, who speak a click lan-guage classified as Khoisan, are thought to be indigenousto Tanzania. However, populations speaking languages be-longing to the other 3 language families are thought to havemigrated into Tanzania from the Sudan (Nilotic Nilo-Saharan speakers), Ethiopia (Cushitic Afro-Asiatic speak-ers), and West Africa (Bantu Niger-Kordofanian speakers)within the past 5,000 years (Ambrose 1982; Newman 1995).Given the considerable ethnic and linguistic diversity pres-ent in Tanzania, it is not surprising that Tanzanians possesshigh mtDNA genetic diversity, comparable to the level ofgenetic diversity observed across continental sub-SaharanAfrica. This genetic diversity is distributed among severalmtDNA haplogroups that originated at different times inmodern human history. The presence of very old mtDNAhaplogroups (i.e., L0d, L0f, and L5) in Tanzanians that are
Table 2TMRCA Dates Inferred from Tree Nodes Shown in Figure 3
Node Lineage MRCA 6 CI 3 103 years
Pan/Homo 6,500.0a
A Homo sapiens sapiens 194.3 6 32.5B L0 146.4 6 25.1C L0d 106 6 20.2D Tanzanian L0d 30.6 6 17.8E San L0d 90.4 6 18.9F L0k, L0f, L0a 139.8 6 24.6G L0k 70.9 6 19.7H L0f, L0a 100.1 6 12.5I L0f 94.9 6 9.4J L0a 54.6 6 5.7K L1, L2, L3, M, N 142.3 6 38.2L L1b, L1c 140.4 6 32.9M L1b 15 6 26.7N L1c 95.6 6 23.9O L5, L2, L3, M, N 131.2 6 15.9P L5 129.4 6 22.1Q L2, L3, M, N 96.7 6 10.7R L2 94.5 6 4.5S L3, M, N, and derivatives 94.3 6 9.9
a We assumed a Pan/Homo divergence of 6.5 Myr.
764 Gonder et al.
at Pendlebury Library of M
usic on January 4, 2013http://m
be.oxfordjournals.org/D
ownloaded from
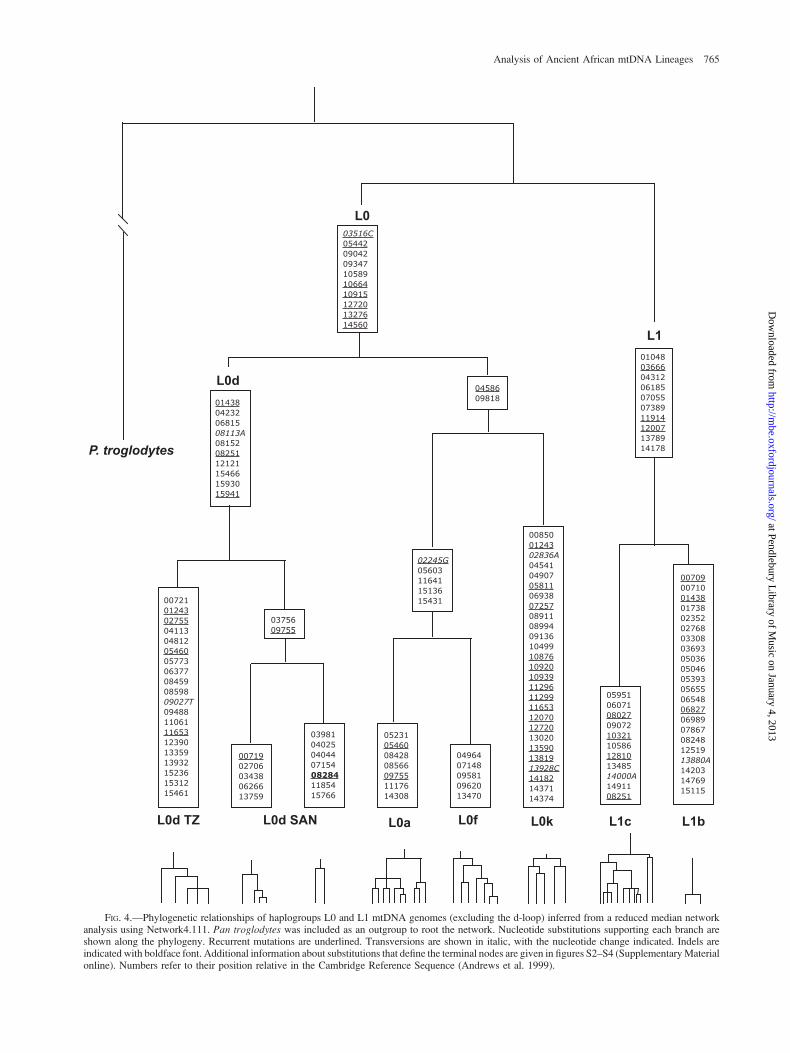
FIG. 4.—Phylogenetic relationships of haplogroups L0 and L1 mtDNA genomes (excluding the d-loop) inferred from a reduced median networkanalysis using Network4.111. Pan troglodytes was included as an outgroup to root the network. Nucleotide substitutions supporting each branch areshown along the phylogeny. Recurrent mutations are underlined. Transversions are shown in italic, with the nucleotide change indicated. Indels areindicated with boldface font. Additional information about substitutions that define the terminal nodes are given in figures S2–S4 (Supplementary Materialonline). Numbers refer to their position relative in the Cambridge Reference Sequence (Andrews et al. 1999).
Analysis of Ancient African mtDNA Lineages 765
at Pendlebury Library of M
usic on January 4, 2013http://m
be.oxfordjournals.org/D
ownloaded from

rare or absent in other regions of Africa suggests popula-tions in Tanzania may have had a large long-term effectivepopulation size and/or a large degree of long-term popula-tion structure, which has acted to preserve many divergentand rare mtDNA haplogroup lineages that appeared early inmodern human history. The presence of these ancient lin-eages in Tanzania also suggests that eastern Africa might bethe source of origin of many other African mtDNA hap-logroup lineages. Our findings are consistent with otherstudies of mtDNA genetic diversity in African populationsthat have suggested populations in eastern Africa form ahighly diverse gene pool (Watson et al. 1997; Chen et al.2000; Watson and Penny 2003; Kivisild et al. 2004). In ad-dition, the TMRCA of mtDNA haplogroup lineages L3, M,and N and their derivatives (94.3 6 9.9 kya) is approxi-mately half of the TMRCA of all modern humans (194.36 32.55 kya), which supports models predicting that therewas a significant period of time in which modern humanslived exclusively in Africa prior to the exodus of modernhumans to other regions of the world (Penny et al.1995). These observations are consistent with paleobiolog-ical and archeological data suggesting that eastern Africamay have been an ancient source of dispersion both withinand outside of Africa. The earliest remains of transitionalmodern humans, dated as early as 196 kya, have been foundin Ethiopia (Clark et al. 2003; White et al. 2003; McDougallet al. 2005). The earliest artifacts associated with modernhumans are also found in eastern Africa (Foley 1998).Later, Stone Age technology was established in severalregions well before 40 kya in eastern Africa but not until22 kya in southern Africa (Lahr and Foley 1994; Lahr1996; Foley 1998).
Further, the reciprocally monophyletic phylogeneticrelationship of L0d lineages in the Sandawe and theSAK at the root of the human mtDNA gene tree, indicatesan ancient, but unique, genetic connection between thesepopulations (Tishkoff SA and Mountain JL, unpublisheddata). The oldest L0d lineages are observed in the SAK,but it is possible that the ancestral Khoisan population(s)originated in east Africa and subsequently migrated intosouthern Africa, and that ancient lineages have been lostin the Tanzanian Hadza and Sandawe populations due togenetic drift (Tishkoff SA and Mountain JL, unpublisheddata). These observations are consistent with both linguis-tic data indicating similarities between the Sandawe andSAK languages (Ruhlen 1991; Ehret 2000; Traunmuller2003) as well as shared subsistence patterns (until recently,the Sandawe maintained a hunter–gatherer lifestyle). Ourfindings are also consistent with patterns of variation inthe Y chromosome suggesting an ancient genetic connec-tion between SAK and several East African populations(Cruciani et al. 2002; Semino et al. 2002). Additional datafrom other loci and additional populations from Tanzaniawill help resolve whether the connection between Khoisanspeakers in eastern and southern Africa is due to divergencefrom a common ancestor, or to ancient gene flow, andwhether or not the ancestors of the Khoisan-speaking pop-ulations originated in eastern or southern Africa (TishkoffSA and Mountain JL, unpublished data).
Finally, our limited genetic data from Tanzanians be-longing to haplogroups M1, N1, and J suggest 2 alternatives
that are not mutually exclusive. Populations in Tanzaniamay have been important in the migration of modernhumans from Africa to other regions, as noted in previousstudies of other populations in eastern Africa (Quintana-Murci et al. 1999). For example, mtDNAs of Tanzaniansbelonging to haplogroup M1 cluster with peoples fromOceania, whereas Tanzanian mtDNAs belonging to hap-logroup N1 and J cluster with peoples of Middle Easternand Eurasian origin. However, the presence of haplogroupsN1 and J in Tanzania suggest ‘‘back’’ migration from theMiddle East or Eurasia into eastern Africa, which has beeninferred from previous studies of other populations in east-ern Africa (Kivisild et al. 2004). These results are intriguingand suggest that the role of Tanzanians in the migration ofmodern humans within and out of Africa should be ana-lyzed in greater detail after more extensive data collection,particularly from analysis of Y-, X-, and autosomal chromo-some markers. Our analyses of African mtDNAs suggestpopulations in eastern Africa have played an importantand persistent role in the origin and diversification of mod-ern humans.
Supplementary Material
Supplementary figures S1–S4 and tables S1–S3 areavailable at Molecular Biology and Evolution online(http://www.mbe.oxfordjournals.org/).
Acknowledgments
This study was funded by L.S.B. Leakey Foundation,Wenner Gren Foundation, NSF BCS-0196183, BSC-0552486, and Packard and Burroughs Wellcome Founda-tion grants to S.A.T. H.M.M. and A.de S. were funded byIGERT-9987590 grant to S.A.T. F.A.R. was supported byNational Institutes of Health grant F32HG003801. Wethank Kweli Powell, Maritha Koetze and Alain Fromentfor assistance with DNA sample collection and NigelCrawhall, Christopher Ehret, Alison Brooks, and JoannaMountain for helpful discussion. We thank Godfrey Lema,Salum Juma Deo, Paschal Lufungulo, Waja Ntandu, Dr T.B.Nyambo at MUCHS, Dr Audax Mabulla at University ofDar es Saalam, Jeannette Hanby, and David Bygott for theirassistance with field work in Tanzania. We thank Africanparticipants who generously donated DNA samples so thatwe might learn more about their population history.
Literature Cited
Ambrose SH. 1982. Archaeology and linguistic reconstructions ofhistory in eastern Africa. In: Ehret C, Posnansy M, editors. Ar-chaeological and linguistic reconstruction of African history.Berkeley (CA): University of California Press. p. 104–157.
Andrews R, Kubacka I, Chinnery P, Lightowlers R, Turnbull D,Howell N. 1999. Reanalysis and revision of the Cambridge ref-erence sequence for human mitochondrial DNA. Nat Genet.2:149.
Baldwin BG, Sanderson MJ. 1998. Age and rate of diversificationof the Hawaiian silversword alliance (Compositae). Proc NatlAcad Sci USA. 95:9402–9406.
Ballard JW, Whitlock MC. 2004. The incomplete natural historyof mitochondria. Mol Ecol. 13:729–744.
766 Gonder et al.
at Pendlebury Library of M
usic on January 4, 2013http://m
be.oxfordjournals.org/D
ownloaded from

Bandelt H, Forster P, Rohl A. 1999. Median-joining networks forinferring intraspecific phylogenies. Mol Biol Evol. 16:37–48.
Bandelt HJ, Kong QP, Richards M, Villems R, Macaulay V. 2006.Estimation of mutation rates and coalescence times: some cav-eats. In: Bandelt HJ, Macaulay V, Richards M, editors. Humanmitochondrial DNA and the evolution of Homo sapiens. Berlin(Germany): Springer-Verlag. p. 149–179.
Cann RL, Stoneking M, Wilson AC. 1987. Mitochondrial DNAand human evolution. Nature. 325:31–36.
Chen J, Sokal RR, Ruhlen M. 1995. Worldwide analysis of geneticand linguistic relationships of human populations. Hum Biol.67:595–612.
Chen YS, Olckers A, Schurr TG, Kogelnik AM, Huoponen K,Wallace DC. 2000. mtDNA variation in the South AfricanKung and Khwe and their genetic relationships to other Africanpopulations. Am J Hum Genet. 66:1362–1383.
Chen YS, Torroni A, Excoffier L, Santachiara-Benerecetti AS,Wallace DC. 1995. Analysis of mtDNA variation in Africanpopulations reveals the most ancient of all human continent-specific haplogroups. Am J Hum Genet. 57:133–149.
Clark JD, Beyene Y, WoldeGabriel G, et al. (13 co-authors). 2003.Stratigraphic, chronological and behavioural contexts of Pleis-tocene Homo sapiens from Middle Awash, Ethiopia. Nature.423:747–752.
Cruciani F, Santolamazza P, Shen P, et al. (16 co-authors). 2002.A back migration from Asia to sub-Saharan Africa is supportedby high-resolution analysis of human Y-chromosome haplo-types. Am J Hum Genet. 70:1197–1214.
Destro-Bisol G, Coia V, Boschi I, Verginelli F, Caglia A, Pascali V,Spedini G, Calafell F. 2004. The analysis of variation of mtDNAhypervariableregion1suggeststhatEasternandWesternPygmiesdiverged before the Bantu expansion. Am Nat. 163:212–226.
Don RH, Cox PT, Wainwright BJ, Baker K, Mattick JS. 1991.�Touchdown� PCR to circumvent spurious priming during geneamplification. Nucleic Acids Res. 19:4008.
Ehret C. 2000. Language and history. In: Heine B, Nurse D, edi-tors. African languages: an introduction. Cambridge (UK):Cambridge University Press.
Excoffier L, Yang Z. 1999. Substitution rate variation among sitesin mitochondrial hypervariable region I of humans and chim-panzees. Mol Biol Evol. 16:1357–1368.
Felenstein J. 1993. PHYLIP: phylogenetic inference package. Seattle(WA): Department of Genetics, University of Washington.
Finnila S, Lehtonen MS, Majamaa K. 2001. Phylogenetic networkfor European mtDNA. Am J Hum Genet. 68:1475–1484.
Foley R. 1998. The context of human genetic evolution. GenomeRes. 8:339–347.
Greenberg J. 1963. The languages of Africa. Bloomington (IN):Indiana University Press.
Hammer MF, Garrigan D, Wood E, Wilder JA, Mobasher Z,Bigham A, Krenz JG, Nachman MW. 2004. Heterogeneouspatterns of variation among multiple human X-linked loci:the possible role of diversity-reducing selection in non-Africans. Genetics. 167:1841–1853.
Horai S, Hayasaka K, Kondo R, Tsugane K, Takahata N. 1995.Recent African origin of modern humans revealed by completesequences of hominoid mitochondrial DNAs. Proc Natl AcadSci USA. 92:532–536.
Huelsenbeck JP, Crandall KA. 1997. Phylogeny estimation andhypothesis testing using maximum likelihood. Annu Rev EcolSyst. 28:437–466.
Ingman M, Gyllensten U. 2003. Mitochondrial genome variationand evolutionary history of Australian and New Guinean abo-rigines. Genome Res. 13:1600–1606.
Ingman M, Kaessmann H, Paabo S, Gyllensten U. 2000. Mito-chondrial genome variation and the origin of modern humans.Nature. 408:708–713.
Jorde LB, Watkins WS, Bamshad MJ, Dixon ME, Ricker CE,Seielstad MT, Batzer MA. 2000. The distribution of humangenetic diversity: a comparison of mitochondrial, autosomal,and Y-chromosome data. Am J Hum Genet. 66:979–988.
Kivisild T, Metspalu M, Bandelt HJ, Richards M, Villems R.2006. The world mtDNA phylogeny. In: Bandelt HJ, MacaulayV, Richards M, editors. Human mitochondrial DNA and theevolution of Homo sapiens. Berlin (Germany): Springer-Verlag.p. 149–179.
Kivisild T, Reidla M, Metspalu E, Rosa A, Brehm A, Pennarun E,Parik J, Geberhiwot T, Usanga E, Villems R. 2004. Ethiopianmitochondrial DNA heritage: tracking gene flow across andaround the gate of tears. Am J Hum Genet. 75:752–770.
Kivisild T, Shen P, Wall DP, et al. (17 co-authors). 2006. The roleof selection in the evolution of human mitochondrial genomes.Genetics. 172:373–387.
Knight A, Underhill PA, Mortensen HM, Zhivotovsky LA, LinAA, Henn BM, Louis D, Ruhlen M, Mountain JL. 2003. Af-rican Y chromosome and mtDNA divergence provides insightinto the history of click languages. Curr Biol. 13:464–473.
Kumar S, Filipski A, Swarna V, Walker A, Hedges SB. 2005.Placing confidence limits on the molecular age of the human-chimpanzee divergence. Proc Natl Acad Sci USA. 102:18842–18847.
Lahr MM. 1996. The evolution of modern human diversity. Cam-bridge (UK): Cambridge University Press.
Lahr MM, Foley RA. 1994. Multiple dispersals and modern hu-man origins. Evol Anthropol. 3:48–60.
Macaulay V, Hill C, Achilli A, et al. (21 co-authors). 2005. Single,rapid coastal settlement of Asia revealed by analysis of com-plete mitochondrial genomes. Science. 308:1034–1036.
Maddison DR, Ruvolo M, Swofford DL. 1992. Geographic ori-gins of human mitochondrial DNA: phylogenetic evidencefrom control region sequences. Syst Biol. 41:111–124.
Maddison WP, Maddison DR. 2000. MacClade: analysis of phy-logeny and character evolution. Sunderland (MA): SinauerAssociates, Inc.
McBrearty S, Brooks A. 2000. The revolution that wasn’t: a newinterpretation of the origin of modern human behavior. J HumEvol. 39:453–563.
McDougall I, Brown FH, Fleagle JG. 2005. Stratigraphic place-ment and age of modern humans from Kibish, Ethiopia. Na-ture. 433:733–736.
Meyer S, Weiss G, von Haesler A. 1999. Pattern of nucleotidesubstitution and rate heterogeneity in the hypervariable regionsI and II of human mtDNA. Genetics. 152:1103–1110.
Mishmar D, Ruiz-Pesini E, Brandon M, Wallace DC. 2004. Mi-tochondrial DNA-like sequences in the nucleus (NUMTs):insights into our African origins and the mechanism of foreignDNA integration. Hum Mutat. 23:125–133.
Mishmar D, Ruiz-Pesini E, Golik P, et al. (13 co-authors). 2003.Natural selection shaped regional mtDNA variation in humans.Proc Natl Acad Sci USA. 100:171–176.
Newman J. 1995. The peopling of Africa. New Haven (CT): YaleUniversity Press.
Patterson N, Richter DJ, Gnerre S, Lander ES, Reich D. 2006.Genetic evidence for complex speciation of humans and chim-panzees. Nature. 441:1103–1108.
Penny D, Steel M, Waddell PJ, Hendy MD. 1995. Improved anal-yses of human mtDNA sequences support a recent African or-igin for Homo sapiens. Mol Biol Evol. 12:863–882.
Pereira L, Macaulay V, Torroni A, Scozzari R, Prata MJ, AmorimA. 2001. Prehistoric and historic traces in the mtDNA ofMozambique: insights into the Bantu expansions and the slavetrade. Ann Hum Genet. 65:439–458.
Posada D, Crandall KA. 2001. Intraspecific gene genealogies:trees grafting into networks. Trends Ecol Evol. 16:37–45.
Analysis of Ancient African mtDNA Lineages 767
at Pendlebury Library of M
usic on January 4, 2013http://m
be.oxfordjournals.org/D
ownloaded from

Ptak SE, Przeworski M. 2002. Evidence for population growth inhumans is confounded by fine-scale population structure.Trends Genet. 18:559–563.
Quintana-Murci L, Semino O, Bandelt HJ, Passarino G, McElreaveyK, Santachiara-Benerecetti AS. 1999. Genetic evidence of anearly exit of Homo sapiens sapiens from Africa through easternAfrica. Nat Genet. 23:437–441.
Rieder MJ, Taylor SL, Tobe VO, Nickerson DA. 1998. Automat-ing the identification of DNA variations using quality-basedfluorescence re-sequencing: analysis of the human mitochon-drial genome. Nucleic Acids Res. 26:967–973.
Ronquist F, Huelsenbeck JP. 2003. MrBayes 3: Bayesian phylo-genetic inference under mixed models. Bioinformatics. 19:1572–1574.
Rosa A, Brehm A, Kivisild T, Metspalu E, Villems R. 2004.MtDNA profile of West Africa Guineans: towards a better un-derstanding of the Senegambia region. Ann Hum Genet. 68:340–352.
Rozas J, Sanchez-DelBarrio JC, Messeguer X, Rozas R. 2003.DnaSP, DNA polymorphism analyses by the coalescent andother methods. Bioinformatics. 19:2496–2497.
Ruhlen MA. 1991. Guide to the world’s languages. Stanford (CA):Stanford University Press.
Ruiz-Pesini E, Mishmar D, Brandon M, Procaccio V, Wallace DC.2004. Effects of purifying and adaptive selection on regionalvariation in human mtDNA. Science. 303:223–226.
Salas A, Richards M, De la Fe T, Lareu MV, Sobrino B, Sanchez-Diz P, Macaulay V, Carracedo A. 2002. The making of theAfrican mtDNA landscape. Am J Hum Genet. 71:1082–1111.
Salas A, Richards M, Lareu MV, Scozzari R, Coppa A, Torroni A,Macaulay V, Carracedo A. 2004. The African diaspora: mito-chondrial DNA and the Atlantic slave trade. Am J Hum Genet.74:454–465.
Sanderson MJ. 1997. A nonparametric approach to estimating di-vergence times in the absence of rate constancy. Mol Biol Evol.14:1218–1231.
Sanderson MJ. 2002. Estimating absolute rates of molecular evo-lution and divergence times: a penalized likelihood approach.Mol Biol Evol. 19:101–109.
Sanderson MJ. 2003. r8s: inferring absolute rates of molecularevolution and divergence times in the absence of a molecularclock. Bioinformatics. 19:301–302.
Sanderson MJ, Doyle JA. 2001. Sources of error and confidenceintervals in estimating the age of angiosperms from rbcL and18S rDNA data. Am J Bot. 88:1499–1516.
Sanderson MJ, Shaffer HB. 2002. Troubleshooting molecularphylogenetic analyses. Annu Rev Ecol Syst. 33:49–72.
Semino O, Santachiara-Benerecetti AS, Falaschi F, Cavalli-SforzaLL, Underhill PA. 2002. Ethiopians and Khoisan share thedeepest clades of the human Y-chromosome phylogeny. AmJ Hum Genet. 70:265–268.
Shen P, Lavi T, Kivisild T, et al. (11 co-authors). 2004. Recon-struction of patrilineages and matrilineages of Samaritans andother Israeli populations from Y-chromosome and mitochon-drial DNA sequence variation. Hum Mutat. 24:248–260.
Simonsen KL, Churchill GA, Aquadro CF. 1995. Properties ofstatistical tests of neutrality for DNA polymorphism data. Ge-netics. 141:413–429.
Stevanovitch A, Gilles A, Bouzaid E, Kefi R, Paris F, Gayraud RP,Spadoni JL, El-Chenawi F, Beraud-Colomb E. 2004. Mito-chondrial DNA sequence diversity in a sedentary populationfrom Egypt. Ann Hum Genet. 68:23–39.
Swofford DL. 2002. PAUP*: phylogenetic analysis using parsi-mony. Sunderland (MA): Sinaeur Associates, Inc.
Tamura K, Nei M. 1993. Estimation of the number of nucleotidesubstitutions in the control region of mitochondrial DNA inhumans and chimpanzees. Mol Biol Evol. 10:512–526.
Thangaraj K, Chaubey G, Kivisild T, Reddy AG, Singh VK,Rasalkar AA, Singh L. 2005. Reconstructing the origin ofAndaman Islanders. Science. 308:996.
Thompson JD, Gibson TJ, Plewniak AJ, Kidd JR. 1997. The Clus-tal X windows interface: flexible strategies for multiple se-quence alignment aided by quality analysis tools. NucleicAcids Res. 24:4876–4882.
Tishkoff SA, Dietzsch E, Speed W, et al. (11 co-authors). 1996.Global patterns of linkage disequilibrium at the CD4 locus andmodern human origins. Science. 271:1380–1387.
Torroni A, Rengo C, Guida V, et al. (12 co-authors). 2001. Do thefour clades of the mtDNA haplogroup L2 evolve at differentrates? Am J Hum Genet. 69:1348–1356.
Traunmuller H. 2003. Clicks and the idea of a human protolan-guage. Phonum. 9:1–4.
Underhill PA, Passarino G, Lin AA, Shen P, Mirazon Lahr M,Foley RA, Oefner PJ, Cavalli-Sforza LL. 2001. The phylo-geography of Y chromosome binary haplotypes and the originsof modern human populations. Ann Hum Genet. 65:43–62.
Underhill PA, Shen P, Lin AA, et al. (21 co-authors). 2000. Ychromosome sequence variation and the history of human pop-ulations. Nat Genet. 26:358–361.
Vigilant L, Stoneking M, Harpending H, Hawkes K, Wilson AC.1991. African populations and the evolution of human mito-chondrial DNA. Science. 253:1503–1507.
Wallace DC, Brown MD, Lott MT. 1999. Mitochondrial DNAvariation in human evolution and disease. Gene. 238:211–230.
Watson E, Bauer K, Aman R, Weiss G, von Haeseler A, Paabo S.1996. mtDNA sequence diversity in Africa. Am J Hum Genet.59:437–444.
Watson E, Forster P, Richards M, Bandelt HJ. 1997. Mitochon-drial footprints of human expansions in Africa. Am J HumGenet. 61:691–704.
Watson EE, Penny D. 2003. DNA and people: from East Africa toAotearoa New Zealand. N Z Sci Rev. 60:29–35.
White T, Asfaw B, DeGusta D, Gilbert H, Richards G, Suwa G,Howell F. 2003. Pleistocene Homo sapiens from MiddleAwash, Ethiopia. Nature. 423:742–747.
Lisa Matisoo-Smith, Associate Editor
Accepted December 12, 2006
768 Gonder et al.
at Pendlebury Library of M
usic on January 4, 2013http://m
be.oxfordjournals.org/D
ownloaded from