diversifying network services under cost constraints for
TRANSCRIPT

Diversifying Network Services under Cost Constraintsfor Better Resilience against Unknown Attacks
Daniel Borbor1, Lingyu Wang1, Sushil Jajodia2, and Anoop Singhal3
1 Concordia Institute for Information Systems Engineering, Concordia University{d_borbor,wang}@ciise.concordia.ca
2 Center for Secure Information Systems, George Mason [email protected]
3 Computer Security Division, National Institute of Standards and [email protected]
Abstract. Diversity as a security mechanism has received revived interest re-cently due to its potential for improving the resilience of software and networksagainst unknown attacks. Recent work shows diversity can be modeled and quan-tified as a security metric at the network level. However, such an effort does notdirectly provide a solution for improving the network diversity. Also, existingnetwork hardening approaches are largely limited to handling previously knownvulnerabilities by disabling existing services. In this paper, we take the first steptowards an automated approach to diversifying network services under variouscost constraints in order to improve the network’s resilience against unknown at-tacks. Specifically, we provide a model of network services and formulate thediversification requirements as an optimization problem. We devise optimizationand heuristic algorithms for efficiently diversifying relatively large networks un-der different cost constraints. We also evaluate our approach through simulations.
1 Introduction
Many critical infrastructures, governmental and military organizations, and enterpriseshave become increasingly dependent on networked computer systems today. Such mis-sion critical computer networks must be protected against not only known attacks, butalso potential zero day attacks exploiting unknown vulnerabilities. However, while tra-ditional solutions, such as firewalls, vulnerability scanners, and IDSs, are relatively suc-cessful in dealing with known attacks, they are less effective against zero day attacks.
To this end, diversity has previously been considered for a security mechanism forhardening software systems against unknown vulnerabilities, and it has received a re-vived interest recently due to its potential for improving networks’ resilience againstknown attacks. In particular, a recent work shows diversity can be modeled and quanti-fied as a security metric at the network level [21]. However, the work does not directlyprovide a systematic solution for improving the network diversity under given cost con-straints, which can be a challenging task for large and complex networks. On the otherhand, existing efforts on network hardening (a detailed review of related work will begiven later in Section 2) are largely limited to handling previously known vulnerabilitiesby disabling existing services.
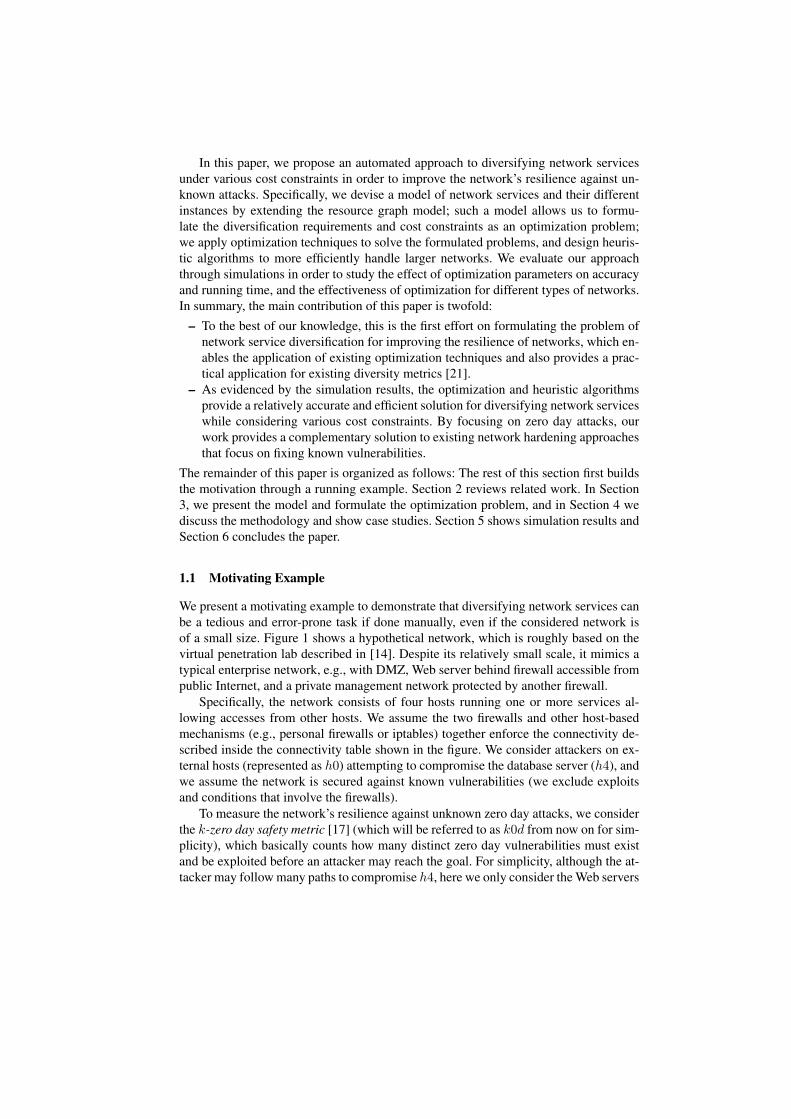
In this paper, we propose an automated approach to diversifying network servicesunder various cost constraints in order to improve the network’s resilience against un-known attacks. Specifically, we devise a model of network services and their differentinstances by extending the resource graph model; such a model allows us to formu-late the diversification requirements and cost constraints as an optimization problem;we apply optimization techniques to solve the formulated problems, and design heuris-tic algorithms to more efficiently handle larger networks. We evaluate our approachthrough simulations in order to study the effect of optimization parameters on accuracyand running time, and the effectiveness of optimization for different types of networks.In summary, the main contribution of this paper is twofold:
– To the best of our knowledge, this is the first effort on formulating the problem ofnetwork service diversification for improving the resilience of networks, which en-ables the application of existing optimization techniques and also provides a prac-tical application for existing diversity metrics [21].
– As evidenced by the simulation results, the optimization and heuristic algorithmsprovide a relatively accurate and efficient solution for diversifying network serviceswhile considering various cost constraints. By focusing on zero day attacks, ourwork provides a complementary solution to existing network hardening approachesthat focus on fixing known vulnerabilities.
The remainder of this paper is organized as follows: The rest of this section first buildsthe motivation through a running example. Section 2 reviews related work. In Section3, we present the model and formulate the optimization problem, and in Section 4 wediscuss the methodology and show case studies. Section 5 shows simulation results andSection 6 concludes the paper.
1.1 Motivating Example
We present a motivating example to demonstrate that diversifying network services canbe a tedious and error-prone task if done manually, even if the considered network isof a small size. Figure 1 shows a hypothetical network, which is roughly based on thevirtual penetration lab described in [14]. Despite its relatively small scale, it mimics atypical enterprise network, e.g., with DMZ, Web server behind firewall accessible frompublic Internet, and a private management network protected by another firewall.
Specifically, the network consists of four hosts running one or more services al-lowing accesses from other hosts. We assume the two firewalls and other host-basedmechanisms (e.g., personal firewalls or iptables) together enforce the connectivity de-scribed inside the connectivity table shown in the figure. We consider attackers on ex-ternal hosts (represented as h0) attempting to compromise the database server (h4), andwe assume the network is secured against known vulnerabilities (we exclude exploitsand conditions that involve the firewalls).
To measure the network’s resilience against unknown zero day attacks, we considerthe k-zero day safety metric [17] (which will be referred to as k0d from now on for sim-plicity), which basically counts how many distinct zero day vulnerabilities must existand be exploited before an attacker may reach the goal. For simplicity, although the at-tacker may follow many paths to compromise h4, here we only consider the Web servers

Fig. 1. Example network.
as the initial targets. We can observe that there must exist at least two distinct zero-dayvulnerabilities, one for the Apache server and one for the IIS server1, and the attackermust exploit both in order to compromise h4. Finally, we assume the administrator hasthe option of replacing those Web servers with either an NGINX 1.9 or a Litespeed5.0.14 Web server and each replacement will incur a given installation/maintenancecost (we will discuss the cost model in more details later in Section 3). Based on aboveassumptions, we may consider different use cases as follows.
– Scenario 1: The administrator aims to render the network as resilient as possible tozero-day attacks (which means to maximize the aforementioned k0d metric).
– Scenario 2: He/she aims at the same goal as in above Scenario 1, but under theconstraint that the overall diversification cost must be less than a given budget.
– Scenario 3: He/she aims at the same goal as in above Scenario 2, but under anadditional constraint that at most two Web servers may be replaced.
– Scenario 4: He/she aims at the same goal as in above Scenario 3, but under anadditional constraint that replacing the Web server should be given a higher priority.
Clearly, many more use cases may exist in practice than those listed above, and thesolution may not always be straightforward even for such a small network. For example,while the administrator can easily increase the k0d metric value to 4 under Scenario 1(by having four different Web servers), the optimal solution in other scenarios willcritically depend on the specific cost constraints and given budgets. Considering thatthe attacker may also follow other paths to attack (e.g., starting with SMTP, instead ofWeb, on h1), the problem becomes even more complicated. This shows the need for anautomated approach, which will be the subject matter of the remainder of this paper.
1 If different software are considered likely to share common vulnerabilities, a similarity-sensitive diversity metric may be needed [21].

2 Related Work
In general, the security of networks may be qualitatively modeled using attack trees [6,7, 15] or attack graphs [2, 16]. A majority of existing quantitative models of networksecurity focus on known attacks [20, 1], while few work have tackled zero day at-tacks [18, 17, 21] which are usually considered unmeasurable due to the uncertaintiesinvolved [12].
Early work on network hardening typically rely on qualitative models while im-proving the security of a network [16, 19]. Those work secure a network by breakingall the attack paths that an attacker can follow to compromise an asset, either in themiddle of the paths or at the beginning (disabling initial conditions). Also. those workdo not consider the implications when dealing with budget constraints nor include costassignments, and tend to leave that as a separate task for the network administrators.While more recent works [1, 23] generally provide a cost model to deal with budgetconstraints, one of the first attempts to systematically address this issue is by Guptaet al. [10]. The authors employed genetic algorithms to solve the problem of choosingthe best set of security hardening options while reducing costs. Dewri et a. [6] build ontop of Gupta’s work to address the network hardening problem using a more system-atic approach. They start by analyzing the problem as a single objective optimizationproblem and then consider multiple objectives at the same time. Their work considerthe damage of compromising any node in the cost model in order to determine the mostcost-effective hardening solution. Later on, in [7] and in [22], the authors extrapolatethe network hardening optimization problem as vulnerability analysis with cost/benefitassessment, and risk assessment respectively. In [13] Poolsappasit et al. extend Dewri’smodel to also take into account dynamic conditions (conditions that may change oremerge while the model is running) by using Bayesian attack graphs in order to considerthe likelihood of an attack. Unlike our work, most existing work on network hardeningare limited to known vulnerabilities and focus on disabling existing services.
There exist a rich literature on employing diversity for security purposes. The ideaof using design diversity for tolerating faults has been investigated for a long time, suchas the N-version programming approach [3], and similar ideas have been employed forpreventing security attacks, such as the N-Variant system [5], and the behavioral dis-tance approach [8]. In addition to design diversity and generated diversity, recent workemploy opportunistic diversity which already exists among different software systems.For example, the practicality of employing OS diversity for intrusion tolerance is eval-uated in [9]. More recently, the authors in [21] adapted biodiversity metrics to networksand lift the diversity metrics to the network level [21]. While those work on diversityprovide motivation and useful models, they do not directly provide a systematic solutionfor improving diversity, which is the topic of this paper.
3 Model
We first introduce the extended resource graph model to capture network services andtheir relationships, then we present the diversity control and cost model, followed byproblem formulation.

3.1 Extended Resource Graph
The first challenge is to model different resources, such as services (e.g., Web servers)that can be remotely accessed over the network, different instances of each resource(e.g., Apache and IIS), and the causal relationships existing among resources (e.g., ahost is only reachable after an attacker gains a privilege to another host). For this pur-pose, we will extend the concept of resource graph introduced in [21], which is syn-tactically equivalent to attack graphs, but models network resources instead of knownvulnerabilities as in the latter.
Specifically, we will define an extended resource graph by introducing the notion ofService Instance to indicate which instance (e.g., Apache) of a particular service (e.g.,Web server) is being used on a host. Like the original resource graph, we only considerservices that can be remotely accessed. The extended resource graph of the runningexample is shown in Figure 2 and detailed below.
Fig. 2. The example network’s resource graph
In Figure 2, each pair shown in plaintext is a security-related condition (e.g., connec-tivity ⟨source, destination⟩ or privilege ⟨privilege, host⟩). Each exploit node (oval)is a tuple that consists of a service running on a destination host, the source host, and thedestination host (e.g., the tuple ⟨http, 1, 2⟩ indicates a potential zero day vulnerabilityin the http service on host 2, which is exploitable from host 1). The small one-columntable beside each exploit indicates the current service instance using a highlighted inte-ger (e.g., 1 means Apache and 2 means IIS) and other potential instances in lighter text.The self-explanatory edges point from pre-conditions to an exploit (e.g., from ⟨0, 1⟩and ⟨http, 1⟩ to ⟨http, 0, 1⟩), and from the exploit to its post-conditions (e.g., from⟨http, 0, 1⟩ to ⟨user, 1⟩).
A design choice here is whether to associate the service instance concept witha condition indicating the service (e.g., ⟨http, 2⟩ or the corresponding exploits (e.g.,⟨http, 1, 2⟩). While it is more straightforward to have the service instance defined as

the property of a condition, which can then be inherited by the corresponding exploits,we have opted to define this property as a label for the exploit nodes in the graph, be-cause this will make it easier to check the number of distinct services along a path, as wewill see later. One complication then is that we must ensure all exploits with the sameservice and destination host (e.g., ⟨http, 1, 2⟩ and ⟨http, 3, 2⟩ to be associated with thesame service instance.
Definitions 1 and 2 formally introduce these concepts.
Definition 1 (Service Pool and Service Instance). Denote S the set of all servicesand Z the set of integers, for each service s ∈ S, the function sp(.) : S → Z gives theservice pool of s which represent all available instances of that service.
Definition 2 (Extended Resource Graph). Given a network composed of– a set of hosts H ,– a set of services S, with the service mapping serv(.) : H → 2S ,– the collection of service pools SP = {sp(s) | s ∈ S},– and the labelling function v(.) : E → SP , which satisfies ∀hs ∈ S∀h′
s ∈S, v(⟨s, hs, hd⟩) = v(⟨s, h′
s, hd⟩) (meaning all exploits with common service anddestination host must be associated with the same service instance, as explainedearlier).
let E be the set of zero day exploits {⟨s, hs, hd⟩ | hs ∈ H,hd ∈ H, s ∈ serv(hd)}, andRr ⊆ C × E and Ri ⊆ E × C be the collection of pre and post-conditions in C. Wecall the labeled directed graph, ⟨G(E ∪ C,Rr ∪Ri), v⟩ the extended resource graph.
3.2 Diversity control and cost model
We employ the notion of diversity control as a model for diversifying one or more ser-vices in the resource graph. Since we represent the service instance using integers, it willbe straightforward to regard each pair of service and destination host on which the ser-vice is running as an optimization variable, and formulate diversity control vectors usingthose variables as follows. We note that the number of optimization variables presentin a network will depend on the number of conditions indicating services, instead ofthe number of exploits (since many exploits may share the same service instance, andhence the optimization variable). Since we only consider remotely accessible servicesin the extended resource graph model, we would expect in practice the number of opti-mization variables to grow linearly in the size of network (i.e., the number of hosts).
Definition 3 (Optimization Variable and Diversity Control). Given an extended re-source graph ⟨G, v⟩, ∀e ∈ E, v(e) is an optimization variable. A diversity controlvector is the integer valued vector V = (v(e1), v(e2), ..., v(e|E|).
Changing the value of an optimization variable has an associated diversification costand the collection of such costs is given in a diversity cost matrix in a self-explanatorymanner. We assume the values of cost are assigned by security experts or network ad-ministrators. Like in most existing work (e.g., [6]), we believe an administrator canestimate the diversification costs based on monetary, temporal, and scalability criterialike i) installation cost, ii) operation cost, iii) training cost, iv) system downtime costand, v) incompatibility cost. We define the diversity cost, diversity cost matrix, and thetotal diversity cost.

Definition 4 (Diversification Cost and Diversity Cost Matrix). Given s ∈ S andsp(s), the cost to diversify a service by changing its service instance to another insidethe service pool is called the diversification cost. The collection of all the costs associ-ated with changing services in S are given as a diversity cost matrix DCM in whichthe element at ith row and jth column indicates the diversification cost of changing theith service instance to be the jth service instance. Let vs(ei) be the service associatedwith the optimization variable v(ei) and V 0 the initial service instance values for eachof the exploits in the network. The total diversification cost, Cd, given by the diversityvector V is obtained by
Cd =
|E|∑i=1
DCMvs(ei)(V 0(i),V (i))
We note that the above definition of diversification cost between each pair of ser-vice instances has some advantages. For example, in practice we can easily imaginecases where the cost is not symmetric, i.e., changing one service instance to another(e.g. from Apache to IIS) carries a cost that is not necessarily the same as the cost ofchanging it back (from IIS to Apache). Our approach of using a matrix allows us to ac-count for cases like this. Also, the concept can be used to specify many different typesof cost constraints, which we will examine in the coming section. For example, an ad-ministrator who wants to restrict the total cost to diversify all servers running the httpservice can do so by simply formulating the cost as the addition of all the optimizationvariables corresponding to http.
3.3 Problem formulation
As demonstrated in Section 1.1, the k0d metric is defined as the minimum number ofdistinct resources on a single path in the resource graph [17]. For example, a closer lookat Figure 2 shows that the k0d value for our example network is 1. That is, an attackerneeds only one zero-day vulnerability (in http service instance 1) to compromise thisnetwork. The dashed line in Figure 2 depicts the shortest path that provides this metricvalue.
The k0 value can be increased by changing the service instances as long as werespect the available budget of cost. For example, consider a total budget of 78 units,and assume the costs to diversify the http service from service instance 1 to 2, 3 or 4 be78, 12, and 34 units, respectively. We can see that changing ⟨http, 2, 3⟩ from instance1 to 2 would respect the budget, as well as increasing the k0d value of the networkto be 2. We may also see that this is not the optimal solution, since we could alsoreplace ⟨http, 2, 3⟩ and ⟨http, 3, 4⟩ with instances 3 and 4, respectively, increasing k0dto 3 and still respecting the budget. In the following, we formally formulate this as anoptimization problem.
Problem 1 (k0d Optimization Problem). Given an extended resource graph ⟨G, v⟩, finda diversity control vector V which maximizes min(k0d(⟨G(V ), v⟩)) subject to theconstraint C ≤ B, where B is the availble budget and C is the total diversification costas given in Definition 4.

Since our problem formulation is based on an extended version of the resourcegraph, which is syntactically equivalent to attack graphs, many existing tools developedfor the latter (e.g., the tool in [11] has seen many real applications to enterprise net-works) may be easily extended to generate the extended resource graphs we need asinputs. Additionally, our problem formulation assumes a very general budget B andcost C, which allows us to account for different types of budgets and cost constraintsthat an administrator might encounter in practice, as will be explained in the followingsection.
4 Methodology
This section details the optimization and heuristic algorithms used for solving the for-mulated diversification problem and describes a few case studies.
4.1 Genetic Algorithm Optimization
Inspired by [6], we also employ the genetic algorithm (GA) for our automated opti-mization approach. GAx1 provides a simple and robust search method that requireslittle information to search effectively in a large search space in contrast to other opti-mization methods (e.g., the mixed integer programming [4]). While the authors in [6]focus on disabling services, we focus on service diversification.
The extended resource graph is the input to our automated optimization algorithmwhere the function to be optimized (fitness function) is k0d defined on the resourcegraph (later we will discuss cases where directly evaluating k0 is computationally in-feasible). One important point to consider when optimizing the k0 function on the ex-tended resource graph is that, for each generation of the GA, the graph’s labels willdynamically change. This in turn will change the value of k0d, since the shortest pathmay have changed with each successive generation of the GA. Our optimization tooltakes this into consideration. We also note one limitation here is that the optimizationdoes not provide a priority if there are more than one shortest path that provide theoptimized k0d since the optimization only aims at maximizing the minimum k0d.
The constraints are defined as a set of inequalities in the form of c ≤ b, wherec represents one or more constraint conditions and b represents one or more budgets.These constraint conditions can be overall constraints (e.g. the total diversity cost Cd)or specific constraints to address certain requirements or priorities while diversifyingservices (e.g. the cost to diversify http services should be less than 80% of the cost todiversify ssh). Those constraints are specified using the diversity control matrix.
The number of independent variables used by the GA (genes) are the optimizationvariables given by the extended resource graph. For our particular network hardeningproblem, the GA will be dealing with integer variables representing the selection of theservice instances. Because v(e) is defined as an integer, the optimization variables needto be given a minimum value and a maximum value. This range is determined by thenumber of instances provided in the service pool of each service. The initial serviceinstance for each of the services is given by the extended resource graph while the finaldiversity control vector V is obtained after running the GA.
The population size that we defined for our tool was set to be at least the valueof optimization variables (more details will be provided in the coming section). Thisway we ensure the individuals in each population span the search space. We ensurethe population diversity by testing with different settings in genetic operations (likecrossover and mutation). In the following, we discuss several test cases to demonstratehow the optimization works under different types of constraints. For all the test cases,we have used the following algorithm parameters: population size = 100, number ofgenerations = 150, crossover probability = 0.8, and mutation probability = 0.2.
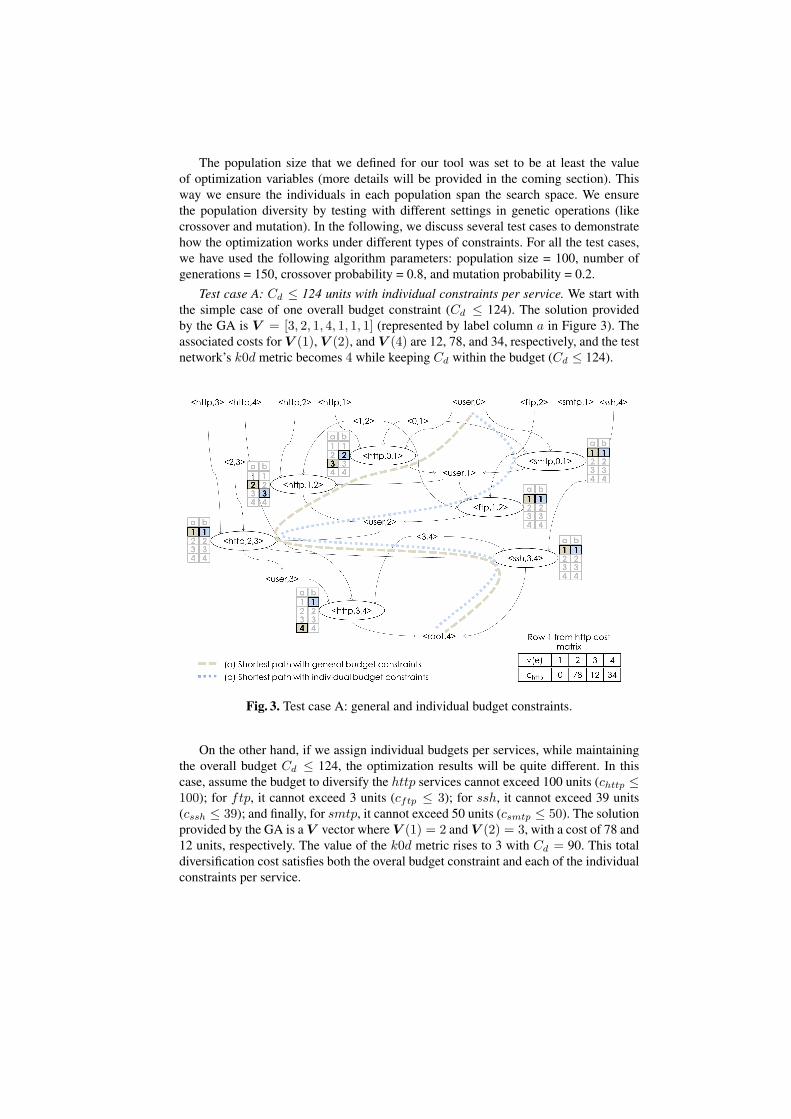
Test case A: Cd ≤ 124 units with individual constraints per service. We start withthe simple case of one overall budget constraint (Cd ≤ 124). The solution providedby the GA is V = [3, 2, 1, 4, 1, 1, 1] (represented by label column a in Figure 3). Theassociated costs for V (1), V (2), and V (4) are 12, 78, and 34, respectively, and the testnetwork’s k0d metric becomes 4 while keeping Cd within the budget (Cd ≤ 124).
Fig. 3. Test case A: general and individual budget constraints.
On the other hand, if we assign individual budgets per services, while maintainingthe overall budget Cd ≤ 124, the optimization results will be quite different. In thiscase, assume the budget to diversify the http services cannot exceed 100 units (chttp ≤100); for ftp, it cannot exceed 3 units (cftp ≤ 3); for ssh, it cannot exceed 39 units(cssh ≤ 39); and finally, for smtp, it cannot exceed 50 units (csmtp ≤ 50). The solutionprovided by the GA is a V vector where V (1) = 2 and V (2) = 3, with a cost of 78 and12 units, respectively. The value of the k0d metric rises to 3 with Cd = 90. This totaldiversification cost satisfies both the overal budget constraint and each of the individualconstraints per service.
From this test case, we can see that even with the minimum requeried budget tomaximize the k0d metric, additional budget constraints might not allow to achieve themaximum k0d possible. We can see the result of running the GA for this test case inlabel column b in figure 3.
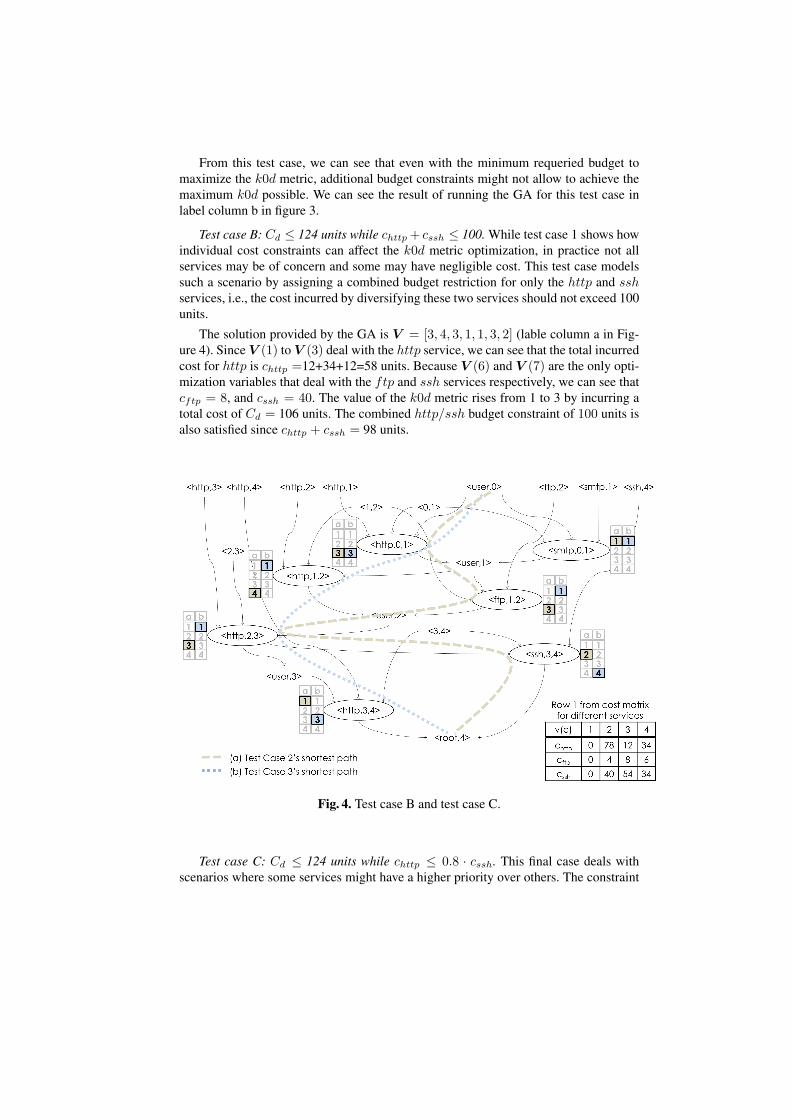
Test case B: Cd ≤ 124 units while chttp+ cssh ≤ 100. While test case 1 shows howindividual cost constraints can affect the k0d metric optimization, in practice not allservices may be of concern and some may have negligible cost. This test case modelssuch a scenario by assigning a combined budget restriction for only the http and sshservices, i.e., the cost incurred by diversifying these two services should not exceed 100units.
The solution provided by the GA is V = [3, 4, 3, 1, 1, 3, 2] (lable column a in Fig-ure 4). Since V (1) to V (3) deal with the http service, we can see that the total incurredcost for http is chttp =12+34+12=58 units. Because V (6) and V (7) are the only opti-mization variables that deal with the ftp and ssh services respectively, we can see thatcftp = 8, and cssh = 40. The value of the k0d metric rises from 1 to 3 by incurring atotal cost of Cd = 106 units. The combined http/ssh budget constraint of 100 units isalso satisfied since chttp + cssh = 98 units.
Fig. 4. Test case B and test case C.
Test case C: Cd ≤ 124 units while chttp ≤ 0.8 · cssh. This final case deals withscenarios where some services might have a higher priority over others. The constraint

in this test case is that the total incurred cost while diversifying the http service shouldnot exceed 80% of what is incurred by diversifying the ssh service.
The solution provided by the GA is V =[3,1,3,1,1,1,4] (see column b in figure4). Here V (1) and V (3) have changed from service instance 1 to 3, while V (7) havechanged from service instance 1 to 4. The incurred cost for the http service is chttp =12+12=24 units and for the ssh service is cssh = 34 units. While the value of the k0dmetric only rises from 1 to 2, the budget constraints are satisfied.
As seen from the above test cases, our model and problem formulation makes it rel-atively easy to apply any standard optimization techniques, such as the GA, to optimizethe k0d metric through diversity while dealing with different budget constraints.
4.2 Heuristic Algorithm
All the test cases described above rely on the assumption that all the attack paths arereadily available. However, this is not always the case in practice. Due to the well knowncomplexity that resource graphs have inherited from attack graphs due to their commonsyntax [21], it is usually computationally infeasible to enumerate all the available attackpaths in a resource graph for large networks. Therefore, we design a heuristic algorithmto reduce the search complexity when calculating and optimizing the k0d metric by onlystoring the m-shortest paths at each step, as depicted in Figure 5 and detailed below.
Procedure Heuristic m-shortestInput: Extended resource graph ⟨G, v⟩, goal condition cg , number of paths m,
diversified diversity control vector, DOutput: σ(cg)Method:1. Let vlistbe any topological sort of G5. While all vlist elements are unprocessed6. If c ∈ CI and c is unprocessed7. Let σ(c) = c8. Mark c as processed9. Else if e ∈ E (e is not processed) and (∀c ∈ C)((c, e) ∈ Rr ⇒ c is processed)10. Let {c ∈ C : (c, e) ∈ Rr} = {c1, c2, . . . , cn}11. Let α(e) = a1 ∪ a2 . . . ∪ e : ai ∈ σ(ci), 1 ≤ i ≤ n13. Let α′(ov(e)) = a′
1 ∪ a′2 . . . ∪ e : a′
i ⊢ ai, 1 ≤ i ≤ n12. If n > m13. Let σ(e) = ShortestM(⟨α(e), | Unique(α′[ov(e)]) | ⟩,m))14. Else15. σ(e) = a1 ∪ a2 . . . ∪ e : ai ∈ σ(ci), 1 ≤ i ≤ m16. Mark e as processed17. Else (c s.t. (e, c) ∈ Ri and c is unprocessed)18. If (∀e′ ∈ E)((e′, c) ∈ Ri ⇒ e′ is processed)19. Let α(c) =
∪e′ s.t. (e′,c)∈Ri
σ(e′)
20. Let α′(c) =∪
e′ s.t. (e′,c)∈Riσ(ov(e′))
21. If length(α(c)) > m22. Let σ(c) = ShortestM(⟨α(c), | Unique(α′[ov(c)]) | ⟩,m))23. Else24. Let σ(c) =
∪e′ s.t. (e′,c)∈Ri
σ(e′)
25. Mark c as processed26. Return σ(cg)
Fig. 5. A Heuristic algorithm for calculating m-shortests paths
The algorithm starts by topologically sorting the graph (line 1) and then proceedsto go through each one of the nodes on the resource graph collection of attack paths, as

set of exploits σ(), that reach that particular node. The main loop cycles through eachunprocessed node. If a node is an initial conditions, the algorithm assumes that the nodeitself is the only path to it and it marks it as processed (lines 6-8). For each exploit e, allof its preconditions are placed in a set (line 10). The collection of attack paths α(e) isconstructed from the attack paths of those preconditions (lines 10 and 11). In a similarway, σ′(ov(e)) is constructed with the function ov() which, aside of using the exploitsincludes value of element of the diversity control vector that supervises that exploit.
If there are more than m paths to that node, the algorithm will use the functionUnique to first look for unique combinations of service and service instance in α′(ov(e)).Then, the algorithm creates a dictionary structure where the key is a path from α(e) andthe value is the number of unique service/service instance combinations given by eachone of the respective paths in α′(ov(e)). The function ShortestM() selects the top mkeys whose values are the smallest and returns the m paths with the minimum num-ber of distinct combination of services and service instances (line 13). If there are lessthan m paths, it will return all of the paths (line 15). After this, it marks the node as pro-cessed (line 16). The process is similar when going through each one of the intermediateconditions (lines 17-24).
Finally, the algorithm returns the collection of m paths that can reach the goal con-dition cg . It is worth noting that the algorithm does not make any distinction in whetheror not a particular path has a higher priority over another when they share the samenumber of unique service/service instance combinations.
5 Simulations
In this section, we show simulation results. All simulations are performed using a com-puter equipped with a 3.0 GHz CPU and 8GB RAM in the Python 2.7.10 environmentunder Ubuntu 12.04 LTS and the MATLAB 2015a’s GA toolbox. To generate a largenumber of resource graphs for simulations, we first construct a small number of seedgraphs based on real networks and then generate larger graphs from those seed graphsby injecting new hosts and assigning resources in a random but realistic fashion (e.g.,the number of pre-conditions of each exploit is varied within a small range since realworld exploits usually have a constant number of pre-conditions). The resource graphswere used as the input for the optimization toolbox where the objective function is tomaximize the minimum k0d value subject to budget constraints. In all the simulations,we employ the heuristic algorithm described in section 4.2.
Figure 6 shows that the processing time increases almost linearly as we increase thenumber of optimization variables or the parameter m of the heuristic algorithm. Theresults show that the algorithm is relatively scalable with a linear processing time. Onthe other hand, the accuracy of the results is also an important issue to be considered.Here the accuracy refers to the approximation ratio between the result obtained usingthe heuristic algorithm and that of the brute force algorithm (i.e., simply enumeratingand searching all the paths while assuming all services and service instances are dif-ferent). For the simulations depicted in Figure 7, we settled for 50 iterations per graphper m-paths. The diversity control vector provided by the GA is used to calculate theaccuracy. From the results, we can see that when m is greater or equal to 4 the approxi-

Number of minimum paths selected (k-paths)1 2 3 4 5 6 7 8 9
Pro
cess
ing
times
(s)
1
2
3
4
5
6
7
8
9
10Processing times vs number of selected minimum paths
5 optimization variables10 optimization variables15 optimization variables20 optimization variables25 optimization variables32 optimization variables
Fig. 6. Processing time.
Generations50 100 150 200 250 300 350 400 450 500
Acc
urac
y
1.3
1.35
1.4
1.45
1.5
1.55
1.6
1.65
1.7
1.75
1.854 nodes
m=1m=2m=3m=4m=5m=6m=7m=8m=9
Fig. 7. Accuracy vs m (parameter of theheuristic algorithm).
mation ratio reaches an acceptable level. For the following simulations, we have settledwith an m value of 6 and 100 generations.
Our simulations also showed that (detailed simulation results are omitted here dueto page limitations), when no budget constraints are in effect, using the GA with acrossover probability of 80%, a mutation rate of 20%, and setting the number of gen-erations to 50 will be sufficient to obtain good results. However, this is no longer thecase when dealing with budget constraints. We have noticed that, by decreasing thecrossover probability (and consequently increasing the mutation rate), we can reach aviable solution with less generations. We have therefore settled with a crossover prob-ability of 40% which provides us with a fast (with less generations) way to convergeto viable solutions. Additionally, our experiences also show that, when dealing with adiversity control vector (also known as a chromosome in the GA) of less than 100 vari-ables (genes in the GA), the population size could be equal to the amount of variablesin the diversity control vector; when dealing with a bigger number, the population sizeshould be at least twice the amount of variables.
Figure 8 shows the results when the diversity control vector has different numbersof sevice instances to take from (i.e., different sizes of the service pools). In this simula-tion, we have picked graphs with a relative high difference in the length of the shortestpath before and after all services are diversified using the algorithm (the maximum k0dvalue is 16 and the minimum 3). We can see an increasing gain in the k0d value afteroptimization, when more service instances are available. However, this trend begins tostall after a certain number (13). From this observation it can be inferred that the num-ber of available service instances will affect the difference between the maximum k0dvalue possible and the minimum k0d, but such an effect also depends on the size ofthe network (or the extended resource graph) and increasing the number of availableservice instances does not always help.
In Figure 9, we analyze the average gain in the optimized results for different sizesof graphs. In this figure, we can see that we have a good enough gain for graphs with arelatively high amount of nodes. As expected, as we increase the size of the graphs, thegain will decrease if we keep the same optimization parameters. For those simulations,we have used a population size of 300, 50 generations, and a crossover fraction of 50%.It is interesting to note that the decrease in gain is very close to being linear.

2 4 6 8 10 12 14 16 18 20
k0d
Gai
n fa
ctor
0
1
2
3
491 hosts, 53 nodes, 17 optimization variables
m=6m=7m=8m=9
Number of minimum service instances available2 4 6 8 10 12 14 16 18 20
Ave
rage
cos
t inc
urre
d
200
300
400
500
600
m=6m=7m=8m=9
Fig. 8. The effect of the number of avail-able service instances.
Number of Nodes[10,30) [30,50) [50,60) [60,100) [100,200) [200,300) [300,400) [400,500)
Gai
n
0.6
0.8
1
1.2
1.4
1.6
1.8
2Average Gain
Fig. 9. The average gain vs the number ofnodes.
Figure 10 and Figure 11 show the optimization results on different shapes of re-source graphs. While it may be difficult to exactly define the depth of a resource graph,we have relied on the relative distance, i.e., the difference of the shortest path beforeand after all services are diversified. There is a relative linear increase in the gain as weincrease the relative distance in the shortest path. While this does not provide an accu-rate description of the graph’s shape, it does provide an idea of how much our algorithmcan increase the minimum k0d for graphs with different depths, as shown in Figure 10.
Distance in shortest path4 5 6 7-8 9 10 11-12
Gai
n
1
1.5
2
2.5
3
3.5
4Gain based on k0d Difference
Fig. 10. Average gain based on relative dis-tance of shortest path.
Number of vulnerabilities directly under h01 1.5 2 2.5 3 3.5 4 4.5 5
Gai
n
0.6
0.8
1
1.2
1.4
1.6
1.8
2Gain based on number of exploits
Fig. 11. Average gain based on directlyreachable vulnerabilities.
Finally, in Figure 11, we can see the effect of the network’s degree of exposure,which is defined as the number of exploits that are directly reachable by the attackerfrom the external host h0. As we increase the degree of exposure, the gain in optimiza-tion decreases in almost a linear way. That is, there will less room for diversification ifthe network is more exposed.
6 Conclusions
In this paper, we have formulated service diversity as an optimization problem andproposed an automated diversity-based network hardening approach against zero-day

attacks. This automated approach used a heuristic algorithm that helped to manage thecomplexity of computing the k0d value as well as limiting the time for optimization toan acceptable level. We have shown some sample cost constraints while our model andproblem formulation would allow for other practical scenarios to be specified and opti-mized. We have tested the scalability and accuracy of the proposed algorithms throughsimulation results, and we have also discussed how the gain in the k0d value will beaffected by the number of available service instances in the service pools and differentsizes and shapes of the resource graphs.
We discuss several aspects of the proposed automated optimization technique whereadditional improvements and evaluations can be done.
– While this paper focuses on diversifying services, a natural future step is to integratethis approach with other network hardening options, such as addition or removal ofservices, or relocating hosts or services (e.g., firewalls).
– This study has relied on a simplified model by assuming all service instances to becompletely different from each another and all service instances are equally likelyto be exploited. A possible future research direction would be to model the degreeof difference (or similarity) between the different types of service instances.
– We have assumed an abstract cost model in this paper and an important directionis to elaborate the model from different aspects of potential cost for diversifyingnetwork resources.
– We will also consider other optimization algorithms in addition to GA in searchingfor more efficient and effective solutions to our problem.
Disclaimer Commercial products are identified in order to adequately specify certainprocedures. In no case does such identification imply recommendation or endorsementby the National Institute of Standards and Technology, nor does it imply that the iden-tified products are necessarily the best available for the purpose.
References
1. Massimiliano Albanese, Sushil Jajodia, and Steven Noel. Time-efficient and cost-effectivenetwork hardening using attack graphs. In Dependable Systems and Networks (DSN), 201242nd Annual IEEE/IFIP International Conference on, pages 1–12. IEEE, 2012.
2. Paul Ammann, Duminda Wijesekera, and Saket Kaushik. Scalable, graph-based networkvulnerability analysis. In Proceedings of the 9th ACM Conference on Computer and Com-munications Security, pages 217–224. ACM, 2002.
3. A. Avizienis and L. Chen. On the implementation of n-version programming for softwarefault tolerance during execution. In Proc. IEEE COMPSAC, volume 77, pages 149–155,1977.
4. H Md Azamathulla, Fu-Chun Wu, Aminuddin Ab Ghani, Sandeep M Narulkar, Nor AzaziZakaria, and Chun Kiat Chang. Comparison between genetic algorithm and linear program-ming approach for real time operation. Journal of Hydro-environment Research, 2(3):172–181, 2008.
5. B. Cox, D. Evans, A. Filipi, J. Rowanhill, W. Hu, J. Davidson, J. Knight, A. Nguyen-Tuong,and J. Hiser. N-variant systems: A secretless framework for security through diversity. De-fense Technical Information Center, 2006.

6. Rinku Dewri, Nayot Poolsappasit, Indrajit Ray, and Darrell Whitley. Optimal security hard-ening using multi-objective optimization on attack tree models of networks. In Proceedingsof the 14th ACM conference on Computer and communications security, pages 204–213.ACM, 2007.
7. Rinku Dewri, Indrajit Ray, Nayot Poolsappasit, and Darrell Whitley. Optimal security hard-ening on attack tree models of networks: a cost-benefit analysis. International Journal ofInformation Security, 11(3):167–188, 2012.
8. D. Gao, M. Reiter, and D. Song. Behavioral distance measurement using hidden markovmodels. In Recent Advances in Intrusion Detection, pages 19–40. Springer, 2006.
9. M. Garcia, A. Bessani, I. Gashi, N. Neves, and R. Obelheiro. OS diversity for intrusiontolerance: Myth or reality? In 2011 IEEE/IFIP 41st International Conference on DependableSystems & Networks (DSN), pages 383–394, 2011.
10. Mukul Gupta, Jackie Rees, Alok Chaturvedi, and Jie Chi. Matching information securityvulnerabilities to organizational security profiles: a genetic algorithm approach. DecisionSupport Systems, 41(3):592–603, 2006.
11. S. Jajodia, S. Noel, and B. O’Berry. Topological analysis of network attack vulnerability.In V. Kumar, J. Srivastava, and A. Lazarevic, editors, Managing Cyber Threats: Issues, Ap-proaches and Challenges. Kluwer Academic Publisher, 2003.
12. John McHugh. Quality of protection: measuring the unmeasurable? In Proceedings of the2nd ACM workshop on Quality of protection, pages 1–2. ACM, 2006.
13. Nayot Poolsappasit, Rinku Dewri, and Indrajit Ray. Dynamic security risk managementusing bayesian attack graphs. Dependable and Secure Computing, IEEE Transactions on,9(1):61–74, 2012.
14. Penetration testing virtual labs. https://www.offensive-security.com/offensive-security-solutions/virtual-penetration-testing-labs/, Sep, 2015.
15. Indrajit Ray and Nayot Poolsapassit. Using attack trees to identify malicious attacks fromauthorized insiders. In ESORICS 2005, pages 231–246. Springer, 2005.
16. Oleg Sheyner, Joshua Haines, Somesh Jha, Richard Lippmann, and Jeannette M Wing. Auto-mated generation and analysis of attack graphs. In Security and privacy, 2002. Proceedings.2002 IEEE Symposium on, pages 273–284. IEEE, 2002.
17. Lingyu Wang, Sushil Jajodia, Anoop Singhal, Pengsu Cheng, and Steven Noel. k-zero daysafety: A network security metric for measuring the risk of unknown vulnerabilities. De-pendable and Secure Computing, IEEE Transactions on, 11(1):30–44, 2014.
18. Lingyu Wang, Sushil Jajodia, Anoop Singhal, and Steven Noel. k-zero day safety: Measuringthe security risk of networks against unknown attacks. In ESORICS 2010, pages 573–587.Springer, 2010.
19. Lingyu Wang, Steven Noel, and Sushil Jajodia. Minimum-cost network hardening usingattack graphs. Computer Communications, 29(18):3812–3824, 2006.
20. Lingyu Wang, Anoop Singhal, and Sushil Jajodia. Measuring the overall security of networkconfigurations using attack graphs. In Data and Applications Security XXI, pages 98–112.Springer, 2007.
21. Lingyu Wang, Mengyuan Zhang, Sushil Jajodia, Anoop Singhal, and Massimiliano Al-banese. Modeling network diversity for evaluating the robustness of networks against zero-day attacks. In ESORICS 2014, pages 494–511. Springer, 2014.
22. Shuzhen Wang, Zonghua Zhang, and Youki Kadobayashi. Exploring attack graph for cost-benefit security hardening: A probabilistic approach. Computers & security, 32:158–169,2013.
23. Beytullah Yigit, Gurkan Gur, and Fatih Alagoz. Cost-aware network hardening with limitedbudget using compact attack graphs. In Military Communications Conference (MILCOM),2014 IEEE, pages 152–157. IEEE, 2014.