diverging trends in national and local concentrationerossi/dtnlc.pdf · diverging trends in...
TRANSCRIPT

Diverging Trends in National and Local Concentration∗
Esteban Rossi-Hansberg Pierre-Daniel Sarte
Princeton University Federal Reserve Bank of Richmond
Nicholas Trachter
Federal Reserve Bank of Richmond
This version: April 20, 2020
First version: September 12, 2018
Abstract
Using U.S. NETS data, we present evidence that the positive trend observed in national product-
market concentration between 1990 and 2014 becomes a negative trend when we focus on measures of
local concentration. We document diverging trends for several geographic definitions of local markets.
SIC 8 industries with diverging trends are pervasive across sectors. In these industries, top firms have
contributed to the amplification of both trends. When a top firm opens a plant, local concentration
declines and remains lower for at least 7 years. Our findings, therefore, reconcile the increasing national
role of large firms with falling local concentration, and a likely more competitive local environment.
JEL codes: D22, D43, L16, L22, R12.
1 Introduction
Most product markets are local. The reason is simply that the transportation of goods and people is costly
so firms set up production plants, distribution centers, and stores close to customers. In turn, individuals
locate in areas where they can obtain the goods they desire. A coffee shop or restaurant in Manhattan does
not compete with similar establishments in Seattle, and probably not even in Brooklyn. The wedge in prices
created by the inconvenience and monetary cost of buying a product far away from the desired consumption
∗Rossi-Hansberg: [email protected]. Sarte: [email protected]. Trachter: [email protected]. We thank RyanDecker, Jan Eeckhout, Francois Gourio, Bob Hall, and Huiyu Li for formal discussions. We also thank Simcha Barkai, TomHolmes, Erik Hurst, Greg Kaplan, Simon Mongey, Steve Redding, and participants at numerous seminars and conferences fortheir feedback. We thank Eric LaRose, Reiko Laski, and Sara Ho for outstanding research assistance. The views expressedherein are those of the authors and do not necessarily represent the views of the Federal Reserve Bank of Richmond or theFederal Reserve System.
1

point shields companies in different locations from direct competition. Of course the size of these costs,
and therefore the geographic extent of the market, varies by product. Markets are also product-specific.
Producers of a particular product are shielded from competition by producers of distinct but related goods
and services to the degree that their consumption requires households to move away from their ideal variety.
Much has been written recently about the increase in national market concentration observed over the
last two decades, and the role that large national firms have played in driving this trend. The evidence
for the rise in concentration is uncontroversial; the share of the largest firms and the Herfindahl-Hirschman
Index, among other measures of concentration, have increased consistently in most sectors since 1990.1 A
narrative has emerged whereby this increase in national concentration is perceived as the cause of lower
product-market competition. This fall in competition is then viewed as the culprit of other apparent trends,
such as rising markups and market power (Gutierrez and Philippon, 2017; De Loecker, Eeckhout and Unger,
2018; Hall, 2018), the increasing profits of large firms (Barkai, 2017), declining labor market dynamism and
firm entry (Decker, Haltiwanger, Jarmin and Miranda, 2017), and declining wages and declining labor share
(e.g. Autor, Dorn, Katz, Patterson, and Van Reenen, 2017)2. Some studies have called into question the
interpretation of these facts as evidence of increasing market power (see Hopenhayn, Neira and Singhania,
2019; Syverson, 2019), and the empirical robustness and validity of some of these trends has also been
contested in recent work3. However, the uncontroversial rise in national market concentration remains as
the main empirical foundation of this central narrative.
In this paper, we use the National Establishment Time Series (NETS) dataset to document four main
facts regarding national and local product-market concentration in the U.S. economy between 1990 and
2014. Our first fact is that the observed positive trend in market concentration at the national level has
been accompanied by a corresponding negative trend in average local market concentration. We measure
concentration using the Herfindahl-Hirschman index (HHI), but our findings hold for a variety of statistics.
We observe an increase in concentration at the national level overall across the vast majority of sectors and
1A 2016 report by the Council of Economic Advisers, for instance, finds that the national revenue share ofthe top 50 firms has increased across most NAICS sectors between 1997 and 2012. The report can be found athttps://obamawhitehouse.archives.gov/sites/default/files/page/files/20160414 cea competition issue brief.pdf. Gutierrez andPhilippon (2017) show that this increase in U.S.-wide market concentration is not uniform across all sectors and has beenmost pronounced in non-manufacturing sectors. Barkai (2017), and Autor, Dorn, Katz, Patterson, and Van Reenen (2017),find that the national sales share of top firms has also been rising since 1997 and, in fact, helps explain the decline in the laborshare over the same period.
2Other examples are Azar, Marinescu and Steinbaum (2017), Benmelech, Bergman and Kim (2018) and Qiu and Sojourner(2019).
3While rising market concentration at the national level is relatively undisputed, the evidence regarding markups is moremixed. De Loecker, Eeckhout and Unger (2018) show evidence of rising markups since the 1980s among publicly traded firms.However, Traina (2018) points out that the evidence on markups depends crucially on the measurement of variable costs.When variable costs include marketing and management costs, as well as other indirect costs of production, markups havebeen relatively flat since the mid-1980s. Hall (2018) also finds essentially constant markups at the sectoral level using KLEMSproductivity data. Similarly, Karabarbounis and Neiman (2018) find generally flat markups over time when also accountingfor selling, general, and administrative expenses. Anderson, Rebelo, and Wong (2018) focus on the retail sector and find stablemarkups since 1979 using scanner data on the price of transactions and measuring marginal costs as replacement costs atthe store level. Edmond, Midrigan and Xu (2018) show that when weighted by costs rather than sales, as implied by themicrofoundations they lay out, aggreate markups have increased only modestly.
2
industries, but a fall in concentration when it is measured at the CBSA, County, or ZIP code levels.4 The
narrower the geographic definition, the faster the decline in local concentration. This is meaningful because
the relevant definition of concentration from which to infer changes in competition is, in most sectors, local
and not national.
The second fact shows that local concentration is falling across SIC 8 industries that together account for
78% of employment and 72% of sales. Furthermore, conditioning on industries where national concentration
is rising, industries where local concentration has declined account for the majority of employment overall
(72% of employment and 66% of sales) across all major sectors. The presence of these diverging trends
is always large but more pronounced in services, retail trade, and FIRE relative to wholesale trade and
manufacturing. This ordering is natural given that transport costs are less relevant in the latter two sectors.
Together, these first two facts underscore an unmistakable decline in local concentration on average that is
pervasive across all sectors.
How does one reconcile a positive trend in national concentration with a negative trend in local con-
centration? Our third fact shows that among SIC 8 industries that exhibit this pattern, top firms have
accelerated these trends. That is, excluding the top firm in each industry (in terms of national sales in their
SIC 8 industry in 2014), the national increase in concentration becomes naturally less pronounced. Perhaps
more surprisingly, the decline in local concentration also becomes less pronounced. Put another way, large
firms have materially contributed to the observed decline in local concentration.5 Among industries with
diverging trends, large firms have become bigger but the associated geographic expansion of these firms,
through the opening of more plants in new local markets, has lowered local concentration thus suggesting
increased local competition. In the considerably smaller set of industries where we observe increases in both
national and local concentration, top firms have also been responsible for both forms of concentration.
Our fourth fact establishes that among industries with falling local concentration, the opening of a
plant by a top firm is associated with a decline in local concentration at the time of the opening, and that
this lower level of concentration persists for at least the next 7 years. This observation provides further
evidence that in those industries, large enterprises do not enter and dominate the local market but instead
lower its concentration, either by competing with the previous local monopolist or by simply adding one
more establishment that grabs a proportional market share from other local establishments. In any case,
the notion that entry by large firms eliminates local producers to the point of increasing concentration is
certainly not supported in the vast majority of industries where most of U.S. employment resides.
Consider the much-publicized case of Walmart. Most of Walmart’s establishments are in the discount
department stores industry, an industry with declining local concentration. Consistent with fact four, when
Walmart opens a store, the HHI falls by 0.15 in the associated ZIP code. In contrast, computing the HHI
without taking into account the opening of a Walmart establishment, concentration remains constant. One
can also consider the effect of Walmart on the number of firms in a market. When Walmart enters, the total
4In the main text, we focus mostly on ZIP codes as our geographic definition of a local market. An online-only appendixpresents results with other geographic units.
5This finding also holds when we exclude the top three firms in each industry instead of just the top firm.
3

number of establishments in the ZIP code increases, though by less than one-to-one (about 3/4). In other
words, Walmart generates some exit but the net result of opening a Walmart store is a greater number of
competitors in the market for at least 7 years after entry.6 This case is paradigmatic, but there are many
others across all major sectors. For example, the expansion of Cemex, the top firm by sales in 2014 in the
ready-mixed concrete industry, led to a similar decline in local concentration and an expansion in the local
number of establishments in the industry.7
Our findings challenge the view that product-market concentration is increasing in the U.S. They do so
not by challenging the evidence that national concentration has increased – we actually provide additional
evidence to that effect across many industries – but by observing that this national trend does not imply
a positive local trend in concentration. In fact, we show that it implies the opposite in most industries, a
declining trend in concentration. Ultimately, concentration matters because it can lead to less competition.
Hence, measures of concentration have to be aligned with product markets as well as their geographic and
industrial scope. In particular, for the majority industries, concentration is likely more relevant to firm
pricing and other strategic behavior at a more local level. Our findings are also consistent with the mixed
evidence found in recent literature regarding secular changes in markups across individual industries. If local
competition matters, we should not see increases in markups or profits in the markets where local competition
is increasing. The measurement of markups in local markets associated with particular industries depends
on important assumptions and requires very detailed data. The NETS data does not allow us to calculate
these local statistics, but there exists evidence of flat markups over time in specific industries with declining
concentration (Anderson, Rebelo, and Wong, 2018), and in the aggregate (Traina, 2018). Finally, our
results are also consistent with recent papers contending that labor market concentration is falling in the
US economy (Hershbein, Macaluso and Yeh, 2018; Rinz, 2018; Berger, Herkenhoff and Mongey, 2019).8 In
contrast to these studies, we demonstrate the contribution of top firms, including in specific examples such
as Walmart, to the divergence between the national and local concentration measures.
The National Establishment Time Series (NETS) dataset covers the universe of U.S. firms and their
plants.9 The dataset includes sales and employment numbers of all plants at different levels of geographic
and industrial disaggregation down to the SIC 8 product code. Neumark, Zhang and Wall (2006), and
Barnatchez, Crane and Decker (2017), provide thorough discussions of the advantages and disadvantages of
6Jia (2008) studies competition by Walmart and other discount retail stores. She proposes a structural model of thiscompetition and argues that the profits of previously available retailers decrease when ‘Walmart comes to town’. This isconsistent with our view that Walmart lowers concentration by taking market share away from local competitors. Moreover, theexit of firms we observe is also consistent with those of Jia (2008) when measured at the county level. Holmes (2011) studiesthe expansion strategy of Walmart and, in particular, its geographic expansion strategy. Our findings are exactly consistentwith this view of geographic expansion and provide related facts concerning its impact on local concentration. In contrast tothese studies, our empirical findings extend to most U.S. industries in addition to the discount retail sector.
7This industry was singled out in Syverson (2008) as an example of an industry with a local market.8Berger, Herkenhoff and Mongey (2019) also develop an equilibrium model of the U.S. labor market and find that, although
there are large welfare gains from increasing competition, in their framework market power is unable to explain the decline inthe labor share.
9Throughout the paper we interchangeably use the terms plant and establishment. We also treat firm and enterprise assynonymous.
4

this data source relative to U.S. Census data. The next section discusses many of these and the extent to
which they are relevant for our findings. In particular, we show that for the industries covered in our study,
the geographic distribution of employment in the data is very highly correlated with that in the U.S. Census
and, moreover, that this correlation is stable over time. Our findings, therefore, cannot be driven by changes
in data coverage, accuracy, or the speed of its updates. The small discrepancies we find between NETS and
standard Census data sources can evidently not explain the variety of consistent patterns revealed in the
data. In addition, a critical feature of the NETS data integral to our analysis is that it allows researchers
to explore and share the role of individual enterprises in shaping changes in industry concentration. This
defining characteristic of NETS, therefore, permits explorations that would otherwise be infeasible with
Census data.
The facts we document are directly relevant to the design of antitrust policy and other policies that
can prevent successful firms from growing at the national level. We document heterogenous trends across
industries and, in some industries, concentration is clearly rising both at the national and local level.
However, our results should provide pause for policy-makers that worry about increases in market power.
On the whole, and in most industries, large firms are lowering local concentration and, therefore, most
likely increasing product market competition. Carl Shapiro, a former Deputy Assistant Attorney General
at the Antitrust Division of the Department of Justice, and member of the President’s Council of Economic
Advisers under Barack Obama, makes a similar argument. Discussing evidence on the positive trend in
national market concentration, he observes: “So, while these data do reflect the fact that large, national
firms have captured an increasing share of overall revenue during the past 20 years in many of these 893
‘industries,’ they do not, in and of themselves, indicate that the relevant local markets have become more
concentrated.” In this paper, we provide the empirical evidence supporting the notion that, in the face of
rising national concentration, local markets have indeed become on average significantly less concentrated.10
The rest of the paper is organized as follows. Section 2 describes our data, the way we use it, as well
as our benchmark measure of national and local concentration. Section 3 presents our main four facts and
describes their implications. Section 4 studies the quality of the NETS data among various dimensions and
Section 5 concludes. An online-only appendix presents a large variety of additional calculations using other
concentration statistics, and provides additional detail regarding the data and the results in the main text.11
2 Data and Concentration Statistics
Our analysis uses data from the National Establishment Time Series (NETS), which is provided by Walls
& Associates, and comprises annual observations on specific lines of business at unique locations over the
10De Loecker and Eeckhout (2018) also argue that in order to measure concentration in a way that is meaningful as anindicator of market power, this measurement has to be carried out for specific goods and local markets using the universe offirms. This is exactly what we do in this paper using the NETS data.
11The online-only supplementary appendix to this paper is available at http://www.princeton.edu/~erossi/DTNLC_
Appendix.pdf.
5

period 1990−2014. In particular, NETS data allow us to observe sales and employment of between 8 and 19
million lines of business each year in our sample. Each line of business is assigned a data universal numbering
system (DUNS) identifier that makes it possible to track its sales and employment over time at the SIC
8 level of Standard Industrial Classification (SIC) and at specific latitudes and longitudes. Industries can
be mapped into broader SIC 2 classifications or divisions, and locations can be mapped into ZIP codes,
counties, or Core-Based Statistical Areas (CBSAs). In addition, each line of business is also assigned a
headquarters (HQ) number that gives the particular enterprise to which it reports. Thus, the NETS data
encompass the universe of establishments operating in the U.S., and the enterprise to which each belongs,
between 1990 and 2014.
To better illustrate the nature of the NETS data, consider the case of Walmart as an example of an
enterprise. It is headquartered in Bentonville, AR, and in 2014, it is associated with approximately 4700
establishments across all 50 states. Each of these 4700 establishments is assigned its own 8−digit primary
SIC code, with 3718 establishments operating mainly as discount department stores (SIC 53119901), 603
establishments operating mainly as warehouse club stores (SIC 53999906), 241 establishments operating
primarily as grocery stores (SIC 54110000), and the remaining establishments scattered mostly across various
retail classifications.
Because each establishment in the NETS data is assigned a unique DUNS identifier, it is possible to
track when an establishment enters our sample (for those that enter after 1990) and, if applicable, when
it exits. In addition, the DUNS identifier follows each establishment over time even if it is sold from one
enterprise to another, or becomes included in a merger of enterprises, so that sales and employment of
particular establishments may be tracked irrespective of corporate-level changes.
Approximately a quarter of enterprises in the NETS data have only one employee. This feature of the
data is typically not accounted for by alternative government sources of local employment as estimated by
the County Business Patterns (CBP) or the Quarterly Census of Employment and Wages (QCEW).12 Since
these establishments nevertheless report positive sales, we include them in our benchmark analysis. In an
online-only supplement to this paper, we show that our results are robust to excluding enterprises with only
1, fewer than 5, or fewer than 10 employees.
At the 2−digit SIC code, the data is classified in terms of 11 divisions, including Manufacturing, Services,
Retail Trade, Wholesale Trade, and Finance, Insurance and Real Estate (FIRE), that together account for
approximately 85 percent of sales and 80 percent of employment respectively in 2014. Because our analysis
centers on the relationship between market concentration and the geographic expansion of enterprises, we
exclude from our benchmark exercises industries that are intrinsically tied to specific locations because of
weather or endowments of natural resources. These industries include Mining, Agriculture, Forestry, and
Fishing, Construction, and Transportation and Public Utilities. We also exclude from our benchmark analy-
12Many enterprises with one employee are non-employer enterprises, or in other words, have no paid employees. Whileemployment at those enterprises is then at times the result of imputations, Barnatchez, Crane, and Decker (2017) show thattaking out those imputations leaves measures of local employment that are generally highly correlated with those in the CBPacross industries.
6
sis any government establishment, including establishments belonging to enterprises whose headquarters are
associated with a public administration SIC code, and establishments associated with education, non-profit
endeavors, and central banking.
Throughout the analysis, we consider different levels of industrial and geographic disaggregation. The
most basic level of disaggregation we consider is defined as an SIC 8-ZIP code pair. The NETS data
cover 18, 000 SIC-8 industries and about 40, 000 ZIP codes. Because we omit particular industries whose
operations have intrinsic ties to geographic endowments, our sample includes 15, 305 industries. In each
year, we only use SIC 8-ZIP code pairs that have reported both positive sales and positive employment.
This leaves us with around 6 million SIC 8-ZIP code pairs for each year on average that we aggregate in
different ways below. Because we only consider in each year SIC 8-ZIP code pairs that have at least one
establishment with positive sales and employment, the number of industry-geography pairs at a given level
of aggregation (e.g. SIC 4-County) can vary from year to year. Below and in the online-only appendix, we
show that our results are robust to exercises that only consider industry-geography pairs that have at least
one establishment with positive sales and employment in every year. In the latter exercises, the number of
industry-geography pairs is constant across time.
Finally, a key advantage of NETS is that it allows researchers to bypass restrictive confidentiality rules
accompanying Census micro data. For example, NETS allows researchers to study the role of top firms,
such as Walmart or Cemex, something not feasible when working with Census data. As we show below, this
feature of NETS allows us to highlight the key role of large firms in driving the diverging trends between
national and local market concentration measures. In Section 4, we explore the quality of the NETS dataset
along various dimensions. We establish that, once appropriately confined to the sample of industries used
in this study, NETS compares favorably with the Census data.
2.1 Measuring Concentration
Establishments in our dataset are indexed by industry, i, location, `, and year, t. Industries are defined by
an SIC 8 code. Locations are defined by a latitude-longitude pair. We denote collections of industries into
broader classifications (for example, SIC 2 or divisions) by d. We denote collections of locations into broader
geographies (ZIP codes, CBSAs, Counties, States, or the whole U.S.) by g. When defining locations at the
CBSA level, counties that are not within CBSAs are not represented, which amounts to between 5 and 10
percent of establishments in any given year.
Let SI,Ge,i,`,t denote the nominal sales of enterprise e in industry i at location ` in year t, and SI,G
e,i,g,t =∑`∈g S
I,Ge,i,`,t its sales in the broader geography g (i.e. the sum of all its establishments’ sales across all latitude-
longitude pairs ` in geography g). The index I refers to the industrial level of aggregation (i.e. by SIC 2,
SIC 4, SIC 6, or SIC 8). The index G indicates the geographic level of aggregation (i.e. by ZIP code level,
CBSA level, County level, or the whole U.S.) that we use to define a location `. We then denote by sI,Ge,i,g,t
this enterprise’s share of all sales in industry i located in geography g at date t for the levels of aggregation
I and G. We adopt as our benchmark measure of market concentration the Herfindahl-Hirschman Index
7

(HHI),
CI,Gi,g,t =∑e
(sI,Ge,i,g,t
)2,
where CI,Gi,g,t ∈ [1/N I,G
i,g,t, 1] is the sales concentration, and N I,Gi,g,t the number of enterprises in industry i and
geography g at time t. In the online-only supplement to this paper, we also consider alternative measures of
concentration, such as the sales share of the top firm, or the adjusted Herfindahl, and show that all of our
findings are robust to these other measures. In particular, to the degree that the number of small firms in
an industry differs between NETS and CBP data, and that this difference were to have an increasing trend
that materially reduces the lower bound of the Herfindahl index, the range of the adjusted Herfindahl index
no longer depends on the number of firms.13
3 National and Local Market Concentration: The Facts
We organize the discussion of our findings into four main facts. The first two facts document the diverging
trends in national and local concentration and their importance across sectors and geographic definitions of
a ‘local’ market. The third and fourth facts document the role that large firms have played in these trends.
As a form of corollary to the last fact, we also present evidence specific to Walmart, a firm that has featured
prominently in the debate on the evolution of market concentration.
3.1 Fact 1: Diverging Trends on Average
Fact 1 is summarized in Figures (1) and (2). Figure (1) shows a weighted average of the change in con-
centration, ∆CI,Gt , across all industry-geography pairs (i, g) for different definitions of geography G, namely
ZIP code, County, CBSA, and the whole U.S.,
∆CI,Gt =∑i,g
wI,Gi,g,t∆C
I,Gi,g,t, (1)
where the weights wI,Gi,g,t are given by the employment shares of industry-geography (i, g) in aggregate em-
ployment in year t, and ∆CI,Gi,g,t denotes the change in market concentration between year t and the first
year for which we observe sales in the location-industry pair (i, g). As mentioned in Section 2, all findings
presented in this paper are robust to excluding enterprises with 1, fewer than 5, and fewer than 10 employ-
ees. In part, this is because, by construction, our employment-weighted measures of concentration already
assign small weights to industry-geography pairs that contain mostly small enterprises.14
13The adjusted Herfindahl is given by CI,Gi,g,t =
CI,Gi,g,t−1/NI,Gi,g,t
1−1/NI,Gi,g,t
∈ [0, 1] when NI,Gi,g,t > 1 and CI,G
i,g,t = 1 when NI,Gi,g,t = 1.
14Given differences in the number of firms and other industry characteristics, we study changes in HHI instead of the levelof the HHI, so that we can compare trends in concentration across industries. This is why we aggregate changes in the HHIinstead of aggregating levels of HHI. Using sales shares instead of employment shares as weights yields similar results.
8

As indicated in the 2016 CEA report, Barkai (2017), Gutierrez and Philippon (2017), and others, market
concentration at the national level has been steadily increasing since 1990. However, the exact opposite is
true for less aggregated measures of concentration. Figure (1) shows that the more geographically disaggre-
gated the measure of concentration, the more pronounced its downward trend over the last two and a half
decades.
Figure (2) shows a weighted average of the change in concentration across all industry-geography pairs
(i, g) within a particular division, d, namely Manufacturing, Services, Retail Trade, Wholesale Trade, and
FIRE, for geographies defined by ZIP code and the whole U.S.,
∆CI,Gt,d =∑i∈d,g
wI,Gi,g,t,d∆CI,Gi,g,t.
Figure (2) shows that while increasing market concentration at the national level holds broadly across all
divisions, it is equally the case that concentration has steadily fallen at the ZIP code level in these divisions.
Observe, in particular, that market concentration in the Retail Trade division has been increasing nationally
more than in any other division. However, Retail Trade is also among the divisions that show the steepest
decline in concentration at the ZIP code level. This fact is especially striking given that physical retail
establishments in our dataset are likely to have very local markets.
Figure 1: Diverging economy-wide national and local concentration trends
-.25
-.2-.1
5-.1
-.05
0.0
5A
vera
ge C
hang
e in
HH
I fro
m F
irst Y
ear
1990 1995 2000 2005 2010 2014Year
NationalCBSACountyZIP
9

Figure 2: Diverging division-level national and local concentration trends
-.25
-.2-.1
5-.1
-.05
0.0
5A
vera
ge C
hang
e in
HH
I fro
m F
irst Y
ear
1990 1995 2000 2005 2010 2014Year
ManufacturingWholesale Trade Retail Trade FIRE Services
National ZIP
3.1.1 Concentration by Industrial Classification and Employment
Figure (3) depicts the divergence between national and local concentration at the ZIP code level for different
degrees of industrial aggregation I. This growing divergence between national and local concentration is
most pronounced at the SIC 8 level but clearly present at lower levels of industrial aggregation as well,
including the most coarse SIC 2 classification. Thus, we explore below in more detail how these diverging
trends between national and local concentration are related to industrial classification.
Figure (4) repeats the exercise in Figure (3) but focusing on employment rather than sales. As the
figure shows, using employment rather than sales is immaterial for the growing divergence between national
and local concentration.15 In the online-only appendix, we show that all of our other findings regarding
diverging trends between national and local concentration also hold for employment as well as sales.
In summary, Figures (1) through (4) indicate a growing divergence in national and local concentration
that holds for broad levels of industrial and geographic definitions. In the online-only appendix, we carry
out and present a large number of exercises that highlight the robustness of our findings.16
15In the NETS data, establishment sales numbers are more frequently imputed than employment numbers. However, giventhat the CBP data does not report sales figures, the similarities in national and local concentration trends for sales andemployment in NETS are consistent with the notion that, for a given enterprise, increasing sales by opening new establishmentsin local markets requires hiring labor in those markets.
16 We also consider county and CBSA geographies, as well as the SIC 4 industrial classification code, that highlight respectivelythe importance of local markets and well defined industries.
10

Figure 3: Diverging economy-wide trends in sales concentration
-.15
-.1-.0
50
.05
Ave
rage
Cha
nge
in H
HI f
rom
Firs
t Yea
r
1990 1995 2000 2005 2010 2015Year
SIC 2SIC 4SIC 6SIC 8
National ZIP
Figure 4: Diverging economy-wide trends in employment concentration
-.15
-.1-.0
50
.05
Ave
rage
Cha
nge
in H
HI f
rom
Firs
t Yea
r
1990 1995 2000 2005 2010 2015Year
SIC 2SIC 4SIC 6SIC 8
National ZIP
11

3.1.2 Concentration and Sample Selection
Before proceeding with the analysis and an exploration of the roots underlying our basic Fact 1, we dis-
cuss an important aspect of this fact related to sample selection. In particular, because we omit in each
year industry-geography pairs with no establishments, the resulting unbalanced panel can create situations
where an industry-geography pair with a single establishment is dropped from one year to the next. Since
the omitted observation is one with a single establishment, and thus associated with high concentration,
local concentration decreases simply as a result of losing the observation. Conversely, of course, entry
has the opposite effect whereby new establishments in markets without a previous incumbent raise local
concentration.17
Figures (5) and (6) repeat the exercises in Figures (1) and (2) but only considering industry-geography
pairs where at least one establishment is present in every year. The resulting panel, therefore, is balanced.
Though slightly less pronounced, the divergence between national and local concentration trends remains
unequivocal. Furthermore, it is still the case that this divergence becomes more pronounced as one moves
towards more disaggregated definitions of local markets. It is also still the case that the divergence in
concentration trends is particularly evident in service industries, such as Retail and FIRE, which make up
the bulk of the U.S. economy.
Figure 5: Diverging economy-wide national and local concentration trends with a balanced panel
-.25
-.2-.1
5-.1
-.05
0.0
5A
vera
ge C
hang
e in
HH
I fro
m F
irst Y
ear
1990 1995 2000 2005 2010 2014Year
NationalCBSACountyZIP
In the online-only appendix, we show that these balanced-panel findings also hold for other measures
17See, for example, the argument and evidence presented in Ganapati (2018).
12

Figure 6: Diverging division-level national and local concentration trends with a balanced panel
-.25
-.2-.1
5-.1
-.05
0.0
5A
vera
ge C
hang
e in
HH
I fro
m F
irst Y
ear
1990 1995 2000 2005 2010 2014Year
ManufacturingWholesale Trade Retail Trade FIRE Services
National ZIP
of concentration such as the share of the largest firm or the adjusted Herfindahl. It is worth noting that,
for more disaggregated definitions of local markets, measures of concentration based on the sales share
of the largest X firms become less informative as X increases. The reason lies in strong selection issues.
Consider for instance a concentration measure based on the sales share of the top 4 firms. In that case,
measured concentration will necessarily be unchanged in all industry-geography pairs that have 4 or fewer
firms throughout the sample. However, at the SIC 8-ZIP code level, 90 percent of observations turn out to
have 3 firms or fewer and 93 percent of observations have 4 firms or fewer. This case is especially misleading
if those pairs are increasingly moving from having 1 firm to 3 firms and concentration is actually falling.
For example, in the discount department store industry (which includes Walmart), of the ZIP codes that
had 1 firm in 1990 and at least 1 firm in 2014, 56 percent had at least 2 firms competing in 2014 but only
5 percent of those ZIP codes had more than 4 firms.
It emerges, therefore, that one has to be cautious when measuring concentration at local levels. Since
industry-geography pairs with 4 or fewer firms represent the large majority of local markets, any study that
attempts to measure market concentration in disaggregated sectors and highly disaggregated geographies
using the share of the largest 4 firms faces strong measurement problems. Such studies (e.g. Ganapati 2018)
do not challenge the results in our paper or their interpretation.
13

3.2 Fact 2: Pervasive Diverging Trends
Fact 2 is presented in Figure (7). Within each SIC 2 classification, the figure gives a breakdown of employ-
ment in industries with different market concentration trends. In particular, for a given SIC 2 classification,
the height of each bar gives the percentage of employment in all industries within that classification that
have rising market concentration at the national level between 1990 and 2014. For each SIC 8 industry
i within an SIC 2 classification, we compute in each year ∆CI,Gi,t =
∑g w
I,Gi,g,t∆CI,G
i,g,t, where both g and G
denote the whole U.S., and regress ∆CI,Gi,t on t. The height of the bar then represents the percent of labor,
within that SIC 2 and across all years, employed in all SIC 8 industries with positive national concentration
time trends. Thus, the major part of U.S. employment resides in industries with rising national concentra-
tion across all SIC 2 classifications. Within a bar associated with a given SIC 2 classification in Figure (7),
the colors red, blue, and black represent, respectively, the percent of employment that resides in industries
with declining, rising, and flat market concentration at the ZIP code level.18
Figure (7) shows the pervasiveness of SIC 8 industries with diverging trends.19 That is, a substantive
share of employment resides in industries with rising market concentration at the national level and declining
market concentration at the ZIP code level. It also shows the heterogeneity in this share across SIC 2
divisions. For example, in SIC 2 53, which includes General Merchandise Stores, virtually all employment
resides in SIC 8 industries with diverging trends (96.38%). In contrast, in SIC 2 21, which includes Tobacco
Products, none of the SIC 8 industries exhibit a positive national trend and a negative local trend. Diverging
trends are more pronounced in Retail, FIRE and Services, than in Wholesale Trade and Manufacturing,
though still very much present in the latter two divisions.
The proportion of aggregate U.S. employment located in all SIC 8 industries with increasing national
market concentration and decreasing ZIP code level market concentration is 43 percent. Thus, given that
some industries have also had declining concentration at both the national and ZIP code level, 78 percent
(or over 3/4) of U.S. employment resides in industries with declining local market concentration.20
3.3 Fact 3: The Role of Top Firms
Fact 3 explores the contribution that top firms –in terms of sales share– have made to the diverging trends
in each SIC 8 industry. Figures (8) and (9) focus on just those industries whose market concentration
has increased at the national level since 1990, represented by the height of the bars in Figure (7). Those
industries account for roughly half of all industries in our sample, 61% of aggregate U.S. employment, and
67% of aggregate sales.
Within that set of SIC 8 industries, Figure (8) focuses on those that exhibit negative local concentration
trends. These industries account for 72% of total employment in industries with positive national trend (66%
18Specifically, in the calculation of ∆CI,Gi,t =
∑g w
I,Gi,g,t∆CI,G
i,g,t, both g and G now represent a ZIP code.19We reserve the term of ‘diverging trends’ for a case of positive national trend and a negative local trend. The case of a
negative national trend and a positive local trend is also possible, though much less common in virtually all industries.20The share of national sales in sectors with decreasing local market concentration is 72%.
14

Figure 7: Pervasive diverging trends across 2-digit sectors
020
4060
8010
0Pe
rcen
t of E
mpl
oym
ent i
n SI
C 2
Retail Trade FIRE Services Wholesale Trade Manufacturing53 55 56 54 57 59 52 58 60 65 61 67 63 62 64 83 86 72 88 78 75 70 76 80 79 87 73 81 89 84 50 51 26 30 38 36 32 33 37 24 34 27 35 28 20 22 31 39 23 25 29 21
Percent of Employment in SIC 8s with Increasing National and ZIP TrendsPercent of Employment in SIC 8s with Increasing National and Decreasing ZIP TrendsPercent of Employment in SIC 8s with Increasing National and Zero ZIP Trends
of sales). The figure presents in solid orange and solid red, respectively, the national HHI and the local ZIP
code level HHI among these industries. Given our industry selection, the national concentration (orange)
line is increasing by construction and the local concentration (red) line is decreasing by construction. The
dashed orange and dashed red lines in that figure depict the same objects but excluding the top enterprise
in each SIC 8 industry as measured by sales in 2014.21 We consider only industry-geography pairs (i, g) for
which i’s top enterprise has at least one establishment present in g in at least one year. Furthermore, because
we are interested in isolating the effect of the top enterprise on market concentration, among those remaining
industry-geography pairs, we then only include observations (i, g, t) where at least one establishment remains
after dropping the top enterprise in i and its associated establishments.22
Figure (8) shows that among SIC 8 industries with diverging trends, excluding the top firm results in
a national concentration trend that is less pronounced. The fact that large firms have contributed to the
national increase in concentration is as expected. More surprising is the observation that the top firms
have also contributed to the decline in local concentration. Figure (8) shows that when we exclude the top
firm, the negative trend in ZIP-code-level concentration is less pronounced. Hence, the top firm (and more
21We show in the online-only appendix that we obtain similar results when we exclude the top 3 firms rather than only thetop firm.
22We also exclude industry-geography pairs whose first year of observed sales results from only one establishment belongingto the top enterprise, since the change in market concentration cannot be computed in that case.
15
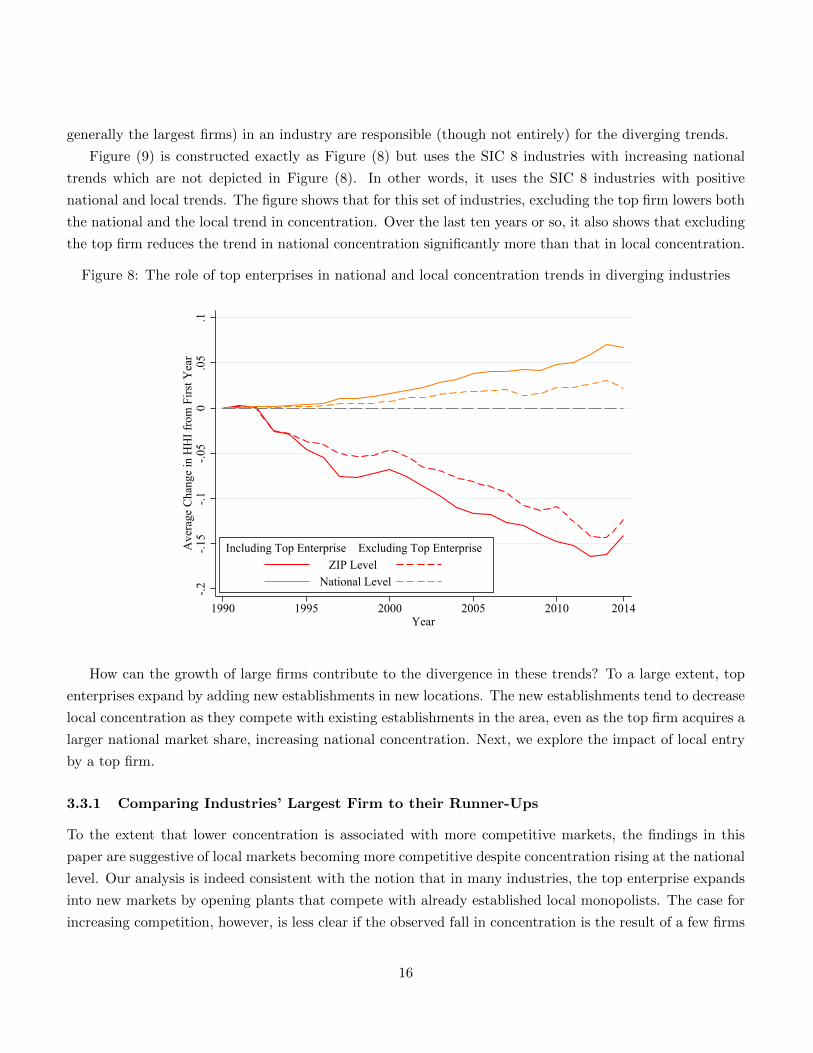
generally the largest firms) in an industry are responsible (though not entirely) for the diverging trends.
Figure (9) is constructed exactly as Figure (8) but uses the SIC 8 industries with increasing national
trends which are not depicted in Figure (8). In other words, it uses the SIC 8 industries with positive
national and local trends. The figure shows that for this set of industries, excluding the top firm lowers both
the national and the local trend in concentration. Over the last ten years or so, it also shows that excluding
the top firm reduces the trend in national concentration significantly more than that in local concentration.
Figure 8: The role of top enterprises in national and local concentration trends in diverging industries
-.2-.1
5-.1
-.05
0.0
5.1
Ave
rage
Cha
nge
in H
HI f
rom
Firs
t Yea
r
1990 1995 2000 2005 2010 2014Year
ZIP Level National Level
Including Top Enterprise Excluding Top Enterprise
How can the growth of large firms contribute to the divergence in these trends? To a large extent, top
enterprises expand by adding new establishments in new locations. The new establishments tend to decrease
local concentration as they compete with existing establishments in the area, even as the top firm acquires a
larger national market share, increasing national concentration. Next, we explore the impact of local entry
by a top firm.
3.3.1 Comparing Industries’ Largest Firm to their Runner-Ups
To the extent that lower concentration is associated with more competitive markets, the findings in this
paper are suggestive of local markets becoming more competitive despite concentration rising at the national
level. Our analysis is indeed consistent with the notion that in many industries, the top enterprise expands
into new markets by opening plants that compete with already established local monopolists. The case for
increasing competition, however, is less clear if the observed fall in concentration is the result of a few firms
16

Figure 9: The role of top enterprises in national and local concentration trends in concentrating industries
-.1-.0
50
.05
.1.1
5A
vera
ge C
hang
e in
HH
I fro
m F
irst Y
ear
1990 1995 2000 2005 2010 2014Year
ZIP Level National Level
Including Top Enterprise Excluding Top Enterprise
entering several markets. As discussed in Bernheim and Whinston (1990), and Bond and Syropoulos (2008),
when firms compete in multiple markets simultaneously, the potential for collusion can grow since these
firms’ ability to punish any deviation can be enhanced by their multiple ‘contacts’ across markets. Hence,
increasing national concentration resulting from the increasingly large positions of two or three enterprises
in an industry can result in declines in local concentration, more local contacts between competitors, and a
rise in the ability to collude and thus effective market power of the largest firms. If, in contrast, increasing
national concentration results from the gradual expansion of a single top firm competing with local firms, a
decline in local concentration will be associated with reductions in market power in those local markets.
To gain insight into the role of the largest enterprise in a given industry relative to that of the largest 2
or 3 enterprises, Figure (10) repeats the exercise in Figure (8) but excluding the second and third largest
enterprise instead of the top enterprise. For industries where national and local concentration trends diverge,
excluding the second and third largest enterprises results in an increase in concentration at the local level
as in Figure (8). Thus, as with the top enterprise, when the second and third largest enterprises enter
new geographical markets, local concentration falls. However, unlike Figure (8), excluding the second and
third largest enterprises increases national concentration. Put another way, unlike the top enterprise, the
second and third largest enterprises contribute to reducing concentration at the national level. This finding
is inconsistent with the view that the largest 2 or 3 enterprises are responsible for a simultaneous rise in
national concentration and decline in local concentration as they expand in new untested markets. Instead,
Figure (8) shows that entry of the the second and third largest enterprises leads to overall declines in
17

concentration as with any other less dominant firm.
Figure 10: The role of the second and third largest enterprises in diverging industries
-.25
-.2-.1
5-.1
-.05
0.0
5.1
Ave
rage
Cha
nge
in H
HI f
rom
Firs
t Yea
r
1990 1995 2000 2005 2010 2014Year
ZIP Level National Level
Incl. 2nd & 3rd Ranked Enterprises Excl. 2nd & 3rd Ranked Enterprises
Analogous to Figure (10), Figure (11) repeats the exercise in Figure (9) for cases where both national
and local concentration have been rising but excluding the second and third largest enterprises instead of the
top enterprise. Comparisons with Figure (9) make it even more apparent that the second and third largest
firms have an impact that on average differs from that of the most dominant enterprise across industries. In
Figure (11), we see that the second and third largest enterprises contribute to lowering concentration both
at the national and local level whereas the most dominant enterprise in Figure (9) contributes to higher
concentration nationally.
Figures (12) helps further contrast the way in which, across industries, the dominant enterprises have
expanded geographically relative to the next two largest enterprises. Specifically, the solid line in Figure
(12) shows the proportion of SIC 8-ZIP code pairs, weighted by employment associated with that pair,
where the dominant enterprise has at least one establishment. This proportion steadily increased from 5.4
percent in 1990 to 15.5 percent in 2014. In other words, on average across industries, the largest enterprise
has unambiguously and steadily expanded into new local markets over the last 25 years. The dashed line
in Figure (12) depicts the proportion of SIC 8-ZIP code pairs where not only the largest enterprise but
also the second and third largest enterprises have at least one establishment. While the dashed line has
gradually increased over the last 25 years, it has done so at a considerably slower rate than the solid line.
Put differently, the difference between the two lines represents the proportion of SIC 8-ZIP code pairs in the
U.S. where the top enterprise is competing with smaller firms rather than its next two largest competitors,
18

Figure 11: The role of the second and third largest enterprises in concentrating industries
-.1-.0
50
.05
.1.1
5A
vera
ge C
hang
e in
HH
I fro
m F
irst Y
ear
1990 1995 2000 2005 2010 2014Year
ZIP Level National Level
Incl. 2nd & 3rd Ranked Enterprises Excl. 2nd & 3rd Ranked Enterprises
Figure 12: Expansion of Top Enterprises into ZIP Codes
02.
55
7.5
1012
.515
Perc
ent
1990 1995 2000 2005 2010 2015Year
Percent Containing Largest EnterprisePercent Containing Largest and Second and/or Third Largest Enterprises
19

and this difference has itself gotten markedly larger over the last three decades.
3.4 Fact 4: When a Top Firm Comes to Town
To further illustrate the impact of an industry’s top enterprise on market concentration at the local level,
Figures (13) and (14) present an event study describing the effect of local entry by an establishment asso-
ciated with a top firm (defined by 2014 sales in an SIC 8 industry as in Fact 3) in a ZIP code. Specifically,
Figures (13) and (14) examine the effect of a top firm opening a new establishment in a ZIP code on local
market concentration. The calculations here mimic those in Figures (9) and (8). In Figures (13) and (14),
the x−axis plots a 10−year window surrounding a top firm establishment opening in a given ZIP code, with
0 denoting the opening year. To better highlight the net effect of entry on concentration, we normalize the
change in concentration to zero in the year prior to the establishment opening.
Figure (13) depicts the event study for all SIC 8 industries with increasing market concentration at the
national level and decreasing local market concentration, that is, SIC 8 industries with diverging trends.
Figure (14) illustrates findings for the remaining SIC 8 industries with increasing national concentration:
those where both national and local trends are positive over our sample period. The solid lines in both
figures present the evolution of the HHI index when the entering establishment is included; the dashed lines
illustrate the same object when excluding the opening establishment owned by the top enterprise within
each industry.
Among industries with diverging trends, the opening of an establishment in a ZIP code is associated
with a fall in market concentration. Moreover, this fall persists at about the same size for at least 7 years
after the event. In contrast, among industries with increasing local market concentration, the opening of an
establishment leads to a temporary decrease in market concentration but one that reverses quickly. After
4 to 5 years, concentration is higher than it would have been absent the opening. Hence, in the former
case, the establishment owned by the top enterprise does not become dominant, while in the latter case it
eventually dwarfs the establishments of other firms. The data suggest that on the whole, the case where
the top firm does not become dominant at the local level is markedly more relevant.23
The dashed lines in both Figures (13) and (14) suggest that when all shares are re-calculated excluding
sales of the opening establishment belonging to the top enterprise in each industry, market concentration
does not exhibit a significant trend over the entire 10−year window. Thus, the dashed-lines lend credibility
to a central assumption underlying the event study, namely that entry by a top enterprise in a local market
is the main event affecting concentration in each market.
23Neumark, Zhang and Wall (2006) and Barnatchez, Crane and Decker (2017) argue that NETS dataset might at times beslow in reporting the entry and exit of small firms. Given their findings, one might question the extent to which our results aredriven by the exit of small firms not being reported accurately. However, the fact that the fall in the HHI persists for up to 7years diminishes this potential concern.
20
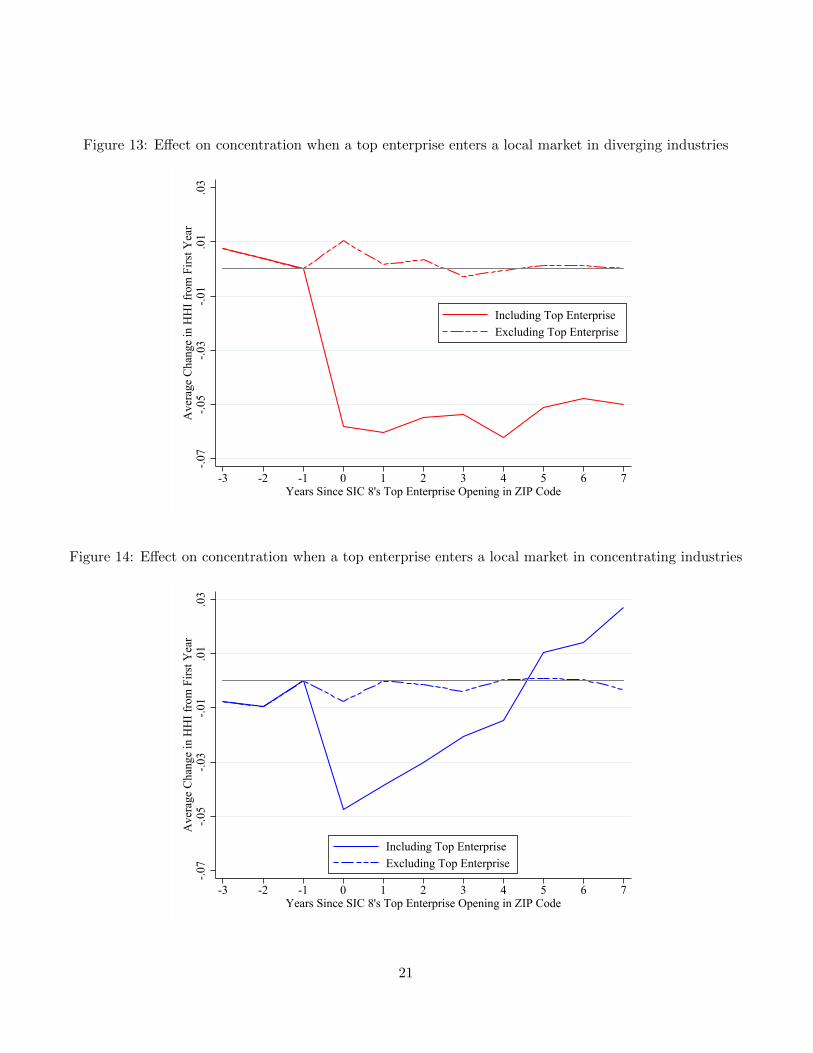
Figure 13: Effect on concentration when a top enterprise enters a local market in diverging industries
-.07
-.05
-.03
-.01
.01
.03
Ave
rage
Cha
nge
in H
HI f
rom
Firs
t Yea
r
-3 -2 -1 0 1 2 3 4 5 6 7Years Since SIC 8's Top Enterprise Opening in ZIP Code
Including Top EnterpriseExcluding Top Enterprise
Figure 14: Effect on concentration when a top enterprise enters a local market in concentrating industries
-.07
-.05
-.03
-.01
.01
.03
Ave
rage
Cha
nge
in H
HI f
rom
Firs
t Yea
r
-3 -2 -1 0 1 2 3 4 5 6 7Years Since SIC 8's Top Enterprise Opening in ZIP Code
Including Top EnterpriseExcluding Top Enterprise
21
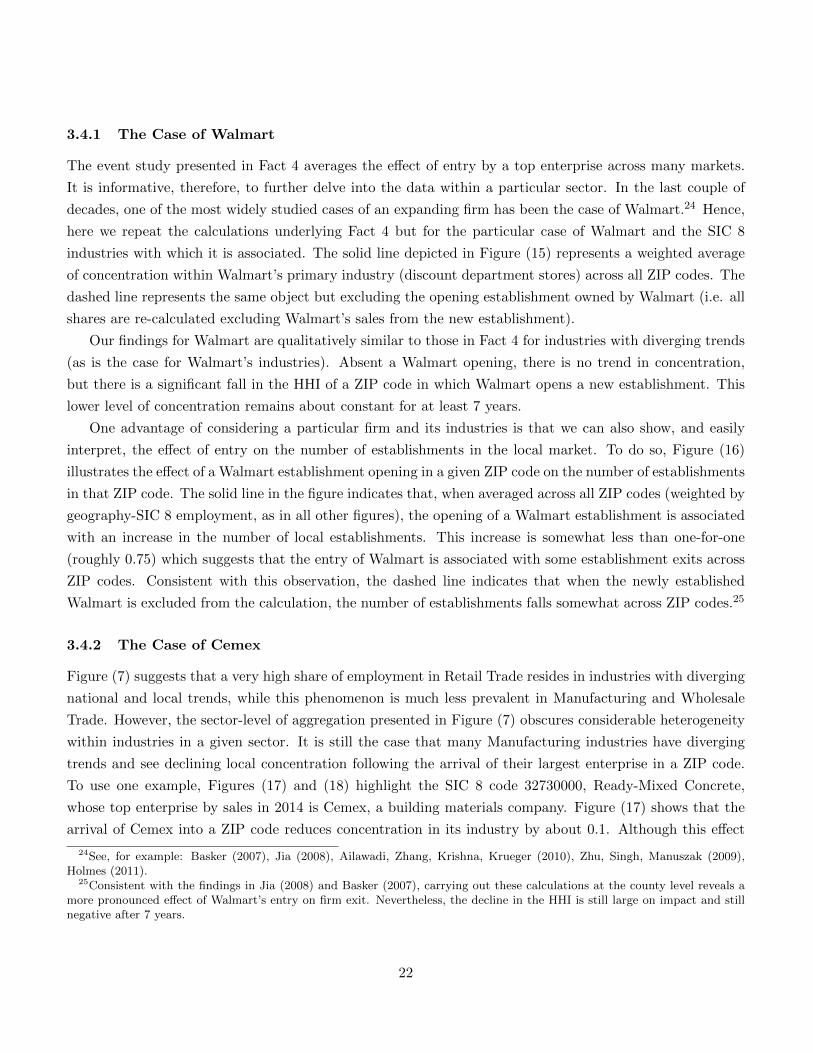
3.4.1 The Case of Walmart
The event study presented in Fact 4 averages the effect of entry by a top enterprise across many markets.
It is informative, therefore, to further delve into the data within a particular sector. In the last couple of
decades, one of the most widely studied cases of an expanding firm has been the case of Walmart.24 Hence,
here we repeat the calculations underlying Fact 4 but for the particular case of Walmart and the SIC 8
industries with which it is associated. The solid line depicted in Figure (15) represents a weighted average
of concentration within Walmart’s primary industry (discount department stores) across all ZIP codes. The
dashed line represents the same object but excluding the opening establishment owned by Walmart (i.e. all
shares are re-calculated excluding Walmart’s sales from the new establishment).
Our findings for Walmart are qualitatively similar to those in Fact 4 for industries with diverging trends
(as is the case for Walmart’s industries). Absent a Walmart opening, there is no trend in concentration,
but there is a significant fall in the HHI of a ZIP code in which Walmart opens a new establishment. This
lower level of concentration remains about constant for at least 7 years.
One advantage of considering a particular firm and its industries is that we can also show, and easily
interpret, the effect of entry on the number of establishments in the local market. To do so, Figure (16)
illustrates the effect of a Walmart establishment opening in a given ZIP code on the number of establishments
in that ZIP code. The solid line in the figure indicates that, when averaged across all ZIP codes (weighted by
geography-SIC 8 employment, as in all other figures), the opening of a Walmart establishment is associated
with an increase in the number of local establishments. This increase is somewhat less than one-for-one
(roughly 0.75) which suggests that the entry of Walmart is associated with some establishment exits across
ZIP codes. Consistent with this observation, the dashed line indicates that when the newly established
Walmart is excluded from the calculation, the number of establishments falls somewhat across ZIP codes.25
3.4.2 The Case of Cemex
Figure (7) suggests that a very high share of employment in Retail Trade resides in industries with diverging
national and local trends, while this phenomenon is much less prevalent in Manufacturing and Wholesale
Trade. However, the sector-level of aggregation presented in Figure (7) obscures considerable heterogeneity
within industries in a given sector. It is still the case that many Manufacturing industries have diverging
trends and see declining local concentration following the arrival of their largest enterprise in a ZIP code.
To use one example, Figures (17) and (18) highlight the SIC 8 code 32730000, Ready-Mixed Concrete,
whose top enterprise by sales in 2014 is Cemex, a building materials company. Figure (17) shows that the
arrival of Cemex into a ZIP code reduces concentration in its industry by about 0.1. Although this effect
24See, for example: Basker (2007), Jia (2008), Ailawadi, Zhang, Krishna, Krueger (2010), Zhu, Singh, Manuszak (2009),Holmes (2011).
25Consistent with the findings in Jia (2008) and Basker (2007), carrying out these calculations at the county level reveals amore pronounced effect of Walmart’s entry on firm exit. Nevertheless, the decline in the HHI is still large on impact and stillnegative after 7 years.
22

Figure 15: Effect on concentration when Walmart enters a local market
-.15
-.1-.0
50
.05
Ave
rage
Cha
nge
in H
HI f
rom
Firs
t Yea
r
-3 -2 -1 0 1 2 3 4 5 6 7Years Since Walmart Opening in ZIP
With Walmart EnteringWithout Walmart Entering
Figure 16: Effect on number of establishments when Walmart enters a local market
22.
53
3.5
Ave
rage
Num
ber o
f Est
ablis
hmen
ts in
ZIP
-3 -2 -1 0 1 2 3 4 5 6 7Years Since Walmart Opening in ZIP
With Walmart EnteringWithout Walmart Entering
23

dissipates after 7 years, concentration measured excluding Cemex remains higher than it otherwise would
when included so that this company is still contributing to lower local concentration. Figure (18) shows
that, as with the case of Walmart, while some existing establishments do exit when Cemex opens a plant,
the overall number of establishments in the ZIP-industry pair rises on average. Although Syverson (2008)
documents increasing national concentration within this industry, consistent with our findings, Syverson
(2004) and Syverson (2008) also argue that high transport costs make local measures of concentration more
relevant. In this paper, we show that these more local measures exhibit a downward trend.
Figure 17: Effect on concentration when Cemex enters a local market
-.15
-.1-.0
50
.05
.1A
vera
ge C
hang
e in
HH
I fro
m F
irst Y
ear
-3 -2 -1 0 1 2 3 4 5 6 7Years Since Cemex Opening in ZIP
With Cemex EnteringWithout Cenex Entering
4 The NETS Data
One important advantage of the NETS data is that it covers every establishment in the U.S. at an exception-
ally high level of disaggregation both by industry and geographic area. Unlike the comparable microdata
available from the Census Bureau which produces the County Business Patterns (CBP) data, NETS does
not require that a research proposal be approved describing how the data is to be used. It also does not
require that an approved researcher travel to the location of a Federal Statistical Research Data Center (FS-
RDC) for secure access or compliance with the disclosure process to protect sensitive information. NETS
data only require a subscription fee and can be easily accessed on any machine without undergoing a formal
review process.
A critical feature of the NETS data is that NETS allows researchers to examine and illustrate the
24

Figure 18: Effect on number of establishments when Cemex enters a local market
1.5
22.
53
3.5
Ave
rage
Num
ber o
f Est
ablis
hmen
ts in
ZIP
-3 -2 -1 0 1 2 3 4 5 6 7Years Since Cemex Opening in ZIP
With Cemex EnteringWithout Cemex Entering
impact of individual enterprises, such as Walmart in the discount department stores industry, or Cemex in
the ready-mix concrete industry. This feature of NETS is integral to our analysis in that it permits us to
explore and disclose the extent to which findings on concentration are driven by specific and large enterprises
in individual industries. This defining characteristic of NETS, which we exploit in this paper, thus permits
explorations that would otherwise be infeasible with Census data.
Evidently, to the degree that NETS allows us flexibility not permitted with Census data, it is important
to benchmark how the two datasets compare. Barnatchez, Crane, and Decker (2017) note that NETS include
many non-employer establishments not covered by the CBP which tend to be very small establishments.
When removing establishments with 1 employee or fewer than 5 employees, they find that overall trends in
employment and establishments counts are closely aligned with the CBP. They suggest, therefore, verifying
that findings using NETS data are robust to these sample restrictions. Barnatchez et al. (2017) also observe
that differences between NETS and Census data are largely related to discrepancies in Agriculture, Mining,
and Construction. In particular, in the latter two sectors, NETS appears to not have captured the full extent
of recent employment changes. These include changes resulting from the boom-bust cycles associated with
the shale-oil and gas expansion in the early 2000s for mining, and the bursting of the housing bubble in 2007
for construction. As mentioned above, our analysis excludes these sectors in any case since their activity is
intrinsically tied to local geographic characteristics.
To get an idea of the differences between NETS and the CBP, Figure (19) illustrates standardized (i.e.
set to 1 in 1990) aggregate employment in the NETS database and the CBP. Unlike Barnatchez et al.
25

(2017), we remove from both datasets the set of industries described above, and thus we restrict to the 5
major sectors used in this study: FIRE, Manufacturing, Retail, Services, and Wholesale trade. Consistent
with their observations, in the NETS data, we plot standardized employment when including all enterprises
as well as when excluding, in each year, enterprises with 1, fewer than 5, and fewer than 10 employees. As
shown in the figure, the NETS data line up almost identically with the CBP data up to around 2002.26
Small differences arise after that year though all series appear to flatten out. Of note, almost throughout the
sample, CBP employment lies in between employment excluding 1 and fewer than 5 employees in the NETS
data. The difference in the sampling of small firms between NETS and the Census noted in Barnatchez
et al. (2017), therefore, appears bounded by these two cases. In an online-only appendix, we show that
all findings in this paper hold for all NETS cases shown in Figure (19). Moreover, as described above,
all weighted average estimates in this study are weighted by employment so that, by construction, any
differences in the sampling of small firms after 2002 are also given small weight. Observe also that higher
frequency changes in Census data, such as the dip in employment following the Great Recession, are present
in the various NETS cases shown in Figure (19). Evidently, differences in sampling between NETS and the
Census manifest themselves mainly as a level effect after 2002.
Figure 19: Standardized National Employment in CBP and NETS Data
.5.7
51
1.25
1.5
Stan
dard
ized
Em
ploy
men
t
1990 1995 2000 2005 2010 2015Year
Including All NETS EnterprisesExcluding NETS Enterprises with 1 EmployeeExcluding NETS Enterprises with Fewer than 5 EmployeesExcluding NETS Enterprises with Fewer than 10 EmployeesCBP
26Barnatchez et al. (2017) also raise the issue of imputation in NETS. As a practical matter, this issue is a more generalone that can arise even in Census data. For example, White, Reiter, and Petrin (2018) indicate that in the 2002 Censusof Manufactures, more than 3/4 of observations have imputed data for at least one variable used to compute total factorproductivity. For robustness, however, we show in the Technical Appendix that the results herein are robust to using onlynon-imputed NETS data, which in this case consists of employment for a subset of establishments.
26

While differences between NETs and the CBP primarily result from the sampling of small firms, a
question arises as to whether these differences might have grown over time. To explore this question, Figure
(20a) illustrates the cross-sectional correlation between CBP and NETS total employment across counties in
each year of our sample, for the 5 major sectors used in this study: FIRE, Manufacturing, Retail, Services,
and Wholesale trade. The correlation is high at above 0.98 in every year irrespective of the definition
we adopt for the NETS data (i.e. enterprises with 1, fewer than 5, and fewer than 10 employees). More
importantly, to the extent that differences exist, for the set of industries we consider, there is no obvious time
trends in those differences. The CBP data allows us to construct these correlations industry by industry only
at the county level, where these are very close, but not at the ZIP code level. At the more geographically
disaggregated ZIP code level, the CBP only reports aggregate ZIP code employment without any industry
breakdown. Consequently, we are not able to remove particular industries such as Agriculture, Mining, or
Construction when comparing ZIP code level data between NETS and the CBP. However, even with those
industries included, Figure (20b) shows that the correlation between ZIP code employment in NETS versus
the CBP remains above 0.85 in every year. As with the county level data, to the extent that this correlation
is not exactly 1 and that differences exist between the two datasets, there is no trend in the way that ZIP
code employment differs between NETS and the CBP.
In summary, our findings are consistent with those of Barnatchez et al. (2017) who find differences
between NETS and Census data related to the sampling of small firms. As the authors suggest, these
differences appear to be bounded by exercises that remove small firms. Specifically, we find that standardized
CBP employment is bounded by cases that remove firms with 1 and fewer than 5 employees in the NETS
data. Moreover, our analysis removes industries identified by Barnatchez et al. (2017) as those least closely
matching employment in the CBP, though we remove them for different reasons as explained above. Finally,
while there appears to be an increase in the difference between CBP and NETS employment starting in
2002, this discrepancy emerges mainly as one time change with no visible trends after 2002. All of these
observations, therefore, suggest that any findings related to aggregate or industry-wide estimates that we
discuss above cannot be driven by the scope or coverage of the two datasets.
5 Conclusions
We have shown, by way of four main facts, that the increase in market concentration observed at the
national level over the last 25 years is being shaped by enterprises expanding into new local markets. This
expansion into local markets is accompanied by a fall in local concentration as firms open establishments in
new locations. These observations are suggestive of more, rather than less, competitive markets.27
The findings in this paper potentially help reconcile the observation of increasing concentration at the
national level and the more mixed evidence on increasing markups and profits. Almost no theory of product
27Hsieh and Rossi-Hansberg (2020) show, using Census data, that these and other complementary patterns are particularlypronounced in service sectors. They argue that this evolution is the result of a new Industrial Revolution in Services that hasallowed top service firms to replicate in space and access smaller, more marginal, markets at a lower cost.
27

Figure 20: County and ZIP-Level Correlations Between NETS and CBP Employment
0.2
5.5
.75
1C
orre
latio
n C
oeff
icie
nt
1990 1995 2000 2005 2010 2015Year
Including All NETS EnterprisesExcluding NETS Enterprises with 1 EmployeeExcluding NETS Enterprises with Fewer than 5 EmployeesExcluding NETS Enterprises with Fewer than 10 Employees 0
.25
.5.7
51
Cor
rela
tion
Coe
ffic
ient
1995 2000 2005 2010 2015Year
Including All NETS EnterprisesExcluding NETS Enterprises with 1 EmployeeExcluding NETS Enterprises with Fewer than 5 EmployeesExcluding NETS Enterprises with Fewer than 10 Employees
market competition associates decreasing concentration with either increasing markups or increasing profits.
One exception resides in theories of multi-market collusion where a few firms competing in many markets
can have enhanced opportunities to collude. Although this form of collusion could be important in specific
industries, we show that an expanding top firm competing with local producers is a much more common
occurrence. Thus, our facts indicate that the rising trend in national concentration is not, in and of itself,
necessarily a concern for anti-trust policy. By decreasing local concentration, the growth of top firms has
likely increased local competition in many industries and, therefore, helped improve the quality and reduce
the prices of much of what we buy.
References
[1] Ailawadi, Kusum L., Aradhna Krishna, Michael W. Kruger, and Jie Zhang. 2010. “When
Wal-Mart Enters: How Incumbent Retailers React and How This Affects Their Sales Outcomes.”
Journal of Marketing Research. 47 (4): 577-93.
[2] Anderson, Eric, Sergio Rebelo, and Arlene Wong. 2018. “Markups Across Space and Time.”
NBER Working Paper 24434.
[3] Autor, David, David Dorn, Lawrence F. Katz, Christina Patterson, and John Van Reenen.
2017. “The Fall of the Labor Share and the Rise of Superstar Firms.” NBER Working Paper 23396.
[4] Azar, Jose, Ioana Marinescu, and Marshall Steinbaum. 2019. “Labor Market Concentration.”
NBER Working Paper 24147.
[5] Barkai, Simcha. 2017. “Declining Labor and Capital Shares.” Working paper.
28

[6] Barnatchez, Keith, Leland D. Crane, and Ryan A. Decker. 2017. “An Assessment of the
National Establishment Time Series (NETS) Database.” Finance and Economics Discussion Series
2017-110.
[7] Basker, Emek. 2007. “The Causes and Consequences of Wal-Mart’s Growth.” Journal of Economic
Perspectives 21 (3): 177-98.
[8] Benmelech, Efraim, Nittai Bergman, and Hyunseob Kim. 2018. “Strong Employers and Weak
Employees: How Does Employer Concentration Affect Wages?” NBER Working Paper 24307.
[9] Berger, David, Kyle Herkenhoff, and Simon Mongey. 2019. “Labor Market Power.” Working
Paper.
[10] Bernheim, B. Douglas, and Michael D. Whinston. 1990. “Multimarket Contact and Elusive
Behavior.” The RAND Journal of Economics. 21 (1): 1-26.
[11] Bond, Eric W., and Constantinos Syropoulos. 2008. “Trade Costs and Multimarket Collusion.”
The RAND Journal of Economics. 39 (4): 1080-1104.
[12] Decker, Ryan A., John Haltiwanger, Ron S. Jarmin, and Javier Miranda. 2017. “Declin-
ing Dynamism: Allocative Efficiency, and the Productivity Slowdown.” American Economic Review:
Papers & Proceedings. 107 (5): 322-6.
[13] De Loecker, Jan, and Jan Eeckhout. 2018. “Global Market Power.” NBER Working Paper 24768.
[14] De Loecker, Jan, Jan Eeckhout, and Gabriel Unger. 2018. “The Rise of Market Power and the
Macroeconomic Implications.” Working Paper.
[15] Edmond, Chris, Virgiliu Midrigan, and Daniel Yi Xu. 2018. “How Costly are Markups?” NBER
Working Paper 24800.
[16] Ganapati, Sharat. 2018. “Growing Oligopolies, Prices, Output, and Productivity.” Working paper.
[17] Gutierrez, German, and Thomas Philippon. 2017. “Declining Competition and Investment in
the U.S.” NBER Working Paper 23583.
[18] Hall, Robert E. 2018. “New Evidence on the Markup of Prices Over Marginal Costs and the Role of
Mega-Firms in the US Economy.” NBER Working Paper 24574.
[19] Hershbein, Brad, Claudia Macaluso, and Chen Yeh. 2018. “Concentration in U.S. Local Labor
Markets: Evidence from Vacancy and Employment Data.” Working paper.
[20] Holmes, Thomas J. 2011. “The Diffusion of Wal-Mart and Economics of Density.” Econometrica 79
(1): 253-302.
29

[21] Hopenhayn, Hugo, Julian Neira, and Rish Singhania. 2018. “From Population Growth to Firm
Demographics: Implications for Concentration, Entrepreneurship and the Labor Share.” NBER Work-
ing Paper 25382.
[22] Hsieh, Chang-Tai, and Esteban Rossi-Hansberg. 2020. “The Industrial Revolution in Services.”
Working paper.
[23] Jia, Panle. 2008. “What Happens When Wal-Mart Comes to Town: An Empirical Analysis of the
Discount Retailing Industry.” Econometrica 76 (6): 1263-1316.
[24] Karabarbounis, Loukas, and Brent Neiman. 2018. “Accounting for Factorless Income.” NBER
Working Paper 24404.
[25] Neumark, David, Junfu Zhang, and Brandon Wall. 2006. “Employment Dynamics and Business
Relocation: New Evidence from the National Establishment Time Series.” NBER Working Paper 11647.
[26] Qiu, Yue, and Aaron Sojourner. 2019. “Labor-Market Concentration and Labor Compensation.”
IZA Discussion Paper 12089.
[27] Rinz, Kevin. 2018. “Labor Market Concentration, Earnings Inequality, and Earnings Mobility.” Cen-
ter for Administrative Records Research and Applications Working Paper 2018-10.
[28] Syverson, Chad. 2019. “Macroeconomics and Market Power: Facts, Potential Explanations and Open
Questions.” Brookings Institution working paper.
[29] Syverson, Chad. 2008. “Markets: Ready-Mixed Concrete.” Journal of Economic Perspectives 22 (1):
217-33.
[30] Syverson, Chad. 2004. “Market Structure and Productivity: A Concrete Example.” Journal of Po-
litical Economy, 112 (6): 1181-1222.
[31] Traina, James. 2018. “Is Aggregate Market Power Increasing? Production Trends Using Financial
Statements.” Stigler Center New Working Paper Series No. 26.
[32] Walls & Associates. 2014. “National Establishment Time-Series (NETS) Database.”
[33] White, T. Kirk, Jerome P. Reiter, and Amil Petrin. 2018. “Imputation in U.S. Manufacturing
Data and Its Implications for Productivity Dispersion.” The Review of Economics and Statistics 100
(3): 502-509.
[34] Zhu, Ting, Vishal Singh, and Mark D. Manuszak. 2009. “Market Structure and Competition in
the Retail Discount Industry.” Journal of Marketing Research. 46 (4): 453-66.
30