district report marigaon
TRANSCRIPT

1
Baseline Survey of Minority Concentrated Districts
District Report
MARIGAON
Study Commissioned by Ministry of Minority Affairs
Government of India
Study Conducted by
Omeo Kumar Das Institute of Social Change and Development: Guwahati
VIP Road, Upper Hengerabari, Guwahati 781036

2
ommissioned by the Ministry of Minority Affairs, this Baseline Survey was planned for 90 minority concentrated districts (MCDs)
identified by the Government of India across the country, and the Indian Council of Social Science Research (ICSSR), New Delhi coordinates the entire survey. Omeo Kumar Das Institute of Social Change and Development, Guwahati has been assigned to carry out the Survey for four states of the Northeast, namely Assam, Arunachal Pradesh, Meghalaya and Manipur. This report contains the results of the survey for Marigaon district of Assam. The help and support received at various stages from the villagers, government officials and all other individuals are most gratefully acknowledged. ■ Omeo Kumar Das Institute of Social Change and Development is an autonomous research institute of the ICSSR, New delhi and Government of Assam.
C
3
CONTENTS
BACKGROUND………………………………………………………………………………7 METHODOLOGY…………………………………………………………………………….8 TOOLS USED…………………………………………………………………………………9 DISTRICT PROFILE: MORIGAON ………………………………………………………10 2.1 AREA AND LOCATION....................................................................................................................... 10 2.2 ADMINISTRATIVE DIVISION ............................................................................................................ 10 2.3 RESOURCE BASE ................................................................................................................................ 10
2.3.1 Population ................................................................................................................................ 10 2.3.2 Sex Ratio ................................................................................................................................... 11 2.3.3 Literacy Rate ............................................................................................................................ 11 2.3.4 Distribution of workforce in Morigaon District ................................................................. 11 2.3.5 Human Development Index .................................................................................................... 13 2.3.6 Natural Resource Base ........................................................................................................... 13
2.4. ECONOMY ......................................................................................................................................... 13 2.4.1 Plantation and Horticulture .................................................................................................. 14 2.4.2 Livestock and Diary ................................................................................................................ 14 2.4.3 Other Non-farm Sectors.......................................................................................................... 14
2.5 INFRASTRUCTURE AND CONNECTIVITY........................................................................................... 15 2.5.1 Transport and communication............................................................................................... 15 2.5.2 Banking...................................................................................................................................... 15 2.5.4 Basic Amenities ........................................................................................................................ 16
PROFILE OF THE SAMPLE VILLAGES 17 3.1 DEMOGRAPHIC PROFILE .......................................................................................................... 17 3.2 SEX RATIO ................................................................................................................................. 17 3.3 LITERACY RATE......................................................................................................................... 17 3.4 FACILITIES ................................................................................................................................. 18
3.4.1 Electricity ............................................................................................................................ 18 3.4.2 Drinking Water ................................................................................................................... 18 3.4.3 Toilet Facility...................................................................................................................... 19 3.4.4 Education ............................................................................................................................. 19 3.4.5 Health Facilities ................................................................................................................. 19 3.4.6 Other Facilities ................................................................................................................... 20
3.5 VILLAGE ORGANIZATIONS ...................................................................................................... 20 3.6 CROP PRODUCTIVITY STATUS................................................................................................. 20 3.7 INPUT STATUS FOR CULTIVATION .......................................................................................... 21
3.7.1 Current Inputs ..................................................................................................................... 21 3.7.2 Capital Inputs ..................................................................................................................... 21
3.8 HANDICRAFT............................................................................................................................. 21 3.9 CREDIT....................................................................................................................................... 21
3.9.1 Purpose for availing Credit............................................................................................... 21 3.9.2 Sources of Credit ................................................................................................................. 22
3.10 MIGRATION, EMPLOYMENT AND WAGE INCOME EARNING ................................................ 23 3.11 RURAL DEVELOPMENT PROGRAMMES AND BENEFICIARIES ASSISTED............................... 24 3.12 PUBLIC DISTRIBUTION SYSTEM............................................................................................... 24 3.13 SUMMARY.................................................................................................................................. 25
RESULTS OF THE BASELINE SURVEY 26 4.1 RELIGIOUS AND CASTE COMPOSITION........................................................................................... 26 4.2 MOTHER TONGUE ............................................................................................................................. 26 4.3 AGE AND SEX ..................................................................................................................................... 26 4.4 HOUSEHOLD SIZE.............................................................................................................................. 26

4
4.5 MARITAL STATUS ............................................................................................................................. 27 4.6 EDUCATIONAL STATUS..................................................................................................................... 27 4.7 OCCUPATION AND EMPLOYMENT ................................................................................................... 27
4.7.1 Occupation and Industry ........................................................................................................ 27 4.7.3 Additional Employment and Preference............................................................................... 28 4.7.4 Migrant Workers ...................................................................................................................... 29
4.8 LAND AND OTHER ASSETS ............................................................................................................... 29 4.8.1 Cultivated Land: Ownership and Operational Holding .................................................... 29
4.9 LIVESTOCK......................................................................................................................................... 30 4.10 OWNERSHIP OF PRODUCTIVE AND OTHER ASSETS ...................................................................... 30
4.10.1 Agricultural Implements ....................................................................................................... 30 4.10.2 Transport................................................................................................................................. 31 4.10.3 Non-agricultural Machinery Implements .......................................................................... 31 4.10.4 Modern Household Assets .................................................................................................... 31 4.10.5 Financial Assets ..................................................................................................................... 31
4.11 HOUSING STATUS ........................................................................................................................... 31 4.11.1 House type and availability of living space ...................................................................... 31 4.11.2 Domestic lighting and fuel use............................................................................................. 32 4.11.3 Drinking water facilities....................................................................................................... 32 4.11.4 Sanitation and Drainage Facility........................................................................................ 33
4.12 INDEBTEDNESS OF RURAL HOUSEHOLDS ..................................................................................... 33 4.13 INCOME AND EXPENDITURE ........................................................................................................... 34 4.14 CURRENT EDUCATIONAL STATUS, SKILL AND TRAINING .......................................................... 34 4.15 PRESENT HEALTH SCENARIO ......................................................................................................... 35 4.16 MATERNAL AND CHILD HEALTH ................................................................................................... 36
4.16.1 Immunisation of Children below 5 Years .......................................................................... 36 4.16.2 Delivery Care .......................................................................................................................... 36
4.17 POOR AND THE PDS SUPPORT....................................................................................................... 37 4.18.1 Awareness about Government Schemes ............................................................................. 37 4.18.2 Participation in the Socio-political Affairs....................................................................... 38 4.18.3 Conflict, Insecurity and Access to Media and Communication...................................... 38
4.19 ASPIRATIONS................................................................................................................................... 39 DEVELOPMENT DEFICITS……………………………………………………………………………………….40 LIST OF SURVEYED VILLAGES………………………………………………………………………42

5
LIST OF TABLES Table 2.1 Religious Distribution of Population Table 2.2 Decadal Growth of Population Table 2.4 Literacy Rate by Area, Sex and Caste Table 2.5 Distribution of workforce Table 2.6 Non-Workers to Total Population Table 2.7 Indices of Human Development Table 2.8 Land Utilisation Pattern (in Hectare) Table 2.9 Livestock Population Table 2.10 PWD Road Length (in Km) Table 2.11 Rural Credit Environment Table 2.12 Basic Amenities Table 3.1 Total Population Distribution in Sample Villages Table 3.2 Literacy Rate in Morigaon District Table 3.3 Average hours of electricity available in sample village Table 3.4 Crop Productivity Status Table 3.5 Capital Inputs Table 3.6 Purpose for Availing Credit Table 3.7 Sources of Credit Table 3.8 Average wage income by kind of works Table 3.9 RDP Beneficiaries Table 3.10 Beneficiaries under PDS Table 4.1 Religion and caste wise distribution of household Table 4.2 Mother tongue wise distribution of households Table 4.3 Age group, sex and religion wise distribution of sample population Table 4.4 Percentage distribution of households by household size Table 4.5 Percentage distribution of the sample population by martial status Table 4.6 Percentage distribution of sample population by level of literacy Table 4.7 Distribution of main occupation by religion and gender Table 4.8 Distribution of secondary occupation by religion and gender Table 4.9 Percentage distribution of workforce by main industry Table 4.10 Percentage distribution of workers by employment days – main occupation Table 4.11 Percentage distribution of workers by employment days – secondary occupation Table 4.12 Problem faced by the self employed in operating their business Table 4.13 Percentage distribution of household looking for more employment Table 4.14 Percentage distribution of people looking for more employment by their preference Table 4. 15A Occupational distribution of the migrant worker of the sample households Table 4.15B Percentage distribution of migrant worker by place of migration Table 4.16 Percentage distribution of migrant worker by duration of migration Table 4.17 A Size class distribution of own cultivated land Table 4.17 B Size class distribution of total cultivated land Table 4. 18 Size class wise distribution of households with leased in land Table 4. 19 Size class wise distribution of households with leased out land Table 4. 20 Size class wise distribution of households with mortgaged in land Table 4. 21 Size class wise distribution of households with mortgaged out land Table 4.22(A) Distribution of households with livestock Table 4.22 (B) Household with livestock (total livestock numbers) Table 4.23 Distribution of households with agricultural implements Table 4.24 Distribution of households with financial assets Table 4.25 Distribution of households by housing status Table 4.26 Distribution of households by type of house

6
Table 4.27 Distribution of households by number of rooms in the house Table 4.28 Distribution of households with electricity connections Table 4.29 Distribution of non electrified households by source of light Table 4.30 Distribution households by source of drinking water Table 4.31 Distribution households by distance to the source of drinking water Table 4.32 Distribution households by type of toilets Table 4.33 Distribution households by source of fuel Table 4.34 Distribution households by drainage facility Table 4.35 Distribution indebted households by number of loan Table 4.36 Distribution indebted households by amount of loan and source Table 4.37 Distribution indebted (Hindu) households by amount and purpose of loan Table 4.38 Distribution indebted households (Muslim) by amount and purpose of loan Table 4.40 Distribution of households by net income during last one year Table 4.41 Distribution of households by expenditure Table 4.41 (A) Distribution of households by expenditure on cereals and pulses Table 4.42 Distribution of households by expenditure on vegetables, milk, meat etc Table 4.43 Distribution of households by expenditure on cloths, footwear and bedding etc Table 4.44 Distribution of households by expenditure on education Table 4.45 Distribution of households by expenditure on health Table 4.46 Distribution of households by expenditure on festivals and social ceremonies Table 4.47 Distribution of households by expenditure on electricity, gas etc. Table 4.48 Distribution of households by expenditure on telephone Table 4.49 Distribution of households by expenditure on house repairing and construction Table 4.50 Distribution of sample population (5 to 25 years of age) by schooling status Table 4.51 Distribution of sample population (5 to 25 years of age) by level of education Table 4.52 Distribution of sample population (5 to 25 years of age) by type of school Table 4.53 Distribution of sample population (5 to 25 years of age) by reasons of drop out Table 4.54 Aspiration of parents of current students (boys) Table 4.54 Aspiration of parents of current students (girls) Table 4.55 Distribution of persons interested to take training Table 4.56 Distribution of persons with desired types of training Table 4.57 Distribution of persons with different diseases Table 4.58 Persons across Religion treated by various medical service providers Table 4.59 Record of hospitalization in persons across Religion Table 4.60 Percentage distributions of children (up to 5 years) by immunisation details Table 4. 61 Percentage distributions of children (up to 5 years) fully immunised by age Table 4.62 Percentage distributions of children (up to 5 years) receiving at least one vaccine by agency Table 4.63 Percentage distributions of children (up to 5 years) not fully immunised by reasons Table 4.64 Distribution of household by place of last child born Table 4.65 Distribution of household by assistance in delivery during the last delivery Table 4.66 Household belonging to BPL Category Table 4.67 Households with BPL Ration Card Table 4.68 A Distribution of household by availing PDS support Table 4.68 B Distribution of household by level of dependency on PDS Table 4.69 Distribution of household by difficulties faced while accessing PDS benefits Table 4.70 Percentage distribution of household by who are aware of various government programmes Table 4.71 Percentage distribution of household by getting benefits from different schemes Table 4.72 Percentage distribution of households who voted in the last election Table 4.73 Percentage distribution of household by membership Table 4.74 Distribution of household by access to newspaper, radio and television Table 4.75 Lack in the Village Table 4.76 Important Deprivation Table 4.77 Opinion on welfare of the minority
7
PART I
BACKGROUND Issues relating to disparities across socio-religious communities have attracted much attention of the government of India of late. There is a growing realization about the relative backwardness of the religious minorities more particularly the Muslim as a religious community in India. The Sachar Committee, which was instituted specifically to look into the relative deprivations of Muslims vis-à-vis other socio religious categories in various dimensions of development, in its report on “Social Economic and Educational Status of the Muslim Community of India”, exhibited deficits and deprivations of Muslims in all dimensions of development. Assam is among the four states with large Muslim population where according to the Committee the situation is grave. Therefore, there is a need to generate data to evaluate and address issues of Muslim backwardness in the state. In order to ensure that the benefits of schemes and programmes of government reach the relatively disadvantaged segments of society districts having a substantial minority population on the basis of backwardness parameters were identified. Based on 2001 Census, using two backwardness parameters, viz., (1) religion specific socio-economic indicators at the district level in terms of literacy rate; female literacy rate; work participation rate; and female work participation rate and (2) basic amenities indicators at the district level in terms of percentage of households with pucca walls, safe drinking water, electricity and w/c latrines, the Ministry of Minority Affairs identified 90 Minority Concentration Districts throughout the country which are falling behind the national average in these parameters. Of these 90 districts, 53 districts have both socio-economic and basic amenities below national average, 21 districts have socio-economic parameters below national average and 16 have basic amenities below national average. The basic idea is to formulate a multi-sectoral programme for the 90 MCDs, which envisage for providing beneficiary oriented schemes to minorities and infrastructure development for the entire community in the districts. Against this backdrop the baseline survey in MCDs was conceived to
(a) Identify how existing programmes are currently targeting these districts and on the basis of the assessment to develop special programmes to provide these facilities and ensure accessibility to them in the most backward areas in a faster way; and
(b) Create socio-economic profiles of the targeted districts, and receive inputs that would help improve literacy rate, especially female literacy rate, and overall work participation rate, especially female work participation rate that have a significant impact on economic development.
The survey would more specifically try to identify the gaps in (1) availability of infrastructure like schools, health centers, ICDE centers and drinking water supply (2) housing and sanitation (3) critical linkages like rural road, ITIs, banking facilities, markets etc. and also (4) identification of artesian income generating activities in which villagers have comparative advantage.

8
METHODOLOGY
The present survey has been confined to rural areas. Considering the availability of data Tehsil level information has been used for stratification purpose. Villages are taken as the first stage units (FSU) for the survey. However, before selection of sample villages, each district under the coverage was stratified first. All tehsils in a district were grouped into three strata in terms of minority population after arranging them in descending order of minority population. The grouping/stratification has been done in such a way so that the first stratum constitutes top 20% of tehsils, the second stratum constitutes middle 50% and the third/last stratum constitutes bottom 30% of tehsils in the arranged frame. The ranges vary in accordance with degree of concentration of minority population in respective districts. Depending upon the size of the district, 25 or 30 villages were selected from each district. 25 villages were chosen if the rural population of the district is below 5 lacs; otherwise 30 villages were chosen. The number of villages surveyed in each stratum was directly proportional to the share of each stratum/group of tehsils (according to population) to the district population, subject to a minimum allocation of 6 villages to each stratum. Required number of sample villages from each stratum have been selected as per the probability proportion to size (PPS) with replacement, size being total population of the village as per Census 2001. In case of household selection, complete listing of all households (by door to door visit) has been done in case of sample villages with less than 1200 population. However, in case of those villages with population 1200 or more, three or more hamlet-groups (hg’s) were formed in the village as per the practice followed by NSSO¹. From among them, a sample of 2 hg’s was selected for listing of households. The hg having maximum concentration of minority population was selected with probability 1. From among the remaining hg’s, one more hg were selected at random. The listing and sampling of households were independent for each selected hg. In each selected hg, the listed households were grouped into strata as per the minority status of the household. In other words, all Muslim households formed one second-stage stratum (SSS), all Christian households another SSS, and so on. About 30 households were selected in all from each sample village for detailed enquiry. These 30 households were allocated over 2 selected hg’s (if hg’s formed) and among the respective SSS in proportion to total number of households listed in the respective frames. A minimum of 2 households were allocated to an ultimate SSS. The required number of sample households from each SSS were selected by systematic random sampling without replacement (SRSWOR). In case of village having less than 30 households all the households were surveyed.

9
The rule followed by NSSO for forming hamlet-groups is Approximate present population no. of hamlet- of the village group to be formed 1200 to 1799 3 1800 to 2399 4 2400 to 2999 5 3000 to 3599 6 ……………. and so on Following the above methodology, total 30 villages of the district Morigaon, Assam were identified, and 30 households from each village were selected for the sample survey. The present report is based on the data gathered from the total 900 sample households of the district.
TOOLS USED Relevant data were collected with the help of (1) Rural Household Schedule and (2) Village Schedule. The rural household schedule tries to capture different dimensions of socio-economic and situational variables like employment, migration and occupation details, land and other assets, ownership of productive and other assets, livestock details, housing status, rural indebtedness, family income and expenditure, current educational status and skill training, aspiration of parents of current students, awareness and participation, local conflicts and loss of life and property, access to media and communication and general aspirations of the people. The village schedule tries to garner authentic data regarding the village. Information such as basic population data, facilities, village organizations, land use and land transfers, credit facilities, commuting and migration data, job and wage related information, information on individual beneficiary oriented programmes, data on education including physical facilities, health, different development programmes, common property resources, and the public distribution system prevailing in the rural areas.■

10
PART II
DISTRICT PROFILE: MORIGAON 2.1 Area and Location Morigaon is basically an agrarian district. It is situated between 26.15 degrees North and 26.5 degrees North latitude and between 92 degree East longitudes. It is situated on the south bank of the river Brahmaputra. Nagaon district is situated on its East, Darrang on the North, Kamrup on the West and South West Karbi Anglong on its south. The total area of Morigaon district is 1551 sq. km. It has three urban areas (Morigaon, Jagiroad and Jagiroad paper mill) covering an area of 17.92 sq. km., with a total urban population of 37988. Morigaon district is the second smallest district of Assam. 2.2 Administrative Division Administratively, Morigaon has one sub-division namely Morigaon, which was a civil sub-division of the undivided Nagaon district since 1972 to 1989. The present district of Morigaon has five revenue circles (Morigaon Sadar, Mikirbheta, Laharighat, Bhuragaon and Mayong) five development blocks (Mayaong, Kapili, Bhurbandha Laharighat and Moirabari). The total number of revenue villages in the district is 636 and there are 85 Gram Panchayats under five development blocks. 2.3 Resource Base 2.3.1 Population As per the Census 2001, about 48 per cent of the total population is from minority communities, of which approximately 99 per cent are Muslims. The population density of the district is 500, which is much higher than the state density of population i.e. 340 persons as per 2001 Census.
Table 2.1 Religious Distribution of Population
Residence Persons Hindu Muslim Christian Others
Total 776256
Urban 37988
Rural 73826
405302 (52.21)
369398 (47.59)
759 (0.10)
461 (0.06)
Source: Statistical Handbook of Assam, 2006 The decadal variation of population growth shows that population growth has been maintaining a steady rate since 1931 to 1991. The Crude Birth Rate (CBR) and Total Fertility Rates (CDR) for the district are 30.53 and 4.04 respectively.

11
Table 2.2. Decadal Growth of Population
Location 1901-
1911 1911- 1921
1921- 1931
1931-1941
1941- 1951
1951-1961
1961- 1971
1971- 1991
1991- 2001
Morigaon 15.84 31.94 41.35 15.37 36.63 37.89 37.51 50.90 21.35
Assam 16.99 20.48 19.91 20.40 19.93 34.98 34.95 53.26 18.92 Source: Statistical Handbook of Assam, 2006 2.3.2 Sex Ratio The sex ratio of the district as per 2001 census is 946, which is higher than the state sex ratio of 935. The sex ratio for rural areas in the district is 948 while the ratio is 879 in the urban areas. The child sex ratio in the rural areas of the district is 966, while it is 934 for urban locations. 2.3.3 Literacy Rate The literacy rate of the Morigaon district is 58.53 per cent as against of 63.25 per cent of the state total. Of this, the male literacy rate is 65.15 per cent and female literacy is 51.51 per cent.
Table 2.4 Literacy Rate by Area, Sex and Caste
Total Rural Urban SC ST
Total Male Female Total Total Male Female Male Female
58.53 65.15 51.51 57.09 84.21 58.68 38.37 58.59 35.21
Source: Statistical Handbook of Assam, 2006 2.3.4 Distribution of workforce in Morigaon District The work participation rate in the district is 33.93 percent. The urban work participation rate is 34.01 percent while the same for rural areas is 32.37 percent. The distribution of work forces in the district as per the Census 2001 is shown in the following Table:

12
Table 2.5 Distribution of workforce
% of Workers to total population Location Total/Urban /Rural
Total/ Male/
Female Total Main
Workers Marginal Workers
Total 35.9 26.6 9.3
Male 49.9 42.3 7.6
Total
Female 20.8 9.7 11.1
Total 32.0 29.6 2.4
Male 51.0 48.2 2.8
Urban
Female 10.3 8.4 1.9
Total 36.4 26.1 10.3
Male 49.8 41.5 8.3
Assam
Rural
Female 22.3 9.9 12.4
Total 33.9 25.7 8.2
Male 50.6 44.6 6.0
Total
Female 16.3 5.8 10.5
Total 32.4 30.1 2.3
Male 52.8 50.3 2.5
Urban
Female 9.1 7.1 2.0
Total 34.0 25.5 8.5
Male 50.4 44.2 6.2
Morigaon
Rural
Female 16.7 5.8 10.9 Source: Statistical Handbook of Assam, 2006 As the data clearly indicate, the overall pattern of both size and rural-urban distribution of the workforce in the district is not much different from the average scenario of the state. Among the total rural workforce of Morigaon, the Census, 2001 reveals that there are 138089 cultivators, 51855 agricultural labourers, 8661 household industries workers and 64225 other workers. The total number of non-workers is 513432. The break-up of non-workers to total population is shown in the following Table.
Table 2.6 Non-Workers to Total Population
Total Rural Urban
Persons 66.07 65.99 67.63
Male 49.44 49.56 47.16
Female 83.67 53.18 90.92 Source: Statistical Handbook of Assam, 2006

13
2.3.5 Human Development Index AS per the AHDR, 2003, Morigaon ranks fourth in the HDI despite considerable lags in the development procedure of the district. The major HDI components of Morigaon district are shown in the following table.
Table 2.7 Indices of Human Development
Location HDI Value Income Index Education Index Health Index
Morigaon 0.494 0.562 0.551 0.371
Assam 0.407 0.286 0.595 0.343 Source: Human Development Report, 2003, GOI In respect of Gender related Development Index (GDI) Morigaon ranks second preceded by North Cachar Hills (0.759). 2.3.6 Natural Resource Base The district falls under the Central Brahmaputra Valley agro climatic zone under the Eastern Himalayan region. As such, the region is naturally endowed with suitable conditions for agricultural production especially cereals.
Morigaon has a total of 9831.780 hectares (about 10 percent of the total area) of land under reserve forests which also forms the total forest area of the district. However, no target has so far been made by the government for enhancing the forest coverage of the district. The same is also true regarding the development of the farm forestry.
Table 2.8 Land Utilisation Pattern (in Hectare) Total area
Forest Cover
Non-agricultural Use of Land
Fallow Land
Not Sown Area
Total Cropped Area
Multiple Cropping Area
170400 17626 21310 8507 13780 124352 31930 Source: Statistical Handbook of Assam, 2006 The district is also endowed with tributary rivers Kolong, Sonai etc., along with a few natural wetlands like Gauranga Beel, Mer Beel etc. These water sources are important reservoirs of fisheries. The district has a total of 35 registered beel fisheries and 5 river fisheries. A total of seven eco hatcheries are there in the districts.
The normal rainfall of the district is 1772.4 mm. However, nearly 60 per cent of the rainfall is received during the four monsoon months when intensity of rainfall is very high. 2.4. Economy
The economy of Morigaon is rural agrarian with low rate of urbanization. As already pointed out, the district has only three urban locations, of which Morigaon is a class IV urban township. The industrial scenario of the district is also poor having one paper mill at Jagiroad and some fibre production units. The total number of registered SSI units in the district was 398 which are the lowest among all the districts in the State.

14
2.4.1 Plantation and Horticulture The district has vast potential for development of plantation and horticultural crops. There has been an impressive growth of horticultural crops in the district in recent years. Rubber cultivation is an emerging activity in the district for which endeavour is to be made by the Rubber Board. Besides rubber, coconut, banana, and black pepper are some of the important horticultural crops of the district. In respect of sericulture activities, Morigaon is one of the important locations in Assam for producing the good quality Eri cocoons and its fabric. Since the feedstock is abundantly available, the district has very good potential for the development of eri culture in particular. Commercial cropping of Jute, Tea and rubber has potentialities in the district. However, these areas have not been made commercially viable. 2.4.2 Livestock and Diary Livestock and dairy farming are common practices in the rural households of Morigaon district. As per the Livestock Census of 2003, the district has different types of livestock including cattle, buffaloes, sheep, goats, pigs, horses, fowls and ducks.
Table 2.9 Livestock Population
Cattle
Crossed Local
Buffaloes
Sheep
Goats Pigs
15849 271351 10183 3055 220043 38810
Horses & Ponies Fowls Ducks
786 932532 266149 Source: Statistical Handbook of Assam, 2006 The poultry farming is a growing business in Morigaon. The per capita per annum availability of eggs in the district is at 22 as against the state average of 18 eggs. The district is dependent on nearby districts like Kamrup for supply of inputs such as day old chicks and feed for the units in the district. 2.4.3 Other Non-farm Sectors The district of Morigaon has various natural resources like minerals, forest wealth besides adequate water from many rivers covering major part of the district. Based on these resources, productive units may be established. One such sector is the dry fish market, for which Morigaon acts as the supplier of the entire North Eastern Region. Agro-processing units like rice mills, flourmills and mustard oil extraction mills are also available in Morigaon.

15
2.5 Infrastructure and connectivity Availability and access to infrastructure are the primary requirements of socio-economic progress of a region. Of all the infrastructure facilities, transport and communication; power and energy and banking are considered essential sectors. 2.5.1 Transport and communication The district mostly relies upon road transport. Air and water transport system has not been developed in Morigaon. Railway connectivity is not sufficient to meet the transport need of the people. Considering road transport, the average share of road length per thousand populations is dismally low at 120 km. Further, only 15 per cent of the PWD roads are surfaced; leaving more than 85 per cent of roads in the district un-surfaced.
Table 2.10 PWD Road Length (in Km) Surfaced Un-
surfaced National Highway (NH-37)
State Highway
Other Roads
Road Length per Lakh population
Road Length per ’00 sq. km
115 651 36 79 651 120 45.0 Source: Statistical Handbook of Assam, 2006 2.5.2 Banking As on December 2001, Morigaon district had 10 offices of Commercial Banks with a total deposit of Rs. 1740 Lakh as against Rs. 410 Lakh as outstanding credit. The existing situation of rural credit in the district reflects further ramifications on credit availability for productive purposes on strategic commitments. The present CDR is 54.7 in case of rural credit, which is not much encouraging. The average population per branch shows that banking facilities in rural Morigaon is not sufficient. Commercial banking is quite poor in the rural areas of Morigaon. Besides, a sizeable amount of fund is transferred from the rural areas for low credit worthiness of the rural people.
Table 2.11 Rural Credit Environment CBs RRB SCB LDB TOTAL
No. of banks 17 1 1 1 20
No. of branches
Rural 17 11 3 - 31
Semi-urban - - - - -
Urban - - - - -
No. of staff per branch /society
7 6 9 - 6-9
Avg. population/branch 14,000 16,000 15,000 - 20,000
Average No. of villages covered per branch
25 25 25 25 25
CD Ratio ( Agency wise) 54.7 39.28 18.4 - 48 Source: Potential Linked Credit Plan, Morigaon: 2006-07, NABARD.

16
As the Potential Linked Credit Plan, Morigaon: 2006-07, prepared by the NABARD points out low credit deployment in the rural areas of Morigaon may also be attributed to the lack of consciousness of the rural stakeholders of various developmental schemes. 2.5.4 Basic Amenities
Besides housing standard of the rural people, the standard of living is also judged based on the availability of certain basic community institutions in the rural locality along with easy assess to these. Safe drinking water, facilities for basic education and health, and social security are some of the important elements of these basic requirements. In respect of amenities in rural areas, there are facility wise variations. With a total household of 133458, Morigaon has 592. Out of these, 433 villages are electrified. Besides, number of police stations and outposts, fire service station and like facilities are not adequately available.
Table 2.12 Basic Amenities Amenities Number
Total inhabited villages 592
Total households 133458
Safe drinking water facilities N.A.
No. of villages electrified 433
No. of Police Stations 7
No. of Police Outposts 2
Fire Service Station 1
Educational Institutions
(A) Pre-primary Schools 0
(B) Primary School 921
(C) Middle Schools 292
(D) High Schools 125
(E) Senior Secondary Schools 14
(F) Junior Colleges 2
(G) Colleges 6
(H) Vocational/technical Education 0
Medical facility
(A) Hospitals 3
(B) PHCs 13
(C) PHCs (Sub Centre) 215
(D) Rural Family Welfare Planning Centre 30
(E) Dispensaries 15
Source: Statistical Handbook of Assam, 2006
Based on the brief profile of the Morigaon, it may be concluded that the district has been suffering from a number of deficiencies related to almost all the areas of socio-economic progress. The deficits need proper assessment for assuring proper growth process in the district. ■

17
PART III
PROFILE OF THE SAMPLE VILLAGES 3.1 Demographic Profile The total population of the sample villages is 48608 with total household of 8090 (Census, 2001). In comparison with the Census Data, 2001, the total population of the sample villages and total households constitute 6.6 per cent and 6.4 per cent of the total rural population and rural household of the district respectively. According to the Census, 2001, the total rural population of the district was 738268 with total rural household of 125531. In the sample population, the percentage of the Scheduled Caste population is 7.4 per cent while the Scheduled Tribe population is 15.9 per cent.
Table 3.1 Total Population Distribution in Sample Villages
House Holds Total Population
Male Female SC Total
ST Total
8090 48608 23649 22198 3606 7711
3.2 Sex Ratio The sex ratio of the sample population is estimated to be 938, which is a little lower than the Sex ratio of the district i.e. 946 as reported in the Census Report, 2001. However, it is higher than the State sex ratio of 935. 3.3 Literacy Rate Literacy rate is one of the major indicators of human development. Besides, the size and proportion of literate and educated population has significant bearing on the overall socio-economic progress of the society. Female literacy, in particular, is an essential element of nurturing a better society as it is associated with the health and social development of the child. The literacy rate in the sample villages is at a much lower level in comparison with the census (2001) figures of literacy at the district level as well as the rural level.
Table 3.2 Literacy Rate in Morigaon District
Area Level Male Female Total
State 71.28 54.62 63.25
District (Morigaon) 65.15 51.51 58.53
Rural Area (Morigaon) - - 57.09
Sample Villages 47.14 38.72 40.62

18
As seen in the above Table, the literacy rate in the sample villages, for both male and female, is alarmingly low. Low female literacy is one of the major indicators of the poor rate of the social development in the district. 3.4 Facilities Besides education, there are certain definitive facilitators of ascertaining quality of human life in a region. Presence of such facilitators, and accessibility and usability of these social overheads make way for qualitative improvement in the standard of living of the people. Sources of lighting, drinking water, sanitation, educational institutions, health facilities, accessibility of transport etc., are some of the basic requirements of any region to maintain and sustain basic standard of living. 3.4.1 Electricity Proportion of households using electricity for domestic lighting in the rural areas instantaneously reflects the economic status of the households as well as the success of welfare state. The village survey data shows that 19 out of the 30 villages under the sample have already been electrified while 11 villages have to depend upon other conventional sources of domestic lighting. Out of the 19 electrified villages, 978 Hindu and 616 Muslim households use electricity for different purposes. To quote, out of 978 Hindu households, only 10 households use electricity for commercial purposes. Similarly, out of 616 Muslim households only 4 households use electricity for agricultural purposes with 13 households using electricity for commercial purposes. It is also to note that severe power cuts have been a common experience of the electrified villages. As the villagers reported the average availability of electricity per day is about 15 hours. Over the years, there has been some improvement in the availability of electricity. The sample data also reflect that two of the villages namely, Barkurani and Hatramukh have been de-electrified.
Table 3.3 Average hours of electricity available in sample village Last Year 5 Years ago 10 years ago
Average hours of electricity available
15.26
10.63
9.21 3.4.2 Drinking Water Availability and access to safe drinking water has been one of the most crucial factor involving serious health concerns in rural areas. All the sample villages have their own drinking water facilities. The various sources of water supply facilities as reported by the respondents are well, hand pump, tube well, tank/river water etc. However, no village is found having the access to public water supply either by tap water inside houses. Distribution of common drinking water supply facilities shows that of the different sources more than 72 per cent are tube wells majority of which are private ones. The availability of drinking water facilities in the sample villages across religious groups shows that majority of the Hindu as well as Muslim households use tube well as the

19
prime source of water supply. It is observed that the share of drinking water resources of the sample villages have almost equally been shared by the religious groups. 3.4.3 Toilet Facility The sanitation status of the sample villages reveals that of the total households in the villages more than 70 per cent are reported to have their own sanitation facilities. The most common toilet facility among the households is Sulabh/Soakage pit latrine. Approximately two third of the toilet facilities used are reported to be Sulabh/Soakage pit latrine. As regards Hindu households only 5.6 per cent are found using TSC while about 29 per cent of them use Sulabh/Soakage pit latrine. On the other hand, out of the Muslim households more than 63 per cent use Sulabh/Soakage pit latrine, about 11 per cent use TSC. The other facilities used by the households are mostly unhygienic and unhealthy. 3.4.4 Education The poor literacy rate of the sample villages is easily attributable to the low availability of schooling and educational facilities of the households. The data collected also reveal a similar picture. At the village level there are 89 kuccha 15 pucca and 1 semi-pucca educational institutions. Of this there are 38 primary schools of which 12 are for girls, 14 middle schools of which only 1 are for girls, 7 high/higher secondary schools of which only 1 is for girls, 1 technical education institutes, 13 religious school for Muslim boys and girls, 12 non-formal educational institute and 18 other education related institutes. Within the block level as well as the gram panchayat levels similar situation prevails. To quote out of the 23 educational institutions of various types at the block level, only 3 are available for girls. However, at the Panchayat level a total of 33 institutions are present of which 8 are for the girls. The overall scenario of the region is quite depressing considering female education and institutions with desirable infrastructure. 3.4.5 Health Facilities The sample villages reported to have health care centres at accessible distance. Altogether, the villages have 82 health care centres within a distance of 2 to 5 kms. These centres include Sub centre, Primary Health Centre (PHC), Community Health Centre (CHC), Hospitals/dispensaries, Maternity/Child care centres, Family Planning Clinic, Medicine shop, Private Allopathic Doctors etc. The villagers mostly avail these facilities by walking or occasionally on vehicles. At least one sub-centre is available in all the villages providing health care facilities to the villagers. Altogether 33 doctors have been appointed in the PHCs and SCs. 53 ANM nurses have been appointed in these centres. Moreover, qualified private medical practitioners are available in seven of the villages along with more than 20 medicine retailers. Regular health check up facility is available in 19 villages, although pathological check up and x-ray facilities are not sufficient. Besides, 82 beds are available in the SCs and PHCs to treat hospitalized patients.

20
3.4.6 Other Facilities
As the primary data on village level survey reveals that distance from the villages to the nearest block head quarters and nearest town ranges from 2kms to more than 20 kms. It is also to note that the majority of the villagers have to cover a distance of more than 20 kms to reach the block head quarter and the nearest town. The transport and communication systems of the villages are weak. The nearest bus stop is available within an average distance of 2-5 kms, while the railway stations are available at a minimum distance of 5 – 10 kms. Similar is the case with post-offices and banks. Availability of other facilities like markets, shops, mandis, etc are available within the radius of 2 – 5 kms.
3.5 Village Organizations
The organizational activity within the village is an important determinant of overall socio-economic development. The collected data show that the village level organizations are fairly active in the sample villages. Co-operatives, workers union, farmers organization, voluntary organizations, political parties, cultural organizations, youth and women mandals, flood relief village security force and like organizations are found active in the sample villages. There are altogether 16 co-operatives relating to credit disbursement, agricultural inputs, production of khadi, marketing and diary development. Moreover, there are 4 workers organization, 18 farmers organizations, 6 voluntary organizations, 8 religious caste/religion based organizations, 13 political organizations, 8 cultural organizations along with youth (17) and women (15) mandals. Moreover, the villagers also organized for providing flood relief activities.
The presence of active village organizations is indicative of the potentiality of capacity building of pressure groups within villages for ensuring proper governance at the grass root level. 3.6 Crop Productivity Status
The economy of Morigaon is agrarian with paddy as the prime crop. The survey results of the sample villages indicate that paddy is the major crop produced in all the villages with 50 per cent harvest share. The maximum market price fetched for paddy one year before the survey as reported is Rs. 1000 per quintal while the minimum price was Rs. 450 per quintal. Besides, the sample villages also produce cereals, potato, sugarcane and mustard. The following Table shows the per hectare productivity of these crops and minimum and maximum market prices fetched one year before the present survey.
Table 3.4 Crop Productivity Status Market Price (Rs.) Crop Average Yield/ Acre
(quintal) Highest Lowest
Cereals 4.75 3000 625
Potato 86 1000 800
Sugarcane 20.92 3000 700
Mustard 4.71 2000 550
Vegetables 121.71 2000 100
Jute 13.81 1500 100
21
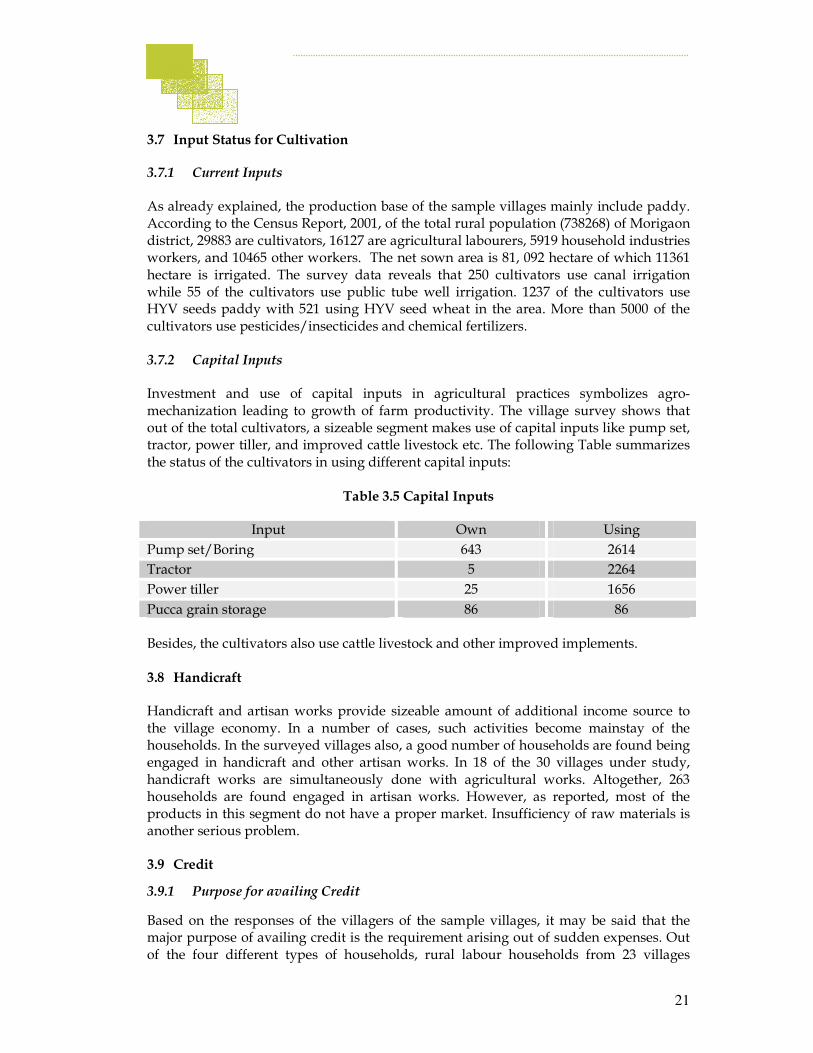
3.7 Input Status for Cultivation 3.7.1 Current Inputs As already explained, the production base of the sample villages mainly include paddy. According to the Census Report, 2001, of the total rural population (738268) of Morigaon district, 29883 are cultivators, 16127 are agricultural labourers, 5919 household industries workers, and 10465 other workers. The net sown area is 81, 092 hectare of which 11361 hectare is irrigated. The survey data reveals that 250 cultivators use canal irrigation while 55 of the cultivators use public tube well irrigation. 1237 of the cultivators use HYV seeds paddy with 521 using HYV seed wheat in the area. More than 5000 of the cultivators use pesticides/insecticides and chemical fertilizers. 3.7.2 Capital Inputs Investment and use of capital inputs in agricultural practices symbolizes agro-mechanization leading to growth of farm productivity. The village survey shows that out of the total cultivators, a sizeable segment makes use of capital inputs like pump set, tractor, power tiller, and improved cattle livestock etc. The following Table summarizes the status of the cultivators in using different capital inputs:
Table 3.5 Capital Inputs
Input Own Using
Pump set/Boring 643 2614
Tractor 5 2264
Power tiller 25 1656
Pucca grain storage 86 86 Besides, the cultivators also use cattle livestock and other improved implements. 3.8 Handicraft Handicraft and artisan works provide sizeable amount of additional income source to the village economy. In a number of cases, such activities become mainstay of the households. In the surveyed villages also, a good number of households are found being engaged in handicraft and other artisan works. In 18 of the 30 villages under study, handicraft works are simultaneously done with agricultural works. Altogether, 263 households are found engaged in artisan works. However, as reported, most of the products in this segment do not have a proper market. Insufficiency of raw materials is another serious problem. 3.9 Credit
3.9.1 Purpose for availing Credit
Based on the responses of the villagers of the sample villages, it may be said that the major purpose of availing credit is the requirement arising out of sudden expenses. Out of the four different types of households, rural labour households from 23 villages

22
incurred debt for this purpose. Small farmers put the reason of meeting the cost of agriculture along with sudden requirements for availing credit from different sources. Artisans and small businessmen are also found compelled by sudden requirements of business as well as family as the major purpose of availing credit. Agricultural investment related credit requirements were mostly shown by the medium and large farmers as well as the artisan households.
Table 3.6 Purpose for Availing Credit
Household Type Major Cause Secondary Causes
Labourers Meeting sudden expenses Cultivation Cost
Small Cultivators Cultivation Cost Meeting sudden expenses
Medium & Large Cultivators
Meeting sudden expenses + current cultivation + investment in machinery
Current Cultivation Cost
Artisans and Other Business
Meeting sudden expenses Cultivation Cost, Investment in equipments
3.9.2 Sources of Credit The survey findings report that the labourers and small farmers avail credit mostly from the village moneylenders as well as landlords for meeting sudden expenses along with current cultivation costs. There is a distinct difference in the sources of credit for the medium & large cultivators and the labourers and small-cultivators. The major source of credit of the medium & large cultivators is the institutional credit while the others rely upon friends and relatives. Moneylenders and landlord employers are the secondary sources of availing credit. The overall picture presents that there is twin problem of institutional credit availability and use. On the one hand, the financial institutions may not be interested in deploying agriculture loans, and on the other hand, it may also be possible that due to ignorance and illiteracy of the stakeholders, the impact of developmental financial plans can not be realized by them. In case of artisans and small businessmen the major source of credit is reported to be the institutional sources.

23
Table 3.7 Sources of Credit
Household Type Main Source of
Credit Secondary Sources of credit
Labourers Friends & relatives
Moneylenders, Landlord, Institutional credit
Small- Cultivators Friends & relatives
Moneylenders, Landlord, Institutional credit
Medium & Large Cultivators Institutional Sources
Friends & relatives, Moneylenders, Landlord.
Artisans & Other Business Institutional Sources
Friends & relatives, Moneylenders.
3.10 Migration, Employment and Wage Income Earning The survey data indicate that for commuting to colleges and higher secondary schools both boys and girls mostly use bus service and bicycles. The survey also showed that of the 30 sample villages, people from 28 villages move out looking for works on daily basis. More than 2000 people of these villages go out of the villages to work out side. The migration of workers extends from district level to national level. The monthly income of the migrated workers ranges from Rs. 300 to Rs. 26,000. The survey also indicated that migration of agricultural labour is basically due to the livelihood problem. Similarly, the existing wage rates in villages are not of any acceptable status. Moreover, gender disparity has been very high. This discrepancy is prominent in government programmes also. The evil of child labour is also noticeable in the surveyed villages.
Table 3.8 Average wage income by kind of works
Wage Rate
Ploug-hing Land
Weeding/ Inter-cultural
Trans-planting
Har-vesting
Thre-shing
Un-skilled
Skilled Govt. Prog-ramme
Male 70.70 65.33 53.00 63.00 52.83 68.33 122.00 55.43
Female - 13.68 35.26 41.05 6.84 23.68 - 35.05
Child 32.85 37.14 37.14 55.71 52.86 17.86 - -
Religious group wise government jobs among village populations across the sample villages show that 620 persons from the villages are in government jobs of which about 68 per cent are Hindus with about 32 per cent of Muslims. Of the Hindus 5.8 per cent, are Scheduled Caste and 12.6 per cent are Scheduled Tribe.

24
3.11 Rural Development Programmes and Beneficiaries Assisted Of the total 30 sample villages, about one third reported implementation of some programmes in the course of last three years. Some of the programmes under implementation are SGRY, PMGSY, NREGA etc. Based on the amount of investment NREGA is the largest project with an allotment of Rs. 3857200 followed by PMGSY (Rs. 3892000) and SGRY (Rs. 800000). These programmes have created employment opportunities for 1598 male and 223 females of the villages. This is a clear indication of lower induction of females in such developmental programmes. SGRY has completed 8 of its projects with 1 incomplete project while 12 projects under NREGA are still going on. Two projects under PMGSY have already been completed. Besides these, 6 other projects undertaken by the government have also been completed. The following Table is indicative of the fact that the government welfare programmes have provided equal emphasis on the development of the Muslims as well as the Hindus. However, the Scheduled Caste and Scheduled Tribe communities have not been assigned in these programmes.
Table 3.9 RDP Beneficiaries
Persons Assisted Scheme
Hindu Muslim Total
SGSY 100 132 232
NREGA 373 641 1014
IAY 306 201 507
Others 16 27 43
Total 795 1001 1796
3.12 Public Distribution System 28 out of the 30 sample villages under study possess the facilities of the public distribution system. The total number of PDS outlets is 64 within a distance range of 2 – 3 kms., of the households. Scheme wise, the PDS includes Annapurna, Antodaya, BPL and APL beneficiaries. A brief account of the scheme wise beneficiaries is given in the following Table:
Table 3.10 Beneficiaries under PDS Households benefited Scheme
Hindu Muslim Total
Annapurna 2 26 28
Antodaya 93 432 525
BPL 328 794 1122
APL 440 2244 2684
Total 863 3496 4359

25
The PDS system seems to put higher emphasis on the Muslim community living in these villages as the highest number of Muslims are covered by the PDS schemes. More than 3000 families of the survey region procure household commodities from the PDS outlets. The households reported to be comfortable with the distance of the outlets as well as the behaviour of the dealers. However mixed responses are found regarding goods supplied, allotment of quota per family, regularity of supply, honesty in measurement and pricing, quality of grains etc. From this, it may be concluded that the operating mechanism of PDS might have some definite flaws which needs urgent attention. 3.13 Summary The village survey findings reveal that the sample villages of the district suffer from serious deprivation relating to public health, education, and other social sectors. From the productivity status, it is found that low farm productivity and insufficient market supply has resulted from a host of basic problems like lack or insufficient irrigation facilities, absence of farm mechanization and farmers’ ignorance. At the same time, it is also observed that the socio-economic status of the Muslim as well as Hindus living in the study region does not differ significantly. In stead, it is seen that the government promoted development schemes have provided sufficient importance on all the religious communities. In contrast, the Scheduled Caste and Scheduled Tribe population are found to the least beneficiaries of the development schemes. ■
26
PART IV
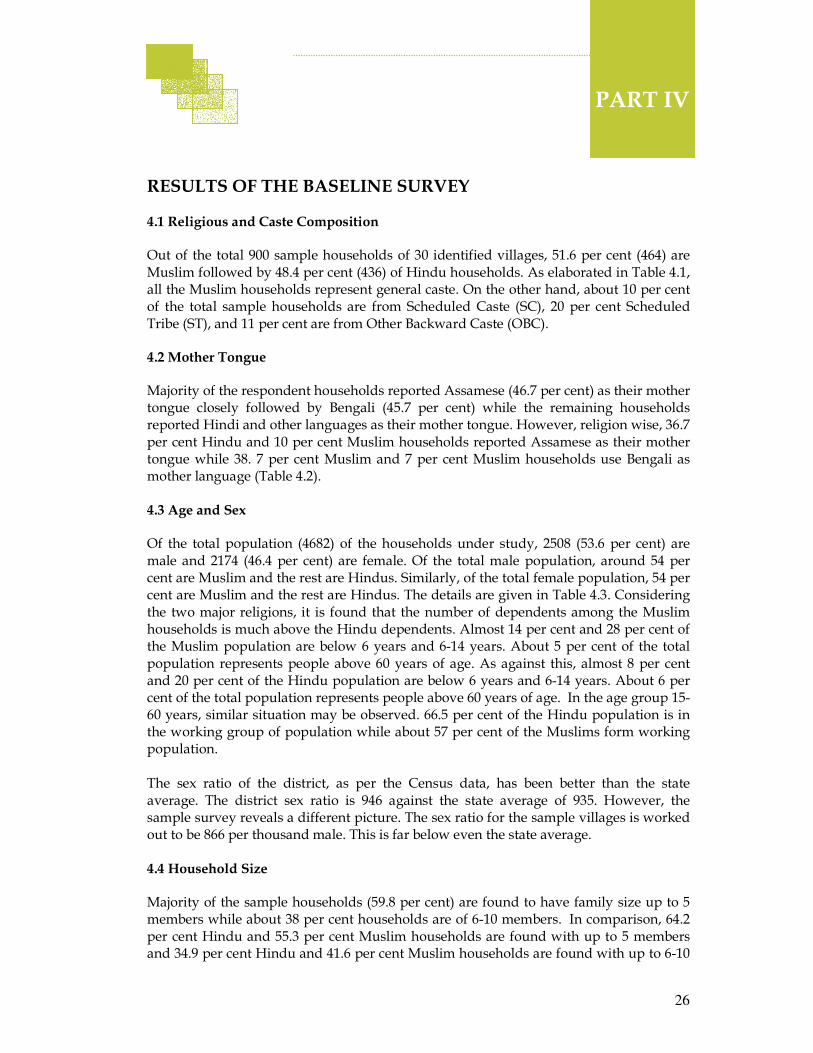
RESULTS OF THE BASELINE SURVEY 4.1 Religious and Caste Composition Out of the total 900 sample households of 30 identified villages, 51.6 per cent (464) are Muslim followed by 48.4 per cent (436) of Hindu households. As elaborated in Table 4.1, all the Muslim households represent general caste. On the other hand, about 10 per cent of the total sample households are from Scheduled Caste (SC), 20 per cent Scheduled Tribe (ST), and 11 per cent are from Other Backward Caste (OBC). 4.2 Mother Tongue Majority of the respondent households reported Assamese (46.7 per cent) as their mother tongue closely followed by Bengali (45.7 per cent) while the remaining households reported Hindi and other languages as their mother tongue. However, religion wise, 36.7 per cent Hindu and 10 per cent Muslim households reported Assamese as their mother tongue while 38. 7 per cent Muslim and 7 per cent Muslim households use Bengali as mother language (Table 4.2). 4.3 Age and Sex Of the total population (4682) of the households under study, 2508 (53.6 per cent) are male and 2174 (46.4 per cent) are female. Of the total male population, around 54 per cent are Muslim and the rest are Hindus. Similarly, of the total female population, 54 per cent are Muslim and the rest are Hindus. The details are given in Table 4.3. Considering the two major religions, it is found that the number of dependents among the Muslim households is much above the Hindu dependents. Almost 14 per cent and 28 per cent of the Muslim population are below 6 years and 6-14 years. About 5 per cent of the total population represents people above 60 years of age. As against this, almost 8 per cent and 20 per cent of the Hindu population are below 6 years and 6-14 years. About 6 per cent of the total population represents people above 60 years of age. In the age group 15-60 years, similar situation may be observed. 66.5 per cent of the Hindu population is in the working group of population while about 57 per cent of the Muslims form working population. The sex ratio of the district, as per the Census data, has been better than the state average. The district sex ratio is 946 against the state average of 935. However, the sample survey reveals a different picture. The sex ratio for the sample villages is worked out to be 866 per thousand male. This is far below even the state average. 4.4 Household Size Majority of the sample households (59.8 per cent) are found to have family size up to 5 members while about 38 per cent households are of 6-10 members. In comparison, 64.2 per cent Hindu and 55.3 per cent Muslim households are found with up to 5 members and 34.9 per cent Hindu and 41.6 per cent Muslim households are found with up to 6-10
27
members. On the other hand, only 1.9 per cent households are found with family size of more than 10 members. (Table 4.4) 4.5 Marital Status As shown in Table 4.5, 49.5 per cent of the Hindu and 47.5 per cent of the Muslim sample population are married. Although not prominent, the incidence of child marriage is present in the district under study as 0.2 per cent of the Muslim population is reported to be married at the age range of 6-14 years. Similarly, 0.8 per cent of the Hindu and 1.8 per cent of Muslim sample population are reported married in the age group 15-18 years. In the age group of 19-25, around 6 per cent Hindu and 7 per cent Muslim are found to be married
The rate of divorce/separation is comparatively higher among the sample Hindu population with 4.7 per cent of representation, which is 0.7 per cent in case of Muslim. The number of widow/widower is highest above the age of 60 years, both for Hindus as well as Muslims. 4.6 Educational Status Educational deprivation is prominent in the sample population of the studied district. About 24 per cent Muslim and 19 per cent Hindu population are found to be illiterate. Moreover, female illiteracy (12.5 per cent Muslim as well as Hindu) is higher than male illiteracy (11 per cent Muslim and 6.6 per cent Hindu). That the condition of technical and higher education is poorer in the studied district is evident from the Table 4.6. Not more than 1 per cent of the sample population is found to have managerial, technical or, post-graduate qualification. 4.7 Occupation and Employment 4.7.1 Occupation and Industry Table 4.7 shows the occupation, sex and religion wise distribution of the respondent households. It is found that about 88 per cent of the male and 12 per cent of the female form the Hindu workforce while about 94 per cent of the male and 6 per cent of the female form the Muslim workforce. It is to note that in measuring workforce, the dependent population in each of the religious groups has not been considered. The industry wise distribution of the main workforce of both the communities has been shown in Table 4.9. As the survey reveals, more than 43 per cent of population in each of the communities are engaged in farming activities. About 17 per cent of the population in each of the religious groups is engaged in production related activities. In businesses, more than 12 per cent of the Muslim population is absorbed against around 8 per cent of Hindu counterparts. In other areas like professional/technical activities, administrative and clerical jobs, less than 5 per cent of Hindus as well as Muslims are engaged.

28
The overall pattern of industry wise distribution of main occupation among the Muslim households is not quite significantly different from that of the Hindu households. However, it is striking to note that irrespective of religion, the participation of females in the main occupation is very low. Only 3.7 per cent of the Hindu women and 1.7 per cent of Muslim women are found to be engaged in farming as the main occupation. As it is shown in Table 4.8, 89 per cent of the Hindu households and around 95 per cent of the Muslims are engaged in secondary occupations including services of different kinds along with production and related works. The number of employment days in productive activities considerably varies between primary and secondary employment as well as between religious groups. As shown in Table 4.10, about 40 per cent male and 4 per cent of the female Hindu household get engaged in the primary occupation for more than 260 days. On the other hand, 33 per cent male and about 2 per cent of the female Muslim households get engaged in the primary occupation for more than 260 days. More than 23 per cent of the Hindus as well as Muslims do not get employment opportunities for more than 180 days per year. The situation of employment days is not at all encouraging. More than 60 per cent of the Hindus as well as the Muslims do not get employment for more than 100 days per year. Similarly, less than 6 per cent of the Hindu as well as Muslim populations can manage employment for 181-260 days per year. (Table 4.11) 4.7.2 Self-Employment Scenario Table 4.9 indicates that about 50 per cent of the Hindu labour force and more than 60 per cent of the Muslim workforce are associated with self employment activities. Such activities include agro-based works like livestock farming, horticulture, gishing, forestry, agro-based manufacturing etc. On the other hand non-farm self employment activities include a number of activities including wholesale and retail trade, transport, storage and communication, financing, insurance, electricity-gas and water related activities. This section of workers is essentially constituted by the self-employed people. The problem ratings (shown in Table 4.12) by the self-employed persons relating to the smooth conduct of business reveal that about 25 per cent of them face serious problems creating jeopardy in business while majority of them (about 60 per cent) reported not to have any major problem in running their business. About 9 per cent of the self-employed persons complained about the credit deployment system, inaccessibility of credit market and high rates of interests upon business loans. Around 3 per cent of them complained about shortage of electricity. For more than 4 per cent of the self employed persons, market assess has been the major problem. It is significant to note that about 10 per cent of the self-employed persons complained about the harassment of the government officials in day to day activities of their business.
4.7.3 Additional Employment and Preference Although a sizeable section of the main labour force is engaged in agriculture, which has neither been adequately remunerative nor can generate substantial employment days throughout the year for various reasons. The overall occupational scenario

29
supplemented by the figures given in Table IV.10 clearly indicates good amount of underemployment of labour force. Consequently, about 37 per cent of the sample households, as reported, are looking for more employment (Table 4.13). The preferences of the households looking for additional employment are given in Table 4.14. It is worth noting that more than 67 per cent of them seek self-employment activities as additional employment sources. It is also to note that this preference is framed by 66 per cent of the Hindu workers and 69 per cent of the Muslim workers. About 22 per cent of the Hindus and 14 per cent of the Muslims households looking for more employment prefer salaried jobs as additional sources of employment. 4.7.4 Migrant Workers Table 4.15 A & Table 4.15 B reveal the occupation of the migrant workers and place of migration of the sample households. It establishes that majority of the of the workers move out of the village for production and related works. About 44 per cent of the Hindus and more than 58 per cent of the Muslims migrate for jobs in this sector. Besides, people from the surveyed villages also migrate for job opportunities related with professional, technical, administrative and clerical works; small business as well as services and farm level works Of the total migrant workers more than 31 per cent of the Hindu and about 25 percent of the Muslim workers migrate to the urban centres in search of jobs and about 26 per cent of the Hindus as well as the Muslims go outside the state for different types of employments associated with farm level activities. Urban migration within the district comprises 11 per cent of the Hindu main workers and about 13 per cent of the Muslim main workers. In comparison, rural migration rate (within district, within the state and outside) is lower for the both Hindu as well as Muslim labourers. Table 4.16 reveals the duration of migration of labour from the concerned villages. It is found that more than 70 per cent of the migrant Hindu and about 42 per cent of the Muslim workers migrate for longer duration. This indicates that the Hindu workers migrate for comparatively longer duration of jobs than the Muslim counterpart. 4.8 Land and other Assets 4.8.1 Cultivated Land: Ownership and Operational Holding Table 4.17 A shows the distribution pattern of cultivated land. About 8 per cent of the Hindu and 11 percent of the Muslim household do not possess their own land. Moreover, dominance of marginal and small farmers also creates lower productivity of agriculture in the sample villages. The Table reveals that more than 50 per cent of the Hindu as well as the Muslim villagers are marginal by the nature of the ownership of cultivated land. More than 22 per cent of the Hindu and 26 per cent of the Muslim households do not possess sufficient farming land. Medium and large agricultural land holding is found to be negligible in the surveyed villages. The problem of the lack of ownership of the cultivable land is universal in the village households, it was not found associated with religious segmentation.

30
In terms of operational holdings, about 60 percent of the Hindu and 68 per cent of the Muslim households belong to the category of marginal farmers. In addition, about 29 per cent of the Hindu as well as the Muslim households are small farmers. (Table 4. 17 B). It is needless to say that the differences in terms of ownership and operational cultivated land are mainly due to the process of leasing in and leasing out and also mortgage of cultivated land. Notwithstanding the practices are of different forms, the nature essentially is share cropping on 50:50 basis. As shown in Table 4.18 & Table 4.19 the leased in and leased out practices are significantly higher in case of the marginal farmers. In caser of the Hindu marginal farmers the amount of leased in land and leased out land stands at about 87 per cent and 74 per cent of the total cultivable land respectively. Similarly, in caser of the Hindu marginal farmers the amount of leased in land and leased out land stands at about 88 per cent and 84 per cent of the total cultivable land respectively. However, in case of small and marginal farmers the rate of leasing in and out is lower. Apart from the practices of share cropping on 50:50 basis, same section of the households i.e., the marginal farmers in terms of agricultural ownership, has also been severely affected by the prevailing practices of mortgaging of land for the purposes of acquiring smaller loans. The distribution pattern of mortgaging is shown in Table 4.20 and 4.21. The complex practices of mortgaging and leasing have adversely affected the agricultural scenario of the district. While the practices of share cropping has prevented crop diversification and restricted cropping intensity, the practice of mortgaging amounts to land alienation. Therefore, it reconfirms that technological interventions in absence of institutional reforms can not yield the desired results. 4.9 Livestock In terms of livestock, the sample households mainly possess milch animals, draught animals, goats, sheep and cocks/hen/duck. Around 50 per cent of the Hindu and Muslim households have milch animals. About 60 per cent of the Hindu households and 39 per cent of the Muslim households have draught animals. Similarly, a little more than 60 per cent of the Hindu as well as Muslim households have cock/hen/duck. Table 4.22 provides the pattern of households having different types of livestock. 4.10 Ownership of Productive and other Assets 4.10.1 Agricultural Implements Among the various types of agricultural implements, the households under study mainly possess traditional implements like plough and bullock. Around 50 per cent of the households reported the utilization traditional methods of cultivation using plough and bullocks. Only 3 Hindu households have power tiller whereas 17 Hindu and 39 Muslim households have pump set. Similarly, 26 Hindu and 23 Muslim households reported to have sprayer. Such a structure of the possession is not conducive of agricultural mechanisation. The details of agricultural implements by the household are
given in Table 4.23.
31
4.10.2 Transport The common personal means of transportation of the surveyed households is bicycle. No household is found having four wheelers. The households also make uses the public vehicles when accessible. 4.10.3 Non-agricultural Machinery Implements The non-agricultural machinery in possession of the households mostly includes handlooms. Besides, sewing machine is another item in this category. It is to note that the handlooms provide a small part of additional income to the households in the sample villages 4.10.4 Modern Household Assets Among the modern household assets, a few households were found possessing electric fan, television sets, mobile phone, CD players etc. 4.10.5 Financial Assets Altogether 687 (about 76 per cent) of the households reported to have different types of financial assets including gold and silver ornaments. It is seen that nearly 62 per cent of the households having gold and silver ornaments of which is formed by 42 per cent are Hindu households and 45 per cent are Muslim. However, the banking habit of the households seems to be at a lower level as only about 20 per cent of the Hindu families and a little more than 10 per cent of the Muslim households have financial assets in the forms of saving bank deposits, fixed deposits and secondary market assets. Moreover, households having investments in shares and stocks are quite negligible. Table 4.24 provides the pattern the possession of financial assets by the households. 4.11 Housing Status 4.11.1 House type and availability of living space
The housing status among the sample households (Table 4.25) reveals that almost all the households have their own houses. 88 per cent Hindu and 95 per cent of the Muslim households are reported to have their own houses. On the other hand, about 10 per cent Hindu and 5 per cent of the Muslim households have been the beneficiaries of Indira Awas Yojana/Government housing policy. The data on the type of houses (Table 4.26) shows that more than 81 per cent Hindu and 92 per cent of Muslim households live in Kutcha houses. The rest of the populations live in pucca or semi pucca houses. The availability of housing space for the sample households (Table 4.27) reveals that majority of the households (more than 72 per cent of Hindu and 82 per cent of Muslim households) possess 3 or less than 3 rooms. Of them, about 10 per cent of Hindu and 32 per cent of Muslim households possess only single room houses. Households having 5-10 rooms form only a little more than 7 per cent of the total households.

32
It is evident from the available data that the condition of housing in the studied region is not sufficient to maintain basic standard of life. Moreover, the condition of the Muslim is poorer than the Hindu households. 4.11.2 Domestic lighting and fuel use As shown in Table 4.28, around 90 per cent of the households do not have electricity connection. It is found that only about 22 per cent of the Hindu and 10 per cent of the Muslim households use electricity for lighting purposes. This finding testifies with the Census data of 2001, which showed that the use of electricity for lighting purpose is
insufficient in Muslim households of Assam. Considering the other sources of lighting (Table 4.29), it is found that nearly 40 per cent of the Hindu and 56 per cent of the Muslim household use oil lamps. Besides, oil lamps as sources of lighting other than electricity, the households also reported use of lanterns, petromax and other sources of energy. However, the use of other sources forms an insignificant proportion of the households. The fuel used for cooking is very important for better health, especially for the women who are normally assigned the duty of cooking in Indian families. As per the Census Report of 2001, just about 60 per cent of the rural households do not use any of the modern fuels for cooking such as Liquid Petroleum gas (LPG), electricity or even kerosene. Use of conventional fuel sources like wood, hay/leaves, coal and cow-dung cakes emit smoke leading to different kinds of health hazards to the womenfolk. Although wood is the primary source of cooking among the sample households (nearly 26 per cent of the Hindu and 19 per cent of the Muslim households), it is used in combination of other sources like kerosene, hay/leaves, coal etc. Use of LPG is found negligible among the sample households. Table 4.29 reveals the composition of fuel sources as used by the sample households. 4.11.3 Drinking water facilities Availability and easy access to safe drinking water has been one of the basic objectives under ARWSP. The result of the household survey reveals that the sample households procure drinking water from various sources including hand pumps/tube wells, dug wells, ponds, rives, and streams. No household is found using public water supply. As
shown in the Table 4.30 & Table 4. 33, about 76 per cent of the Hindu and more than 80 per cent of the Muslim households use own hand pump/tube wells. Other sources of water supply have been availed by small segments of the population. It is also observed that majority of the households avail water supply sources within a distance of less than 10 metres. As shown in Table 4.31, more than 62 per cent of the Hindu and 79 per cent of the Muslim households avail drinking water facility within 10 metres.

33
4.11.4 Sanitation and Drainage Facility Absence of proper sanitation facility is prominent in the studied region. As quoted in Table 4.32, only around 6 per cent of Hindu and just above 2 per cent of the Muslim households use septic tank facility. 23 per cent of the Hindu and 30 per cent of the Muslim households use pit latrine. The sanitary practices among the households reveal that some proportions of ST households from Hindu & Christians and Muslims use open field for defecation compared to other social and religious groups in the sample. The use of in-sanitary facilities is the highest among the Muslims in the sample population which establish the low awareness on health and hygienic living of the households. Another important determinant of hygienic living condition is availability, access and use of drainage facility. The absence of civic amenities like drainage is one of the major problems for maintaining a clean environment. The survey findings, as shown in Table 4.34, establish that there is absence of drainage system in the villages. Less than one per cent of the total households have drainage facility in the household. The low literacy of females in the district is one of the important factors influencing poor sanitation and drainage system in the locality. However, the Hindus live in a poorer sanitation status than the Muslim counterpart. 4.12 Indebtedness of Rural Households The incidences of indebtedness among the sample households show that about 70 per cent of the households are not indebted at present. The religion wise enquiry of the total indebted households reveals that in comparison to the Hindus, Muslims are more indebted. The total Muslim debtors stand at around 72 per cent of the total indebted households whiles the remaining 28 per cent Hindus. The number of loans taken by the indebted households ranges from 1 to 3 loans. (Table 4. 35). Around 37 per cent of the Muslim households feel the burden of single loan. On the other hand, among the Hindus no household have the burden of loan repayment for more than two loans. The source wise distribution of the incidence of the burden of indebtedness is shown in Table 4. 36. It reveals that the institutional mechanism plays a pivotal role in providing rural credit preceded by the sources of friends/relatives. Reliance on the formal sources of credit is minimum in comparison to the loans taken from informal sources. Purpose wise incidence of indebtedness (Table 4.37 to Table 4.39) among sample households reveal that while Muslims incur debt for capital expenditure in farm business the reverse is true for the Hindus. This can be substantiated from the findings of the sample village survey which revealed that artisan and handicraft business among the Hindus is one of the main reasons for availing capital expenditure availed from the institutional sources like the commercial banks. Moreover, the amount of loans taken by the Hindus for education related expenses is higher than the Muslims reveal the need and intension of learning among the Hindus in comparison to the Muslim. It is also found that a section of the households irrespective of the religious bend also resort to informal credit to repay back the loans already taken. Other major reasons of
34
indebtedness are associated with unproductive loans taken for marriage and like social ceremonies, medical treatment, household expenditure, purchase of consumer durables besides a portion of productive needs like purchase of livestock and machinery, financial investments etc. Size and class wise distribution of indebtedness show that there exist no significant difference between Muslims and the Hindus as majority of loan amount falls below Rs. 5000. 4.13 Income and Expenditure The net income of the majority of the households (42 per cent Hindus and 49 per cent Muslims) during the previous year of assessment falls below Rs. 19200.00 (Table IV. 40). More than 14 per cent Hindu and Muslim households earned from Rs. 19200.00 to Rs. 22,800.00. Both the categories constitute the size of population living below the poverty line. It amounts to say that more than 50 per cent of the people of the sample villages can be characterized as BPL. It is observed that only about 6 per cent of the total households have income above Rs.72000.00 As shown in Table 4. 41, more than 98 per cent of the households have to make an expenditure of more than Rs. 9000.00 on different items of household consumption. Table 4. 41 A to Table 4.49, explains the detail expenditure pattern of the households in the sample villages. Considering the food items, expenditure of more than 50 per cent households on cereals and pulses have been more than Rs.9000.00, while the same expenditure for 24 per cent household was less than Rs.6000.00 during last one year. Expenditure on vegetables, milk meat etc., of the majority of the households has been upto Rs.9000.00. Expenditure on education for more than 32 per cent households was virtually nil during last one year. This is because of the free primary education policy and absence of students of more than primary education in the sample households. Expenditure on health for more than 45 per cent of the Hindus and 34 per cent of the Muslims amounts to nil in the survey session. However, more than 20 per cent of the Hindus and more than 30 per cent of the Muslims spent more than Rs. 2000.00 last year for health related issues. The other main heads of expenditure for the sample households are clothes and footwear, repairing, construction of house, and ceremony & festivals. About 50 per cent of the population spent up to Rs. 1800 on clothes, footwear and bedding; up to Rs. 1000.00 on festivals and social ceremonies; Rs. 1001-5000 on electricity, gas etc., and up to Rs. 5000.00 on construction and house repairing during the last one year.
4.14 Current Educational Status, Skill and Training
Table 4. 50 to Table 4. 56 provide the details of the educational scenario of the sample population across religion. The important aspects revealed by the present sample survey are summarized in the following paragraphs.

35
The schooling status of the sample households represents that more than 23 per cent of the Hindus and about 20 per cent of the Muslims were either not enrolled in formal schooling or left school after enrolling in the school. About 2 per cent of the population has enrolled themselves in informal schooling. However, about 75 per cent of the total household population have enrolled themselves in public as well as private educational institutions and maintains regularity in attending the schools. Regarding educational qualification, it is observed that more than 60 per cent of the samples are either illiterate or just completed the primary level of education. About 20 per cent of the population has completed middle schooling. Only about 5 per cent of the population has either completed or continuing education above matriculation. The educational institutions where the sample population is enrolled are private as well as public. However, the government schools are higher in number. More than 87 per cent of the schools are government schools whereas 34 per cent of the institutions are in the private sector. Besides, the sample villages are also covered by religious schools like Madrassa, Missionary schools, Non-formal educational institutions etc. It is found that majority of the population enrolled in the educational institutions of the area drop out at an intermediate or even at the preliminary stages of education. The reason for leaving school is primarily the need of earning for the family. Besides, inability to afford educational expenses, and lack of interest in learning etc., are also prominent reasons of high level drop outs from schools. Regarding the expectation to take training programmes, it is found that only 10 per cent of the Hindus and about 5 per cent of the Muslim respondents showed their interest. The training activities that are sought by the sample population include tailoring, weaving, auto mechanic, computer operator, handicrafts etc. They seem to be more interested in on job training.
4.15 Present Health Scenario
The village household survey of the district of Morigaon reveals that the most prevalent diseases suffered by both the religious communities are common fever, cough and cold, malaria, and stomach ailments. Traces of Diarrhea, dysentery, and women & pregnancy related diseases were also found in the surveyed households. Other serious diseases like leprosy, jaundice, typhoid, polio etc., were found in very small spread. Regarding treatment of the ailing household members, it was found that around 60 per cent of the Hindu and 66 per cent of the Muslims have been treated in government hospitals. About 21 per cent of the Hindu and 13 per cent of the Muslims have been treated by private medical practitioners. About 10 per cent of both the Hindu and Muslim households have availed both the facilities of public and private medical care. It The traditional quack methods are found to be used by less than 10 per cent of the households. However, it needs to be noted that the local government health workers and the NGOs
36
have not been able to extend their services across all the surveyed villages as revealed by the sample households. This necessitates the review of assigning public health related tasks to such organizations in future (Table 4.58). So far, the hospitalization of the patients is concerned; only 18 per cent of the Hindu patients and 26 per cent of the Muslims were found to be admitted either in the public or private hospitals (Table 4.59). 4.16 Maternal and Child health The Government of India has been making a continuous thrust on the improvement of maternal and child health care services in the country. The Ministry of Health and Family Welfare is also sponsoring various specific projects under the Maternal and Child Health Programme including Oral Re-hydration Therapy (ORT), Universal Immunisation Programme, Polio Eradication Programme etc. In 1996, these entire programme components were merged into single Reproductive and Child Health Programme (RCH). Besides, in 1976, the Department of Women and Child Welfare, under the Ministry of Human Resource and Development launched Integrated Child Development Programmes (ICDS). Under the ICDS, anganwadi centres were supposed to provide health, education and primary education from birth to the 6 years of age and nutritional & health related services to pregnant and breast feeding mothers. 4.16.1 Immunisation of Children below 5 Years Immunisation of children against six vaccine-preventable diseases including tuberculosis, diphtheria, whooping cough, tetanus, polio and measles is vital for child health as it reduces infant and child mortality rates. Children who receive one dose of BCG and measles each and three doses of DPT and Polio each, excluding the polio dose at birth are considered fully immunized. The present survey shows that the percentage of children fully immunized is not fully satisfactory. As Table 4.60 shows, 50 per cent of the Hindu male and 42 per cent of the Hindu female children are fully immunized while 45 per cent of the Muslim male and 41 per cent of the Muslim female children are fully immunized. It is also found that 74 per cent of the Hindu children are fully immunized by the age of above 23 months. In case of Muslim children the percentage is 77 per cent. This proves that the households are well informed about the policy and practices of immunisation of children (Table 4.61). The role of government agencies regarding child immunisation has been found satisfactory. Altogether, 99 per cent of the total children immunized, irrespective of religion, are immunized at government efforts. The role of NGOs in this regard is quite insignificant. Lack of awareness (43.4 per cent) about the programme of child immunization and non-proximity of facility centres are the main reasons of non-immunization of at least one fourth of the children not immunized (Table 4.63). 4.16.2 Delivery Care One of the most important thrust of the Reproductive and Child Health Programme is to encourage safe delivery with appropriate natal care system. As the National Family Survey 3 (2005-06), reports, three out of every five births in India take place at home. However, institutional delivery has shown a steady rise in the recent past as response to

37
various governmental programmes and special incentives. It is observed that home births are more common in rural areas among women who receive non-antenatal benefits and care with no education. Safe motherhood requires increase in the institutional births, access to trained attendants and increase in literacy and material well being of the rural people. The present study indicates that 77 per cent of deliveries of Hindu mother and 79 per cent of the deliveries of the Muslim mother are taking place at home. Only 19 per cent of the women, irrespective of the religion, gave birth to their child in Goivernment hospitals with a negligible one per cent in private hospitals (Table 4.64). The survey revealed that in respect of assistance in delivery of child, the respondents were found relying more on the untrained dais (48.6 Hindu & 61.6 Muslim). 4.17 Poor and the PDS Support Public Distribution System (PDS) being a powerful instrument of welfare state aims primarily at the enhancement of the standard of living of the poor. Food security is the basic objective of the PDS. To attain this, the PDS incorporates requirements like provisioning for essential commodities at fair price, special provisions for the BPL families and various support programmes specifically meant for the poor. (Table 4.66 to Table 4.69). In the surveyed households it was found that there exist mixed reactions relating to the functioning of the PDS system. It is found that about 60 per cent of the Hindu and more than 65 per cent of the Muslim households are BPL households. Out of the Hindu BPL families 40 per cent have received BPL card while out of the Muslim BPL households 34.5 per cent of the families have BPL cards (Table 4. 67). Similarly, out of the Hindu households 40 per cent and out of the Muslim households 37 per cent households possess APL cards. In respect of availing the PDS ration out of the 48.4 per cent of the Hindu households 54.9 per cent have enjoyed the benefits while out of the 51.6 per cent of the Muslim households 45.1 per cent are found to be benefited from the PDF ration. The effective functioning of the PDS system also depends upon its transparency of operation and making provisions for the focused groups. However, it is found in the survey that more than 60 per cent of the households (31.9 per cent Hindu and 28.4 per cent Muslim) are not able to buy ration from the PDS outlets. Besides poor purchasing power of the households (69.9 per cent of the respondents), and some other factors like lack of adequate PDS supply (21.7 per cent of the respondents) and discrimination by the PDS dealers (less than 2 per cent of the respondents) etc., also prove to be major deterrent in the PDS functioning. 4.18.1 Awareness about Government Schemes Generation of public awareness and community participation are the two major aspects of developmental planning of the democratic nations like India. The Government of

38
India has initiated a number of programmes and policies to ascertain these two aspects. The benefits of such programmes are naturally reaped through active community involvement. The survey responses regarding public participation and awareness are shown in Table 4. 70 to Table 4.71. It is found that more than 50 per cent of the households are aware of the government schemes available for community benefits. In this context, it should be mentioned that the schemes for which the awareness factor is talked about are SGSY, NREGA, IAY, TSD Swajaldhara, ARWSP, Sarvasiksha, ICDS, Anganwadi, Old age/Widow pension, Maternity benefit schemes etc. The study also reveals that there is no specific pattern of benefits enjoyed by a specific religious group from any of the programmes that have been implemented or in the process of implementation. In some the proportion of Hindu beneficiaries are more (e.g., SGSY, IAY) while in some other programmes the Muslim beneficiaries are higher in number (e.g., NREGA, ARWSP, Sarvasiksha, ICDS/Anganwadi/ pension schemes, maternity benefits etc.) However, the participation rate by the Muslim households and benefits accrued thereof are better than their Hindu counterparts (Table 4. 71).
4.18.2 Participation in the Socio-political Affairs People’s participation in the socio-political affairs is a major factor determining the level of awareness and participation. Democratic decentralization of political power in the form of local governance has been one of the significant post-independence political developments of India. The essence of such decentralization process essentially needs active public participation with clarity of political ideology. The baseline survey clearly indicates that political consciousness of the households under study is quite high. Almost 99 per cent of the households reported that they have actively participated in all the elections of the resent past including panchayat, assembly and parliamentary elections (Table 4. 72). So far as membership to socio-religious organizations is concerned; membership to SHGs is found more prominent than panchayat office bearers or membership of religious and other social organizations (Table 4. 73). 4.18.3 Conflict, Insecurity and Access to Media and Communication The district does not have any problems related to communal or other conflicts. As far as the access to media and communication is concerned, the baseline indicates an overall low level of access. Only 5 per cent of the households have the access to the reading of news papers, around 10 per cent watch television and about 23 per cent listen to radio. Community wise access to these media sources establish that the Hindus are better off than the Muslims (Table 4.74). This is also an indication of low level o educational as well as economic condition of the households.

39
4.19 Aspirations The study also tried to enquire into the level of aspirations of the people in the sample villages. As shown in Table 4.75, four most important facilities that the people think are lacking in their villages were communication (38.3 per cent Hindus and 32.3 per cent Muslims), Electricity (27.8 per cent Hindus and 30.2 per cent Muslims), flood protection (7.6 per cent Hindus and 10.1 per cent Muslims), and drinking water (10.3 per cent Hindus and 8.8 per cent Muslims) In terms of deprivation, people mostly think that they are deprived of land (30.7 per cent Hindus and 27.2 per cent Muslims), housing (22.0 per cent Hindus and 31.3 per cent Muslims), employment (23.4 per cent Hindus and 12.1 per cent Muslims), education, health etc. Therefore the major aspirations among the households emerge in terms of better transport and communication (7.6 per cent Hindus and 8.6 per cent Muslims), improved electricity supply (5.5 per cent Hindus and 6.3 per cent Muslims), provisions for safe drinking water(0.7 per cent Hindus and 1.1 per cent Muslims), better healthcare (1.6 per cent Hindus and 0.4 per cent Muslims) and education (3.4 per cent Hindus and 4.1 per cent Muslims) and employment opportunities (13.1 per cent Hindus and 14.7 per cent Muslims). However, it is surprising to find that about 40 per cent of the households did not put their opinion regarding the welfare related aspirations for them (Table 4.76 to Table 4.77). The urgency of providing these services and opportunities to the minority concentrated
areas can particularly be given importance due to their relative backwardness and poverty
as evident from the present study.■

40
PART V
DEVELOPMENT DEFICITS Morigaon is comparatively a smaller district of Assam with slow pace of economic progress. However, in terms of basic human capabilities, as evident from the Human Development Index (HDI), the district has been performing well over the years. Due to lower rate of industrialization and traditional agricultural practices, the district economy profile has not been encouraging to substantiate the aspirations of economic better off of the inhabitants. It is to be noted in this context that the district has tremendous possibilities of development almost in all the fields of its economy. However, there are several development deficits leading to its economic stagnation. Particularly, the rural areas are marked with severe problems of the basic requirements of life including education, health, sanitation, transport and communication and so on. The urgency is to enhance the quality of the life of the people and to provide economic security. Moreover, the problems faced by the district are not basically religion-centric.
Developmental Deficits in Morigaon District and Their Priority Ranking
Sl. No.
Indicators Survey Result
Estimate for India
Deficit Priority Ranking attached
Socio-economic indicators
1 Rate of literacy 59.28 67.30 -5.56 5
2 Rate of female literacy 48.98 57.10 -4.69 6
3 Work participation rate 38.81 38.00 -0.45 7
4 Female work participation rate 7.18 21.50 -18.50 4
Basic amenities indicators
5 Percentage of pucca houses 4.00 59.40 -47.62 1
6 Percentage of households with access to safe drinking water 88.12
87.90 10.22 8
7 Percentage of households with sanitation facilities 40.56
39.20 18.64 10
8 Percentage of electrified households 18.44 67.90 -38.06 2
Health indicators
9 Percentage of fully vaccinated children 59.14 43.50 15.14 9
10 Percentage of institutional delivery 20.70 38.70 -28.00 3 All the communities living in the have been confronting with similar problems of economic deprivation leading to a serious threat of maintaining the basic status of living. The striking deficits are highlighted below:
The literacy rate of the district is below the State average. The rural areas are highly deprived of required education infrastructure leading to an alarming rate of illiteracy.

41
Government intervention is urgently sought in removing these lags through the provisioning of better education infrastructure, adult literacy programms, and education scholarship etc. In implementing these, the religious minority and the ST & SC population should be given top most priority.
The agricultural sector should be revamped with farm mechanization, introduction of multiple cropping, providing crop loans at subsidized rate and provision for adequate marketing of agricultural products. Besides, the Government may also sort out a policy to provide farm level training to the actual cultivators for scientific cultivation. This will make farm level production efficient as well as profitable. Development of horticulture, sericulture and related activities should also be geared up.
The study indicated presence of both unemployment and incidence of underemployment dominate the rural Morigaon. Appropriate action must be taken to provide adequate employment opportunities to the rural youth. The pressure of unemployment may be reduced a lot by creating self-employment avenues or by creating an environment to encourage youths to take up self-employment activities. Implementation of effective training, financing and monitoring of the trained personnel may be the best feasible step towards relieving the pressure of unemployment.
The overall condition of housing in the rural areas of the district has not been found satisfactory. The policies of the government to provide adequate and hygienic living space for the rural community should provide greater stress on these premises.
The problems of sanitation and safe drinking water are also found in certain areas of Morigaon. Although the majority of the households have access to safe drinking water, a sizeable portion of the religious minorities and SC/ST population use drinking water from unsafe sources. In order to ensure safe drinking water, government intervention is urgently sought.
It is significant to note that engraved with the problems of illiteracy, low level of living and ignorance, the village households are also not keen on being benefited by the public health services whatsoever is available. It has been found that most of the child delivery cases take place at home under the guidance and support of the untrained dhais. The rate of full immunization is also low. Such deprivation is created by the village households themselves. Awareness generation about their rights and responsibilities should be prime concern in this regard.
The survey also establishes that the villages are witnessing poor social measures. A good number of the BPL families do not yet have BPL cards. The PDS has not been fully successful in achieving its target. Insufficient and poor quality commodities, discrepancies in the conduct of the PDS etc dominate the system.
The communities, irrespective of their religion and castes, suffer from the common
perceptions that they are deprived of land, housing, health, education and employment.
The major aspirations of the people that have emerged through the survey are
communication, safe drinking water, and better health care and employment
opportunities.■

42
LIST OF SURVEYED VILLAGES Sl. No. VILLAGE
1 Pookarkata
2 Barukata Saharia
3 Auguri
4 Katharbari
5 Bangaldhara (Matiparbat)
6 Barigaon
7 Palahguri
8 Nowagaon
9 Kapahera
10 Barsaka Baha
11 Dongapar
12 Barkha Ball
13 Chataraibari
14 Saharia Gaon
15 Borthal Kachari gaon
16 Komarbori
17 Udalbheti Pathar
18 Moritoli
19 Mahmara Bill
20 Barunguri Bill
21 Bhomoraguri
22 Tup Gaon
23 Udkati
24 Barkurani
25 Shindheswar PGR
26 Kukuwari
27 Gagalmari Ashighar
28 Chitalmari Gaon
29 Hatramukh
30 Barpak Jungle