distribution of total mercury in cache creek · pdf filethe average mercury concentration in...
TRANSCRIPT

CENTRAL VALLEY REGIONAL WATER QUALITY CONTROL BOARD
MERCURY INVENTORY IN THE
CACHE CREEK CANYON
Staff Report
February 2008
CALIFORNIA ENVIRONMENTAL PROTECTION AGENCY

STATE OF CALIFORNIA Arnold Schwarzenegger, Governor
CALIFORNIA ENVIRONMENTAL PROTECTION AGENCY Linda S. Adams, Secretary
REGIONAL WATER QUALITY CONTROL BOARD CENTRAL VALLEY REGION
Karl E. Longley, Chair Katherine Hart, Vice Chair Paul Betancourt, Member Cheryl K. Maki, Member
Sandra O. Meraz, Member Sopac Mulholland, Member Dan Odenweller, Member
Pamela C. Creedon, Executive Officer
11020 Sun Center Drive #200 Rancho Cordova, CA 95670
Phone: (916) 464-3291
eMail: [email protected] Web site: http://www.waterboards.ca.gov/centralvalley/
D I S C L A I M E R This publ ication is a technical report by staff of the
Cal i fornia Regional Water Qual i ty Control Board, Central Val ley Region. No pol icy or regulat ion is ei ther expressed or intended.

CALIFORNIA ENVIRONMENTAL PROTECTION AGENCY
REGIONAL WATER QUALITY CONTROL BOARD CENTRAL VALLEY REGION
MERCURY INVENTORY IN THE CACHE CREEK CANYON
Staff Report
February 2008
REPORT PREPARED BY:
Chris Foe And
David Bosworth

EXECUTIVE SUMMARY
Methyl mercury is a developmental toxin for both humans and wildlife. The primary route of exposure is through consumption of fish. Advisories have been issued for Cache Creek and the Sacramento-San Joaquin Delta Estuary recommending limited human consumption of sport fish because of elevated methyl mercury levels. Methyl mercury in fish is produced by sulfate reducing bacteria in sediment. The inorganic mercury concentration of sediment is an important factor controlling methyl mercury production by sulfate reducing bacteria. The Cache Creek watershed is about 2 percent of the landmass of the Central Valley but exports about sixty percent of the mercury. Half of the mercury from Cache Creek is trapped in the Cache Creek Settling Basin and the remainder is exported to the Delta. Therefore, understanding sources and distribution of mercury in Cache Creek and developing control programs to reduce exports is a high priority for the State of California. The purpose of this study was threefold. First, conduct a survey of tributaries and flood plains in the Cache Creek canyon to ascertain the spatial distribution of mercury in their sediment. Second, use this information, if possible, to identify source(s). Finally, estimate the amount of mercury stored in the Canyon and available for downstream transport to the Cache Creek Settling Basin and the Delta.
The strategy for determining mercury sources was to identify tributaries with both elevated sediment mercury levels and higher concentrations downstream of their confluence with Cache Creek than above. One hundred and five sediment samples were collected and analyzed for mercury in the Cache Creek watershed between Clear Lake, Indian Valley Reservoir and the confluence of Bear Creek. There was no statistical difference in mercury concentration in sediment collected in the North Fork between Indian Valley Reservoir and the confluence with Cache Creek, between Clear Lake and the confluence with the North Fork and between the confluence of the North Fork of Cache Creek and Harley Gulch. The average background mercury concentration in sediment from the three areas was 0.06, 0.10, and 0.09-ppm in silt, sand and gravel sized material, respectively. Mercury concentration in Cache Creek increased statistically below Harley Gulch compared with upstream background concentrations. The average mercury concentration in 78 sediment samples collected in Cache Creek between Harley Gulch and Bear Creek was 0.98, 0.77 and 0.89-ppm in silt, sand, and gravel sized material, respectively. This represents an 8 to16-fold increase when compared with background levels above Harley Gulch. Sediment from the Harley Gulch delta, Crack Canyon and Davis Creek had statistically higher mercury concentrations than background material collected in Cache Creek above Harley Gulch. Mercury concentrations in silt and sand sized material from the Harley Gulch delta averaged 4.83 and 4.20-ppm, respectively. This is 81 and 42 times higher than background concentrations in similar sized material from above Harley Gulch. No gravel-sized material was collected in Harley Gulch.
1
The average mercury concentration in sand from Davis Creek was 0.84-ppm. Harley Gulch and Davis Creek are the only tributaries in the Cache Creek canyon with mercury mines. The source of contamination in Crack Canyon is not known but warrants investigation. The mass of mercury in the Cache Creek canyon was calculated by multiplying the volume of sediment in depositional areas by its surface mercury concentration. Twenty-two hundred kg of mercury are calculated to be present in the 15-miles of canyon between Harley Gulch and Bear Creek. Eight hundred and fifty-five kg are estimated to be in depositional piles between Harley Gulch and Crack Canyon. The origin of this material is most likely from Abbott and Turkey Run mines in Harley Gulch as no other upstream source has been identified. The source of mercury in sediment below Davis Creek is likely a combination of inputs from mines in Harley Gulch and Davis Creek and from the unknown source in Crack canyon.
2

INTRODUCTION Methyl mercury is a developmental toxin for humans and wildlife. The life stage most at risk is developing fetuses and young. The primary route of exposure is through consumption of methyl mercury-contaminated fish. A fish advisory has been issued for Cache Creek and the downstream Sacramento San Joaquin River Bay-Delta Estuary recommending limited human consumption of sport fish because of elevated mercury levels (California Office of Environmental Health Hazard Assessment, 2005; 2007). The advisories led the State of California to place Cache Creek and the Bay-Delta Estuary on the Federal Clean Water Act 303(d) list for impaired waters and prepare Total Maximum Daily Load (TMDL) reports to the U.S. EPA as required by federal statute (Wood et al., 2006; Cooke et al., 2004). A Basin Plan Amendment to control mercury has also been adopted by the Central Valley Regional Water Quality Control Board for Cache Creek as required by the State of California Porter-Cologne Water Quality Control Act (Cooke and Morris, 2005). The Basin Plan Amendment commits Regional Board staff to complete “assessments…to determine whether responsible parties should be required to conduct feasibility studies to evaluate methods to control sources of mercury…Assessments are needed of stream beds and banks in…Cache Creek from Harley Gulch to Camp Haswell...”. This is the first of a series of assessment reports in fulfillment of the Basin Plan commitment. The methyl mercury in fish is produced by sulfate reducing bacteria in sediment (Compeau and Bartha, 1985; Gilmour et al., 1992). All the factors controlling methyl mercury production by sulfate reducing bacteria are not known. However, the inorganic mercury content of the sediment is an important factor. The evidence is threefold. First, positive correlations exist between methyl and inorganic mercury concentrations in freshwater sediments, including the Bay-Delta Estuary (Heim, 2003). Inorganic mercury concentrations account for 19 percent of the variation in sediment methyl mercury concentrations in the Bay-Delta Estuary. More inorganic mercury results in more methyl mercury. While small, the positive correlation is statistically significant. The predictive ability of the relationship improves when comparisons are restricted to similar types of aquatic habitats and the total mercury concentration of the sediment is less than 1-ppm. Second, increasing concentrations of inorganic mercury have been added in the laboratory to sediment cores and increasing concentrations of methyl mercury measured in the overlying water (Bloom, 2003; Rudd et al., 1983; Kimball, 2005). These studies include mercury contaminated sediment from the Cache Creek drainage amended back into sediment from both Cache Creek and the Yolo Bypass (Bloom, 2003; Kimball, 2005). The experiments confirm that the inorganic mercury content of sediment is one factor controlling the rate of methyl mercury production by sulfate reducing bacteria. Finally, the methyl mercury concentration in fish at contaminated sites has declined after control measures were instituted to reduce incoming inorganic mercury loads (reviewed in Cooke et al., 2004). Together, the above three lines of evidence demonstrate that one
3

method of reducing methyl mercury levels in fish is to reduce incoming loads of inorganic mercury and thereby reduce concentrations in sediment where bacteria reside. The Cache Creek watershed is responsible for a disproportionate amount of all the mercury entering the Bay-Delta Estuary. A twenty-year mercury mass balance1 has been calculated for the estuary (Wood et al., 2006). Cache Creek is about 2 percent of the landmass of the Central Valley but exports about sixty percent of the mercury. Half of the mercury from the Cache Creek watershed is trapped in the Cache Creek Settling Basin and the rest exported to the Yolo Bypass2. Mass balance calculations suggest that a significant part of the mercury transported by Cache Creek originates in the canyon between the confluence of the North Fork and Bear Creek (Foe and Croyle, 1998; Figure 1). However, the sum of tributary inputs in this critical reach only explains about twelve percent of the measured load (Cooke et al., 2004). The discrepancy is consistently greatest during winter high flow suggesting that the unknown source(s) may either be ephemeral streams that only flow in wet weather or that the loads predominately originate from erosion of contaminated bed and bank sediment not normally underwater and available for scour. Unfortunately, the 13-mile stretch of the Cache Creek canyon is very inaccessible making detailed wet weather studies impossible. Nonetheless, identification of wet weather sources is essential to determine whether they are controllable and might eventually constitute an option for reducing downstream mercury loads. Inorganic mercury exported from Cache Creek contributes to methyl mercury production in wetlands in the Yolo Bypass. Wetlands are known to be efficient sites for the production of methyl mercury (as reviewed in Wiener et al., 2003). Several environmental organizations and the State of California have purchased land in the Yolo Bypass for wetland restorations. Recent purchases include the Vic Fazio Wildlife Refuge (16,000 acres), Liberty Island (10,000 acres) and Little Holland Tract (4,000 acres). Ongoing studies have confirmed that the Yolo Bypass is a major source of methyl mercury when flooded. Mass balance calculations indicate that the Bypass produced about 40 percent of all the methyl mercury discharged from the Sacramento watershed when flooded in the winter and spring of 2005/2006 (Foe et al., 2007). This is surprising as the Sacramento watershed is much larger than the Bypass3. Monitoring of small fish in the flooded Bypass demonstrated that they acquired some of the highest methyl mercury concentrations in the Central Valley and confirmed that the methyl
1 Mercury loads to the estuary are a function of water year (WY) type. More mercury is
transported into the estuary in wet than dry years. WY 1984-2003 were selected for the mass balance calculation as the 20-year time period includes a mix of wet and dry years that are statistically similar to what has occurred in the Sacramento Basin since accurate water records began to be collected 100 years ago.
2 Portions of the Yolo Bypass are within the legal boundary of the Sacramento-San Joaquin River Bay-Delta Estuary.
3 The Yolo Bypass and Sacramento Basin are 59,000 and 16,765,000 acres, respectively. So, the Bypass is 0.4 percent of the landmass of the Sacramento Basin.
4

mercury was biologically available and being incorporated into the aquatic food chain (Slotton et al., 2007). The findings are disquieting and suggest that mercury contamination from upstream sources, such as Cache Creek, may complicate downstream wetland restoration. Therefore, controlling inorganic mercury loads that contribute to the disproportionate production of methyl mercury in the Bypass should become a high priority for the State of California. The purpose of this study was threefold. First, survey tributaries and flood plains in the Cache Creek canyon to ascertain the spatial distribution of mercury in sediment. Second, use this information, if possible, to identify source(s). Finally, estimate the amount of mercury stored in the Canyon and available for downstream transport.
METHODS AND MATERIALS
Setting Cache Creek is an eleven hundred square mile watershed in the California coast range (Figure 1). The basin is divided into three sub watersheds: the north and main forks of the Cache Creek and Bear Creek. All three water bodies flow year round. The north and main forks are regulated by dams at Indian Valley reservoir and Clear Lake, respectively. The reservoirs trap winter runoff for release in summer for agriculture. Bear Creek has no dams. Almost all the summer flow is diverted out of Cache Creek at Capay Dam. Controlled summer flows likely mobilize fine grain material from the creek bed and transport it to Capay dam where the material is diverted out of the channel and deposited on local farm land. During non-irrigation season (September to March) the inflatable dam at Capay is removed and larger more turbulent winter storm flows can scour contaminated sediment from the creek bed and transport it downstream to the Cache Creek Settling Basin and the Yolo Bypass. The Cache Creek watershed includes portions of three historic mercury mining districts. Sulphur Bank Mine in the Clear Lake mercury mining district is the largest mercury mine in the watershed and is now a USEPA superfund site. Sulphur Bank Mine operated from 1875 to 1957 and is thought to have produced 4.7-million kg of mercury (Suchanek et al., 1997). About 0.1-million kg of mercury mine waste is now in sediment in Clear Lake (Suchanek et al., 1995) and may be available for transport down Cache Creek. The Sulfur Creek mining district consists of the Abbott-Turkey Run, Wide Awake, Manzanita, Empire, Central, Elgin, Clyde and Rathburn-Petray mercury mines. The Abbott-Turkey Run mine is in the Harley Gulch drainage while the Rathburn-Petray complex discharges to Bear Creek. The other mines drain to Sulfur Creek, which is tributary to Bear Creek. The Abbott-Turkey Run complex was the largest mining operation in the Sulfur Creek district and is estimated to have produced about 1.8-million kg of mercury (Churchill and Clinkenbeard, 2003). Production for the entire Sulfur Creek district is about 2-million kg. Finally, the Knoxville mercury
5

mining district includes the Reed, Harrison and Manhattan mercury mines in the Davis Creek watershed. These mines operated from 1860 to 1978 and produced between 2.4 and 2.8-million kg of mercury (Lehrman, 1985). In 1984, the Homestake Mining Company purchased the site and impounded Davis Creek to create the Davis Creek reservoir to provide water for gold production. The Company also reclaimed mine waste and plugged the Reed mine adit. These action should have significantly reduced the off site movement of mercury. Nonetheless, annual monitoring of reservoir sediment demonstrates that Davis Creek Reservoir trapped an average of 72 kg of mercury per year for the 9 year period between 1993 and 2002 from the three upstream mines (Slotton et al., 2002). Off site movement of mercury prior to remediation and construction of the reservoir by Homestake may have been higher. Mercury Inventory During the winter of 2003 and again in 2004 Regional Board staff walked the Cache Creek canyon collecting sediment samples from major point bars and flood plains and from the mouth of tributary creeks to ascertain the distribution and mass of mercury in the canyon. Floodplains and creeks were identified a priori from an aerial photograph of the canyon provided by the California Department of Conservation (Appendix A). Three composite samples were collected in most instances from all large sediment deposits. Each composite was composed of 5 to 10 sub samples of about equal volume. Sub samples were collected with a trowel from the surface to a depth of about four inches over a 25-m2 area. Care was taken to collect the composite samples from different elevations in each deposit to insure that the entire pile was characterized. Sediment samples from the tributaries were collected upstream of the high water mark from Cache Creek. The weight of sediment in each deposit (kg) was estimated from equation 1: (1) Weight (kg) = Elevation (m) x Surface Area (m2) x 1530 (kg/m3)
where elevation was the average height of the deposit above water level. Height was estimated during the field surveys. Surface area was computed from the aerial photograph using ArcView GIS software. A conversion factor of 1530 kg/m3 was used to translate volumes of loosely mixed sand to weight (Dunn et al., 1981). The location, dimensions and weight of sediment in each depositional pile is provided in Tables B1 and B3 of Appendix B. Similar information for each tributary is in Table B2. All composite samples were dried, homogenized and a known weight of material sequentially sieved through 65, 1,000, and 3,500-µm mesh screen. The size fractions were reweighed after sieving to estimate the fraction of the total weight each represented. A sub sample from each fraction was also submitted for
6

mercury analysis. Size fractions less than 65, between 65 and 1,000 and between 1,000 and 3,500-µm are called silt, sand and gravel in this report4. The mercury content of each depositional pile was determined by summing the mercury content of the three size fractions (equation 2): (2) ∑ (Total Weight (kg) x Weight of Fractioni x Mercury Concentration of
fractioni (mg/kg)) i=3 size fractions Where Total Weight is the estimated weight of the flood plain deposit from equation (1). The Weight of Fractioni and Mercury concentration of Fractioni are the proportion of the total weight and the mercury concentration of each size fraction, respectively. The mass of mercury in each deposit was estimated by summing the mercury mass of each fraction and averaging the values for the three composites. The inventory of mercury in each depositional pile in the Cache Creek Canyon is summarized in Table B3. Knowledge about the mercury content of each size fraction may be helpful in understanding the fate of the material (Knighten, 1992). Fine grained material, like silt, is readily transported by laminar flow such as occurs in Cache Creek in summer. In contrast, larger sand and gravel type material can only be moved up into the water column by more turbulent flow and usually must be broken down into smaller particles by physical and chemical weathering before being transported downstream. Mercury Analysis The mercury concentrations of sediment samples were analyzed by two laboratories. ALS Chemex5, a certified analytical company specializing in assaying mine grade material, analyzed the samples collected in 2003 using cold vapor atomic absorption (EPA method 245.5). Because of possible quality assurance/quality control problems, all subsequent analysis was performed by the California Department of Fish and Game at Moss Landing Marine Laboratories6. Moss Landing Marine Laboratories analyzed mercury using a flow injection mercury system (CALFED, 2000). Standard reference material and duplicate field samples were analyzed by each laboratory to estimate accuracy and precision. All results are reported as mg mercury per kg dry weight sediment or (ppm).
4 Technically, silt are all particles less than 64-µ, sand between 64 and 2,000 µm and gravel
greater than 2,000µm (Knighton, 1984) 5 ALS Chemex, 994 Glendale Ave, Unit 3, Sparks, Nevada 89431-5730 6 Moss Landing Marine Laboratories, 7544 Sandholdt Road, Moss Landing, CA 95039
7

Statistics Differences in sediment mercury concentration were analyzed with non-parametric statistics as transformations could not be found to eliminate the strong correlations between means and variances. Statistica software was employed for all the statistical analysis7 .
RESULTS AND DISCUSSION Quality Assurance/Quality Control Program The program assessed the accuracy and precision of laboratory measurements. Accuracy was measured by both the analysis of standard reference material with a certified mercury content and by amending a known amount of mercury into Cache Creek sediment and measuring the percent recovery. Precision was measured by repeated analyses of laboratory and field duplicates. The accuracy and precision of ALS and MLML were satisfactory and the results adequate for estimating mercury concentrations and loads in the Cache Creek canyon. Results from the quality assurance/quality control program are summarized more fully in Appendix C. Source and Distribution of Mercury The primary source(s) of mercury in Cache Creek were identified by measuring concentrations in sediment deposits in the Creek canyon and in all tributaries. The strategy for determining mercury sources was to identify tributaries with both elevated sediment mercury levels and an increase in sediment concentration downstream of the confluence with Cache Creek than above. Background mercury concentration in sediment in Cache Creek above the confluence of Harley Gulch was ascertained from sediment samples collected from the North Fork of Cache Creek between Indian Valley Reservoir and the confluence with Cache Creek, from Cache Creek above the confluence with the North Fork, and from Cache Creek between the North Fork and Harley Gulch (Figure 1b and Table 1). There was no difference in mercury concentration in sediment collected between the confluence of the North Fork and Harley Gulch and from either of the other two upstream reaches of the Creek (P>0.05, Kruskal-Wallis test). The average background concentration in 14 samples collected from the watershed above the confluence of Harley Gulch was 0.06, 0.10, and 0.09-ppm mercury in silt, sand, and gravel sized material, respectively. Clear Lake is one of the most mercury contaminated freshwater lakes in the world (Suchanek et al., 1997). Sediment mercury concentrations in the Oaks Arm near Sulphur Bank mine are as high as 400-ppm. Concentrations decrease
7 Statistica StatSoft, http:// www.statsoft.com
8

to 1 to 10-ppm mercury in the Lower Arm where water is discharged through the dam to Cache Creek. The finding in this study that sediment mercury levels in Cache Creek below the Clear Lake dam are low is consistent with earlier observations that only small mercury loads leave the dam (Foe and Croyle, 1998). Apparently, most of the mercury from Sulphur Bank mine is being sequestered in Clear Lake and is not discharged to Cache Creek. The mercury leaving Clear Lake is likely carried on silt-sized material and is efficiently transported through the Cache Creek canyon. Mercury concentration increases in sediment in Cache Creek below Harley Gulch when compared with background levels from the upper watershed (Table 1). The increase is statistically significant for silt collected in Cache Creek between Jack and Judge Davis Creeks, Trout and Crack Creeks, Crack and Davis Creeks, and Davis and Bear Creeks (P<0.01, Kruskal-Wallis Test). For sand the increase is significant between Trout and Crack Creeks and Davis and Bear Creeks (P<0.001, Kruskal-Wallis Test). Finally, for gravel the increase is significant for reaches of the Creek between Trout and Crack Creeks, Crack and Davis Creeks, and Davis and Bear Creeks (P<0.05, Kruskal-Wallis Test). Average mercury concentration in 78 sediment samples collected from Cache Creek between Harley Gulch and Bear Creek is 0.98, 0.77 and 0.89-ppm in silt, sand and gravel sized material, respectively. These values represent a 16, 8, and 10-fold increase for each of the three size fractions compared with background levels for the watershed above Harley Gulch. Sediment samples were collected from each tributary in the Cache Creek Canyon and analyzed for mercury. Harley Gulch, Crack Canyon and Davis Creek had higher concentrations than the background level measured in the watershed above Harley Gulch (Table 2). Mercury concentrations in silt and sand sized material from the Harley Gulch delta averaged 4.83 and 4.20-ppm, respectively (Ichikawa and Jakl, 2004). No gravel-sized material was collected for analysis from Harley Gulch. Mercury concentrations in silt and sand from Harley Gulch are 81 and 42 times higher than background levels in similar sized material from the upper watershed. Both differences are statistically significant (P<0.0001, Kruskal-Wallis test). Mercury concentrations in gravel from Crack Canyon were elevated when compared to background levels from the upper basin (P<0.05, Kruskal-Wallis test). The gravel sized material averaged 0.38-ppm mercury. This represents a 4-fold increase above background levels measured in upper Cache Creek. Finally, mercury concentration in sand sized material from Davis Creek is also elevated when compared to concentrations from the upper watershed. The average mercury concentration in sand from Davis Creek is 0.84-ppm. The difference is significant when compared to background levels in sand in the upper Cache Creek watershed (P<0.05, Kruskal-Wallis test). Harley Gulch and Davis Creek are the only tributaries to this section of the Cache Creek canyon with mercury mines. The source of the contamination in Crack Canyon is not known but warrants investigation.
9

Mercury mines in Harley Gulch and Davis Creek are known to have erosive sediment with elevated mercury levels. Mercury concentrations in mine waste at Abbott and Turkey Run have been measured in the hundreds of ppm (Churchill and Clinkenbeard, 2003). An investigation was undertaken to determine whether there might be other tributary sources of mercury in the Harley Gulch drainage and none was found (Ichikawa and Jakl, 2004). So, the high concentration of mercury in sediment in the depositional zone at the confluence of Harley Gulch and Cache Creek must have originated from the two upstream mines. The elevated mercury levels in Cache Creek sediment for seven miles between Harley Gulch and Crack Canyon must also have come from the Abbott and Turkey Run mines as no other upstream source has been identified. Slotton et al. (2002) have measured sediment mercury concentrations annually for nine years in Davis Creek reservoir. The reservoir is located below the Reed, Harrison and Manhattan mercury mines. Sediment concentrations range between 0.1 and 94.7-ppm with a 9-year whole reservoir average of 2.1-ppm mercury. Many of these values were obtained after Homestake removed contaminated waste piles from the abandoned mine sites and sealed the adit from the Reed mine. Presumably, sediment with similar or higher mercury concentrations may have been exported from the Davis Creek watershed prior to construction of the dam. So, elevated mercury in sediment in Cache Creek downstream of Davis Creek is most parsimoniously explained as a mix of inputs from Abbott and Turkey Run mines, Crack Canyon and the Reed, Manhattan and Harrison mines.
10

Mercury Inventory Four holes were dug in depositional sediment piles and samples taken at increasing depth to determine whether mercury concentration changed as a function of depth. The location of the holes were in the Harley Gulch delta, between Rocky and Harley Gulch, between Crack and Davis Creek, and downstream of Davis Creek (Figure 1). The data for the Harley Gulch delta is from Ichikawa and Jakl (2004). Replicate samples for mercury analysis were only taken in holes dug in the Harley Gulch delta and downstream of Davis Creek. So, a within-hole statistical analysis is only possible at these two locations. No change in mercury concentration was detected in any size fraction as a function of depth at either location (P>0.08, Kruskal-Wallis test; Figure 2). Next, data from all four holes were combined and a regression analysis performed to assess whether there was evidence that concentrations changed in all the holes with depth (Figure 3). The mercury content of silt and sand decreased with increasing depth while gravel concentrations increased. However, none of the slopes were statistically different from zero, again, suggesting that mercury concentration is independent of depth. Therefore, the assumption is made here that the entire mass of all depositional piles has the same mercury concentration as was measured in their surface sediment. The mass of mercury in the canyon was calculated by multiplying the volume of sediment in depositional areas by its surface mercury concentration. The largest volumes of sediment were found in flatter areas of the canyon with broader floodplains. In particular, Wilson Valley between Rocky and Judge Davis Creeks, Kennedy Flat between Trout and Crack Canyon, and the area below Davis Creek have large deposits of sediment (Appendix A, Table 3). These areas also contained the largest amounts of mercury. However, on a-per-weight basis, the mercury content of sediment is greatest below the confluence of Davis Creek (Table 1). Higher mercury concentrations below Davis Creek may be because sediment from Davis Creek was historically more contaminated than what arrived from upstream and some of the Davis Creek material is still there or because much of the sediment from the upper basin, including Harley Gulch, has not yet had time to travel beyond this point. The study estimates that about 2,200 kg of mercury are present in the 15-miles of canyon between Harley Gulch and Bear Creek (Table 3). This estimate does not include the 15 to 20-kg of mercury contained in the Harley Gulch delta (Cooke and Morris, 2005). Eight hundred and fifty-five kg are estimated to be in depositional piles between Harley Gulch and Crack Canyon. The origin of this material is most likely from Abbott and Turkey Run mines in Harley Gulch. The source of the mercury below Davis Creek is likely a combination of inputs from Abbott and Turkey Run, Reed, Manhattan and Harrison mercury mines and the unknown source in Crack canyon.
11

Uncertainty about the 2,200-kg mercury inventory for the Canyon may range between a low of about half this value to, perhaps, twice the amount. The lower value (1,100-kg) is estimated from observations that, perhaps, up to half the sediment in depositional areas is cobble and larger sized material and has little or no associated mercury. The upper value (4,400-kg) results from the fact that almost none of the smaller depositional piles have been sampled. These likely have a mercury-content similar to adjoining larger deposits that were assayed, but their combined mass has not been estimated and their mercury content included in the 2,200-kg estimate. Our best professional judgment is, after walking the canyon twice, that the combined volume of all the smaller unmeasured deposits is not likely to exceed the volume of material already sampled. The mercury inventory in the Cache Creek canyon can be compared with the amount of mercury produced and lost in the watershed during mining. Historically, mercury mining was inefficient and up to 25 percent of the processed material may have been lost to the environment (Churchill, 1999). Major losses occurred in retort furnaces and calcine waste piles. Not all the lost material was transported to local creeks. Sulphur Bank mine in Clear Lake may be considered as an example. The mine is estimated to have produced about 4.7 million kg of mercury and about 0.1 million kg is now sequestered in lake sediment (Suchanek et al., 1995, 1997). If it is assumed that all the mercury lost to water now resides in Clear Lake, then about 2 percent of the total production was lost to the aquatic environment8. Mercury production in Harley Gulch and Davis Creek are estimated to between 4.2 to 4.6 million kg (Lehrman, 1985; Churchill and Clinkenbeard, 2003). If 1 to 2 percent of their production was lost to the aquatic environment, then losses to Cache Creek would be between 42,000 and 84,000 kg of mercury. The inventory of mercury in the Cache Creek canyon is 2,200 kg or 3-6 percent of this amount. Churchill and Clinkenbeard (2003) estimate that 51,000 to 53,000 kg of mercury remain in calcine piles in the Sulfur Creek mining district. The U.S. EPA CERCLA action is reported to have stabilized 400,000 cubic yards of mine waste at the Abbott Turkey Run mine complex in the Sulfur Creek mining district (USEPA Region 9, 2007). This may have prevented eventual off site movement of between 68,000 and 110,000 kg of mercury9. No estimate is available for the amount of mine waste at the Davis Creek mining complex. By comparison, the TMDL for the Bay-Delta estuary estimates that 240 kg per year are exported from the Cache Creek watershed (Wood et al., 2006). Obviously, all these calculations are rough but they place the Cache Creek canyon mercury inventory in perspective.
8 (100,000 kg lost/4,700,000 kg produced) x 100 9 Average mercury content of Abbott and Turkey Run waste rock and mining tailing piles are
between 143 and 238 ppm mercury (27 June 2006 letter from Iain Baker to Janet Yocum). This translates to between 68,000 and 110,000 kg of mercury in the 400,000 cubic yards of stabilized mine waste.
12

Grain size analysis reveals that more than 75 percent of the mercury in the Cache Creek canyon is contained in sand and larger sized material (Table 3). This material is only mobilized and transported in the wash load during higher, more turbulent flow (Knighton, 1992). The finding that most of the mercury is contained in larger size fractions is consistent with earlier observations that large loads of mercury only originate from the canyon during high runoff events (Foe and Croyle, 1998) and suggests that erosion of larger sized depositional material may be part of the explanation for larger loads during high flow. A second possible explanation is that some of the mercury observed at the exit to the Cache Creek canyon may originate in the eight miles between the Davis Creek reservoir Dam and the confluence with Cache Creek. No study has yet attempted to measure mercury loads exiting from Davis Creek at its confluence with Cache Creek during high flow. It is possible that high flows in Davis Creek are also scouring historic mine waste and transporting it downstream. The Regional Board should make it a high priority to inventory mercury loads in the Davis Creek watershed and conduct a loading study to determine whether significant amounts of mercury are being scoured from the watershed and transported to Cache Creek during storm events. Cache Creek continues for 48-miles after the confluence with Bear Creek before discharging into the Cache Creek Settling Basin and the Yolo Bypass. Average sediment mercury concentrations in the Settling Basin range between 0.32 and 0.34-ppm (Table B1). This is 4 to 5 times less than the concentration below Davis Creek (Table 1). The decrease is attributed to influx of sediment with low mercury concentrations in creeks and sloughs on the Capay Valley floor (Foe and Croyle, 1998). These dilute sediment with higher mercury levels from the Cache Creek Canyon. Nonetheless, the concentrations in the Settling Basin are 3 to 5 times higher than occur in background material above the confluence of Harley Gulch. No attempt has yet been made to inventory the mercury content of depositional areas in Cache Creek downstream of the confluence of Bear Creek. However, such a sampling effort would likely increase by many-fold the amount of mine waste that has moved off site from the mining districts and now contaminates the Cache Creek drainage. The Basin Plan amendment for Cache Creek requires Board staff to do assessments to determine whether land owners and other responsible parties should be required to conduct feasibility studies to evaluate methods to control and remediate mercury sources in the watershed (Central Valley Regional Water Quality Control Board, 2007). The Executive Officer of the Regional Board will prioritize the need for feasibility studies and subsequent remediation actions based on mercury concentrations and masses, erosion potential, and accessibility. Following review of the feasibility studies, the Executive Officer will determine whether cleanup actions will be required. The Executive Officer will, based on this report and any additional information, evaluate whether to require responsible parties to prepare feasibility studies to
13

evaluate the potential to trap and/or remove mercury contaminated sediment from the Harley Gulch delta and from the Cache Creek canyon below the confluence with Davis Creek. These areas have the highest mercury masses and concentrations in the watershed. In addition, there may be access to the Cache Creek canyon below Davis Creek through the Langs Peak Road to Buck Island. It is recommended that Regional Board staff conduct assessments of Crack Canyon, Davis Creek between the reservoir and Cache Creek, and Cache Creek below the confluence of Bear Creek. The goal of these studies should be to identify areas with large mercury deposits that can be economically remediated to reduce the loads of mercury now being exported from the Cache Creek drainage. Reduction of mercury loads from Cache Creek is expected to reduce methyl mercury production in the Yolo Bypass and downstream in the Bay-Delta Estuary. Acknowledgements CALFED provided staff funding while TMDL money was used for analytical costs.
14

LITERATURE CITED Bloom, N.S. 2003. Solid Phase Mercury Speciation and Incubation Studies in or Related to Mine-site Runoff in the Cache Creek Watershed (CA). Final report submitted to the CALFED Bay-Delta Program for the project: An Assessment of the Ecological and Human Health Impacts of Mercury in the Bay-Delta Watershed (Task 7C). Frontier Geosciences Inc. Available at: http://loer.tamug.tamu.edu/calfed/FinalReports.htm. CALFED, 2000. CALFED mercury project QAPP. SOP D16. Analysis of mercury in sediment by flow injection mercury system (FIMS). Available at: http://loer.tamug.tamu.edu/calfed/QA%20Documents/CALFED%20Appdx%20D.pdf California Office of Health Hazard Assessment. 2005. Health Advisory: Fish Consumption Guidelines for Clear Lake, Cache Creek, and Bear Creek (Lake, Yolo, and Colusa Counties). Office of Health Hazard Assessment, California Environmental Protection Agency. Available at: http://www.oehha.ca.gov/fish/so_cal/Fclearlake.html. California Office of Health Hazard Assessment. 2007. Draft Health Advisory and Safe Eating Guidelines for Fish and Shellfish from the San Joaquin River and South Delta (Contra Costa, San Joaquin, Stanislaus, Merced, Madera, and Fresno Counties). Office of Health Hazard Assessment, California Environmental Protection Agency. Available at: http://www.oehha.ca.gov/fish/so_cal/sjrsd030907.html. Central Valley Regional Water Quality Control Board, 2007. The Water Quality Control Plan (Basin Plan)—Central Valley Region. Fourth Edition, Central Valley Regional Water Quality Control Board, Sacramento CA. Available at: http://www.waterboards.ca.gov/centralvalley/water_issues/basin_plans/index.html Churchill, R. 1999. Contributions of mercury to California’s Environment from mercury and gold mining activities—insights from the historical record. Presentation at the Geological Society of American, San Francisco, CA. 1999. Churchill, R. and J. Clinkenbeard. 2003. Assessment of the feasibility of remediation of mercury mine sources in the Cache Creek watershed. CALFED final report. Available at: http://loer.tamug.tamu.edu/calfed/FinalReports.htm. Compeau, G. and R. Bartha. 1985. Sulfate-reducing bacteria: Principal methylators of mercury in anoxic estuarine sediment. Applied Environmental Microbiology, 50: 498-502. Cooke, J., C. Foe, A. Stanish and P. Morris. 2004. Cache Creek, Bear Creek, and Harley Gulch TMDL for mercury. Central Valley Regional Water Quality Control Board staff report. Cooke, J. and P. Morris. 2005. Amendments to the Water Quality Control Plan for the Sacramento River and San Joaquin River Basins for the control of mercury in Cache Creek, Bear Creek, Sulfur Creek, and Harley Gulch. Central Valley Regional Water Quality Control Board staff report. Dunn, I.S., L.R. Anderson, and F.W. Kiefer. 1981. Fundamentals of Geotechnical Analysis. John Wiley and Sons, New York, 414 p. Foe, C. S. Louie, and D. Bosworth. 2007. Methyl mercury, total mercury and sediment concentrations and loads in the Yolo Bypass during high flow. Poster presented at the State of the Estuary Conference in Oakland CA on 16-18 October 2007.
15

Foe, C. and W. Croyle. 1998. Mercury concentrations and loads from the Sacramento River and from Cache Creek to the Sacramento-San Joaquin Delta Estuary. Staff report, Central Valley Regional Water Quality Control Board, Sacramento, CA. Gilmour, C.C., E.A. Henry and R. Mitchell. 1992. Sulfate stimulation of mercury methylation in freshwater sediment. Environmental Science and Technology. 26:2281-2285 Knighton, D. Fluvial Forms and Processes. 1992. Routldge, Chapman, and Hall, Inc. 29 West 35th Street, New York, NY 10001. 218 p Heim, W.A., 2003. Methyl and total mercury in surficial sediments of the San Francisco Bay-Delta. Master of Science Thesis, San Jose State University at Moss Landing Marine Laboratories, San Jose, Ca. Ichikawa, G. and W. Jakl. 2004. Data and Quality Assurance/Quality Control Report for Harley Gulch Total Maximum Daily Load (TMDL) project. Moss Landing Marine Laboratory report. 20 p. Kimball, T. 2005. Mercury methylation in sediments from coastal and sierra watersheds: Implications for methyl mercury mitigation in the San Francisco Bay-Delta Complex. Master of Science Thesis, San Jose State University at Moss Landing Marine Laboratories, San Jose, Ca Lehrman, N. 1985. The McLaughlin Mine Napa and Yolo Counties, California. In collection of McLaughlin Technical Reports and Publications. Rudd, J.W.M., M.A. Turner, A. Furutani, A.L. Swick and B.E. Townsend. 1983. The English-Wabigoon River system: I. A synthesis of recent research with a view towards mercury amelioration. Can. J. Fish. Aquat. Sci., 40: 2206-2217. Slotton, D., J. Reuter, S. Ayers and C. Goldman. 2002. Mercury distribution in the sediment and biota of Davis Creek and Davis Creek Reservoir. Final annual report after 17 years of monitoring and research: 1985-2002. Prepared for County of Yolo, California by Ecological Research Associates, 1523 Portala Street, Davis, CA 95616. Slotton, D., S. Ayers, R. Weyand. 2007. CBDA biosentinel mercury monitoring program. Second year draft data report. Department of Environmental Science and Policy, UC Davis. 92p Suchanek, T., P. Richerson, B. Lamphere, C. Woodmansee, D. Slotton and L. Woodward. 1995. Impacts of mercury on benthic invertebrate populations and communities within the aquatic ecosystem of Clear Lake, CA. Water, Air, Soil Pollut. 80:951-960 Suchanek, T, P. Richerson, L Mullen, L. Brister, J. Becker, A. Maxson, and D. Slotton. 1997. Sulphur Bank Mercury Mine Superfund site Clear Lake, California. Interim Final Report. A report prepared for the USEPA Region IX Superfund Program. Division of Environmental Studies, University of California, Davis, CA 95616. U.S. EPA Region 9. 2007. Pollution Report by Janet Yocum, OSC. Report available at: http://www.epaosc.net/sites%5c2591%5cabbottturkeyrun_polrep_10.htm Wiener, J. D. Krabbenholf, G. Heinz, and A. Scheuhammer. 2003. Ecotoxicology of Mercury. In Handbook of Ecotoxicology. (Hoffman, D., B. Rattner, G. Burton, and J. Cairns eds) CRC Press LLC. Wood, M., C. Foe, and J. Cooke. 2006. Sacramento-San Joaquin Delta Estuary TMDL for mercury. Central Valley Regional Water Quality Control Board staff report.
16

Figure1a: Overview of the Cache Creek Watershed and Sediment Sampling Locations

Figure 1b: Sediment Sampling Locations from Cache Creek, North Fork downstream to Bear Creek

Figure 1c (Continued)

Figure 1d (Continued)

Figure 2 Mercury concentration (ppm) as a function of depth in holes dug in a depositional pile in Cache Creek below the confluence of Davis Creek and in the Harley Gulch delta. Vertical bars are 95 percent confidence intervals
Silt Sand Gravel
surface 2 feet 4 feet 6 feet
Depth
-3
-2
-1
0
1
2
3
4
5
6
Mer
cury
Con
cent
ratio
n (p
pm)
Cache below Davis CreekCache below Davis
Silt Sand
surface 2.5 feet 5 feet
Depth
-2
-1
0
1
2
3
4
5
6
7
Mer
cury
Con
cent
ratio
n (p
pm)
Harley Gulch delta
Harley Gulch delta

Figure 3 Mercury concentration in holes dug in the Cache Creek Canyon
Silt Sand Gravel
-1 0 1 2 3 4 5 6 7
Depth (feet)
-1
0
1
2
3
4
5
6
Mer
cury
Con
cent
ratio
n (p
pm)
Depth:Silt: r2 = 0.1253; p = 0.0897; y = 1.8986 - 0.2418*x Depth:sand: r2 = 0.0672; p = 0.2211; y = 0.5203 - 0.0611*x Depth:gravel: r2 = 0.0047; p = 0.8077; y = 0.0896 + 0.003*x

Table 1. Mercury concentration (ppm) in sediment collected from the main stem of Cache Creek (see Figure 1 for site locations and Table B1 for raw data). Creek reaches with an asterisk have statistically higher concentrations than occur in similar grain size material in Cache Creek above the confluence of Harley Gulch (see text for details). Average background mercury concentrations in silt, sand, and gravel above Harley Gulch are 0.06, 0.10, and 0.09-ppm mercury, respectively.
Average Hg Concentration (ppm)1/
Reach # Samples
Silt Sand Gravel
North Fork 4 0.04 0.06 0.09 Cache above North Fork confluence 7 0.08 0.07 0.10 Cache between confluence & Harley
3 0.05 0.22 0.05
Cache between Harley Gulch & Rocky
4 0.44 0.06 0.36
Cache between Rocky & Jack 8 0.51 0.43 0.09 Cache between Jack & Judge Davis 10 0.64** 0.39 0.28 Cache between Judge Davis & Petrified
3 0.88 0.08 0.05
Cache between Petrified & Trout 3 0.09 0.08 0.09 Cache between Trout & Crack 15 1.02*** 0.85*** 0.99*** Cache between Crack & Davis 10 0.89*** 0.47 0.38* Cache between Davis and Bear 25 1.51*** 1.35*** 1.66* 1/ * P<0.05, **P<0.01, ***P<0.001

Table 2. Mercury concentration (ppm) in sediment collected from all large tributaries to Cache Creek between the confluence of the North Fork and Bear Creek. Tributaries with an asterisk have statistically higher concentrations than occur in similar size material from the watershed above the confluence of Harley Gulch (see text for details). Average background mercury concentrations in silt, sand, and gravel in Cache Creek above Harley Gulch are 0.06, 0.10, and 0.09-ppm mercury, respectively. Mercury concentrations for Stemple Creek and the Harley Gulch delta are from Ichikawa and Jakl (2004).
Average Hg Concentration (ppm)1/
Tributary # samples
Silt Sand Gravel
Stemple Creek 2 0.06 Harley Gulch delta 8 4.83*** 4.21*** Rocky Creek 2 0.10 0.10 0.33 Jack Creek 2 0.06 0.06 0.05 Judge Davis Creek 3 0.36 0.18 0.28 Bushy Creek 2 0.04 0.25 0.14 Petrified Creek 2 0.09 0.07 0.09 Trout Creek 2 0.15 0.14 0.12 Crack Canyon 4 0.19 0.40 0.38* Davis Creek 4 0.72 0.84* 0.34 1/ * P<0.05, ***P<0.0001

Table 3. Inventory of mercury (kg) in sediment deposits in the Cache Creek Canyon
Mercury Mass (kg) Reach Sediment
volume (m3)
Silt Sand Gravel Total
Cache between Harley & Rocky
76,122 4 6 2 12
Cache between Rocky & Jack 147,315 9 49 1 59Cache between Jack & Judge Davis
224,941 15 127 2 144
Cache between Judge Davis & Petrified
16,634 1 2 0 3
Cache between Petrified & Trout
12,927 0 1 0 1
Cache between Trout & Crack 443,664 111 397 61 569Cache between Crack & Davis 127,705 20 39 8 67Cache between Davis and Bear
541,589 182 1,069 88 1,339
Total 1,600,000 340 1,700 160 2,200

APPENDIX A

Figure 1a: Map of Cache Creek Canyon showing sampling sites from Harley Gulch down to Bear Creek

Figure 1b (Continued)

Figure 1c (Continued)

Figure 1d (Continued)
APPENDIX B

Table B1. Summary of mercury concentrations by grain size in Cache Creek.
Percent of total sample weight
Mercury concentration (ppm) Station
Code Replicate Creek Reach Latitude LongitudeSilt Sand Gravel Silt Sand Gravel
Mercury Analytical
Lab
CC1 A Cache above N Fk 38.97346 122.49733 17% 77% 0.06 0.04 MLML CC2 A Cache above N Fk 38.97658 122.49657 10% 65% 25% 0.08 0.06 0.07 MLML CC2 B Cache above N Fk 38.97658 122.49657 28% 72% 0.09 0.09 MLML CC2 C Cache above N Fk 38.97658 122.49657 7% 51% 42% 0.07 0.08 0.08 MLML CC3 A Cache above N Fk 38.97996 122.50350 15% 73% 12% 0.1 0.08 0.21 MLML CC3 B Cache above N Fk 38.97996 122.50350 12% 61% 27% 0.08 0.08 0.08 MLML CC3 C Cache above N Fk 38.97996 122.50350 11% 52% 37% 0.09 0.08 0.08 MLML NF1 A North Fork-Cache 38.98097 122.50511 39% 43% 3% 0.03 0.03 0.03 MLML NF2 A North Fork-Cache 38.98447 122.51469 23% 66% 5% 0.03 0.02 0.13 MLML NF3 A North Fork-Cache 38.98767 122.53883 22% 58% 8% 0.03 0.07 0.09 MLML NF4 A North Fork-Cache 39.06953 122.58406 41% 29% 8% 0.08 0.13 0.13 MLML CC4 A N fork-Stemple 38.98372 122.49419 27% 56% 4% 0.04 0.58 0.05 MLML CC5 A N fork-Stemple 38.98531 122.48386 3% 89% 4% 0.04 0.03 0.03 MLML CC6 A Stemple-Harley 38.98800 122.48361 25% 60% 2% 0.05 0.04 0.06 MLML CC7 Surface Harley-Rocky 38.98440 122.47911 5% 93% 1% 0.55 0.04 0.13 MLML CC8 A Harley-Rocky 38.98155 122.47916 12% 70% 18% 0.1 0.07 0.15 MLML CC8 B Harley-Rocky 38.98155 122.47916 9% 90% 0.40% 0.18 0.05 0.06 MLML CC8 C Harley-Rocky 38.98155 122.47916 2% 97% 1% 0.92 0.07 1.1 MLML CC9 A Rocky-Jack 38.97892 122.47556 9% 90% 1% 0.24 0.05 0.04 MLML CC9 B Rocky-Jack 38.97892 122.47556 11% 87% 2% 0.07 0.04 0.05 MLML CC10 A Rocky-Jack 38.97793 122.47269 9% 88% 3% 0.24 0.06 0.09 MLML CC10 B Rocky-Jack 38.97793 122.47269 7% 93% 1% 1.49 0.04 0.06 MLML CC10 C Rocky-Jack 38.97793 122.47269 3% 95% 2% 1.68 0.07 0.12 MLML CC11 A Rocky-Jack 38.97612 122.46973 18% 80% 2% 0.05 0.06 0.06 MLML CC11 B Rocky-Jack 38.97612 122.46973 17% 80% 3% 0.09 0.1 0.22 MLML CC11 C Rocky-Jack 38.97612 122.46973 59% 29% 11% 0.23 3.02 0.09 MLML CC12 A Jack-Judge 38.97219 122.46763 7% 92% 0.20% 0.24 0.05 MLML CC12 B Jack-Judge 38.97219 122.46763 5% 95% 0.50% 1.42 0.07 0.08 MLML

Table B1. (Continued)
Percent of total sample weight
Mercury concentration (ppm) Station
Code Replicate Creek Reach Latitude LongitudeSilt Sand Gravel Silt Sand Gravel
Mercury Analytical
Lab
CC12 C Jack-Judge 38.97219 122.46763 10% 85% 5% 0.18 0.08 0.05 MLML CC13 A Jack-Judge 38.96725 122.46559 4% 96% 0.63 0.09 MLML CC13 B Jack-Judge 38.96725 122.46559 6% 94% 0.07 0.07 MLML CC13 C Jack-Judge 38.96725 122.46559 10% 89% 1.52 0.06 MLML CC14 A Jack-Judge 38.96289 122.46700 7% 71% 4% 0.45 1.43 0.4 ALS CC14 B Jack-Judge 38.96289 122.46700 5% 90% 1% 1.25 0.82 0.71 ALS CC15 A Jack-Judge 38.96143 122.46083 5% 88% 2% 0.23 0.66 0.26 ALS CC15 B Jack-Judge 38.96143 122.46083 11% 77% 3% 0.5 0.54 0.46 ALS CC16 A Brushy-Petrified 38.95848 122.45587 5% 92% 4% 0.09 0.12 0.07 MLML CC16 B Brushy-Petrified 38.95848 122.45587 2% 86% 12% 1.97 0.06 0.05 MLML CC16 C Brushy-Petrified 38.95848 122.45587 2% 68% 30% 0.6 0.06 0.04 MLML CC17 A Petrified-Trout 38.95584 122.45328 6% 70% 25% 0.06 0.07 0.04 MLML CC17 B Petrified-Trout 38.95584 122.45328 3% 75% 22% 0.1 0.11 0.1 MLML CC17 C Petrified-Trout 38.95584 122.45328 10% 79% 12% 0.1 0.07 0.12 MLML CC18 A Trout-Crack 38.94464 122.44292 12% 73% 4% 1.31 1.56 1.77 ALS CC18 B Trout-Crack 38.94464 122.44292 15% 81% 3% 2.69 0.4 0.59 ALS CC18 C Trout-Crack 38.94464 122.44292 9% 67% 2% 0.75 0.52 0.15 ALS CC19 A Trout-Crack 38.94258 122.43896 4% 30% 24% 0.16 0.24 0.27 ALS CC19 B Trout-Crack 38.94258 122.43896 14% 73% 10% 1.45 1.16 2.84 ALS CC19 C Trout-Crack 38.94258 122.43896 27% 61% 7% 0.33 0.67 0.31 ALS CC20 A Trout-Crack 38.94445 122.43497 10% 74% 9% 0.47 1.23 4.75 ALS CC20 B Trout-Crack 38.94445 122.43497 13% 77% 6% 1.17 0.23 0.61 ALS CC20 C Trout-Crack 38.94445 122.43497 7% 92% 2% 0.52 0.29 0.3 ALS CC21 A Trout-Crack 38.94515 122.42945 12% 67% 9% 0.58 0.62 1.2 average CC22 A Trout-Crack 38.94516 122.42305 12% 67% 9% 0.58 0.62 1.2 average CC23 A Trout-Crack 38.94795 122.41965 16% 80% 4% 0.34 0.74 0.41 ALS CC23 B Trout-Crack 38.94795 122.41965 19% 25% 21% 0.49 0.67 0.44 ALS CC23 C Trout-Crack 38.94795 122.41965 8% 52% 13% 0.52 0.54 0.68 ALS

Table B1. (Continued)
Percent of total sample weight
Mercury concentration (ppm) Station
Code Replicate Creek Reach Latitude Longitude Silt Sand Gravel Silt Sand Gravel
Mercury Analytical
Lab
CC24 A Trout-Crack 38.94807 122.41814 14% 52% 14% 1.07 1.07 0.54 average CC25 A Trout-Crack 38.94541 122.41560 8% 80% 2% 3.58 0.76 0.93 ALS CC25 B Trout-Crack 38.94541 122.41560 13% 34% 22% 1.01 3.34 0.46 ALS CC25 C Trout-Crack 38.94541 122.41560 23% 40% 21% 0.46 0.34 0.32 ALS CC26 A Trout-Crack 38.94266 122.41513 15% 52% 15% 1.68 1.48 0.57 average CC27 Surface Crack-Davis 38.94101 122.40026 6% 94% 1.67 0.06 MLML CC28 A Crack-Davis 38.93992 122.39310 17% 77% 0.88 0.45 ALS CC28 B Crack-Davis 38.93992 122.39310 18% 29% 29% 1.11 0.33 0.29 ALS CC28 C Crack-Davis 38.93992 122.39310 5% 84% 12% 0.36 0.46 0.46 ALS CC29 A Crack-Davis 38.94395 122.39084 16% 65% 7% 0.25 0.41 0.3 ALS CC29 B Crack-Davis 38.94395 122.39084 9% 67% 9% 1.56 0.38 0.41 ALS CC29 C Crack-Davis 38.94395 122.39084 26% 49% 12% 0.82 0.42 0.35 ALS CC30 A Crack-Davis 38.93959 122.38425 8% 48% 8% 0.68 0.7 0.46 ALS CC30 B Crack-Davis 38.93959 122.38425 9% 25% 13% 0.38 0.4 0.29 ALS CC30 C Crack-Davis 38.93959 122.38425 2% 26% 14% 1.19 1.11 0.47 ALS CC31 A Davis-Bear 38.93426 122.37315 17% 54% 12% 0.39 1.35 1.43 average CC32 A Davis-Bear 38.93078 122.37030 8% 90% 1% 0.78 1.75 1.45 ALS CC32 B Davis-Bear 38.93078 122.37030 21% 44% 8% 0.23 1.04 1.33 ALS CC32 C Davis-Bear 38.93078 122.37030 20% 29% 26% 0.17 1.27 1.5 ALS CC33 Surface Davis-Bear 38.92743 122.37019 4% 92% 4% 0.42 0.08 0.06 MLML CC34 A Davis-Bear 38.92610 122.37391 6% 63% 15% 0.92 1.27 3.76 ALS CC34 B Davis-Bear 38.92610 122.37391 11% 54% 14% 0.49 1.53 2.52 ALS CC34 C Davis-Bear 38.92610 122.37391 11% 56% 16% 0.75 2.13 2.05 ALS CC35 A Davis-Bear 38.92455 122.37040 6% 93% 0.33 2.16 ALS CC35 B Davis-Bear 38.92455 122.37040 26% 71% 4% 0.21 4.56 1.92 ALS CC35 C Davis-Bear 38.92455 122.37040 16% 74% 5% 0.27 1.23 1.56 ALS CC36 A Davis-Bear 38.92168 122.36372 10% 74% 2% 11.2 1.28 2.21 ALS CC36 B Davis-Bear 38.92168 122.36372 19% 66% 4% 0.3 1.18 2 ALS

Table B1. (Continued)
Percent of total sample weight
Mercury concentration (ppm) Station
Code Replicate Creek Reach Latitude Longitude Silt Sand Gravel Silt Sand Gravel
Mercury Analytical
Lab
CC36 C Davis-Bear 38.92168 122.36372 19% 74% 4% 10.05 1.86 0.71 ALS CC37 A Davis-Bear 38.92291 122.35700 6% 94% 1.67 0.06 average CC38 A Davis-Bear 38.91930 122.35362 13% 55% 15% 0.32 2.2 1.69 ALS CC39 A Davis-Bear 38.91754 122.35429 5% 95% 0.30% 0.48 0.06 MLML CC39 B Davis-Bear 38.91754 122.35429 4% 95% 1% 2.71 0.06 0.05 MLML CC39 C Davis-Bear 38.91754 122.35429 2% 97% 1% 1.01 0.07 11.84 MLML CC40 A Davis-Bear 38.91584 122.35121 7% 89% 2% 1.56 1.43 4.08 average CC41 A Davis-Bear 38.91845 122.34826 10% 83% 3% 1.73 2.79 4.2 ALS CC42 A Davis-Bear 38.92386 122.34142 4% 90% 6% 1.11 9.95 0.06 MLML CC42 B Davis-Bear 38.92386 122.34142 13% 56% 32% 0.14 0.09 0.09 MLML CC42 C Davis-Bear 38.92386 122.34142 3% 87% 9% 0.19 0.06 0.1 MLML CC43 A Davis-Bear 38.92321 122.33832 12% 50% 38% 0.12 0.14 0.11 MLML CC43 B Davis-Bear 38.92321 122.33832 7% 69% 24% 0.55 0.1 MLML CC43 C Davis-Bear 38.92321 122.33832 5% 66% 29% 0.34 0.13 0.05 MLML CC44 A Davis-Bear 38.92597 122.33509 2% 94% 4% 1.93 0.08 0.14 MLML CC44 B Davis-Bear 38.92597 122.33509 5% 92% 3% 2.78 0.07 0.32 MLML CC44 C Davis-Bear 38.92597 122.33509 15% 72% 13% 0.15 0.09 0.09 MLML CC45 A CC Settling Basin 38.68292 121.67314 19% 46% 25% 0.23 0.22 0.25 MLML CC45 B CC Settling Basin 38.68708 121.67383 16% 54% 22% 0.34 0.35 0.33 MLML CC45 C CC Settling Basin 38.68400 121.67669 19% 55% 19% 0.42 0.32 0.29 MLML CC45 D CC Settling Basin 38.67858 121.67325 18% 52% 23% 0.29 0.38 0.39 MLML

Table B2. Mercury concentrations in tributaries to Cache Creek.
Percent of total sample weight Mercury concentration (ppm) Tributary Sample
code Latitude Longitude Watershed area (km2)
Silt Sand Gravel Silt Sand Gravel
Mercury Analytical
Lab2
Harley Gulch HG1 38.98651 -122.47852 13.9 31% 46% 2.56 1.79 ALS Harley Gulch HG2 38.98697 -122.47859 13.9 6% 43% 5.12 0.51 ALS Harley Gulch HG3 38.98650 -122.47820 13.9 3% 34% 3.24 1.82 ALS Harley Gulch HG4 38.98637 -122.47840 13.9 20% 38% 3.11 4.21 ALS Harley Gulch HG5 38.98723 -122.47834 13.9 7% 53% 8.47 0.63 ALS Harley Gulch HG6 38.98711 -122.47761 13.9 7% 40% 3.5 0.82 ALS Harley Gulch HG7 38.98706 -122.47796 13.9 5% 64% 11.1 0.33 ALS Harley Gulch HG8 38.98741 -122.47761 13.9 5% 55% 1.57 23.6 ALS Rocky Creek RC1 38.97889 -122.47657 38.0 10% 88% 2% 0.13 0.15 0.05 MLML Rocky Creek RC2 38.97841 -122.47740 38.0 9% 83% 8% 0.06 0.05 0.60 MLML Jack Creek JC1 38.97258 -122.46674 6.3 11% 79% 10% 0.05 0.05 0.04 MLML Jack Creek JC2 38.97303 -122.46570 6.3 25% 43% 32% 0.08 0.07 0.07 MLML Judge Davis Ck JD1 38.96183 -122.45933 6.4 2% 26% 26% 0.61 0.19 0.13 ALS Judge Davis Ck JD2 38.96225 -122.45939 6.4 4% 31% 29% 0.10 0.17 0.42 ALS Brushy Creek BR1 38.96072 -122.45642 6.1 2% 16% 24% 0.05 0.24 0.15 ALS Brushy Creek BR2 38.96056 -122.45603 6.1 5% 13% 40% 0.03 0.25 0.13 ALS Petrified Creek PC1 38.95723 -122.45642 3.5 8% 70% 22% 0.09 0.06 0.08 MLML Petrified Creek PC2 38.95657 -122.45788 3.5 8% 72% 21% 0.09 0.08 0.09 MLML Trout Creek TC1 38.95021 -122.45384 6.5 3% 75% 22% 0.13 0.17 0.12 MLML Trout Creek TC2 38.94950 -122.45463 6.5 2% 72% 26% 0.16 0.11 0.13 MLML Crack Canyon CR1 38.94194 -122.40981 9.8 2% 43% 15% 0.18 0.28 0.27 ALS Crack Canyon CR2 38.94175 -122.40961 9.8 1% 19% 26% 0.15 0.37 0.40 ALS Crack Canyon CR3 38.94175 -122.40975 9.8 2% 36% 40% 0.23 0.56 0.43 ALS Davis Creek DC1 38.93061 -122.37800 49.8 2% 67% 22% 0.14 0.44 0.30 ALS Davis Creek DC2 38.93050 -122.37811 49.8 3% 50% 30% 1.70 0.46 0.33 ALS Davis Creek DC3 38.93044 -122.37819 49.8 3% 56% 20% 0.14 1.61 0.38 ALS

Table B3. Mercury deposits in Cache Creek between the confluence of Harley Gulch and Bear Creek.
Station Code Creek Reach Latitude Longitude
Surface Area (m2)
Depth (m)
Volume (m3)
Weight (106 kg)
Mercury deposit
(kg) CC7 Harley-Rocky 38.98440 122.47911 7,883 4 31,531 48.2 3.5 CC8 Harley-Rocky 38.98155 122.47916 11,148 4 44,591 68.2 7.7 CC9 Rocky-Jack 38.97892 122.47556 14,541 4 58,165 89.0 4.9 CC10 Rocky-Jack 38.97793 122.47269 12,228 4 48,912 74.8 9.3 CC11 Rocky-Jack 38.97612 122.46973 10,059 4 40,238 61.6 44.0 CC12 Jack-Judge 38.97219 122.46763 6,593 4 26,371 40.3 4.3 CC13 Jack-Judge 38.96725 122.46559 21,128 4 84,512 129.3 15.1 CC14 Jack-Judge 38.96289 122.46700 11,718 4 46,871 71.7 69.6 CC15 Jack-Judge 38.96143 122.46083 16,797 4 67,186 102.8 54.8
CC16 Brushy-Petrified 38.95848 122.45587 4,159 4 16,634 25.5 2.5
CC17 Petrified-Trout 38.95584 122.45328 3,232 4 12,927 19.8 1.7 CC18 Trout-Crack 38.94464 122.44292 10,512 4 42,049 64.3 53.1 CC19 Trout-Crack 38.94258 122.43896 10,608 4 42,431 64.9 40.8 CC20 Trout-Crack 38.94445 122.43497 8,404 4 33,615 51.4 33.5 CC21 Trout-Crack 38.94515 122.42945 4,348 4 17,391 26.6 15.8 CC22 Trout-Crack 38.94516 122.42305 12,121 4 48,486 74.2 44.0 CC23 Trout-Crack 38.94795 122.41965 2,998 6 17,986 27.5 12.9 CC24 Trout-Crack 38.94807 122.41814 18,979 4 75,915 116.1 90.9 CC25 Trout-Crack 38.94541 122.41560 28,634 4.6 131,718 201.5 220.8 CC26 Trout-Crack 38.94266 122.41513 8,518 4 34,073 52.1 57.1 CC27 Crack-Davis 38.94101 122.40026 8,508 4 34,032 52.1 8.5 CC28 Crack-Davis 38.93992 122.39310 6,628 4.6 30,489 46.6 20.6 CC29 Crack-Davis 38.94395 122.39084 10,720 3 32,159 49.2 20.9 CC30 Crack-Davis 38.93959 122.38425 20,683 1.5 31,025 47.5 15.9 CC31 Davis-Bear 38.93426 122.37315 4,416 4 17,664 27.0 26.1 CC32 Davis-Bear 38.93078 122.37030 9,898 3 29,695 45.4 43.9 CC33 Davis-Bear 38.92743 122.37019 7,921 4 31,684 48.5 4.4 CC34 Davis-Bear 38.92610 122.37391 8,267 2 16,535 25.3 36.4 CC35 Davis-Bear 38.92455 122.37040 13,289 4.6 61,129 93.5 207.3 CC36 Davis-Bear 38.92168 122.36372 11,096 4.6 51,041 78.1 175.5 CC37 Davis-Bear 38.92291 122.35681 10,463 4 41,852 64.0 118.4 CC38 Davis-Bear 38.91930 122.35362 9,478 4.6 43,601 66.7 100.4 CC39 Davis-Bear 38.91754 122.35429 11,153 4 44,613 68.3 10.4 CC40 Davis-Bear 38.91584 122.35121 16,685 4 66,739 102.1 148.2 CC41 Davis-Bear 38.91845 122.34826 23,951 4 95,805 146.6 380.6 CC42 Davis-Bear 38.92386 122.34142 5,101 4 20,403 31.2 83.0 CC43 Davis-Bear 38.92321 122.33832 3,317 4 13,267 20.3 2.4 CC44 Davis-Bear 38.92597 122.33509 1,890 4 7,561 11.6 2.3

Table B4. Mercury concentrations in holes dug in Cache Creek.
Percent of total sample weight Mercury concentration (ppm) Station
Code Depth Silt Sand Gravel Silt Sand Gravel
Mercury Analytical
Lab CC7 Surface 5% 93% 1% 0.55 0.04 0.13 MLML CC7 1ft 3% 44% 53% 0.12 0.12 0.03 MLML CC7 2ft 5% 47% 48% 0.14 0.18 0.07 MLML CC7 3ft 5% 51% 44% 0.30 0.12 0.08 MLML CC27 Surface 6% 94% 1.67 0.06 MLML CC27 2ft 1% 43% 57% 0.13 0.08 0.06 MLML CC27 4ft 1% 39% 60% 0.33 0.11 0.10 MLML CC27 6ft 1% 25% 73% 0.24 0.09 0.09 MLML CC33 Surface 4% 92% 4% 0.42 0.08 0.06 MLML CC33 2ft 1% 20% 78% 2.45 0.44 0.13 MLML CC33 4ft 1% 90% 8% 0.72 0.09 0.23 MLML CC33 6ft 3% 36% 61% 0.17 0.11 0.04 MLML HG1 Surface 2.56 1.79 ALS HG1 3 ft 0.17 0.26 ALS HG1 6 ft 1.49 0.93 ALS HG2 Surface 5.12 0.51 ALS HG2 3 ft 2.86 0.36 ALS HG2 6ft 1.43 0.54 ALS HG3 Surface 3.24 1.82 ALS HG3 3ft 3.33 0.38 ALS

APPENDIX C

Quality Assurance/Quality Control Program The program had components to assess both accuracy and precision. Accuracy was measured by analyzing both standard reference material (SRM) and by amending a known amount of mercury into Cache Creek sediment and measuring the percent recovery. Precision was assessed in both the laboratory and field. Laboratory precision was determined from repeated measurements of the same digest while field variability was measured by performing duplicate analysis of additional material from the same sample. Both MLML and ALS measured the mercury concentration of PACS 2 standard reference material1. The certified value of PACS 2 is 3.40±0.2-ppm mercury2. Recoveries by MLML were between 3.18 and 4.07 with a mean of 3.45 (n=14, Table C1). In contrast, ALS reported that the concentration of the SRM varied between 56 and >100-ppm. Only MLML amended a known amount of mercury into sediment and measured the percent recovery of the spike. The percent recovery of duplicate spiked samples ranged between 67 and 287 percent with an average recovery of 103 percent (n=28, Table C2). Overall, the results suggest that the accuracy of mercury measurements by MLML is acceptable while those of ALS are questionable. The ALS measurements resulted in a follow up investigation to determine whether their data was usable. The results of that investigation are discussed below. Measurements of precision by both MLML and ALS were acceptable. The RPD of a second analysis of the same field sample at ALS ranged between 6 and 97 percent with an average of 36 percent (n=8, Table C3). The RPD for the same analysis of precision at MLML ranged between 2 and 175 percent with an average of 30 percent (n=14). Poor performance by ALS in analyzing the standard reference material does not appear to have compromised the accuracy of the remainder of the ALS measurements. ALS was telephoned by the Regional Board upon receiving the results and asked why they might have performed so poorly. ALS indicated that immediately prior to analyzing the SRMs they had analyzed some other samples for the Regional Board with very high mercury content (>100 ppm) and suspected carryover between the two sets of samples. Regional Board staff requested that ALS return all Cache Creek samples. Staff then sent two more PACS 2 samples to ALS for analysis. ALS reported that the two blind samples contained 2.78 and 2.81-ppm mercury. The results are considered acceptable as the certified value for the SRM is 3.40-ppm. Next, Regional Board staff sent nine ALS samples to MLML and requested that MLML split the samples in half and analyze each for mercury (Table C4). The average RPD of mercury in paired MLML samples was 57 percent while the average RPD of the mean of the two MLML values and the ALS value was 45 percent. The difference was not 1 National Research Council of Canada, M-12 Montreal Road, Ottawa, Ontario, Canada K1A 0R6 2 Mean and 95% confidence limits

statistically significant (P>0.25, two tailed paired t-test). The results suggest that Cache Creek canyon sediment is not homogenous and the same sample can have considerable variation in mercury content. Also, similar amounts of variation are being measured in the same samples by both MLML and ALS. Next, the average mercury concentration measured by MLML was compared with the original value reported by ALS to determine whether either set of measurements was biased high. Again, the two sets of measurements were not different (P>0.25, two tailed paired t-test) suggesting that qualitatively similar results would have been obtained if the analysis had been conducted by either laboratory. So, Regional Board staff accepted the results obtained by ALS for sediment samples collected in Cache Creek. For consistency though, all future samples were submitted to MLML for analysis.

Table C1. Summary of PACS 2 standard reference material measurements. The certified value of PACS 2 is 3.40 ±0.2-ppm mercury.
Sample Collection
Date
Measured PAC 2 mercury
value (ppm)
Recovery (%)
Laboratory
29 Oct 2003 56.4 - ALS 29 Oct 2003 >100 - ALS 29 Oct 2003 >100 - ALS 26 Mar 2004 3.67 108 MLML 26 Mar 2004 3.53 104 MLML 26 Mar 2004 3.54 104 MLML 20 Dec 2004 3.57 106 MLML 20 Dec 2004 3.38 99 MLML 20 Dec 2004 3.36 99 MLML 20 Dec 2004 3.18 94 MLML 20 Dec 2004 4.13 122 MLML 20 Dec 2004 4.07 120 MLML 20 Dec 2004 3.83 112 MLML 20 Dec 2004 3.83 113 MLML 20 Dec 2004 3.86 113 MLML 20 Dec 2004 3.56 105 MLML 20 Dec 2004 3.75 110 MLML

Table C2. Percent recovery by MLML upon adding a known amount of mercury into Cache Creek sediment.
Date
Background sediment
concentration (ppm)
Predicted concentration after Addition
(ppm)
Percent Recovery of
duplicate amendments
26 Mar 2004 0.22 2.62 104/100 26 Mar 2004 0.03 1.77 86/85 26 Mar 2004 0.02 1.24 97/89 20 Dec 2004 0.07 0.47 121/287 20 Dec 2004 2.78 16.31 100/91 20 Dec 2004 0.24 1.37 93/148 20 Dec 2004 0.07 0.131 67/90 20 Dec 2004 0.21 1.21 92/84 20 Dec 2004 0.10 0.73 122/106 20 Dec 2004 0.09 1.35 113/94 20 Dec 2004 0.04 0.26 114/78 20 Dec 2004 0.09 0.25 85/96 20 Dec 2004 0.60 2.78 80/77 20 Dec 2004 0.31 1.61 78/95
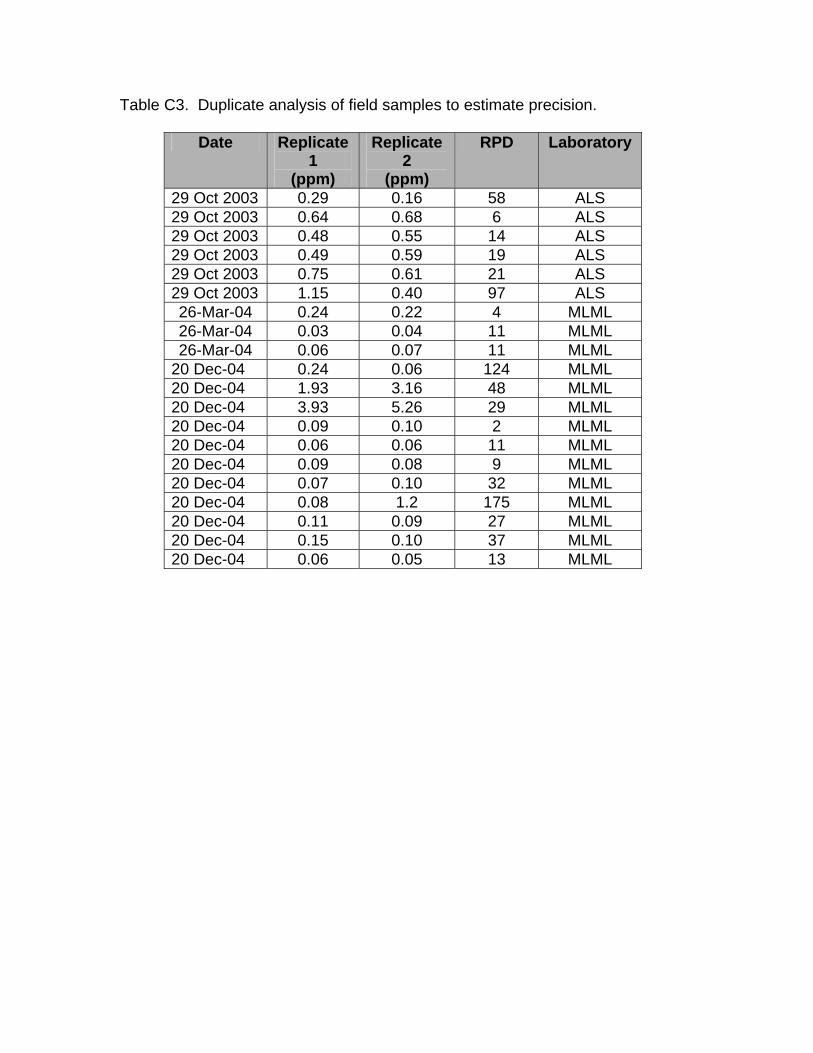
Table C3. Duplicate analysis of field samples to estimate precision.
Date Replicate 1
(ppm)
Replicate 2
(ppm)
RPD Laboratory
29 Oct 2003 0.29 0.16 58 ALS 29 Oct 2003 0.64 0.68 6 ALS 29 Oct 2003 0.48 0.55 14 ALS 29 Oct 2003 0.49 0.59 19 ALS 29 Oct 2003 0.75 0.61 21 ALS 29 Oct 2003 1.15 0.40 97 ALS 26-Mar-04 0.24 0.22 4 MLML 26-Mar-04 0.03 0.04 11 MLML 26-Mar-04 0.06 0.07 11 MLML
20 Dec-04 0.24 0.06 124 MLML 20 Dec-04 1.93 3.16 48 MLML 20 Dec-04 3.93 5.26 29 MLML 20 Dec-04 0.09 0.10 2 MLML 20 Dec-04 0.06 0.06 11 MLML 20 Dec-04 0.09 0.08 9 MLML 20 Dec-04 0.07 0.10 32 MLML 20 Dec-04 0.08 1.2 175 MLML 20 Dec-04 0.11 0.09 27 MLML 20 Dec-04 0.15 0.10 37 MLML 20 Dec-04 0.06 0.05 13 MLML
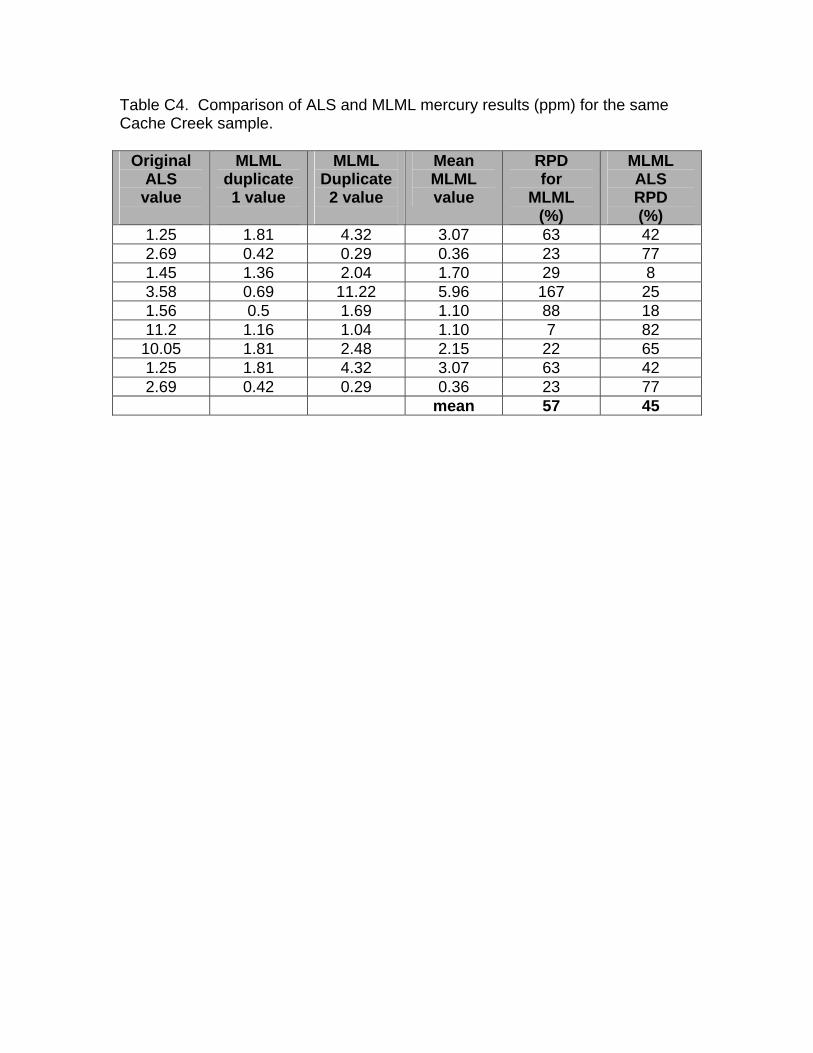
Table C4. Comparison of ALS and MLML mercury results (ppm) for the same Cache Creek sample.
Original ALS
value
MLML duplicate 1 value
MLML Duplicate 2 value
Mean MLML value
RPD for
MLML (%)
MLML ALS RPD (%)
1.25 1.81 4.32 3.07 63 42 2.69 0.42 0.29 0.36 23 77 1.45 1.36 2.04 1.70 29 8 3.58 0.69 11.22 5.96 167 25 1.56 0.5 1.69 1.10 88 18 11.2 1.16 1.04 1.10 7 82
10.05 1.81 2.48 2.15 22 65 1.25 1.81 4.32 3.07 63 42 2.69 0.42 0.29 0.36 23 77
mean 57 45