distribution of gluten proteins in bread wheat - annals of botany
TRANSCRIPT

Distribution of gluten proteins in bread wheat (Triticum aestivum) grain
Paola Tosi*, Cristina Sanchis Gritsch, Jibin He and Peter R. Shewry
Rothamsted Research, Harpenden, Hertfordshire AL5 2JQ, UK* For correspondence. E-mail [email protected]
Received: 22 November 2010 Returned for revision: 11 February 2011 Accepted: 8 March 2011
† Background and Aims Gluten proteins are the major storage protein fraction in the mature wheat grain. They arerestricted to the starchy endosperm, which forms white flour on milling, and interact during grain development toform large polymers which form a continuous proteinaceous network when flour is mixed with water to givedough. This network confers viscosity and elasticity to the dough, enabling the production of leavened products.The starchy endosperm is not a homogeneous tissue and quantitative and qualitative gradients exist for the majorcomponents: protein, starch and cell wall polysaccharides. Gradients in protein content and composition are themost evident and are of particular interest because of the major role played by the gluten proteins in determininggrain processing quality.† Methods Protein gradients in the starchy endosperm were investigated using antibodies for specific glutenprotein types for immunolocalization in developing grains and for western blot analysis of protein extractsfrom flour fractions obtained by sequential abrasion (pearling) to prepare tissue layers.† Key Results Differential patterns of distribution were found for the high-molecular-weight subunits of glutenin(HMW-GS) and g-gliadins when compared with the low-molecular-weight subunits of glutenin (LMW-GS),v- and a-gliadins. The first two types of gluten protein are more abundant in the inner endosperm layers andthe latter more abundant in the subaleurone. Immunolocalization also showed that segregation of gluten proteinsoccurs both between and within protein bodies during protein deposition and may still be retained in the maturegrain.† Conclusions Quantitative and qualitative gradients in gluten protein composition are established during graindevelopment. These gradients may be due to the origin of subaleurone cells, which unlike other starchy endo-sperm cells derive from the re-differentiation of aleurone cells, but could also result from the action of specificregulatory signals produced by the maternal tissue on specific domains of the gluten protein gene promoters.
Key words: Triticum aestivum, wheat grain, gluten proteins, bread wheat, immunolocalization, protein bodies,pearling.
INTRODUCTION
Wheat is one of the most important and widely consumed foodcrops, with flour produced from the starchy endosperm storagetissue being used to produce bread, noodles, pasta and a widerange of other food products.
The wheat grain is a single-seeded fruit, or caryopsis, andconsists of three distinct parts: the embryo, which forms thenext generation; the starchy endosperm, a storage tissuewhich supports germination and early seedling growth; andthe bran, comprising the pericarp (fruit coat), testa (seedcoat) and outer endosperm (aleurone layer). The starchy endo-sperm cells are packed with insoluble storage components,mainly starch and protein, which account for over 80 % ofthe grain mass. During milling the endosperm is usually separ-ated from the germ and the bran in order to obtain the whiteflour, which is the most suitable raw material for modernbreadmaking.
The endosperm is formed by a double fertilization eventwithin the embryo sac, with two female polar nuclei and onepollen reproductive nucleus fusing to give a triploid consti-tution (Olsen, 2004). Following fertilization, numerousmitotic divisions of the nuclei which are not accompaniedby cell division lead to the formation, after 1 or 2 d, of a
single multinucleate cell with a peripheral zone of cytoplasm(syncitium) and a large central vacuole. Cellularization thenoccurs, initiated by the appearance of anticlinal cell wallswhich separate the nuclei in the endosperm syncitium andform the so-called ‘alveoli’. The walls are first observed inthe syncitium adjacent to the ventral crease (Fineran et al.,1982), and then spread laterally along the endosperm lobesto the dorsal side. Periclinal and anticlinal walls then formbetween the dividing nuclei, resulting in the formation ofseveral layers of cells. Finally, the cell walls growing fromthe dorsal and ventral sides of the grain meet, completingthe cellularization.
Little is known about the specification of cell fate in thewheat endosperm but it has been suggested to result frompositional signalling as observed in maize (Hueros et al.,1995, 1999; Opsahl-Ferstad et al., 1997; Becraft andAsuncion-Crabb, 2000) and barley (Olsen et al., 1990; Doanet al., 1996). Differentiation starts at the beginning of the cel-lularization stage (Olsen, 2001) when the peripheral layer ofcells derived from the first periclinal division of the nucleiin the alveoli begin to differentiate into the aleurone, consist-ing in wheat of a single layer of cuboid-shaped cells with thickcell walls, large nuclei and dense cytoplasm. Cells of the innerlayer differentiate instead into highly vacuolated, thin-walled
# The Author 2011. Published by Oxford University Press on behalf of the Annals of Botany Company. All rights reserved.
For Permissions, please email: [email protected]
Annals of Botany 108: 23–35, 2011
doi:10.1093/aob/mcr098, available online at www.aob.oxfordjournals.org
Dow
nloaded from https://academ
ic.oup.com/aob/article-abstract/108/1/23/99491 by guest on 17 N
ovember 2018

cells which will constitute the starchy endosperm. Soon afterthe cellularization phase is completed, cell division resumesin the inner cell files, but unlike the alveolar divisions,which are strictly periclinal, the division planes are orientatedrandomly so that after one or two rounds of cell division thepattern of cell files is lost. The whole process is completedabout 2 weeks after anthesis and subsequent endospermgrowth occurs almost exclusively by cell expansion. An excep-tion is presented by the aleurone layer, in which the cells con-tinue to divide periclinally, behaving like a cambium up to 19d post-anthesis (dpa) (Sandstedt, 1946; Jennings and Morton,1963). The cell layers immediately below the aleurone,called the subaleurone cells, are therefore considered toresult from the division and re-differentiation of aleuronecells. Nevertheless, these cells remain distinct from both thealeurone and the central starchy endosperm cells, as discussedbelow.
At grain maturity, only the embryo and the aleurone cellsremain viable, the subaleurone and central starchy endospermcells having undergone a process of programmed cell death(PCD), which includes the degeneration of nuclei and cyto-plasm (Young and Gallie, 1999). The mature starchy endo-sperm cells therefore contain starch granules embedded in aprotein matrix. The starch is distributed fairly evenly through-out this tissue, particularly in the dorsal part of the grain, withthe exception of the sub-aleurone cells where the content ofstarch is significantly lower (Ugalde and Jenner, 1990a). Nostarch is present in the cells of the aleurone layer, which areinstead rich in protein and triacylglycerols.
The second major cell-specific components of the starchyendosperm cells, and the most important in terms of flourfunctional properties, are the gluten proteins. These belongto the prolamin family of cereal grain storage proteins andare characterized by their high content of the amino acidsproline and glutamine. They are classically divided into mono-meric gliadins and polymeric glutenins, with the latter com-prising subunits which are further divided on the basis oftheir molecular masses into high-molecular-weight subunitsof glutenin (HMW-GS) and low-molecular-weight subunitsof glutenin (LMW-GS). Clear gradients exist in protein con-centration across the starchy endosperm, being high in the sub-aleurone cells and lower in the central starchy endosperm cells.Consequently, the sub-aleurone cells in the dorsal region of thegrain contain nearly twice the amount of protein (mass per unitfresh volume) compared with the cells adjacent to the endo-sperm cavity (Ugalde and Jenner, 1990b). Recent studieshave also shown that the protein gradient is not only quantitat-ive but also qualitative, in that different sub-classes of glutenproteins are differentially expressed in different regions ofthe endosperm (Stoger et al., 2001; Lamacchia et al., 2001;Mills et al., 2005; Piston et al., 2009; Tosi et al., 2009).
The present paper explores these protein gradients in detailby using antibodies recognizing specific gluten protein types.
MATERIALS AND METHODS
Protein extraction and western blot analysis
Wholemeal flour was prepared from field-grown grain ofwheat Triticum aestivum ‘Cadenza’ using a ball mill. Total
grain protein was extracted with 25 mL mg21 of dry weightextraction/loading buffer: 50 mM Tris–HCl (pH 6.8), 2 %(w/v) sodium dodecylsulphate, 10 % (v/v) glycerol, 0.1 %(w/v) bromophenol blue and 200 mM dithiothreitol (DTT).Gluten proteins were extracted by sequential extraction: mono-meric gliadins were extracted using 16 mL mg21 dry weight of70 % (v/v) ethanol; the remaining pellet was dried in a SpeedyVac and then re-extracted with the same volume of 50 % (v/v)propan-1-ol + 2 % DTT. Extracts were dried in a Speedy Vacand resuspended in loading buffer (see above). Samples weredenatured at 80 8C for 3 min, and then separated on a precast4–12 % Bis-Tris Nu-Page gel (Invitrogen, Paisley, UK). Forwestern blotting, replicate 15-mL aliquots of total proteinextracts were separated in adjacent lanes on the same geland blotted onto nitrocellulose paper (HybondN + ;Amersham, Bucks., UK) following the manufacturer’s instruc-tions. The membranes were stained with Ponceau S solution(Sigma P7170, Gillingham, UK) and strips corresponding toindividual lanes were probed separately with the differentantibodies.
Strips were blocked with 5 % (w/v) skimmed dried milk inTris-buffered saline (TBS) (20 mM Tris, 500 mM NaCl, pHadjusted to 7 with HCl) at room temperature for 1 h, andthen incubated in primary antibody solution [1 % (w/v)bovine serum albumin (BSA) in 0.05 % (v/v) Tween inTBS] for a further 1 h. Antibodies used and their dilutionswere as follows:
(1) IFRN 0610 mouse monoclonal antibody which recognizesan epitope (QQSF) common to many gliadins andLMW-GS but not to HMW-GS (Brett et al., 1999),1 : 2000.
(2) Glia-a-9, 9-68 mouse monoclonal, specific for an epitopepresent on a-gliadins (Mitea et al., 2008), 1 : 10 000.
(3) R2-HMG rabbit polyclonal, raised against an HMWsubunit peptide (GYYPTSPQQPGC) and specificallyrecognizes HMW-GS (Denery-Papini et al., 1996),1 : 5000.
(4) Anti-NT2-v, rabbit polyclonal antibody, raised against theN-terminal sequence (SRLLSPRGKELGC) of v5-gliadins(Denery-Papini et al., 2000), 1 : 2000.
(5) S3B512 mouse monoclonal antibody, raised against apeptide from the g-gliadin repetitive domain(PEQPFPQGC) specific for g-gliadins (INRA, Nantes,France), 1 : 2000.
Membranes were washed three times in 0.05 % (v/v) Tween inTBS and incubated in secondary antibody solution (either anti-mouse or anti-rabbit alkaline phosphatase conjugated at a1 : 6250 dilution). After 1 h of incubation, the membraneswere rinsed three times, for 5 min each in 0.05 % (v/v)Tween in TBS, then once more in TBS and finally developedusing a ready-made NBT/BCIP developing solution(Sigma-Aldrich).
Pearling of wheat seeds
A test run was carried out on 50-g seeds of wheat ‘Cadenza’in a pearling mill (Streckel & Schrader, Hamburg, Germany)to determine the proportions of the grain removed (shell
Tosi et al. — Quantitative and qualitative protein gradients in wheat endosperm24
Dow
nloaded from https://academ
ic.oup.com/aob/article-abstract/108/1/23/99491 by guest on 17 N
ovember 2018

rates) after 1, 2, 3, 4, 5 and 10 min. A cubic interpolative curvewas then used to calculate the times required to remove 7, 13,20, 30, 40 and 50 % of the total seed weight.
Six pearling fractions were therefore prepared by sequentialpearling using the predicted pearling times, corresponding to7, 6, 7, 10, 10 and 10 % of the grain weight. These arecalled fractions 1–6, and correspond to flours enriched in peri-carp tissue, aleurone layer, sub-aleurone layer and three pro-gressively more central areas of the starchy endosperm,respectively. The grain remaining after pearling, which corre-sponded to about 50 % of the original weight, was milled in aball-mill and called fraction 7.
SDS–PAGE gel scanning and protein quantification
Protein extracts were separated by SDS–PAGE as describedabove. Gels were stained overnight with standard gel stain fortotal proteins [40 % (v/v) methanol, 10 % (v/v) trichloroaceticacid (TCA), 0.1 % (w/v) Coomassie Brilliant Blue R-250] anddestained for 24 h in 10 % (w/v) TCA, followed by 2 h indistilled water.
Gels were scanned with an HP scanner and groups of pro-teins were quantified using PhoretixTM 1D software(Nonlinear Dynamycs, Durham, NC, USA) based on bandintensity and area. For analysis, bands were divided into twomain groups corresponding to HMW-GS and LMW-GS +gliadins.
Plant material for microscopy
Plants of wheat ‘Cadenza’ were grown under glasshouseconditions at Rothamsted Research as previously describedby Tosi et al. (2004). Developing caryopses were harvestedfrom the middles of ears at 8, 14, 21 and 28 dpa and immedi-ately prepared for microscopy.
Sample preparation for microscopy
Transverse sections (approx. 1 mm thick) were cut in fixa-tive from the middle of the grain. Sections were fixed for 5 hat room temperature in 4 % (w/v) paraformaldehyde and2.5 % (w/v) glutaraldehyde in 0.1 M Sorenson’s phosphatebuffer (prepared with NaH2PO4.2H2O and Na2HPO4.12H2O), pH 7.2. After three rinses in buffer the specimenswere dehydrated in an ethanol series, infiltrated with LRWhite Resin (medium grade, TAAB L012) for several daysand polymerized at 55 8C.
Semi-thin (1 mm) sections were cut using a Reichert-JungUltracut ultramicrotome, collected on drops of distilled wateron multi-well slides coated with poly-L-lysine hydrobromide(Sigma P1399) and dried on a hot plate at 40 8C. Sectionsfor general morphology and observation of protein bodieswere stained with 0.01 % (w/v) Toluidine Blue in 1 % (w/v)sodium tetraborate, pH 9, and examined with bright-fieldoptics on a Zeiss Axiophot microscope. Some sections werealso stained with 1 % Naphtol Blue Black (also calledAmido Black, C.I. 20170) in 7 % (v/v) acetic acid, whichstains proteins specifically (Fisher, 1968; Dwarte andAshford, 1982).
Immunofluorescence
Fixed and resin-embedded grain sections were briefly rinsedwith PBST [PBS, Sigma A4417, 0.1 % (v/v) Tween 20, pH7.4] and incubated in blocking solution [5 % (w/v) BSA(Sigma A7638) diluted in PBST] for 40 min at room tempera-ture. This was followed by incubation in the primary anti-bodies diluted in 1 % BSA (w/v) in PBST for 2 h at roomtemperature. Antibodies were used singly or in combination(dilutions are shown in parentheses). The rabbit polyclonalanti-HMW-R2 (1 : 100) was combined with the mouse mono-clonal anti-IFRN 0610 (1 : 100), the mouse monoclonalanti-a-gliadin (glia-a-9, 9-68) (1 : 1000) or the mouse mono-clonal anti-g-gliadin (1 : 100). The rabbit polyclonalanti-v-gliadin-5 (1 : 200) was combined with the mousemonoclonal anti-IFRN 0610 (1 : 100) or the mouse mono-clonal anti-a-gliadin (glia-a-9, 9-68) (1 : 1000). Theunbound primary antibodies were removed by several rinseswith PBST for a period of 20 min. The sections were thenincubated for 1 h at room temperature in the dark with the sec-ondary antibodies (Alexa Fluor 488 or 568 goat anti-rabbit oranti-mouse IgG; Invitrogen A-11001, A-11004) diluted 1 : 250in 1 % BSA in PBST. Finally, the slides were rinsed twice withPBST and three times with PBS.
Sections were examined with a Zeiss Axiophot epifluores-cence microscope. A Retiga Exi CCD digital camera(Qimaging, Surrey, BC, Canada) and MetaMorph softwareversion 7.5.5 (Molecular Devices, Sunnyvale, CA, USA)were used to acquire the images.
RESULTS
Specificity of antibodies
The specificity of a library of antibodies raised against purifiedgluten fractions or synthetic peptides based on gluten proteinsequences was determined by western blotting of a totalprotein extract from wholemeal flour of wheat ‘Cadenza’after separation by SDS–PAGE.
This showed that that the library of antibodies recognizedalmost the entire range of gluten proteins (SupplementaryData S1, available online). The polyclonal antibodiesR2-HMW and anti-NT2-W were raised in rabbit against syn-thetic peptides and recognize, respectively, HMW-GS (bothx- and y-type) and v-5-type gliadins encoded by the Bgenome of hexaploid bread wheat (Tatham and Shewry,1985; Dupont et al., 2000). IFRN 0610 is a monoclonal anti-body raised against a total glutenin fraction and recognizesthe sequences QQSF and QQSY common to most wheat pro-lamins but not to HMW-GS. This antibody binds to severalgliadins and LMW-GS bands. The a-gli-9 antibody is alsomonoclonal and recognizes a coeliac-toxic motif present ina-gliadins. It binds to several bands in the a-gliadin sizerange but also, weakly, to v-gliadins. Finally, the monoclonalg-gliadin anti-peptide antibody binds specifically to g-gliadinrepeats.
All the antibodies described above were used for immuno-microscopy while the v-, a- and g-gliadin antibodies werealso tested on SDS–PAGE separations of the pearlingfractions.
Tosi et al. — Quantitative and qualitative protein gradients in wheat endosperm 25
Dow
nloaded from https://academ
ic.oup.com/aob/article-abstract/108/1/23/99491 by guest on 17 N
ovember 2018

Protein composition of pearling fractions
A series of fractions, each corresponding to between 6 and10 % of the grain dry weight, was prepared by sequential pear-ling of wheat grain (Supplementary Data S2). These fractions
showed a clear gradient in N content, with fraction 2, corre-sponding to the outermost part of the grain endosperm, con-taining about 50 % more nitrogen on a dry weight basis thanfraction 6 corresponding to the inner endosperm cells(Fig. 1A). SDS–PAGE (Fig. 1B) and western blotting analysiswas carried out on these fractions with antibodies againstspecific gluten protein types (Fig. 1D), loading either equalamounts of protein or protein from equal amounts of the pear-ling fractions, to take account of the quantitative protein gradi-ent. Figure 1C shows the quantification of HMW-GS in thevarious pearling fractions using densitometric scanning ofSDS–PAGE gels (Supplementary Data S3) while Fig. 1Dshows results of western blotting with the v-, g- anda-gliadin antibodies. These analyses show gradients in alltypes of gluten protein. The HMW-GS are readily identifiedand quantified on SDS–PAGE and clearly increased in pro-portion from fraction 1 (corresponding to the outer layers,aleurone and sub-aleurone) to fraction 6 (inner starchy endo-sperm). Changes in the intensity and number of bands corre-sponding to LMW-GS and gliadins are also evident acrossthe fractions. However, as the a-gliadins, g-gliadins andLMW-GS bands overlap in the SDS–PAGE separations thedifferences were not readily quantified by gel scanning. Itwas also not possible to quantify the relative amount ofv-gliadins by gel scanning due the presence of bands corre-sponding to non-gluten proteins which overlapped with thev-gliadins in the total SDS extract separations. Western blot-ting with gliadin-specific antibodies was therefore used,revealing contrasting gradients in distribution for thea-gliadins which were more abundant in the outer layers andthe g-gliadins which were more abundant in the inner part(similar in distribution to the HMW-GS). The distribution ofv-gliadins was determined using an antibody specific forv-5 gliadins. This recognized several bands which differedin their distribution, with two bands of Mr of approx. 70 kDa(see arrows in Fig 1D, III) being abundant in the outerlayers and practically absent from the inner ones and a majorband of Mr of approx. 90k Da (see arrowhead in Fig 1D, IIIand IV) being more evenly distributed through the endosperm.The two v-gliadin bands that were unevenly distributed acrossthe grain were not extracted by 70 % (v/v) ethanol but wereextracted by 50 % (v/v) propan-1ol + DTT. An antibody
1
0
0·00·51·01·5
Nitr
ogen
(%
)H
MW
-GS
in w
hole
lane
(%
)
2·02·53·0
1 2 3 4 5
Pearling fractions
Pearling fraction
6 7 8 90
5
10
15
20
25
A
C
2 3 4 5 6 7 Wholegrain
HMW-GS (protein basis)HMW-GS (weight basis)
Outer grainB
D
Inner grain
Marker 1 2 3 4 5 6 7Whole-meal
HMW
ω-gliadins
LMW -GS+α, β, γ-gliadins
Marker
82 kD
64 kD
49 kD37 kD
82 kD
64 kD
49 kD
37 kD
115 kD
82 kD
64 kD
49 kD
115 kD
I
II
III
IV82 kD
1 2 3 4 5 6 7Whole-meal
α-gliadinAb
γ-gliadinAb
ω5-gliadinAb
FI G. 1. Analyses of grain nitrogen and protein content in pearling fractions.(A) Percentage nitrogen in pearling fractions. Pearling fractions correspondto 1st ¼ 7 %, 2nd ¼ 6 %, 3rd ¼ 7 %, 4th ¼ 10 %, 5th ¼ 10 %, 6th ¼ 10 %,7th ¼ 50 % grain weight. Fraction 7 was obtained by ball milling of pearledgrains. (B) SDS–PAGE of total protein extracts from pearling fractions andwholemeal flour. The same amount of protein was loaded in each lane. Theposition on the gel of the main gluten protein types are indicated on theright. (C) Percentage of HMW-GS in total protein extracts of pearling fractionscalculated using scanning gel analysis. The diagram shows the results acquiredfrom both gels loaded on a same-weight basis (extracts from the same amountof flour were loaded for each pearling fraction) and gels loaded on a same-protein basis (the same amount of protein was loaded for each pearling frac-tion), to take in account the quantitative protein gradient. (D) Western blotanalysis of protein extracts from pearling fractions. Western blots I and II cor-respond to total protein extracts probed with antibodies against g-gliadin anda-gliadin, respectively. Western blots III and IV correspond to glutenin andgliadin fractions of gluten, respectively, probed with the antibody specificfor v-5 gliadins. Arrows with different orientations indicate proteins having
opposite gradients of distribution across the grain.
Tosi et al. — Quantitative and qualitative protein gradients in wheat endosperm26
Dow
nloaded from https://academ
ic.oup.com/aob/article-abstract/108/1/23/99491 by guest on 17 N
ovember 2018
against LMW-GS was also used which recognized four bandswhich were equally abundant in all six pearling fractions (datanot shown).
Spatial patterns of gluten protein distribution
Analysis of pearling fractions revealed clear gradients in thetotal protein content and in the distributions of different groupsof gluten proteins within the starchy endosperm. However, thisapproach does not provide detailed information on the compo-sition of different cell layers and types. The patterns of distri-bution of the different groups of gluten proteins at the tissueand cell levels were therefore determined by indirect fluor-escence microscopy, using combinations of specific primaryantibodies in double labelling experiments and detectionwith secondary antibodies conjugated to either AlexaFluor488 or 568. These fluorophores fluoresce in the green andred regions of the spectra, respectively, with no overlappingof their excitation or emission spectra. Five different primaryantibodies were used on cross-sections of wheat grain atfour different stages of development: 8, 14, 21 and 28 dpa.Toluidine Blue and Naphthol Blue stains were also usedat each stage to determine grain tissue structure anddevelopment.
8 dpa. Toluidine Blue staining of the sections at 8 dpa(Fig. 2A–E) shows a fully cellularized endosperm with aclearly defined endosperm cavity, and the cell files producedby periclinal division of the outer layer of endosperm cellsare still recognizable both in the lobes (Fig. 2B) and in thedorsal region (Fig. 2D), opposite the endosperm cavity. Thealeurone layer is still not fully differentiated although thelayer of cells closest to the pericarp appears to have a densercytoplasm and no starch granules. Starch granules arepresent in cells two to three layers in from the pericarp andare usually located at the periphery of the cells, as most ofthe centre of the cell is occupied by a large vacuole. Cell div-ision can be observed in the outer layers, up to two or threelayers from the pericarp (see arrows in Fig. 2D).
At this stage the protein bodies are very small and can usuallybe identified inside the vacuoles (arrowheads in Fig. 2B, C, E).They are strongly stained by Toluidine Blue at this magnification(20×) and, unlike the starch granules, are clearly visible only inthe lobe regions and from three cell layers in from the pericarp;their size appears to be similar across the different cells in theregion. Immunostaining for gluten proteins with the IFRN0610 antibody (Fig. 2F–J) shows clear labelling of the lobeswith little labelling of the dorsal region opposite the endospermcavity. However, higher magnification shows that protein bodiesare in fact present in this dorsal region, but only in the cellsseveral layers beneath the pericarp, and are much smaller thanthose in the lobes. In general, cells that are still actively dividing(see Fig. 2D, arrows) do not appear to accumulate proteinsalthough starch granules are clearly visible.
Immunostaining with the HMW-GS antibody (Fig. 2K–O)gives a weaker signal than with the IFRN 0610 antibody butalso shows that the signal is concentrated in the lobe regions(Fig. 2L), although labelling of very small protein bodies inthe region proximal to the endosperm cavity is also observed(Fig. 2O).
The labelling pattern obtained with the glia-a-9 antibody(Fig. 2P–T) is very similar to that observed with IFRN 0610except that some labelling is also visible in the dorsal regionalthough restricted to cells four to five layers from the pericarp.
Immunostaining with the g-gliadin-specific monoclonalantibody (Fig. 2U–Z) gives a similar pattern of labelling tothat with the HMW-glutenin antibody, in being almostabsent from the dorsal region and strongest in the most distalregion of the lobes.
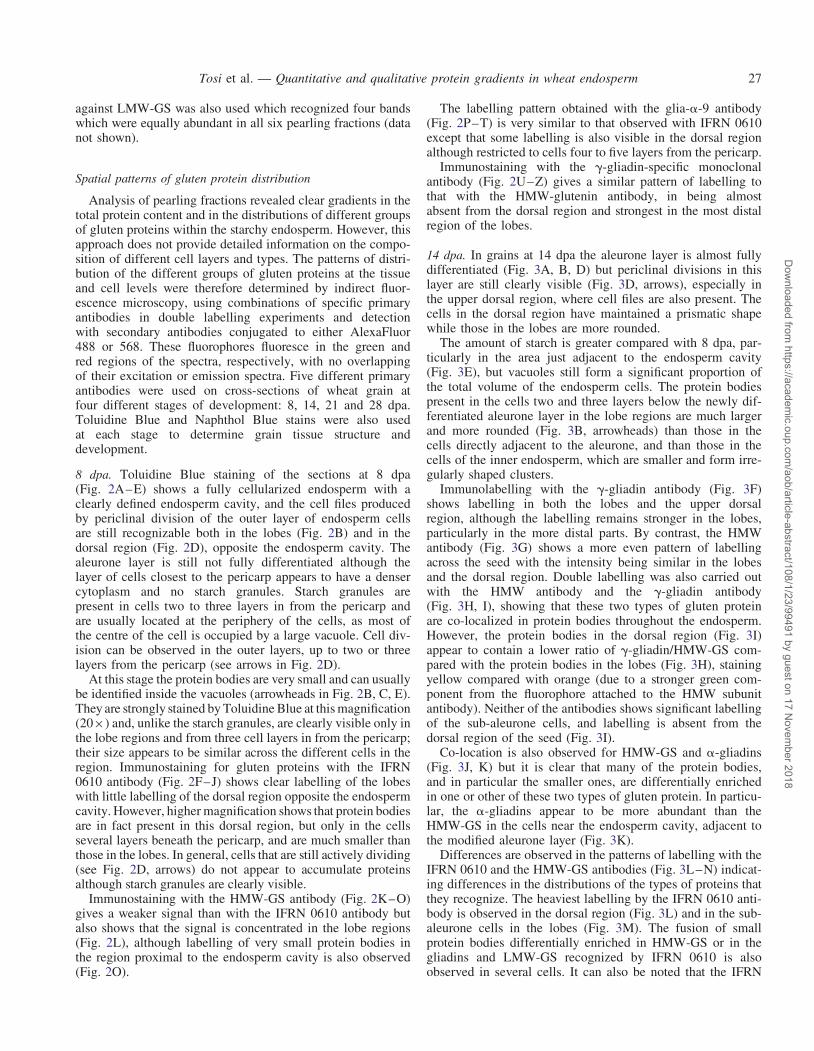
14 dpa. In grains at 14 dpa the aleurone layer is almost fullydifferentiated (Fig. 3A, B, D) but periclinal divisions in thislayer are still clearly visible (Fig. 3D, arrows), especially inthe upper dorsal region, where cell files are also present. Thecells in the dorsal region have maintained a prismatic shapewhile those in the lobes are more rounded.
The amount of starch is greater compared with 8 dpa, par-ticularly in the area just adjacent to the endosperm cavity(Fig. 3E), but vacuoles still form a significant proportion ofthe total volume of the endosperm cells. The protein bodiespresent in the cells two and three layers below the newly dif-ferentiated aleurone layer in the lobe regions are much largerand more rounded (Fig. 3B, arrowheads) than those in thecells directly adjacent to the aleurone, and than those in thecells of the inner endosperm, which are smaller and form irre-gularly shaped clusters.
Immunolabelling with the g-gliadin antibody (Fig. 3F)shows labelling in both the lobes and the upper dorsalregion, although the labelling remains stronger in the lobes,particularly in the more distal parts. By contrast, the HMWantibody (Fig. 3G) shows a more even pattern of labellingacross the seed with the intensity being similar in the lobesand the dorsal region. Double labelling was also carried outwith the HMW antibody and the g-gliadin antibody(Fig. 3H, I), showing that these two types of gluten proteinare co-localized in protein bodies throughout the endosperm.However, the protein bodies in the dorsal region (Fig. 3I)appear to contain a lower ratio of g-gliadin/HMW-GS com-pared with the protein bodies in the lobes (Fig. 3H), stainingyellow compared with orange (due to a stronger green com-ponent from the fluorophore attached to the HMW subunitantibody). Neither of the antibodies shows significant labellingof the sub-aleurone cells, and labelling is absent from thedorsal region of the seed (Fig. 3I).
Co-location is also observed for HMW-GS and a-gliadins(Fig. 3J, K) but it is clear that many of the protein bodies,and in particular the smaller ones, are differentially enrichedin one or other of these two types of gluten protein. In particu-lar, the a-gliadins appear to be more abundant than theHMW-GS in the cells near the endosperm cavity, adjacent tothe modified aleurone layer (Fig. 3K).
Differences are observed in the patterns of labelling with theIFRN 0610 and the HMW-GS antibodies (Fig. 3L–N) indicat-ing differences in the distributions of the types of proteins thatthey recognize. The heaviest labelling by the IFRN 0610 anti-body is observed in the dorsal region (Fig. 3L) and in the sub-aleurone cells in the lobes (Fig. 3M). The fusion of smallprotein bodies differentially enriched in HMW-GS or in thegliadins and LMW-GS recognized by IFRN 0610 is alsoobserved in several cells. It can also be noted that the IFRN
Tosi et al. — Quantitative and qualitative protein gradients in wheat endosperm 27
Dow
nloaded from https://academ
ic.oup.com/aob/article-abstract/108/1/23/99491 by guest on 17 N
ovember 2018

A
F G H I J
K L M N O
P Q R S T
U V W X Y
B C D E
FI G. 2. Transverse sections of 8–10-dpa grain. (A–E) Toluidine Blue stain. (A) Low-magnification view: scale bar ¼ 250 mm. The areas labelled B–E show theregions of the grain that were studied in detail and correspond to parts (B)–(E) of the figure. Scale bars in (B–E)¼ 50 mm. (B) Lobe outer region. Small proteinbodies (arrowheads) are already present in the vacuoles of developing starchy endosperm cells. (C) Lobe central area. Small protein bodies can be seen in endospermcells, but most of them are smaller than the one observed in (B). (D) Dorsal region of the grain. Arrows show actively dividing cells. (E) Ventral region of the grainopposite the ventral groove and comprising modified aleurone cells. Protein bodies are very small. (F–J) Single labelling showing the distribution of LMW-GS andgliadins when probed with the IFRN 0610 antibody and detected with the goat anti-mouse AlexaFluor 568 secondary antibody. (F) Low-magnification view: scalebar ¼ 500 mm. Labelling is strongest in the lobes and decreases toward the dorsal and ventral areas of the grain. Scale bars in (G–J)¼ 50 mm. (G) Lobe region.Protein bodies are strongly labelled as shown by the red fluorescence. (H) Central area of the lobe. (I) Dorsal region of the grain. Protein bodies are much smallerthan in the lobes and no protein bodies are present in cell layers still undergoing division (arrows). (J) Ventral region of the grain. Protein bodies are very small, butalready clearly labelled. (K–O) Single labelling showing the distribution of HMW-GS when probed with the polyclonal antibody R2-HMG specific for HMW gluteninsubunits and detected with the goat anti-rabbit AlexaFluor 568 secondary antibody. (K) Low-magnification view: scale bar ¼ 500 mm. Labelling is strongest in the lobes,where protein bodies are larger. Scale bars in (L–O)¼ 50 mm. (L) Lobe region. Clear labelling of protein bodies is observed below the differentiating aleurone layer. (M)Central part of the lobe. (N) Dorsal part of the grain. Protein bodies are very small and labelling is very weak. (O) Ventral region. (P–T) Single labelling showing thedistribution ofa-gliadins when probed with the monoclonal glia-a-9, 9-68 antibody and detected with the goat anti-mouse AlexaFluor 568 secondaryantibody. (P) Low-magnification view: scale bar ¼ 500 mm. Labelling is stronger in the lobes. Scale bars in (Q–T)¼ 50 mm. (Q) Lobe region. Protein bodies are strongly labelled in cellsjust below the layerof still dividing outer endosperm cells. (R) Central part of the lobe. Protein bodies are clearly labelled. (S) Dorsal region of the grain. Protein bodies aresmall but clearly labelled. (T) Ventral region. Protein bodies are small but clearly labelled. (U–Y) Single labelling showing the distribution ofg-gliadin when probed withthe monoclonal S3-B512 monoclonal antibody and detected with the goat anti-mouse AlexaFluor 568 secondary antibody. (U) Low-magnification view: scale bar ¼500 mm. Labelling is stronger in the lobes. Scale bars in (V–Y)¼ 50 mm. (V) Lobe region. Protein bodies are strongly labelled in cells below the layer of still dividingouterendosperm cells. (W) Central area of the lobe. (X) Dorsal region. Protein bodies are verysmall and very weakly labelled below the layerof dividing cells. (Y) Ventralregion. Labelling is extremely weak in this area of the grain. Note: in (F), (K), (P) and (U) the colour has been changed from red to yellow to facilitate visualization. In (I),(J), (L), (N), (Q), (S), (T), (X) and (Y), in order to help visualization of the cells’ content, immunolabelling images (red) were partly overlaid with images from the greenchannel showing autofluorescence. Abbreviations: AL, aleurone; Mal, modified aleurone; N, nucleus; NC, nucellus; S, starch; SE, starchy endosperm; P, pericarp; VG,
ventral groove. Arrows indicate dividing nuclei. Arrowheads indicate protein bodies in vacuoles.
Tosi et al. — Quantitative and qualitative protein gradients in wheat endosperm28
Dow
nloaded from https://academ
ic.oup.com/aob/article-abstract/108/1/23/99491 by guest on 17 N
ovember 2018
0610 antibody labelled the small protein bodies more heavilythan the large protein bodies (arrows in Fig. 3N) throughoutthe endosperm, while the HMW-GS antibody showed theopposite pattern.
The antibody specific for LMW-GS could not be used onsections for microscopy, probably due to denaturation of thecorresponding epitope during fixation and embedding.
21 dpa. At 21 dpa the aleurone layer is completely differen-tiated and the cells have dense cytoplasm which stains inten-sely with toluidine blue (Fig. 4A). Periclinal divisions ofaleurone cells are still visible in the dorsal region but are infre-quent (data not shown). The starchy endosperm cells haveaccumulated more starch, which now fills most of the cellvolume, while the vacuoles, especially in the dorsal region,are much smaller and contain large protein bodies.
In general, larger protein bodies are observed in the sub-aleurone cells in the lobe regions (Fig. 4B), but large proteinbodies can also be observed at this stage in the dorsal regionof the grain (Fig. 4D). The sub-aleurone protein bodies retaina round, regular shape while the protein bodies in the centralendosperm appear to be clusters of smaller protein bodies andhave irregular shapes (compare Fig. 4B, D with Fig. 4E). It isalso clear from several micrographs that the enlargement ofthe large protein bodies occurs at this stage by fusion ofsmaller protein bodies (Fig. 4B–D, arrows), as the outlines ofthe individual small protein bodies are distinguishable.
Double labelling with the IFRN 0610 and the HMW-GSantibodies (Fig. 4F–H) shows clear segregation in the depo-sition of the gluten proteins recognized by these antibodies.
The gliadins and LMW-GS recognized by IFRN 0610appear more abundant in the outermost cell layers (Fig. 4F)
A
F
J K L M N
G H I
B C D E
FI G. 3. Transverse sections of 14-dpa grain. (A) Toluidine Blue stain. Scale bar ¼ 250 mm. The areas labelled B–E show the regions of the grain that werestudied in detail, and correspond to the figure parts (B) to (E). (B–E) Naphthol Blue Black stain; scale bars ¼ 50 mm. (B) Lobe region. Protein bodies haveenlarged, but are smaller in the sub-aleurone layer. (C) Lobe centre area. Protein bodies are small. (D) Dorsal region. Evidence of periclinal divisions canstill be seen (arrows). Protein bodies are very small and more evident towards the inner area of the grain. (E) Ventral area next to modified aleurone. Starchis very abundant. (F) Single labelling showing the distribution of g-gliadin when probed with the S3-B512 monoclonal antibody and detected with the goat anti-mouse AlexaFluor 568 secondary antibody. Labelling is stronger in the lobes. (G) Single labelling showing the distribution of HMW-GS when probed with thepolyclonal anti-HMW-R2 antibody and detected with the goat anti-rabbit AlexaFluor 568 secondary antibody. Labelling is fairly even across the grain. (H, I)Double labelling showing the distribution of HMW-GS, in green, and g-gliadins, in red. The two types of gluten proteins are co-localized in protein bodiesthroughout the endosperm. (J, K) Double labelling showing the distribution of HMW-GS, in green and a-gliadins, in red (monoclonal glia-a-9, 9-68 antibodydetected with the goat anti-mouse AlexaFluor 568 secondary antibody). Small protein bodies appear enriched in a-gliadins. (L–N) Double labelling with anti-body specific for HMW-GS (green) and antibody IFR 0610, recognizing LMW-GS and gliadins (red): (L) dorsal region; (M) sub-aleurone cells in the lobe; (N)enlargement of area within the square in panel (M). Arrows show protein bodies differentially enriched in HMW-GS (green) or LMWGS and gliadins (orange).Scale bars: (F, G) ¼ 500 mm, (H–J, L,M) ¼ 25 mm, (K, N) ¼ 50 mm. Note: In (F) and (G) the colour has been changed from red to yellow to facilitate visu-alization. Abbreviations: AL, aleurone; MAl, modified groove aleurone; S, starch; SA, sub-aleurone layer; SE, starchy endosperm; P, pericarp; VG, ventral
groove. Arrowheads indicate protein bodies in vacuoles.
Tosi et al. — Quantitative and qualitative protein gradients in wheat endosperm 29
Dow
nloaded from https://academ
ic.oup.com/aob/article-abstract/108/1/23/99491 by guest on 17 N
ovember 2018

and enriched in the smaller protein bodies while the largerprotein bodies, both in the sub-aleurone layer and in theinner endosperm cells, are enriched in HMW-GS (Fig. 4G,H). Overall, gliadins and LMW-GS are more abundant in thedorsal regions of the grain and around the endosperm cavity(see Fig. 4F).
As observed at 14 dpa, double labelling with the antibodiesspecific for HMW-GS and a-gliadins (Fig. 4I) indicates thatthe deposition of these two types of proteins is initially segre-gated, with the a-gliadins being more abundant in smallprotein bodies. Furthermore, at this stage, a-gliadins appearedto be more abundant than HMW-GS in the protein bodies ofsub-aleurone cells (Fig. 4I, arrows).
Double labelling with the antibodies for HMW-GS andg-gliadins indicates that these two types of protein areco-located in the protein bodies of the central endosperm,both in the lobes and in the dorsal region (data not shown).However, very little g-gliadin appears to be present in theouter layers of the endosperm and in the cells adjacent tothe endosperm cavity (Fig. 4J).
Very clear segregation is observed when the antibodyspecific for v-5 gliadins is used in double labelling exper-iments with the a-gliadin antibody (Fig. 4K–N), with thev-5 gliadin antibody strongly labelling small deposits on theperiphery of the large protein bodies labelled by thea-gliadin antibody. However, whereas the small peripheral
A
F
J K L M N
G H I
B C D E
FI G. 4. Transverse sections of 21-dpa grain. (A) Toluidine Blue stain: scale bar ¼ 250 mm. The areas B–E show the regions of the grain that were studied indetail and correspond to the figure parts (B)–(E). (B–E) Naphtol blue black stain. Scale bars ¼ 50 mm. (B) Lobe region. Arrowhead shows a large protein bodyin the sub-aleurone. (C) Lobe centre area. Protein bodies are smaller than in the sub-aleurone. (D) Dorsal region. The aleurone layer is well differentiated (AL).(E) Ventral area next to modified aleurone. Protein bodies are smaller and are often in clusters. (F–H) Double labelling showing the distribution of HMW-GS ingreen (probed with the anti-HMW-R2 polyclonal antibody and detected with the goat anti-rabbit AlexaFluor 488 secondary antibody) and gliadins and LMW-GS(probed with the IFRN 0610 monoclonal antibody and detected with the goat anti-mouse AlexaFluor 568 secondary antibody). (F) Whole grain. The more pro-nounced red fluorescence in the outermost cell layers suggests enrichment in LMW-GS and gliadins, particularly in the smaller protein bodies. Scale bar ¼500 mm. (G) Lobe, sub-aleurone region. Larger protein bodies appear rich in HMW-GS as indicated by the stronger green fluorescence, while smallerprotein bodies in the subaleurone layers exhibit more red fluorescence, suggesting a higher LMW-GS and gliadin content. The arrow shows a fold in thesample due to incomplete stretching of the resin. Scale bar ¼ 50 mm. (H) Protein bodies from the centre of the lobe showing aggregation and fusion ofprotein bodies. Scale bar ¼ 25 mm. (I) Lobe area. Double labelling with antibodies specific for HMW-GS, in green, and a-gliadins, in red. a-gliadins aremore abundant than HMW-GS in the protein bodies of sub-aleurone cells (arrows). Scale bar ¼ 50 mm. (J) Double labelling showing the distribution ofHMW-GS in green and g-gliadin in red, in cells adjacent to the endosperm cavity (modified aleurone). The orange colour of the protein bodies suggeststheir enrichment in a-gliadins. Scale bar ¼ 50 mm. (K–N) Double labelling showing the distribution of v5-gliadins in green (anti-NT2-v, rabbit polyclonal anti-body detected with the goat anti-rabbit AlexaFluor 488 secondary antibody) and the a-gliadins in red (monoclonal glia-a-9, 9-68 detected with the goat anti-mouse AlexaFluor 568 secondary antibody). v5-gliadins are concentrated in small deposits on the surface of protein bodies (arrows). (L, M) Single channelimages showing the distribution of a-gliadins (L) and v5-gliadins (M) in protein bodies of a sub-aleurone cell. (N) Double channel image obtained by combining(L) and (M). Scale bar: (K) ¼ 50 mm, (L–N) ¼ 25 mm. Abbreviations: Al, aleurone; MAl, modified groove aleurone; S, starch; V, vacuole; SE, starchy
endosperm; VG, ventral groove. Arrowheads indicate protein bodies in vacuoles.
Tosi et al. — Quantitative and qualitative protein gradients in wheat endosperm30
Dow
nloaded from https://academ
ic.oup.com/aob/article-abstract/108/1/23/99491 by guest on 17 N
ovember 2018

deposits are not labelled by the a-gliadin antibody (Fig. 4L,arrows), weak uniform labelling of the large protein bodiesis observed with the v-5 gliadin antibody (Fig. 4M, N).
28 dpa. At 28 dpa nuclei are no longer recognizable in thestarchy endosperm cells which, particularly in the dorsalregion of the grain and in the inner layer of the lobes, arepacked with starch and protein (Fig. 5D–F). Furthermore, insome cells the protein bodies have merged to form a continu-ous matrix surrounding the starch granules (Fig. 5D).However, the presence of a continuous protein matrix is notobserved in the sub-aleurone cells of the lobe regions(Fig. 5B, C) where it is possible to observe fusion of largeprotein bodies inside still clearly recognizable vacuoles.Particularly notable at this stage is that the protein bodies ofthe sub-aleurone layer differ in shape from those in the innerendosperm cells, being rounded rather than irregular.
Immunolabelling (Fig. 5G–N) shows that the large proteinbodies in the cells below the sub-aleurone (comprising twocell layers) and throughout the inner endosperm are enrichedin HMW-GS whereas the smaller protein bodies, and in par-ticular those in the sub-aleurone adjacent to the aleurone, aremore heavily labelled with the a-gliadin antibody and by
IFRN 0610 antibody. Heavier labelling of the small proteinbodies in the inner endosperm of the lobes is observed withIFRN 0610 than with the antibodies specific for a- andg-gliadins, suggesting that these protein bodies are enrichedin the LMW-GS recognized by IFRN 0610.
DISCUSSION
The functional properties of the wheat grain are determinedmainly by the gluten protein fraction, in terms of both proteincontent and protein quality, and wheat flours from different mill-streams, which derive from different regions of the endosperm,have different breadmaking properties, due to the presence ofcompositional gradients. Typically, the protein percentage inthe mature endosperm is low in the cells near the endospermcavity and increases in an outward radial direction (Morriset al., 1945; Normand et al., 1965; Farrand, 1974; Farrand andHinton, 1974) while the percentage of starch follows aninverse gradient. Consequently, it is possible to isolate highprotein flour fractions derived from cells of the outer (i.e. sub-aleurone) layers of the starchy endosperm and low proteinflour fractions from cells of the central part of the grain.
A
G
K L M N
H I J
B C D E F
FI G. 5. Transverse sections of 28-dpa grain. (A, B) Toluidine Blue stain. Scale bars ¼ 250 mm. (A) Dorsal region of the grain. (B) Lobe. (C–F) Naphtol BlueBlack stain. Scale bars ¼ 50 mm. (C) Lobe region. Larger protein bodies have formed by fusion of smaller protein bodies. (D) Lobe centre area. Cells are packedwith small and large starch granules and protein bodies are fusing. (E) Dorsal region. (F) Ventral area next to modified aleurone. (G–I) Double labelling showingthe distribution of HMW-GS in green (HMW-R2 polyclonal antibody detected with the goat anti-rabbit AlexaFluor 488 secondary antibody) and LMW-GS andgliadins in red (IFRN 0610 monoclonal antibody detected with the goat anti-mouse AlexaFluor 568 secondary antibody). Scale bars ¼ 50 mm. (G) Lobe region.Large protein bodies are rich in HMW-GS whereas the small protein bodies in the subaleurone remain rich in LMW-GS and gliadins, as shown by the red anddark orange fluorescence (arrows). (H) Centre of the lobe. Small protein bodies appear enriched in LMW-GS (red fluorescence). (I) Dorsal area. The subaleuronelayer is rich in protein bodies, which fluoresce red or dark orange, indicating enrichment in LMW-GS and gliadins. (J–L) Double labelling showing the distri-bution of HMW subunits in green (as above) and a-gliadin in red (monoclonal glia-a-9, 9-68 antibody detected with the goat anti-mouse AlexaFluor 568 sec-ondary antibody). (J) Lobe region. (K) Dorsal region. (L) Dorsal area close to the endosperm cavity (Mal). (M) Lobe region. Double labelling showing thedistribution of v5-gliadins in green (anti-NT2v polyclonal antibody detected with the goat anti-rabbit AlexaFluor 488 secondary antibody) and LMW-GSand gliadins in red (as above ). The small deposits on the periphery of protein bodies are still clearly labelled with the antibody specific for v5-gliadin(arrows); the protein bodies in the subaleurone layers are rich in LMW-GS, as indicated by their red/dark orange fluorescence. Scale bar ¼ 50 mm. (N)Central part of the lobe. Single labelling showing the distribution of g-gliadin (S3-B512 monoclonal antibody detected with the goat anti-mouse AlexaFluor
568 secondary antibody). Scale bar ¼ 50 mm. Abbreviations: Al, aleurone; Mal, modified groove aleurone; S, starch; V, vacuole.
Tosi et al. — Quantitative and qualitative protein gradients in wheat endosperm 31
Dow
nloaded from https://academ
ic.oup.com/aob/article-abstract/108/1/23/99491 by guest on 17 N
ovember 2018

However, the protein gradient is also qualitative as demonstratedby the fact that the flour fractions derived from the central endo-sperm, although lower in total protein content, generally havebetter functional properties than flour derived from the outerlayers (Yahata et al., 2006; Okrajkova et al., 2007).
In this paper immunostaining microscopy was used to studythe in vivo distribution of gluten proteins in bread wheat,revealing qualitative gradients in the various types of glutenproteins across the grain. This confirms our previous study ofdurum wheat (Tosi et al., 2009) and provides novel infor-mation based on the use of a library of antibodies specificfor different types of gluten proteins. Thus, an antibody forHMW-GS was used either alone or in combination with anti-bodies recognizing specific gliadins and LMW-GS, to demon-strate the presence of a higher proportion of HMW-GS in thecentral part of the endosperm while gliadins and LMW-GSwere generally more abundant in the sub-aleurone layer andthe cells immediately adjacent to it. This gradient was firstapparent at 14 dpa, became more evident at 21 dpa and wasstill clearly present at physiological maturity when some ofthe larger protein bodies had fused to form a protein matrix.The spatial patterns of accumulation that we observed forHMW-GS and LMW-GS/gliadins using immunostaining arebroadly in agreement with expression patterns of HMW-GSand LMW-GS gene promoter : GUS constructs reported intransgenic wheat (Lamacchia et al., 2001; Stoger et al.,2001; Jones et al., 2008).
The qualitative and quantitative protein gradients shown bymicroscopy were also consistent with analyses of flour frac-tions obtained by pearling of mature wheat grains. The totalprotein content increased between the outermost fraction andthe second fraction and then steadily decreased in the fractionscorresponding to inner parts of the endosperm. A gradualincrease in the relative intensity of the bands correspondingto HMW-GS was also observed in Coomassie Blue-stainedSDS–PAGE gel separations of the pearling fractions fromthe outer to inner parts of the endosperm, while an oppositetrend was observed for v-gliadins and a-gliadins whenspecific antibodies were used in western blotting experimentsto detect these protein types in the pearling fractions.However, it was surprising to note that the distribution ofg-gliadins (also determined using a g-gliadin-specific anti-body) was more similar to that of the HMW-GS than thoseof the LMW-GS and a-gliadins, to which they are mostclosely related in protein and gene promoter sequences(Shewry and Halford, 2002).
However, not all the proteins belonging to a given subgroupshowed an identical trend in expression across the grain andsome bands vary in staining intensity in the different endo-sperm fractions (see Fig. 1B, D).
Differences in protein distribution throughout the endo-sperm have also been observed in barley (Shewry et al.,1993; Tecsi et al., 2000) and in rice (Ellis et al., 1987), thesub-aleurone cells of both species being rich in proteins.Immunocytochemical and pearling studies of barley havealso shown that the protein-rich sub-aleurone cells are enrichedin S-rich and S-poor prolamins (B and C hordeins), while theHMW prolamin of barley (D hordein) is only present in sig-nificant amounts in the inner part of the starchy endosperm(Shewry et al., 1996).
Although it is well documented that gradients in protein dis-tribution are present in cereal grains, their biological signifi-cance is not known. Similarly, we do not know the precisemechanism by which these gradients are established duringgrain development. Ugalde and Jenner (1990a) carried outquantitative compositional analysis of microsections cutalong the radial axis of wheat grains and showed that theincrease in protein concentration from the endosperm cavityto the periphery of the endosperm resulted mainly from thepattern of protein deposition, given that starch was depositedfairly evenly along the endosperm. The same authors alsoestablished that amino acids were exclusively supplied to thegrain via the endosperm cavity and although there were gradi-ents in the concentration of total soluble amino acids across theendosperm, they did not match the patterns of protein depo-sition. Furthermore, they found little change in the aminoacid composition across the starchy endosperm, with theexception of free aspartate, which was higher in the outerlayers. They concluded that the transport of amino acidsacross the endosperm did not impose any limits to thepattern of protein deposition as deposition was greater in theregions of endosperm that were furthest from the source ofamino acid substrate.
Both the quantitative and the qualitative gradients of proteindistribution appear to follow the radial pattern of cell develop-ment of the endosperm and it may therefore be hypothesizedthat the gradients have a developmental basis. Cellularizationof the wheat endosperm follows a centripetal mode and is con-cluded by about 6–8 dpa (Mares et al., 1975, 1977; Fineranet al., 1982) which according to transcriptomic studiescoincides with the initiation of starch and storage protein syn-thesis (Shewry et al., 2009). The same transcriptomic data alsoshow that the timing of expression of most gluten proteingenes is similar, the only exception being a short(approx. 2 d) time lag in the accumulation of transcripts forHMW-GS compared with those encoding other gluten pro-teins. Further cell division of the endosperm may continueuntil 20 dpa (Jennings and Morton, 1963), due to periclinaldivisions of the cells from the outermost layer of the endo-sperm, so that the oldest cells occur in the centre and theyoungest at the perimeter of the endosperm. Although onlylimited accumulation of storage compounds occurs in cellsthat are still actively dividing (see Figs 2I, L, N, Q and 3H,S), the most recently formed sub-aleurone cells contain thehighest proportion of protein at maturity. Furthermore, PCDis initiated in the wheat endosperm at about 16 dpa and pro-gresses stochastically during development (Young andGallie, 1999), which contrasts with other cereals such asmaize where cell death is initiated within the upper centralendosperm and then expands outward in an ordered manner.In wheat, therefore, there seems to be no relationshipbetween the relative position of a cell (or a cell layer) withinthe endosperm and the duration of accumulation of storagecompounds in that cell. This may suggest that the higheramount of protein accumulated in the sub-aleurone cells com-pared with those in the inner endosperm is determined by ahigher rate of protein synthesis in the outer layers of the endo-sperm, not by a longer duration of deposition. Genes encodinggluten proteins are primarily regulated at the level of genetranscription (Giese and Hopp, 1984; Bartel and Thompson,
Tosi et al. — Quantitative and qualitative protein gradients in wheat endosperm32
Dow
nloaded from https://academ
ic.oup.com/aob/article-abstract/108/1/23/99491 by guest on 17 N
ovember 2018
1986; Sorensen et al., 1989) and it can be hypothesized thatgradients in the concentrations of specific transcriptionfactors or other regulatory signals from the maternal tissuesand acting on specific domains of the gluten protein gene pro-moters could modulate/regulate the rates of transcription ofgluten protein genes in the different endosperm regions. Theendosperm cells in the sub-aleurone produced by the divisionsin the ‘cambium-like’ layer would therefore become progress-ively less exposed to these signals from the maternal tissue asthey move further from the aleurone during development.These regulatory signals would have to display different speci-ficity for the promoters of the various classes of gluten pro-teins, in order to determine a qualitative protein gradient.
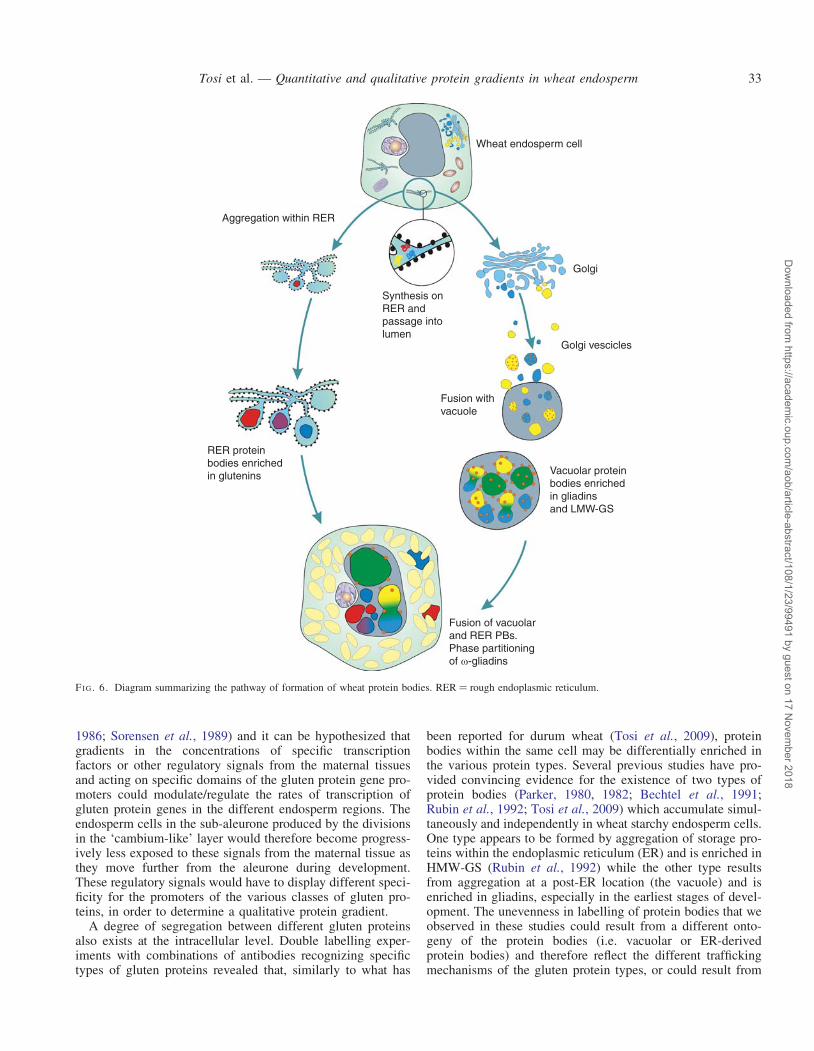
A degree of segregation between different gluten proteinsalso exists at the intracellular level. Double labelling exper-iments with combinations of antibodies recognizing specifictypes of gluten proteins revealed that, similarly to what has
been reported for durum wheat (Tosi et al., 2009), proteinbodies within the same cell may be differentially enriched inthe various protein types. Several previous studies have pro-vided convincing evidence for the existence of two types ofprotein bodies (Parker, 1980, 1982; Bechtel et al., 1991;Rubin et al., 1992; Tosi et al., 2009) which accumulate simul-taneously and independently in wheat starchy endosperm cells.One type appears to be formed by aggregation of storage pro-teins within the endoplasmic reticulum (ER) and is enriched inHMW-GS (Rubin et al., 1992) while the other type resultsfrom aggregation at a post-ER location (the vacuole) and isenriched in gliadins, especially in the earliest stages of devel-opment. The unevenness in labelling of protein bodies that weobserved in these studies could result from a different onto-geny of the protein bodies (i.e. vacuolar or ER-derivedprotein bodies) and therefore reflect the different traffickingmechanisms of the gluten protein types, or could result from
Wheat endosperm cell
Aggregation within RER
Synthesis onRER andpassage intolumen
Fusion withvacuole
Vacuolar proteinbodies enrichedin gliadinsand LMW-GS
RER proteinbodies enrichedin glutenins
Fusion of vacuolarand RER PBs.Phase partitioningof ω-gliadins
Golgi
Golgi vescicles
FI G. 6. Diagram summarizing the pathway of formation of wheat protein bodies. RER ¼ rough endoplasmic reticulum.
Tosi et al. — Quantitative and qualitative protein gradients in wheat endosperm 33
Dow
nloaded from https://academ
ic.oup.com/aob/article-abstract/108/1/23/99491 by guest on 17 N
ovember 2018

segregation of the protein types into different domains withinthe same cell organelle. Fusion of smaller protein bodieswhich are differentially enriched in specific types of glutenprotein would then lead to the formation of larger proteinbodies with a more complex structure and composition.However, in most cases double labelling of the larger proteinbodies gave fairly even patterns, suggesting that differentgluten protein types become homogeneously distributed fol-lowing the fusion of the smaller protein bodies. An exceptionwas the v-5 gliadins, which partition separately from the otherclasses of gluten proteins to form small deposits on the surfaceof the large protein bodies. This is, to our knowledge, the firsttime that such clear segregation has been reported for glutenproteins, although it has been described for gluten proteinsand globulins in protein bodies of wheat (Bechtel et al.,1991) and oat (Lending et al., 1989). A diagram summarizingthe pathway of formation of wheat protein bodies is shown inFig. 6.
It is clear from our data that more studies are required obetter understand the precise mechanism regulating proteingradients in cereals, their possible biological meaning (i.e.role in grain development and seed germination) and howthey are influenced by the environment and nutritional factors.
SUPPLEMENTARY DATA
Supplementary data are available online at www.aob.oxfordjournals.org and consist of the following files. S1: westernblot showing the specificity of the different antibodies usedon total protein extracts of ‘Cadenza’ mature seeds. S2: datafor spring wheat pearling reproducibility. S3: data for reprodu-cibility of gel scan analysis.
ACKNOWLEDGEMENTS
We thank colleagues in the Bioimaging Unit at Rothamsted, inparticular Dr Allison van de Meene and Mrs Jean Devonshire,for their help and support with the microscopy studies. We alsothank Lynda Castle, at Rothamsted ‘Visual CommunicationUnit’, for drawing the diagram in Fig. 6. We are extremelygrateful to Dr Sandra Denery-Papini, Dr Oliver Tranquet(INRA, Nantes, France) and Professor Frits Koning (LeidenUniversity Medical Center) for providing some of the anti-bodies used for this study. J.H. is a PhD student supportedby BBSRC and Campden BRI. Rothamsted Research receivesgrant-aided support from the Biotechnology and BiologicalSciences Research Council (BBSRC) of the UK.
LITERATURE CITED
Bartel D, Thompson RD. 1986. Synthesis of messenger-RNAs coding forabundant endosperm proteins during wheat grain development. PlantScience 46: 117–125.
Bechtel DB, Wilson JD, Shewry PR. 1991. Immunocytochemical localisationof the wheat storage protein triticin in developing endosperm tissue.Cereal Chemistry 68: 573–577.
Becraft PW, Asuncion-Crabb YT. 2000. Positional cues specify and maintainaleurone cell fate during maize endosperm development. Development127: 4039–4048.
Brett GM, Mills ENC, Goodfellow BJ, Fido RJ, Tatham AS, Shewry PR,Morgan MRA. 1999. Epitope mapping studies of broad specificity
monoclonal antibodies to cereal prolamins. Journal of Cereal Science29: 117–128.
Denery-Papini S, Popineau Y, Quillien L, Van Regenmortel MHV. 1996.Specificity of antisera raised against synthetic peptide fragments of highMr glutenin subunits. Journal of Cereal Science 23: 133–144.
Denery-Papini S, Samson MF, Autran JC. 2000. Anti-peptide antibodiesdirected against omega-gliadins for the detection of sequences frombread and durum wheats. Food and Agricultural Immunology 12: 67–75.
Doan DNP, Linnestad C, Olsen O-A. 1996. Isolation of molecular markersfrom the barley endosperm coenocyte and the surrounding nucellus celllayers. Plant Molecular Biology 31: 877–886.
Dupont FM, Vensel WH, Chan R, Kasarda DD. 2000. Characterisation ofthe 1B-type v-gliadins form Triticum aestivum cultivar Butte. CerealChemistry 77: 607–614.
Dwarte D, Ashford AE. 1982. The chemistry and microstructure of proteinbodies in celery endosperm. Botanical Gazette 143: 164–175.
Ellis JR, Gates PJ, Boulter D. 1987. Storage-protein deposition in the devel-oping rice caryopsis in relation to the transport tissues. Annals of Botany60: 663–670,
Farrand EA. 1974. Study of relationships between wheat protein contents oftwo U.K. varieties and derived flour protein contents at varying extractionrates. I. Studies on an experimental commercial mill and a laboratoryBuhler mill. Cereal Chemistry 51: 56–65.
Farrand EA, Hinton JJC. 1974. Study of relationships between wheat proteincontents of two U.K. varieties and derived flour protein contents atvarying extraction rates. II. Studies by hand-dissection of individualgrains. Cereal Chemistry 51: 66–73.
Fineran BA, Wild DJC, Ingerfeld M. 1982. Initial wall formation in theendosperm of wheat, Triticum aestivum: a reevaluation. CanadianJournal of Botany 60: 1776–1795.
Fisher DB. 1968. Protein staining of ribboned epon sections for lightmicroscopy. Histochemistry and Cell Biology Journal 16: 92–96.
Giese H, Hopp E. 1984. Influence of nitrogen nutrition on the amount ofhordein, protein Z and b-amylase messenger RNA in developing endo-sperms of barley. Carlsberg Research Communication 49: 365–383.
Hueros G, Varotto S, Salamini F, Thompson RD. 1995. Molecular charac-terization of BET1, a gene expressed in the endosperm transfer cells ofmaize. Plant Cell 7: 747–757.
Hueros G, Gomez E, Cheikh N et al. 1999. Identification of a promotersequence from the BETL-1 gene cluster able to confer transfer cell-specific expression in transgenic maize. Plant Physiology121: 1143–1152.
Jennings AC, Morton RK. 1963. Changes in nucleic acids and otherphosphorus-containing compounds of developing wheat grain.Australian Journal of Biological Science 16: 342–351.
Jones HD, Freeman JA, Sparks CA. 2008. A transgenic approach to under-standing gene expression in cereals. In: Molina Cano JL, Christou P,Graner A, et al. eds. Cereal science and technology for feeding tenbillion people: genomics era and beyond. (Options mediterraneennesserie A. Seminaires Mediterraneens, No. 81). EUCARPIA/CIHEAM.
Lamacchia C, Shewry PR, Di Fonzo N et al. 2001. Endosperm specificactivity of a storage protein gene promoter in transgenic wheat seed.Journal of Experimental Botany 52: 243–250.
Lending CR, Chesnut RS, Shaw KL, Larkins BA. 1989.Immunolocalization of avenin and globulin storage proteins in developingendosperm of Avena sativa L. Planta 178: 315–324.
Mares DJ, Norstog K, Stone BA. 1975. Early stages in development of wheatendosperm. I. The change from free nuclear to cellular endosperm.Australian Journal of Botany 23: 311–326.
Mares DJ, Stone BA, Jeffery C, Norstog K. 1977. Early stages in develop-ment of wheat endosperm. II. Ultrastructural observationson cell wall for-mation. Australian Journal of Botany 25: 599–613.
Mills ENC, Parker NL, Wellner N, Toole G, Feeney K, Shewry PR. 2005.Chemical imaging: the distribution of ions and molecules in developingwheat grains. Journal of Cereal Science 43: 193–201.
Mitea C, Havenaar R, Drijfhout JW, Edens L, Dekking L, Koning F. 2008.Efficient degradation of gluten by a prolyl endoprotease in a gastrointes-tinal model: implications for coeliac disease. Gut 57: 25–32.
Morris VH, Alexander TL, Pascoe ED. 1945. Studies of the composition ofthe wheat kernel. I. Distribution of ash and protein in center sections.Cereal Chemistry 22: 351–361.
Tosi et al. — Quantitative and qualitative protein gradients in wheat endosperm34
Dow
nloaded from https://academ
ic.oup.com/aob/article-abstract/108/1/23/99491 by guest on 17 N
ovember 2018

Normand FL, Hogan JT, Deobald HJ. 1965. Protein content of successiveperipheral layers milled from wheat, barley, grain sorghum, and glutinousrice by tangential abrasion. Cereal Chemistry 42: 359.
Okrajkova A, Prieto-Linde ML, Muchova Z, Johansson E. 2007. Proteinconcentration and composition in wheat flour mills streams CerealResearch Communications 35:119–128.
Olsen OA. 2001. Endosperm development: cellularization and cell fate speci-fication. Annual Review of Plant Molecular Biology 52: 233–267.
Olsen O. 2004. Nuclear endosperm development in cereals and Arabidopsisthaliana. The Plant Cell 16: s214–s227.
Olsen OA, Jakobsen KS, Schmelzer E. 1990. Development of barley aleur-one cells: temporal and spatial patterns of accumulation of cell-specificmRNAs. Planta 181: 462–466.
Opsahl-Ferstad HG, Le Deunff E, Dumas C, Rogowsky PM. 1997. ZmEsr,a novel endosperm-specific gene expressed in a restricted region aroundthe maize embryo. Plant Journal 12: 235–246.
Parker ML. 1980. Protein body inclusions in developing wheat endosperm.Annals of Botany 46: 29–36.
Parker ML. 1982. Protein accumulation in the developing endosperm of ahigh protein line of Triticum dicoccoides. Plant Cell and Environment5: 37–43.
Piston F, Marin S, Hernando A, Barro F. 2009. Analysis of the activity of ag-gliadin promoter in transgenic wheat and characterization of gliadinsynthesis in wheat by MALDI-TOF during grain development.Molecular Breeding 23: 655–667.
Rubin R, Levanony H, Galili G. 1992. Evidence for the presence of twodifferent types of protein bodies in wheat endosperm. Plant Physiology99: 718–724.
Sandstedt RM. 1946. Photomicrographic studies of wheatstarch. 1. Development of the starch granules. Cereal Chemistry 23:337–359.
Shewry PR, Halford NG. 2002. Cereal seed storage proteins: structures, prop-erties and role in grain utilization. Journal of Experimental Botany 53:947–958.
Shewry PR, Price J, Tatham AS et al. 1993. Spatial patterns of hordein dis-tribution in relation to barley malting quality. Aspects of Applied Biology36: 43–49.
Shewry PR, Brennan C, Tatham AS et al. 1996. The development, structureand composition of the barley grain in relation to its end use properties.
In: Cereals 96. Proceedings of the 46th Australian Cereal ChemistryConference, Sydney, September 1996, 158–162.
Shewry PR, Underwood C, Wan Y et al. 2009. Storage product synthesis andaccumulation in developing grains of wheat. Journal Cereal Science 50:106–112.
Sorensen MB, Cameron-Mills V, Brandt A. 1989. Transcriptional and post-transcriptional regulation of gene expression in developing barley endo-sperm. Molecular and General Genetics 217: 195–201.
Stoger E, Parker M, Christou P, Casey R. 2001. Pea legumin overexpressedin wheat endosperm assembles into an ordered paracrystalline matrix.Plant Physiology 125: 1732–1742.
Tatham AS, Shewry PR. 1985. The conformation of wheat gluten proteins.The secondary structures and thermal stabilities of a, b, g and v gliadins.Journal of Cereal Science 3: 103–113.
Tecsi L, Darlington HF, Harris N, Shewry PR. 2000. Patterns of proteindeposition and distribution in developing and mature barley grain. In:Barley Genetics, VIII. Proceedings of the 8th International BarleyGenetic Symposium, Adelaide, Australia, Vol. 2, 226–268.
Tosi P, D’Ovidio R, Napier J, Bekes F, Shewry PR. 2004. Expression ofepitope-tagged LMW glutenin subunits in the starchy endosperm of trans-genic wheat and their incorporation into glutenin polymers. Theoreticaland Applied Genetics 108: 468–476.
Tosi P, Parker M, Carzaniga R, Martin B, Gritsch CS, Shewry PR. 2009.Trafficking of storage proteins in developing grain of wheat. Journal ofExperimental Botany 60: 979–991.
Ugalde TD, Jenner CF. 1990a. Substrate gradients and regional patternsof dry matter deposition within developing wheatendosperm. I. Carbohydrates. Australian Journal of Plant Physiology17: 693–704.
Ugalde TD, Jenner CF. 1990b. Substrate gradients and regional patterns ofdry matter deposition within developing wheat endosperm. II. Aminoacids and protein. Australian Journal of Plant Physiology 17: 693–704.
Yahata E, Maruyama-Funatsuki W, Nishio Z et al. 2006. Relationshipbetween the dough quality and content of specific glutenin proteins inwheat mill streams and its application to making flour suitable forinstant chinese noodles. Bioscience Biotechnology and Biochemistry 70:788–797.
Young TE, Gallie DR. 1999. Analysis of programmed cell death in wheatendosperm reveals differences in endosperm development betweencereals. Plant Molecular Biology 39: 915–926.
Tosi et al. — Quantitative and qualitative protein gradients in wheat endosperm 35
Dow
nloaded from https://academ
ic.oup.com/aob/article-abstract/108/1/23/99491 by guest on 17 N
ovember 2018