distributed energy resources at bonneville power - … · distributed energy resources at...
TRANSCRIPT

Distributed Energy Resources at Bonneville Power Utility Brown Bag Presentation
October 20, 2016

B O N N E V I L L E P O W E R A D M I N I S T R A T I O N
Click to edit Master title style
2
• Define Distributed Energy Resources • Research drivers and plans • BPA Experience • Review current portfolio • How to participate
Overview

B O N N E V I L L E P O W E R A D M I N I S T R A T I O N
Distributed Energy Resources: What does that mean?
B O N N E V I L L E P O W E R A D M I N I S T R A T I O N
Click to edit Master title style
4
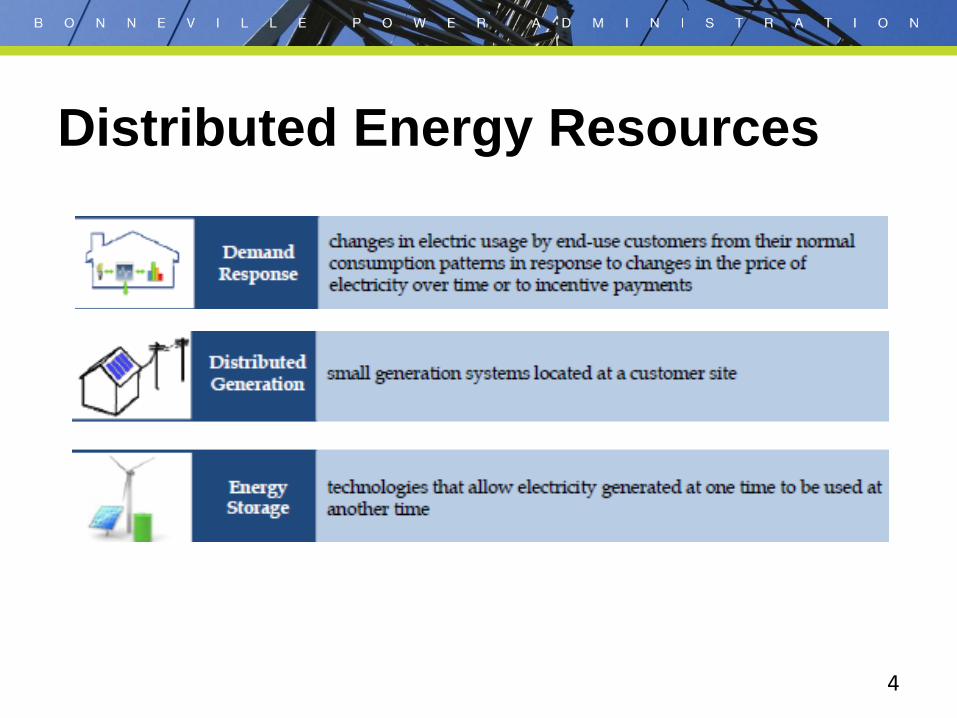
Distributed Energy Resources
B O N N E V I L L E P O W E R A D M I N I S T R A T I O N
Click to edit Master title style
5
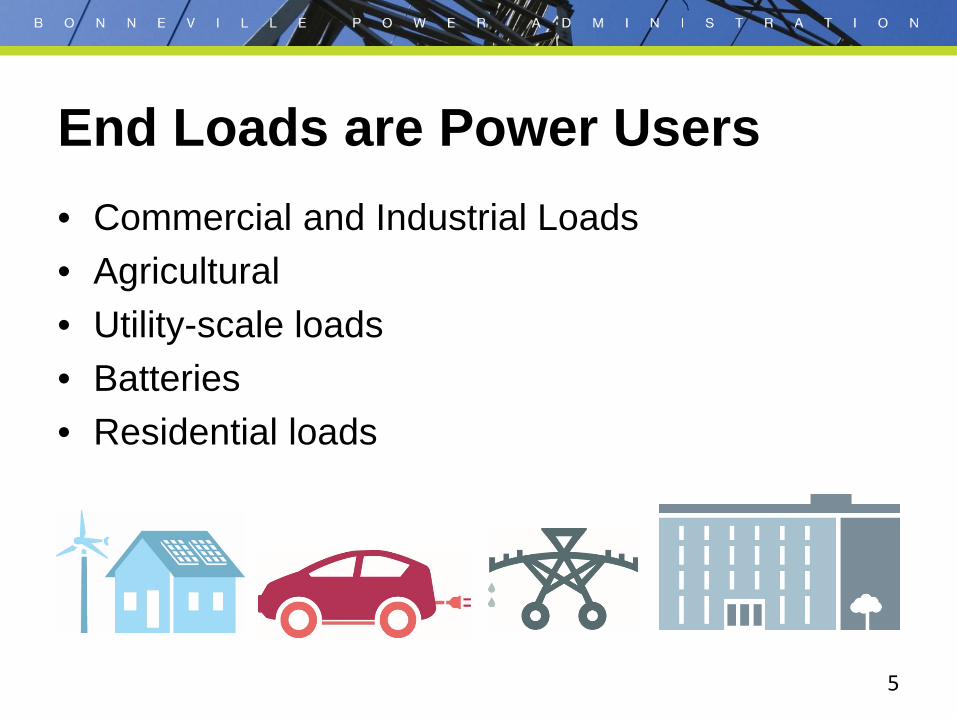
• Commercial and Industrial Loads • Agricultural • Utility-scale loads • Batteries • Residential loads
End Loads are Power Users
B O N N E V I L L E P O W E R A D M I N I S T R A T I O N
Click to edit Master title style
6
• Program types – Direct load control – Aggregator-controlled loads
• Mechanism – Manual: humans initiate load adjustments – Automated: one or two way systems initiate load
adjustments – Transactive: two way systems negotiate pricing
before initiating load adjustments
Communicating with End Loads

B O N N E V I L L E P O W E R A D M I N I S T R A T I O N
Click to edit Master title style
7
Includes DR, Distributed Energy, Storage
• Resource Planning • Non-wires Congestion Solutions • Energy Efficiency collaboration
DER Integration Points
B O N N E V I L L E P O W E R A D M I N I S T R A T I O N
Click to edit Master title style
8
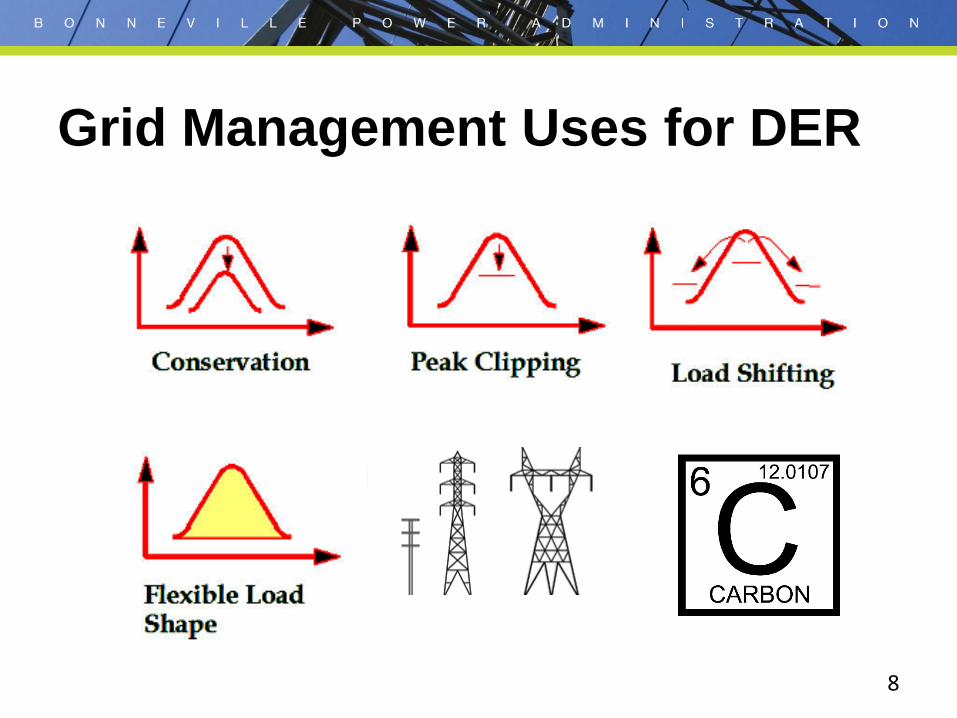
Grid Management Uses for DER

B O N N E V I L L E P O W E R A D M I N I S T R A T I O N
Click to edit Master title style
9
• BPA balances the difference between scheduled and actual variable renewable energy primarily with hydropower generated at Federal dams
• Flexible capacity available from the federal dams is limited
• BPA has started acquiring supplemental capacity for generation imbalance
Integrating Renewables & Storage
B O N N E V I L L E P O W E R A D M I N I S T R A T I O N
Click to edit Master title style
10
• Smart Grid and the Internet of Things – Automated, two-way communications are hallmark – Can enable DER in innovative new ways
• Transactive Energy
– Automated pricing negotiation for services – Could someday improve participation and satisfaction
Related to DER
B O N N E V I L L E P O W E R A D M I N I S T R A T I O N
Research Drivers and Plans for DER

B O N N E V I L L E P O W E R A D M I N I S T R A T I O N
Click to edit Master title style
12
Demand Response Benchmarking 70,000 residential EWHs: Buy cheap power overnight from MISO while charging interactive EWHs to sell that energy during the day for economic benefit
~3000 MW of residential load control through the use of simple switch, one way communication
Using preferred resource DER (solar/PV, DR and storage, EE) to shave peak in Orange County to compensate for a retired nuclear plant
CPUC: Evaluation/review process of DR/DER/EE resources before considering any transmission line builds. Non-wires is now always the base case, default option
~20 & ~40 MW non-wires projects currently in development
Pacificorp
Idaho Power
CAISO LBNL
Duke Energy
Great River Energy
PJM
ISO - NE
Central Maine Power
TVA SCE
PG&E
CPS
Public Benchmarking Report will be issued in April 2016.
All resources, generation and demand, are treated equal when bidding into the market
400 MW of
residential A/C
2 Million Water
Heaters Program

B O N N E V I L L E P O W E R A D M I N I S T R A T I O N
Click to edit Master title style
13
Source: FERC Assessment of Demand Response and Advanced Metering, Staff Report. December 2014. Excludes distributed generation and storage, nor does it show 6,000 MW of DR in Canada.. Enrollment amounts over 1 GW shown on map only.
WECC
MRO
SERC FRCC
RFC
2.3 GW
2.1 GW
10.3 GW
10.4 GW
1.2 GW
2.4 GW
4.6 GW
4.2 GW
8.4 GW
1.9 GW
5.3 GW
1.5 GW
SPP
= Enrolled Wholesale DR (ISO/RTO)
= Enrolled Retail DR by NERC sub region
55,000 MW of DR Across the U.S. (6% of peak)

B O N N E V I L L E P O W E R A D M I N I S T R A T I O N
Click to edit Master title style
14
Demand Response Market is Changing
Then Now One-Way/Simple communications Technology explosion
One asset, one revenue stream
One asset, multiple revenue streams
Peak shaving Peak shaving Balancing Regulation Economic Arbitrage Load Shift Oversupply
Demand Response Distributed Energy Resources
6th Power Plan discusses DR R&D 7th Plan has MW Expectations

B O N N E V I L L E P O W E R A D M I N I S T R A T I O N
Click to edit Master title style
15
• Multi-year contracts needed (3-5 years at least initially; TVA did a 10 year contract).
• A market needs to be “seeded”. PJM wrote rules looser to build its market and attract entrants, and just now is tightening standards.
• Residential should not be underestimated as a viable source. 70% of BPA’s Load is Residential.
• Simple devices are often more cost effective than complicated technologies.
• Trend is to integrate demand-side as a standard part of resource planning (e.g. Pacificorp and PG&E).
• Demand Response is used widely for economic benefit, not just reliability.
Lessons from National Efforts

B O N N E V I L L E P O W E R A D M I N I S T R A T I O N
Click to edit Master title style
16
Planning The Future of DR

B O N N E V I L L E P O W E R A D M I N I S T R A T I O N
Click to edit Master title style
17
• Supply Constraints • Transmission
Opportunities & Cost of Wires Projects
• Integrating Renewables • Utility interest • 7th Power Plan
Drivers for DER at BPA The hydro system has been stretched to its physical margin,” Mainzer said. “Our task is to bring new and cost-effective, flexible capacity from outside of the hydro system.”
Elliot Mainzer Keynote speech, National Conference (Oct 2013)
Zone of Load Reduction to Give South of Allston Relief

B O N N E V I L L E P O W E R A D M I N I S T R A T I O N
Click to edit Master title style
18

B O N N E V I L L E P O W E R A D M I N I S T R A T I O N
BPA’s Experience with DER

B O N N E V I L L E P O W E R A D M I N I S T R A T I O N
Click to edit Master title style
20
The History of Demand Response at BPA
• BPA has historically had the advantage of a low-cost, flexible and high capacity hydro system, but has used DR on and off as needs have changed.
B O N N E V I L L E P O W E R A D M I N I S T R A T I O N
Click to edit Master title style
21
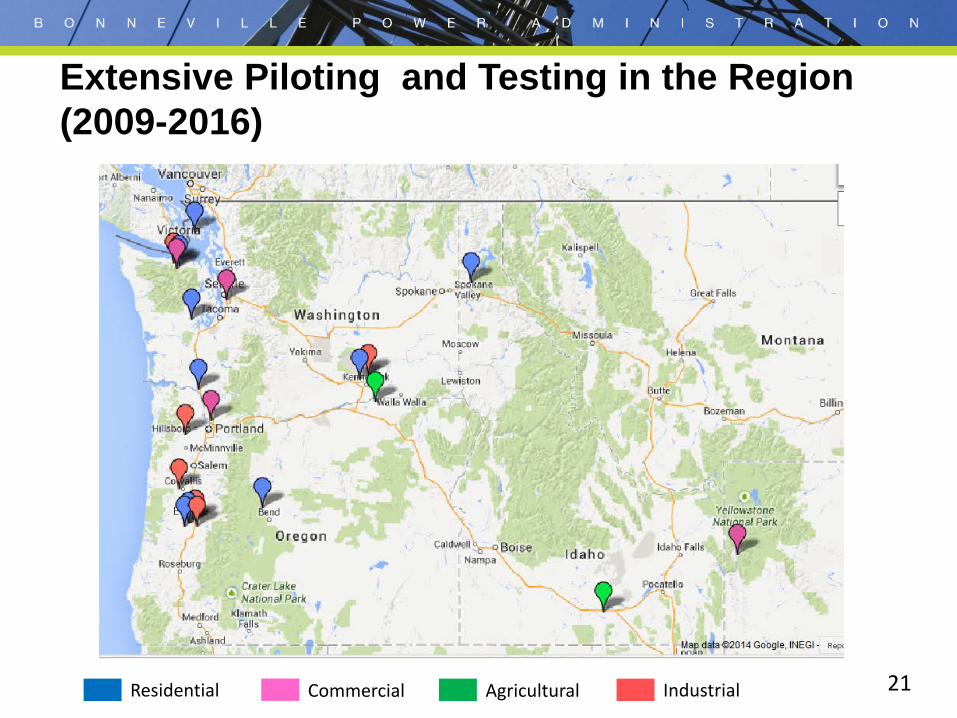
Extensive Piloting and Testing in the Region (2009-2016)
Residential Commercial Agricultural Industrial
B O N N E V I L L E P O W E R A D M I N I S T R A T I O N
Click to edit Master title style
22
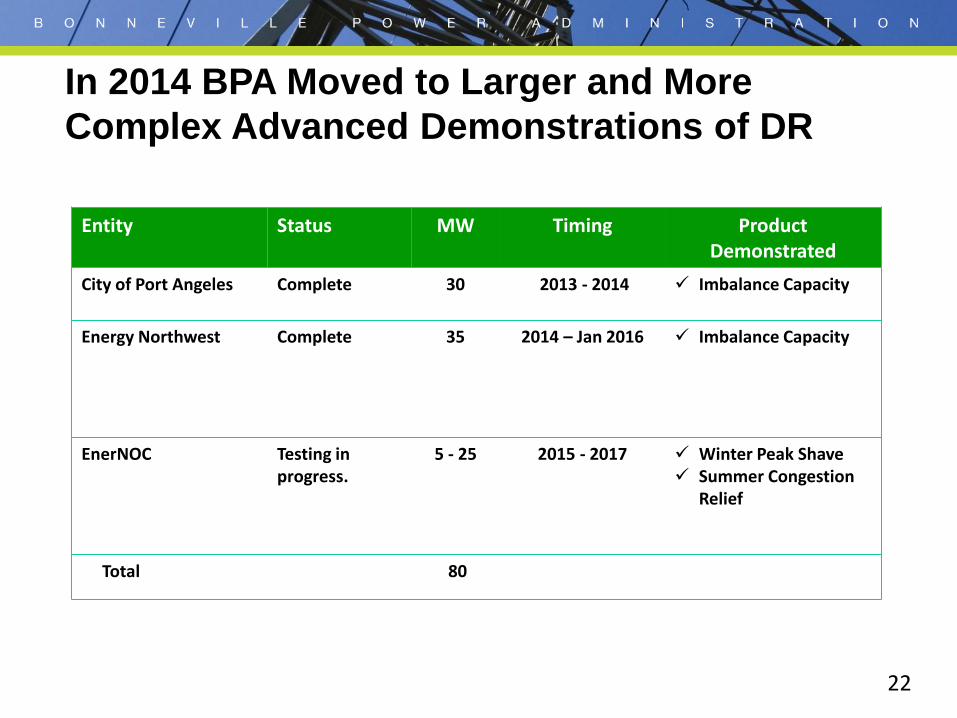
In 2014 BPA Moved to Larger and More Complex Advanced Demonstrations of DR
Entity Status MW Timing Product Demonstrated
City of Port Angeles Complete 30 2013 - 2014 Imbalance Capacity
Energy Northwest
Complete 35 2014 – Jan 2016 Imbalance Capacity
EnerNOC Testing in progress.
5 - 25 2015 - 2017 Winter Peak Shave Summer Congestion
Relief
Total 80

B O N N E V I L L E P O W E R A D M I N I S T R A T I O N
Click to edit Master title style
23
City of Port Angeles and Nippon Paper Demonstration

B O N N E V I L L E P O W E R A D M I N I S T R A T I O N
Click to edit Master title style
24
Performance • 60% success on real-time events • 92% success rate when
prescheduled Learnings • Unpredictable downtimes; timely
communications on outages is key • High reliance on two refiner lines • The plant performed well when
existing load allowed them to do so Portfolio Diversity is essential
Process Storage for Load Shifting City of Port Angeles / Nippon Paper Demonstration

B O N N E V I L L E P O W E R A D M I N I S T R A T I O N
Click to edit Master title style
25
Energy Northwest and BPA Demonstration: Public Aggregation for Public Power Background - Went live February 2015, ended January
2016. - Original nomination was 25MW. - ENW enrolled 35MW, the contractual
cap. - Phased testing: Pre-scheduled to Event
triggered tests (Fall 2015).
Asset Roster - Cowlitz PUD: NORPAC (up to 28 MW). - Pend Oreille PUD: Ponderay Newsprint
(up to 19 MW). - City of Richland: 800 kW Demand
Voltage Reduction. - Powin Battery: 20kW.
Program Pacesetter Award, 2016

B O N N E V I L L E P O W E R A D M I N I S T R A T I O N
Click to edit Master title style
26
Energy Northwest Model Proved Successful
• Performance - 94% with 64 successful events and 4 failures.
• Assets included NORPAC, City of Richland DVR, and a battery all responding on 10 minute notice for up to 90 minutes.
• Performance impressive given operating parameters of “Fast DR”.
94%
6%
Performance Feb 1 - Jan 31st
Success
Fail
123456
Feb
Mar
April
May
June July
Augu
st
Sept
embe
r
Oct
ober
Nov
embe
r
Dece
mbe
r
Janu
ary
Events per Month
Events
B O N N E V I L L E P O W E R A D M I N I S T R A T I O N
Click to edit Master title style
27
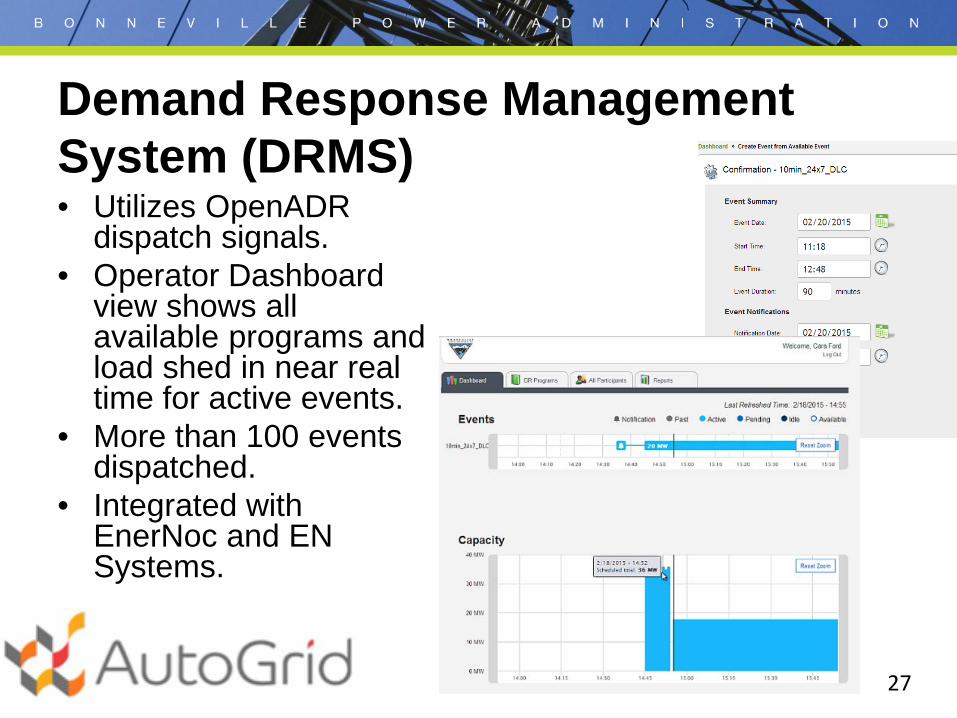
• Utilizes OpenADR dispatch signals.
• Operator Dashboard view shows all available programs and load shed in near real time for active events.
• More than 100 events dispatched.
• Integrated with EnerNoc and EN Systems.
Demand Response Management System (DRMS)

B O N N E V I L L E P O W E R A D M I N I S T R A T I O N
Click to edit Master title style
28
• Powin Energy: The project involves field testing and evaluating a modular, dispatchable 120kW/500kWh battery storage unit at four different sites around the Pacific Northwest – testing at the BPA lab right now
• Primus Energy: Demonstrate how an electric energy storage device placed close to an end-user to provide service similar to demand response, but without need for behavioral change or impact on end users
Battery Storage for Solar Smoothing
B O N N E V I L L E P O W E R A D M I N I S T R A T I O N
Click to edit Master title style
29
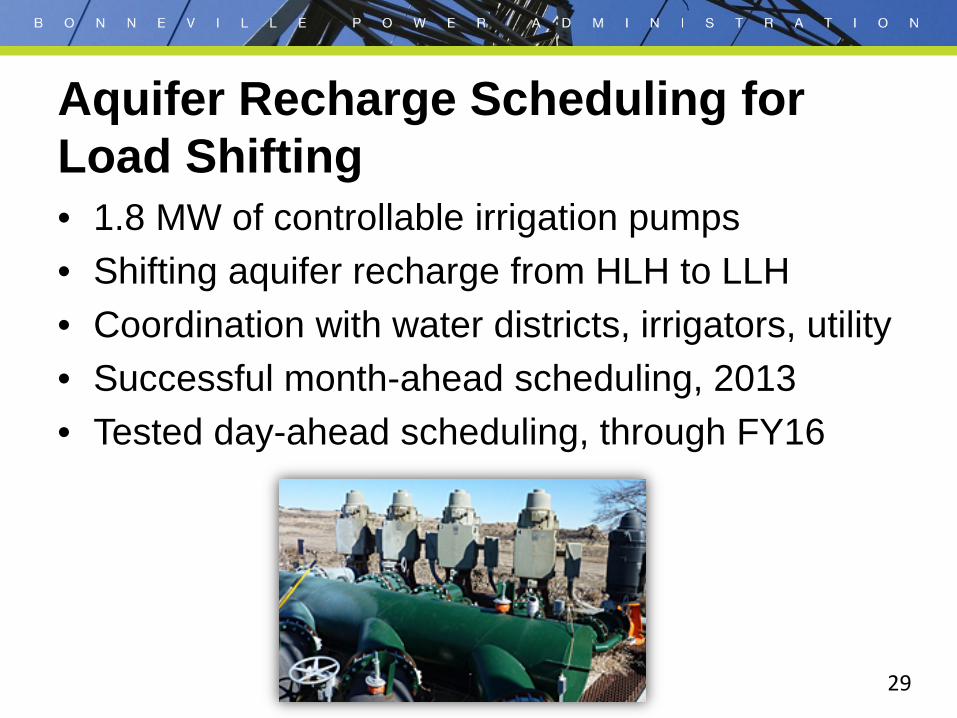
• 1.8 MW of controllable irrigation pumps • Shifting aquifer recharge from HLH to LLH • Coordination with water districts, irrigators, utility • Successful month-ahead scheduling, 2013 • Tested day-ahead scheduling, through FY16
Aquifer Recharge Scheduling for Load Shifting
B O N N E V I L L E P O W E R A D M I N I S T R A T I O N
Click to edit Master title style
30
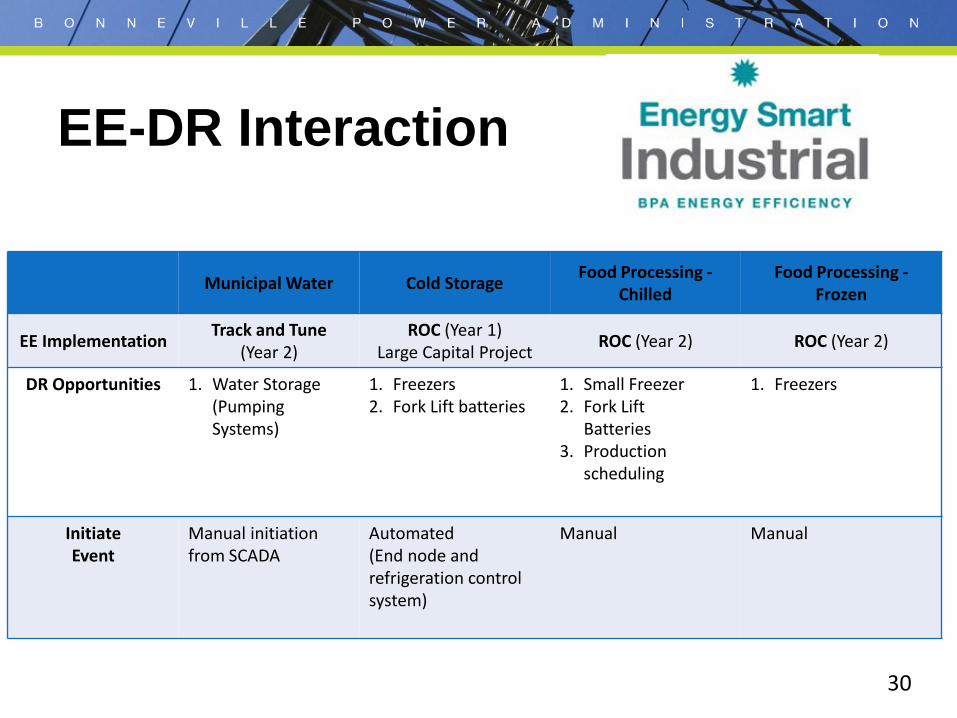
EE-DR Interaction
Municipal Water Cold Storage Food Processing - Chilled
Food Processing - Frozen
EE Implementation Track and Tune (Year 2)
ROC (Year 1) Large Capital Project ROC (Year 2) ROC (Year 2)
DR Opportunities 1. Water Storage (Pumping Systems)
1. Freezers 2. Fork Lift batteries
1. Small Freezer 2. Fork Lift
Batteries 3. Production
scheduling
1. Freezers
Initiate Event
Manual initiation from SCADA
Automated (End node and refrigeration control system)
Manual Manual

B O N N E V I L L E P O W E R A D M I N I S T R A T I O N
Click to edit Master title style
31
• Act as a dispatchable large utility-scale DR resource (>1MW) to increase and decrease load as needed.
• Measure and verify to provide a performance-based approach in developing reliable resources that can be used year-round for ancillary services.
• Tested EE/DR combination
Wastewater Management

B O N N E V I L L E P O W E R A D M I N I S T R A T I O N
Current Project Portfolio: Testing and Demonstrating Programs and Technologies

B O N N E V I L L E P O W E R A D M I N I S T R A T I O N
Click to edit Master title style
33
• Most common DR implementation model
• Peak shave (winter) • Fully enrolled at 13
MW • 22 sites with 7 utilities • Strong performance
on 39 hours of testing
Commercial DR Aggregation

B O N N E V I L L E P O W E R A D M I N I S T R A T I O N
Click to edit Master title style
34
EnerNOC: Reliability Pattern Established, Upcoming Winter will Focus on Multiple BPA Uses
Winter 2016/2017 Goals: Season will focus on having real-time power operations using DR for multiple uses to meet operational triggers determined by real-time operations such as:
Unplanned outages, e.g. CGS, Grand Coulee unit
Near-term capacity constraints
Price triggers based on market energy prices
Winter Season 2015/2016 Results. Events were initially called based on fixed schedules and later by real-time power operations. As operational conditions did not trigger events in Feb-early April, team called rigorous events at end of the April testing season.
56 hours of testing
21 events
95% success rate
Note: Events are contractually successful at 90%+ performance.
Event # Event DateStart Time
End TimeDuration in
minutes
Cumulative Hours of Seasonal Testing
Targeted Participants
Load Shed in MW
Nominated MW
Performance Performance Dispatch
1 12/7/2015 9:00 10:00 60 1.0 16 16.7 9 186% Success DR Team Pre-Schedule2 12/8/2015 18:00 19:00 60 2.0 16 16.3 9 181% Success DR Team Pre-Schedule3 12/16/2015 17:00 20:00 180 5.0 16 20.0 9 222% Success DR Team Pre-Schedule4 12/17/2015 7:00 10:00 180 8.0 16 12.8 9 142% Success DR Team Pre-Schedule5 12/28/2015 17:00 20:00 180 11.0 16 22.3 9 248% Success DR Team Pre-Schedule6 12/28/2015 7:00 10:00 180 14.0 16 16.4 9 182% Success DR Team Pre-Schedule7 12/29/2015 17:00 20:00 180 17.0 16 20.4 9 227% Success DR Team Pre-Schedule8 12/29/2015 7:04 10:00 176 19.9 16 22.2 9 247% Success DR Team Pre-Schedule9 12/30/2015 17:00 20:00 180 22.9 16 21.0 9 233% Success DR Team Pre-Schedule10 12/30/2015 7:00 10:00 180 25.9 16 27.0 9 300% Success DR Team Pre-Schedule11 1/29/2016 18:00 19:30 90 27.4 16 19.5 9 217% Success Operational Dispatch12 4/18/2016 17:00 20:00 180 30.4 23 11.7 13 90% Success Operational Dispatch13 4/19/2016 17:00 20:00 180 33.4 23 14.7 13 113% Success Operational Dispatch14 4/20/2016 18:00 20:00 120 35.4 23 19.5 13 150% Success Operational Dispatch15 4/20/2016 7:00 10:00 180 38.4 23 2.4 13 18% Failure Operational Dispatch16 4/27/2016 17:00 20:00 180 41.4 23 17.4 13 134% Success Operational Dispatch17 4/27/2016 7:30 10:00 150 43.9 23 17.8 13 137% Success Operational Dispatch18 4/28/2016 17:00 20:00 180 46.9 23 16.0 13 123% Success Operational Dispatch19 4/28/2016 7:00 10:00 180 49.9 23 14.1 13 108% Success Operational Dispatch20 4/29/2016 17:45 20:00 135 52.2 23 15.3 13 118% Success Operational Dispatch21 4/29/2016 7:00 10:00 180 55.2 23 14.6 13 112% Success Operational Dispatch

B O N N E V I L L E P O W E R A D M I N I S T R A T I O N
Click to edit Master title style
35
Context • BPA operates ~75% of the high
voltage transmission in the PNW • BPA serves 490 transmission
customers • Transmission flowgates are areas
where transmission lines group, and can become congested
• Transmission line construction costs and time requirements have increased.
Problem
Transmission Congestion Demo
Red lines represent flowgates
The N-S flowgate South of the Allston substation is facing congestion issues.
B O N N E V I L L E P O W E R A D M I N I S T R A T I O N
Click to edit Master title style
36
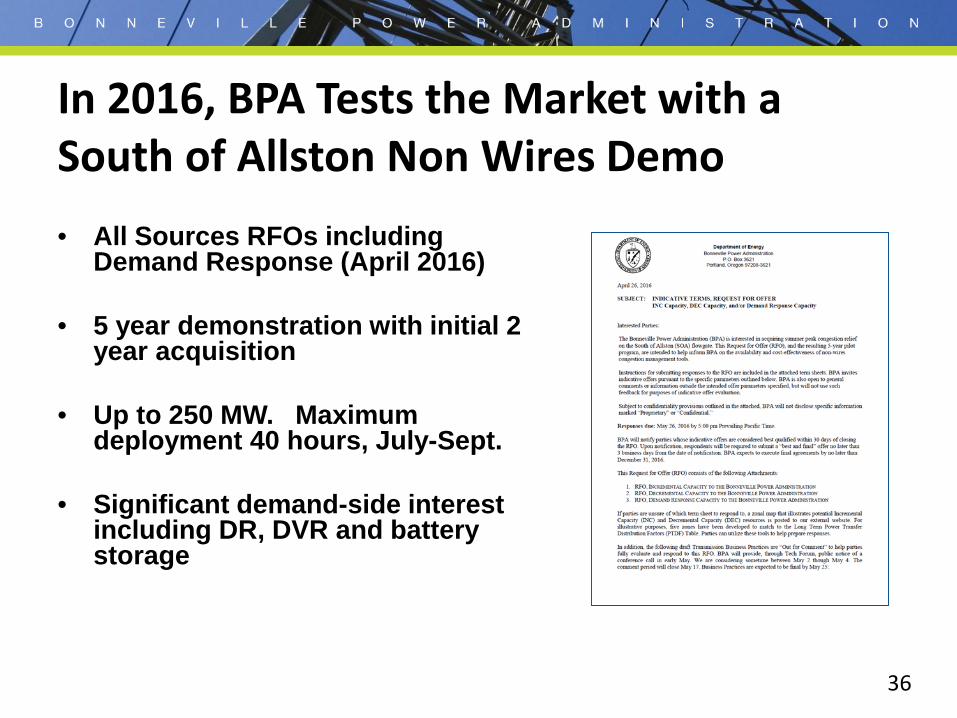
• All Sources RFOs including
Demand Response (April 2016)
• 5 year demonstration with initial 2 year acquisition
• Up to 250 MW. Maximum deployment 40 hours, July-Sept.
• Significant demand-side interest including DR, DVR and battery storage
In 2016, BPA Tests the Market with a South of Allston Non Wires Demo
B O N N E V I L L E P O W E R A D M I N I S T R A T I O N
Click to edit Master title style
37
• 5kW/home DR capacity, over 90% reliable and available • Prediction from individual homes, day/hour/minute • Guaranteed comfort and improved energy savings • Optimal scheduling of home appliances based on user
preferences and DR requests • Cyber secure DR delivered by CIP-compliant systems
Home Management Battery: EE & DR

B O N N E V I L L E P O W E R A D M I N I S T R A T I O N
Click to edit Master title style
38
Questions to Address • What flexibility services can be provided to the grid? • Can useful services be affordable? • How does location affect impact? • How can batteries support hydro, considering the growth of
wind, solar, and distributed generation? • Can batteries be used for firming wind or solar power? • Which strategies can minimize renewable curtailment and
greenhouse gas emissions, maintaining reliability and reducing costs?
Three, Primary Challenges • How to realize the full revenue opportunities consistent
with the value energy storage can provide? • How to reduce cost of interconnection and ongoing
operations? • How to increase certainty regarding processes and
timelines?
Final Report available late 2018
Utility-Scale Batteries
B O N N E V I L L E P O W E R A D M I N I S T R A T I O N
Click to edit Master title style
39
• Protocol for requesting use of distribution-level ES and DR resources to support BPA’s transmission operations
• Software to enable communications between BPA and the distribution utilities it serves
• Transmission level “energy positioning” algorithms to most effectively use ES and DR resources
• Simulated real-world testing and refinement of the system using SnoPUD’s deployed assets
MW Scale Battery Integration
B O N N E V I L L E P O W E R A D M I N I S T R A T I O N
Click to edit Master title style
40
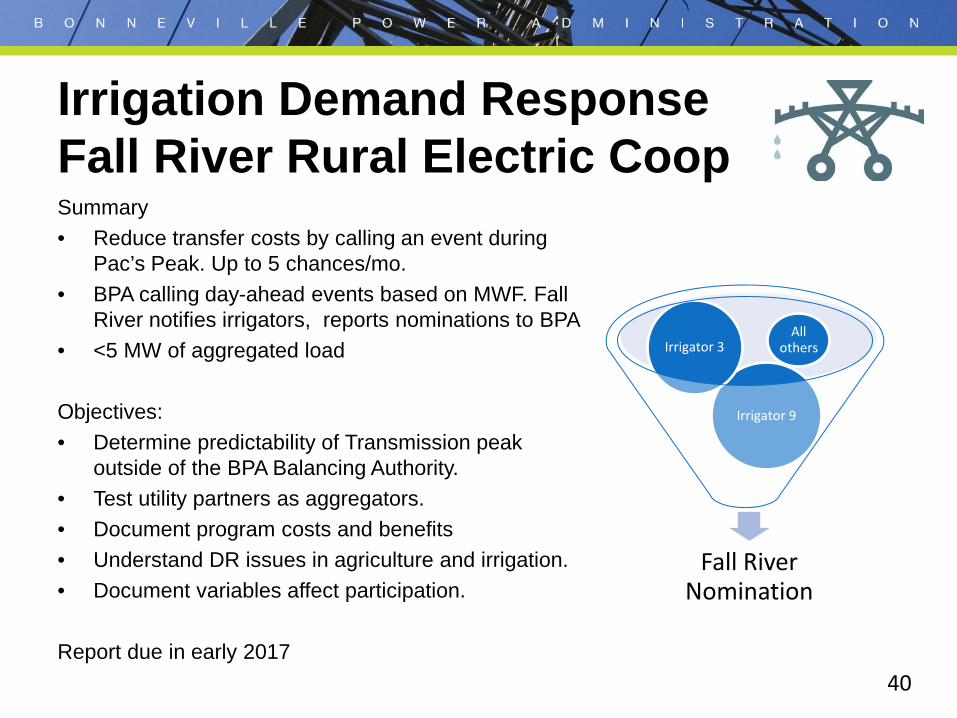
Summary • Reduce transfer costs by calling an event during
Pac’s Peak. Up to 5 chances/mo. • BPA calling day-ahead events based on MWF. Fall
River notifies irrigators, reports nominations to BPA • <5 MW of aggregated load Objectives: • Determine predictability of Transmission peak
outside of the BPA Balancing Authority. • Test utility partners as aggregators. • Document program costs and benefits • Understand DR issues in agriculture and irrigation. • Document variables affect participation. Report due in early 2017
Irrigation Demand Response Fall River Rural Electric Coop
Fall River Nomination
Irrigator 9
Irrigator 3 All
others

B O N N E V I L L E P O W E R A D M I N I S T R A T I O N
Click to edit Master title style
41
• Reduce distribution voltage in response to DR events
• Voltage factors differ by load types
• Tested with KEC (2014) and City of Richland (2015)
• Investigating use to address real BPA needs with several utility partners
Demand Voltage Reduction

B O N N E V I L L E P O W E R A D M I N I S T R A T I O N
Click to edit Master title style
42
CEA-2045 • OEM DR equipment • Communications
CO2 HPWH • Responsiveness • Recovery • Customer Satisfaction
Residential Water Heating

B O N N E V I L L E P O W E R A D M I N I S T R A T I O N
Click to edit Master title style
43
Identify
• Residential DR • BYOD • DVR
Test & Evaluate
• Batteries • Energy NW • EnerNoc
Document Use Case and
Commercialization Plan
• Irrigation DR • DRMS
Transition To
Operations
Preparing for Operational Use

B O N N E V I L L E P O W E R A D M I N I S T R A T I O N
Click to edit Master title style
44
• Some loads look cost-effective, available, predictable, and reliable!
• DER can address multiple regional needs • Portfolio Diversity is critical • Robust systems & data management required • Operations requires it to be easy, available, reliable
• Utility collaboration is a key success factor
• Residential should not be underestimated
Lessons We’ve Learned
B O N N E V I L L E P O W E R A D M I N I S T R A T I O N
For more information or to participate:
Lee Hall Distributed Energy Resources Manager
503-230-5189 [email protected]