distinct roles for motor cortical and thalamic inputs to ...lesions35, suggests the possibility that...
TRANSCRIPT

Distinct roles for motor cortical and thalamic inputs to striatum during motor learning and execution
Steffen B. E. Wolff1, Raymond Ko1 and Bence P. Ölveczky1
1. Department of Organismic and Evolutionary Biology and Center for Brain Science, Harvard University, Cambridge MA 02138, USA
Abstract
The acquisition and execution of learned motor sequences are mediated by a distributed motor
network, spanning cortical and subcortical brain areas. The sensorimotor striatum is an
important cog in this network, yet how its two main inputs, from motor cortex and thalamus
respectively, contribute to its role in motor learning and execution remains largely unknown. To
address this, we trained rats in a task that produces highly stereotyped and idiosyncratic motor
sequences. We found that motor cortical input to the sensorimotor striatum is critical for the
learning process, but after the behaviors were consolidated, this corticostriatal pathway became
dispensable. Functional silencing of striatal-projecting thalamic neurons, however, disrupted the
execution of the learned motor sequences, causing rats to revert to behaviors produced early in
learning and preventing them from re-learning the task. These results show that the
sensorimotor striatum is a conduit through which motor cortical inputs can drive experience-
dependent changes in subcortical motor circuits, likely at thalamostriatal synapses.
Introduction
Whether tying our shoelaces or hitting a volleyball serve, we rely on our brain’s ability to learn
and reliably generate stereotyped task-specific motor sequences. These processes depend on
the interplay between cortical and subcortical brain areas, many of which have been identified
(Fig. 1A)1,2. Yet, the specific roles of the different circuits and how they interact during motor
sequence learning and execution is less well understood1–3. The striatum, the main input
nucleus of the basal ganglia (BG), is an important nexus in the distributed mammalian motor
control network, and one through which cortical and subcortical circuits can interact4–8. Its
sensorimotor arm (dorsolateral striatum in rodents – DLS) receives excitatory input from
sensorimotor cortex and thalamus. Striatal spiny projection neurons (SPNs), through their
actions on BG output nuclei, can influence motor control at two levels (Fig. 1A). They can
.CC-BY-NC-ND 4.0 International licenseis made available under aThe copyright holder for this preprint (which was not peer-reviewed) is the author/funder. It. https://doi.org/10.1101/825810doi: bioRxiv preprint

modulate motor cortical activity via the BG-thalamo-cortical pathway4,9,10, and further influence
brainstem and midbrain motor circuits via direct projections from BG output nuclei (Fig. 1A)4,11–
17.
While the involvement of the DLS in motor learning has been extensively probed18–23, its specific
contributions, and especially how the inputs from motor cortex and thalamus enable these,
remain poorly understood (though see companion paper11 and further references24–30). A
common assumption, however, is that synaptic modifications at motor cortical inputs to the
striatum play a role in memory storage23,27,31–34. Yet, the generality of this notion has been
challenged by a recent study, showing that striatum is required for generating learned motor
sequences that survive large bilateral motor cortex lesions11. Interestingly, the very same motor
skills that can be executed without motor cortex, cannot be acquired without it35, suggesting a
role for motor cortex in learning that is independent of its role in control. This raises the
possibility that motor cortical inputs to striatum, rather than storing crucial aspects of the
memory, guide learning-related plasticity in the subcortical motor network, possibly at non-motor
cortex related synapses within the striatum36. Alternatively, motor cortex could exert its influence
over the learning process by regulating plasticity in its other projection targets, such as the
midbrain, brainstem and/or spinal circuits37–47.
If learning-related changes occur within the DLS but not at motor cortical inputs, it would
suggest plasticity at DLS’s other main input – that from thalamus – as a possible mechanism for
learning (Fig. 1A)48–52. DLS receives input mainly from the parafascicular nucleus (Pf) and the
rostral intralaminar nuclei (rILN) of the thalamus49,51–54, nuclei which relay information
predominantly from subcortical circuits49,52,55. While the inputs from thalamus to the striatum are
comparable in strength24,29,30 and numbers to inputs from cortex56,57, surprisingly little is known
about their function. The thalamostriatal projection has been implicated in modulating activity of
cortical inputs to striatum via cholinergic interneurons (Fig. 1A), in the regulation of attention and
behavioral flexibility, and in providing information to the BG about behavioral state and context
for rapid behavioral adaptations58–64. Yet, whether they play a more direct role in motor learning
and execution remains unclear.
The aim of this study is to elucidate how motor cortical and thalamic inputs to the striatum
contribute to the acquisition and control of learned motor skills. To probe this, we take
advantage of a paradigm that trains highly stereotyped and task-specific motor sequences in
rats (Fig. 1B)35. As alluded to above, these motor skills, once learned and consolidated, are
.CC-BY-NC-ND 4.0 International licenseis made available under aThe copyright holder for this preprint (which was not peer-reviewed) is the author/funder. It. https://doi.org/10.1101/825810doi: bioRxiv preprint

contingent on DLS but not on motor cortex11,35. Using a variety of targeted circuit manipulations,
we show that the DLS and the motor cortical neurons that project to it, are required for learning
the behaviors we train. We also find that synaptic changes in the DLS are an essential part of
the underlying motor memory, and that thalamic neurons projecting to the DLS are necessary
for executing the learned motor sequences. These results provide important new insights into
how the interplay between motor cortex, thalamus and striatum underlies the acquisition and
production of learned motor sequences.
Results
Learning of complex motor sequences requires the DLS, but not the DMS
The task we used in this study trains highly stereotyped motor sequences, that once learned are
stably expressed over long periods of time35. We know that motor cortex is essential for learning
the skills that emerge in our task, but not for executing them once acquired35. We recently
showed that DLS is an essential part of the subcortical motor network that generates the
learned skill11. However, whether DLS is obligatory for the learning process remains an open
question. For example, removal of DLS prior to learning could prompt other parts of the motor
system, including cortex itself, to ‘take over’ and cover for the DLS. Several studies, employing
different learning paradigms than ours, have also suggested that the dorsomedial striatum
(DMS), and its cortical input from prefrontal regions5,6,65, are essential for early learning23,66–70.
The idea is that control is gradually ‘transferred’ from DMS to DLS as the animal’s behavior
becomes increasingly ‘automatized’18,20,22,23,27,33,68,70–73.
To directly probe the contributions of DMS and DLS to learning the motor sequences acquired
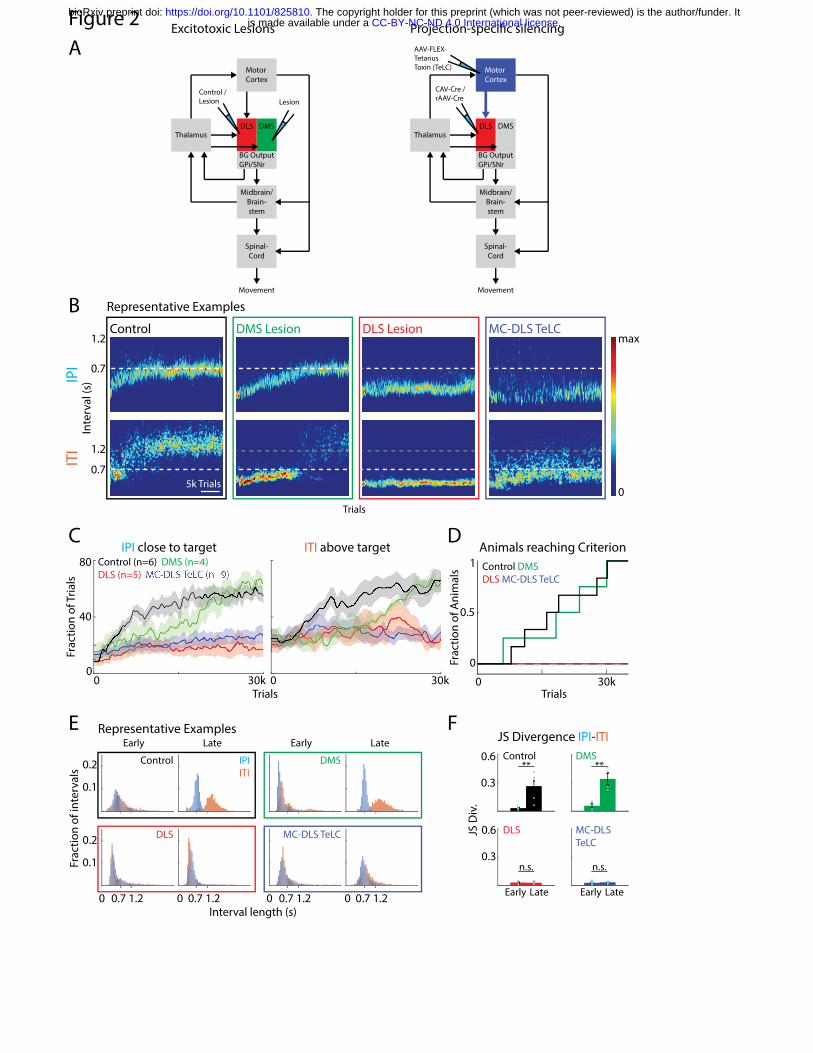
in our task, we performed excitotoxic lesions of either region in naïve animals (Fig. 2A, S1). The
lesioned rats were then placed in our automated training system74 and trained using our
standard protocol, which rewards animals with a drop of water for pressing a lever twice
separated by a specific time interval (inter-press interval (IPI); target: 700 ms) (Fig. 1B)35. We
compared the performance of lesioned animals to a cohort receiving DLS-targeted control
injections (retrobeads or GFP-expressing AAVs; Methods). Control animals learned, over weeks
of training, to produce IPIs around the prescribed 700 ms target with increasing precision (Fig
2B-C, S2B). Consistent with prior studies, the control animals ‘solved’ the task by developing
complex, idiosyncratic, and spatiotemporally precise motor sequences (Fig. 2B-D)11,35. After
.CC-BY-NC-ND 4.0 International licenseis made available under aThe copyright holder for this preprint (which was not peer-reviewed) is the author/funder. It. https://doi.org/10.1101/825810doi: bioRxiv preprint

unsuccessful trials, they additionally learned to withhold lever-pressing for 1.2 s (inter-trial
interval or ITI), a requirement for initiating a new trial (Methods, Figs. 1B, 2B-C, S2B)35. All
control animals reached our performance criteria for mastering the task in less than 30,000 trials
(mean IPI within +/- 10% of target (700 ms) and CV of the IPI distribution below 0.25, Figs. 2D,
S2B). DMS-lesioned animals reached these criteria after a similar number of training trials as
control animals (19.494 +/- 10.208 (DMS) vs. 18.620 +/- 8.9141 (control) trials (mean +/- SD);
Figs. 2B-D, S2B). We note that the performances of DMS-lesioned animals were slightly worse
in the initial phases of learning, consistent with previous reports about a role of the DMS in early
phases of rotarod learning23,75. Nevertheless, DMS-lesioned animals reached criterion at the
same time as control animals, suggesting that the DMS is not essential for learning our task.
In stark contrast, none of the DLS-lesioned animals reached criterion performance in our task
after 30,000 trials (Fig. 2B-D). A subset of animals for which training was extended for more
than 60,000 trials also failed to reach our pre-specified criteria (Fig. S2C). Furthermore, while
both control and DMS-lesioned animals learned the distinction between the IPI and ITI (Fig.
2E,F), DLS-lesioned animals did not distinguish between these intervals as indicated by
overlapping IPI and ITI distributions (Fig. 2E,F). Together, our results show that the DLS, but not
the DMS, is necessary for learning the task-specific motor sequences required to master our
task and/or the strategy to deal with the underlying task structure.
Learning requires motor cortex input to the DLS
Our finding that DLS-lesioned animals have learning deficits similar to animals with motor cortex
lesions35, suggests the possibility that motor cortex informs learning-related plasticity in
subcortical control circuits through its projections to the DLS. Motor cortical projections to
control circuits in the midbrain and brainstem, which feed back to the DLS through the thalamus,
provide a plausible alternative (Fig 1A)12,14,16,40,44,76,77. To more directly address the role of
corticostriatal projections in learning, we used an intersectional viral approach (Fig. 2A)78 to
silence DLS-projecting motor cortex neurons in naïve (untrained) animals. We injected
retrogradely transported viruses expressing Cre-recombinase – either canine adenovirus type 2
(CAV-2)79 or retrogradely transported AAV (rAAV)80 – into the DLS. In addition, we injected a
locally infecting adeno-associated viral vector (AAV), conditionally co-expressing Tetanus Toxin
Light Chain (TeLC)81–83 and GFP in a Cre-dependent manner into motor cortex. TeLC cleaves
the synaptic protein VAMP2 and thereby prevents the fusion of synaptic vesicles to the
membrane and the release of neurotransmitters, effectively silencing neuronal output without
.CC-BY-NC-ND 4.0 International licenseis made available under aThe copyright holder for this preprint (which was not peer-reviewed) is the author/funder. It. https://doi.org/10.1101/825810doi: bioRxiv preprint

killing the cells81,84. Our two-component viral approach restricts the expression of TeLC to motor
cortex neurons with axon terminals in the DLS. By comparing the number of infected neurons in
motor cortex with the number of neurons labeled by retrobeads co-injected into the DLS, we
estimated our silencing rate to be about 50% of all DLS-projecting neurons in the infected parts
of motor cortex (Methods). We used this approach to silence neurons in motor cortex that
project to the DLS in a cohort of naïve animals (MC-DLS TeLC). Similar to DLS- (Fig. 2B-D) and
motor cortex-lesioned animals35, MC-DLS TeLC animals failed to learn the task (Fig. 2B-D).
They did not reach the learning criteria for the IPI within 30,000 trials (Figs. 2D, S2B), with a
subset of animals undergoing extended training and not reaching the criteria after 60,000 trials
(Fig. S2C). MC-DLS animals further failed to develop a distinction between IPI and ITI intervals
(Fig. 2D-F). Together, these results show that motor cortex-originating corticostriatal neurons
are necessary for learning the task-specific motor sequences we train, consistent with motor
cortex guiding, or otherwise enabling, plasticity in subcortical motor circuits through direct
projections to the DLS.
Reversal of long-term synaptic plasticity in DLS disrupts performance
Once animals learn the stereotyped motor sequences required for our task, they are expressed
in largely unaltered form over long periods of time35, suggesting the formation of stable
memories. While prior studies have suggested that motor memories are stored in motor
cortex85–95 and/or at synapses between motor cortex and striatum23,27,31,32,34, neither of these
neural substrates are required for executing the behaviors we train11,35. The crucial involvement
of the DLS in both motor sequence learning (Fig. 2) and execution11 suggest the possibility that
the memory is stored, in part at least, at synapses in the DLS distinct from those formed by
motor cortical inputs.
To address this, we took advantage of a pharmacological approach that reverses plastic
changes at recently potentiated excitatory synapses, effectively erasing locally stored memory
traces96–101. This approach relies on inhibiting the enzyme PKMzeta, which is crucial for
maintaining synaptic potentiation98,99,101. Injection of its artificial inhibitor, ZIP, leads to synaptic
depotentiation and degradation of learned behaviors contingent on plasticity in the targeted
structure33,96–99,102. Skilled reaching, for example, is a dexterous and motor cortex-dependent
behavior that is ‘unlearned’ after ZIP is injected into motor cortex85,88. Using this approach, we
can pinpoint circuit elements that undergo task-relevant synaptic plasticity during learning and
thus store some aspect of the memory necessary for executing the acquired motor sequences.
.CC-BY-NC-ND 4.0 International licenseis made available under aThe copyright holder for this preprint (which was not peer-reviewed) is the author/funder. It. https://doi.org/10.1101/825810doi: bioRxiv preprint

To test whether the DLS is indeed a site of task-specific memory formation, we injected ZIP into
this structure in expert animals (Figs. 3A, S3). We compared the outcome with ZIP injections
into either motor cortex or the DMS (Figs. 3A, S3), neither of which is required for executing the
learned motor sequences we train in our task11,35 and therefore not expected to store critical
memories.
As expected, ZIP injections into motor cortex and the DMS did not affect task performance of
expert animals beyond transient dips related to the effects of surgery (Figs. 3B,D, S4B).
Performance measures and IPI and ITI distributions were similar to pre-ZIP training sessions in
both cases (Figs. 3B-E, S4B). In contrast, ZIP injections into the DLS disrupted performance
(Figs. 3B-E, S4B), despite the inhibitor only reaching parts of the DLS (Methods, Fig. S3). The
distinction between IPI and ITI distributions was lost (Fig. 3C,E) and performance dropped to
levels similar to early phases of training (Figs. 3B-C, S4B). Beyond ‘erasing’ recent memory
traces, ZIP is not known to cause any permanent changes to circuit function99,103,104. To verify
that the circuitry in the DLS was indeed intact after our injections, we re-trained injected animals
on our task. After continued training DLS-ZIP animals reached pre-ZIP performance levels
(Figs. 3B,C,E, S4B,C), indicating the formation of new task-specific memories.
These results suggest that at least part of the motor sequence memory is formed and stored in
the DLS. While our approach does not reveal the exact identity of the potentiated synapses, it
implicates excitatory synapses, since those are the ones affected by ZIP98,99,105.
DLS-projecting thalamic neurons are necessary for task execution
These results alongside our previous study show that the DLS is necessary both for learning
(see above, Fig. 2) and executing11 complex motor sequences and likely stores aspects of the
motor memory (Fig. 3). But how does the DLS integrate into the larger motor network to serve
these functions? A recent model of how cortical and thalamic inputs to striatum contribute to
generating sequential behaviors suggested that learned sequences could be stored in intra-
striatal synapses106. Because striatum is mostly an inhibitory structure, generating the requisite
dynamics in its output neurons requires excitatory drive, which the DLS can receive from
cortical, thalamic, and - for the direct pathway - nigral inputs5,6,65. Our ZIP experiments showed
that excitatory inputs to DLS provide more than just a permissive excitatory drive. Indeed, our
results suggested that they are a storage site of the motor memory. Since motor cortical input to
DLS is dispensable for executing the learned behaviors35, these findings motivated us to look
more closely at thalamic inputs to the DLS.
.CC-BY-NC-ND 4.0 International licenseis made available under aThe copyright holder for this preprint (which was not peer-reviewed) is the author/funder. It. https://doi.org/10.1101/825810doi: bioRxiv preprint

To probe the contribution of thalamic inputs, we silenced DLS-projecting thalamic neurons in
expert animals. We targeted the main input nuclei to the DLS, the parafascicular, rostral
intralaminar and midline nuclei49,51–54 (Figs. 4A, S5). We used the same intersectional viral
strategy as before (Fig. 2), injecting retrogradely transported viruses for Cre expression into the
DLS and AAVs for conditional TeLC expression into the thalamus (Figs. 4A, S5). As a control,
we repeated the silencing of DLS-projecting motor cortical neurons (Fig. 2), but now in expert
animals (Fig. 4A, S5). To further control for nonspecific effects of the surgery and viral
expression, we expressed GFP in DLS-projecting neurons in motor cortex and thalamus in
separate cohorts. Apart from transient effects due to the surgical procedure, performance in
these control animals was not affected by GFP expression (Fig. 4B-E, S6).
In contrast to the learning effects we had seen (Fig. 2), but consistent with results from motor
cortex lesions in expert animals35, silencing DLS-projecting motor cortex neurons did not impair
task performance (Figs. 4B-E, S6). Intriguingly, however, silencing DLS-projecting thalamic
neurons had very detrimental effects on performance (Figs. 4B-E, S6). While animals were still
attentive to the task and pressed the levers during experimental sessions, they failed to produce
the learned IPIs or ITIs (Figs. 4B,D, S6), and lost the distinction between the intervals altogether
(Fig. 4C,E). Their post-silencing performance resembled early stages of training and did not
recover even after extended periods of additional exposure to the task (Figs. 4B,C,E, S6).
To gain a better understanding of the role the thalamostriatal pathway plays in motor sequence
execution, we precisely tracked the forelimb and head movements of a subset of animals using
high-speed videography and automated markerless motion tracking (Methods)107,108. As
described before11,35, animals developed highly stereotyped (Fig. 5A-D) and idiosyncratic (Fig.
5E-H) motor sequences over the course of training. Silencing the DLS-projecting thalamic
neurons drastically altered the animals’ movements (Fig. 5A-D) and essentially phenocopied our
previous excitotoxic lesions of the DLS (Fig. 5)11. Animals lost their learned stereotyped (Fig.
5A-D) and idiosyncratic (Fig. 5E-H) motor sequences, regressing to simpler lever pressing
movement patterns that were similar across animals (Fig. 5E-H). Focusing on the lever-pressing
movements themselves revealed that these were not only highly similar across animals (Fig.
5I,J) but also resembled movements used early in training (Fig. 5I,J), a behavioral reversion
similar to what is seen after DLS lesions11. These results suggest that DLS-projecting thalamic
neurons play an essential role in generating subcortically produced learned motor sequences.
.CC-BY-NC-ND 4.0 International licenseis made available under aThe copyright holder for this preprint (which was not peer-reviewed) is the author/funder. It. https://doi.org/10.1101/825810doi: bioRxiv preprint

Discussion
Our study was designed to elucidate how thalamic and motor cortical inputs to striatum
contribute to the acquisition and execution of task-specific motor sequences (Figs. 1, 6). We
found that the DLS, but not the DMS, is required for learning, and that this function is contingent
on motor cortical input to the DLS (Fig. 2). However, the very same input from motor cortex is
dispensable for executing the learned motor sequences (Fig. 4), consistent with published
results35. We identified plasticity at excitatory synapses in DLS as a likely substrate for the
underlying motor memory (Fig. 3) and further showed that DLS-projecting thalamic neurons are
essential for executing the consolidated behaviors (Figs. 4,5). These results are consistent with
motor cortical inputs to DLS guiding plasticity at thalamo-striatal synapses, thus allowing
subcortical motor circuits to learn and execute stereotyped task-specific motor sequences (Fig.
6). Taken together, these findings shed new light on the neural circuit-level logic by which motor
skills are acquired, specifically the roles of DLS’s two major inputs, from motor cortex and
thalamus (Fig. 6).
Evolutionary considerations
Studies probing the corticostriatal pathway in motor learning have often assumed that motor
cortex controls the acquired behavior2,3,32,109–111, making it difficult to distinguish its separate
contributions to learning and control processes. In contrast, the motor sequences we train in our
task have no explicit requirements for dexterity or cognition112, and have been shown to be
motor cortex independent35. These highly stereotyped and task-specific behaviors, therefore,
are likely stored and generated subcortically11,35. The involvement of both the BG11 and the
thalamus in the execution of these learned behaviors (Figs. 4,5) implicates the phylogenetically
older BG pathway that connects thalamus to BG to subcortical motor centers7,12,14,113–116.
It is widely assumed that this subcortical pathway is involved in initiating1,12–14,114,117 and
modulating118–122 innate behaviors, such as locomotion, grooming, hunting and feeding120,123–125
through selective and graded disinhibition of its downstream targets. Our results suggest that
the utility of this BG pathway can be extended to generate novel task-specific motor sequences
- a process that may require a motor cortex-dependent reprogramming of subcortical motor
circuits. This would allow cortex to off-load the ‘task’ of generating specialized and stereotyped
learned behaviors to subcortical circuits, making them more automatized and less prone to
cortical ‘interference’126. Consistent with this idea are observations that task-related cortical
activity decreases over the course of training and with increasing automaticity27,127–133. Our
.CC-BY-NC-ND 4.0 International licenseis made available under aThe copyright holder for this preprint (which was not peer-reviewed) is the author/funder. It. https://doi.org/10.1101/825810doi: bioRxiv preprint

current study suggests that the striatum may be where information from cortex is ‘handed-off’ to
subcortical circuits.
The idea that one brain area ‘tutors’ another has been advanced also in other contexts3,134–136.
Perhaps most relevant to our study is the example of vocal learning in songbirds, where a basal
ganglia-related circuit guides plasticity in the connections between two premotor areas137–139.
Although the circuit-level logic underlying the acquisition of stereotyped complex motor
sequences in songbirds and rats is shared, we find that the functions of the homologous brain
regions differ markedly. In songbirds, the role of the song-specialized BG mirrors that of motor
cortex in our rats, whereas the BG (or DLS) in rats seem to have a control function similar to
what has been attributed to the ‘cortical’ motor pathway in songbirds140. This could be yet
another example of convergent evolution, in which a successful solution, in this case for
learning complex stereotyped motor sequences, has evolved independently in different animals,
resulting in similar principles and solutions but with different neural circuit elements141.
A mechanism for adapting ‘hard-wired’ species-typical behaviors to individual needs would
certainly confer a fitness benefit and hence be favored by evolution. An evolving motor cortex
may thus have been a boon to our ancestors not only because it enabled more sophisticated
motor control strategies2,77,91,142–145, but also because it endowed a well-tuned and sophisticated
subcortical motor control infrastructure with the capacity to meet new motor challenges.
While most studies, particularly in non-human primates and humans, focus on aspects of
behavior in which cortical control is assumed to be essential, there is no reason to believe that
the control of motor behaviors are either cortical or not. Rather, subcortical and cortical control
circuits likely function in concert77,142,145,146. However, by studying a motor cortex-independent
behavior, we can probe how the interplay between cortical and BG circuits adds functionality to
subcortical motor circuits, and the mechanisms and pathways through which this is
accomplished.
Mechanisms for tutoring
Though we have identified the importance of motor cortical inputs to the striatum for learning the
motor sequences we train in our task, the nature of this input and how it guides plasticity in
striatum still remains to be understood. One possibility, analogous to the plasticity mechanism
thought to underlie aspects of vocal learning in songbirds139, is that motor cortex guides
plasticity at thalamostriatal synapses through spike-timing dependent heterosynaptic plasticity
139,147,148. Since the inputs from motor cortex and thalamus target overlapping populations of
.CC-BY-NC-ND 4.0 International licenseis made available under aThe copyright holder for this preprint (which was not peer-reviewed) is the author/funder. It. https://doi.org/10.1101/825810doi: bioRxiv preprint

SPNs (Fig. 1A)56,149, precisely timed co-activation of these inputs could induce plasticity147,148.
Such co-activation could be triggered by shared inputs to striatum-projecting motor cortex and
thalamus neurons. Induction of plasticity at thalamic inputs may also require initial plasticity at
cortical synapses – and both processes could be further modulated by dopamine150–155.
Another possibility for how motor cortical and thalamic input to striatum could work together to
drive learning and retention of novel motor sequences is suggested by a recent modeling
study36. In this work, cortical input to the DLS initially drives motor output and undergoes fast,
dopamine-dependent plasticity151,153–155. Thalamic inputs to striatum do not drive behaviors at
first but are increasingly strengthened via slow Hebbian plasticity at SPNs that are co-activated
by the potentiated cortical input. Because of this continued strengthening, the thalamic inputs
eventually assume control over the learned behavior, making motor cortex inputs redundant.
Future studies will be necessary to probe the plasticity rules and mechanisms in striatum and
how they underlie different aspects of motor learning148,153,156.
Redundancy in motor networks
Though the redundancy between thalamic and cortical inputs for controlling striatal activity and
behavior is an intriguing concept36, we see no evidence for it. Assuming, as is commonly done,
that motor cortex is the main controller of learned motor skills, one could attempt to explain why
the behaviors we train survive motor cortical lesions by suggesting that other circuits step in to
‘take over’ motor cortex’s control function157. Given that DLS is essential for control, this would
require an equivalency between thalamic and cortical inputs to striatum in controlling the
behavior. There isn’t one. Silencing thalamic input completely disrupts the learned behavior,
while the same manipulation to cortical inputs has no effect (Figs. 4, S6). This suggests that the
signal flow from thalamus to striatum, and likely plasticity at thalamostriatal synapses, enact
essential functions that cannot be subsumed by cortex or any other parts of the motor system.
New role for thalamus in learned motor sequence execution
Previously, DLS-projecting thalamic neurons have mainly been studied and discussed in terms
of how they modulate signal flow and plasticity at corticostriatal synapses and how they
contribute to attention and behavioral flexibility52,64,158–160. Electrophysiological recordings have
shown that striatum-projecting thalamic neurons are active during sudden changes in behavioral
context62,63,160, such as during contingency changes161,162 or self-initiation of movements58,59.
Together, these results are consistent with thalamus providing a state and/or context-related
.CC-BY-NC-ND 4.0 International licenseis made available under aThe copyright holder for this preprint (which was not peer-reviewed) is the author/funder. It. https://doi.org/10.1101/825810doi: bioRxiv preprint

signal which allows associations between the environment and appropriate movements and
actions to be learned58,160.
Our results add to our understanding of the thalamostriatal pathway and its function by
implicating DLS-projecting thalamic neurons in the control of learned motor sequences.
However, much is left to sort out. Our silencing approach targeted the main DLS-projecting
thalamic nuclei, i.e. the parafascicular nucleus and the rostral intralaminar and midline
nuclei49,51–54. Because projections originating from different thalamic nuclei25,52,163 and even from
different subpopulations within these nuclei49, can have distinct properties and
functions51,52,59,60,164,165, it remains to be seen which of these projections play a role in motor
sequence execution, and whether they have distinct functions. Furthermore, while the totality of
our results points to plasticity at thalamostriatal synapses as an important mechanism for motor
learning, this too must be conclusively established. Whether this is the main site of plasticity in
DLS relevant for storing the memories of the behaviors we train, or whether there are
contributions from corticostriatal plasticity at synapses formed by non-motor cortex neurons,
remains to be investigated. Similarly, what role in execution of learned motor sequences, if any,
the collaterals of DLS-projecting thalamic neurons play, must also be addressed.
This study probed the interactions between different brain areas within a distributed recurrent
system (that includes thalamus, BG and motor cortex) to arrive at a mechanistic understanding
of how learning and control algorithms are implemented. The underlying premise here is that
complex processes can be broken down into component functions that can be attributed or
localized to specific brain regions, pathways, and cell types. However, there can be no certainty
that such mechanistic explanations are even possible in highly recurrent and distributed
networks where functionality may be an emergent property of the system166. The striking
dissociations we find, between the functions of different subregions of the striatum (DMS and
DLS), and between its two main inputs from motor cortex and thalamus, can be seen as further
evidence for modularity and separation of function in the mammalian motor system. While this
may give some hope to those of us working towards a mechanistic understanding of motor
learning and motor control, the path ahead remains perilous and long. Our hope is that the
results presented here, and the insight that can be derived from them, will provide inspiration
and guidance for future studies into the principles and mechanisms of how neural circuits
underlie the acquisition and control of motor skills.
.CC-BY-NC-ND 4.0 International licenseis made available under aThe copyright holder for this preprint (which was not peer-reviewed) is the author/funder. It. https://doi.org/10.1101/825810doi: bioRxiv preprint

Methods Animals
The care and experimental manipulation of all animals were reviewed and approved by the
Harvard Institutional Animal Care and Use Committee. Experimental subjects were female Long
Evans rats 3-10 months old at the start of training (n=68, Charles River). Because the
behavioral effects of our circuit manipulations could not be pre-specified before the experiments,
we chose sample sizes that would allow for identification of outliers and for validation of
experimental reproducibility. Animals were excluded from experiments post-hoc if the lesions or
infected areas were found to be outside of the intended target area or extended into additional
brain structures (see Lesion section). The investigators were not blinded to allocation during
experiments and outcome assessment, unless otherwise stated.
Behavioral Training
Rats were trained in a lever-pressing task as previously described35. Water-restricted animals
were rewarded with water for pressing a lever twice within performance-dependent boundaries
around a prescribed interval between the presses (IPI = 700 ms). In addition, animals had to
withhold pressing for 1.2 s after unsuccessful trials before initiating a new trial (inter-trial interval
ITI). All animals were trained in a fully automated home-cage training system74. Manipulations
were either performed in naïve animals before beginning of the training (Fig. 2) or after they had
reached our learning criteria (mean IPI = 700 ms +/- 10%; CV of IPI distribution < 0.25; see
Behavioral analysis below) and a median ITI >1.2 s, indicating that they had learned the task
structure and stabilized their performance (Figs. 3-5).
Lesion surgeries
Bilateral striatal lesions in naïve animals, targeting either the motor cortex-recipient part (DLS)
or the non-MC input receiving part (DMS), were performed in two stages with a 10-day break
between surgeries. Lesions were performed as previously described35,167. Briefly, animals were
anesthetized with 2% isoflurane in carbogen and placed in a stereotactic frame. After incision of
the skin along the midline and cleaning of the skull, Bregma was located and small craniotomies
for injections were performed above the targeted brain areas. A thin glass pipette connected to
a micro-injector (Nanoject II, Drummond) was lowered to the injection site and the excitotoxin
quinolinic acid (0.09M in PBS (pH=7.3), Sigma-Aldrich) was injected in 4.9 nl increments to a
total volume of 175 nl per injection site, at a speed of < 0.1 ul/min. After injection, the glass
.CC-BY-NC-ND 4.0 International licenseis made available under aThe copyright holder for this preprint (which was not peer-reviewed) is the author/funder. It. https://doi.org/10.1101/825810doi: bioRxiv preprint

pipette was retracted by 100 um and remained there for at least 3 min before further retraction
to allow for diffusion and to prevent backflow of the drug. After all injections were performed, the
skin was sutured and animals received painkillers (Buprenorphine, Patterson Veterinary).
Animals were allowed to recover for 10 days after the second surgery before being put into
training.
To test for nonspecific effects of surgery and striatal injections on behavior, we performed 1-
stage control surgeries according to the procedure described above, bilaterally injecting different
non-toxic solutions, either fluorophore-coated latex microspheres (red excitation [exc.] =
530 nm, emission [em.] = 590 nm and green exc. = 460 nm, em. = 505 nm) referred to as
retrobeads (Lumafluor)168,169 or Adeno-associated viruses (AAVs) for non-specific expression of
GFP (Penn Vector Core), into DLS. This allowed for post-hoc evaluation of the targeting of our
control injections.
Injection coordinates were (in mm, according to Paxinos170):
DLS DMS
AP* +0.7 +0.7 -0.3 -0.3 +1.2 +1.2 +0.2 +0.2
ML* +/-3.6 +/-3.6 +/-4.0 +/-4.0 +/-1.9 +/-1.9 +/-1.9 +/-1.9
DV -5.5 -4.5 -5 -4 -5.5 -4.5 -5.5 -4.5
* measured from bregma
ZIP injections
To inhibit the enzyme PKMzeta and to reverse synaptic plasticity in different target regions, we
injected the inhibitory peptide ZIP98,99 into either motor cortex, DLS or DMS. Animals were
injected once they had reached our learning criteria (see Behavioral Training). We performed 1-
stage injection surgeries according to the procedure described above. ZIP (10 mM in PBS,
Tocris) was injected in 10 nl increments to a total volume of 500 nl per injection site88,100. To
achieve a wider spread of the injected drug, injections were performed over a dorsal-ventral
range by slowly moving the injection pipette dorsally while continuously injecting at evenly
spaced intervals. Injection sites were verified post-hoc by locating co-injected fluorescent beads
(data not shown). No animals had to be excluded based on the injection sites. Animals were put
back into training after 5 days of recovery.
.CC-BY-NC-ND 4.0 International licenseis made available under aThe copyright holder for this preprint (which was not peer-reviewed) is the author/funder. It. https://doi.org/10.1101/825810doi: bioRxiv preprint
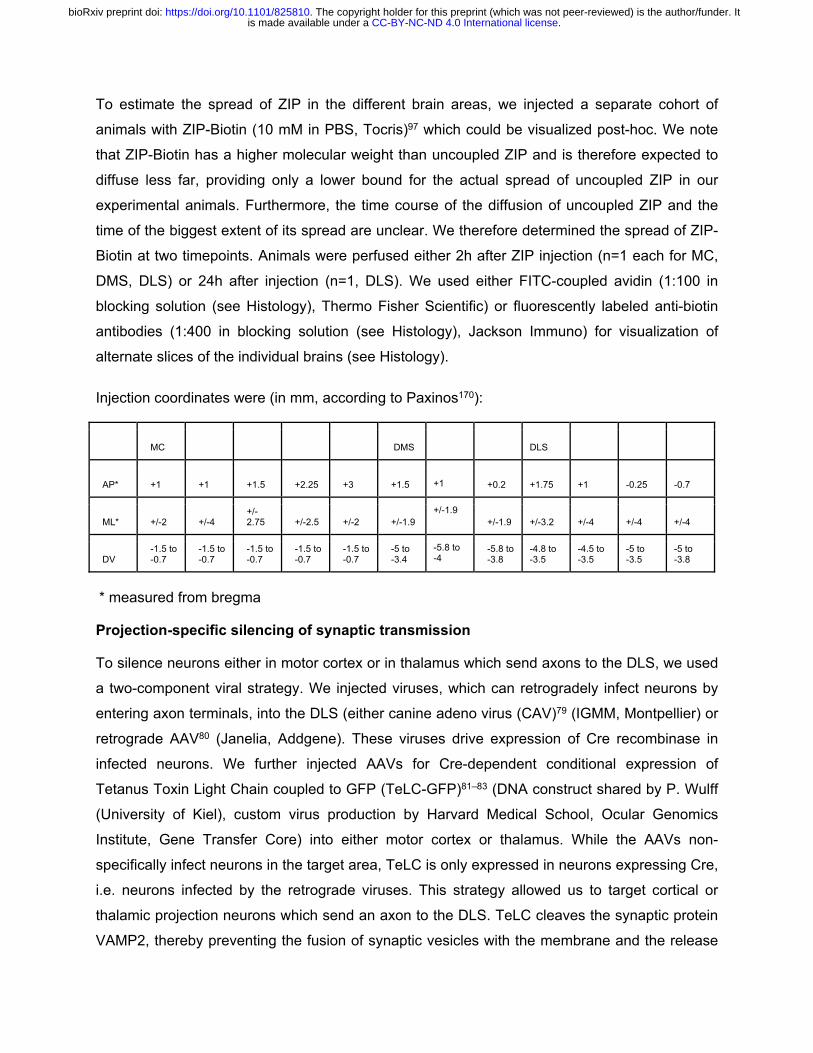
To estimate the spread of ZIP in the different brain areas, we injected a separate cohort of
animals with ZIP-Biotin (10 mM in PBS, Tocris)97 which could be visualized post-hoc. We note
that ZIP-Biotin has a higher molecular weight than uncoupled ZIP and is therefore expected to
diffuse less far, providing only a lower bound for the actual spread of uncoupled ZIP in our
experimental animals. Furthermore, the time course of the diffusion of uncoupled ZIP and the
time of the biggest extent of its spread are unclear. We therefore determined the spread of ZIP-
Biotin at two timepoints. Animals were perfused either 2h after ZIP injection (n=1 each for MC,
DMS, DLS) or 24h after injection (n=1, DLS). We used either FITC-coupled avidin (1:100 in
blocking solution (see Histology), Thermo Fisher Scientific) or fluorescently labeled anti-biotin
antibodies (1:400 in blocking solution (see Histology), Jackson Immuno) for visualization of
alternate slices of the individual brains (see Histology).
Injection coordinates were (in mm, according to Paxinos170):
MC DMS
DLS
AP* +1 +1 +1.5 +2.25 +3 +1.5 +1 +0.2 +1.75 +1 -0.25 -0.7
ML* +/-2 +/-4 +/-2.75 +/-2.5 +/-2 +/-1.9
+/-1.9 +/-1.9 +/-3.2 +/-4 +/-4 +/-4
DV -1.5 to -0.7
-1.5 to -0.7
-1.5 to -0.7
-1.5 to -0.7
-1.5 to -0.7
-5 to -3.4
-5.8 to -4
-5.8 to -3.8
-4.8 to -3.5
-4.5 to -3.5
-5 to -3.5
-5 to -3.8
* measured from bregma
Projection-specific silencing of synaptic transmission
To silence neurons either in motor cortex or in thalamus which send axons to the DLS, we used
a two-component viral strategy. We injected viruses, which can retrogradely infect neurons by
entering axon terminals, into the DLS (either canine adeno virus (CAV)79 (IGMM, Montpellier) or
retrograde AAV80 (Janelia, Addgene). These viruses drive expression of Cre recombinase in
infected neurons. We further injected AAVs for Cre-dependent conditional expression of
Tetanus Toxin Light Chain coupled to GFP (TeLC-GFP)81–83 (DNA construct shared by P. Wulff
(University of Kiel), custom virus production by Harvard Medical School, Ocular Genomics
Institute, Gene Transfer Core) into either motor cortex or thalamus. While the AAVs non-
specifically infect neurons in the target area, TeLC is only expressed in neurons expressing Cre,
i.e. neurons infected by the retrograde viruses. This strategy allowed us to target cortical or
thalamic projection neurons which send an axon to the DLS. TeLC cleaves the synaptic protein
VAMP2, thereby preventing the fusion of synaptic vesicles with the membrane and the release
.CC-BY-NC-ND 4.0 International licenseis made available under aThe copyright holder for this preprint (which was not peer-reviewed) is the author/funder. It. https://doi.org/10.1101/825810doi: bioRxiv preprint

of neurotransmitters, effectively silencing synaptic transmission in infected neurons. Injections
were performed as 1-stage surgeries, either in naïve (Fig. 2) or expert animals (Figs. 4, 5) and
were given 5 days for recovery from surgery before (re-)start of training. Spread of the TeLC
expression was determined post-hoc (see Histology).
To estimate the infection rate of our viral approach we co-injected retrobeads (Lumafluor) (see
above: Lesion surgeries) into DLS in a subset of animals. Retrobeads are taken up by axonal
terminals and transported retrogradely with high efficiency168,169, allowing us to use the number
of retrobead-labeled neurons in cortex or thalamus as an estimate for the number of neurons
projecting to DLS from these areas. We determined the efficiency of our viral approach by
comparing the numbers of retrobead-labeled and GFP-expressing neurons at the injection sites
in cortex or thalamus. We counted neurons in regions of interest in motor cortex or thalamus in
3 slices per animal (n=2 animals each for cortex and thalamus). Infection rates were similar
between cortex and thalamus and reached about 50% at the centers of the injection sites.
Injection coordinates were (in mm, according to Paxinos170):
MC DLS
AP* +1 +1 +1.5 +2.25 +3 +1.75 +1 -0.25 -0.7
ML* +/-2 +/-4 +/-2.75 +/-2.5 +/-2 +/-3.2 +/-4 +/-4 +/-4
DV -1.5 to -0.7
-1.5 to -0.7
-1.5 to -0.7
-1.5 to -0.7
-1.5 to -0.7
-4.8 to -3.5
-4.5 to -3.5
-5 to -3.5
-5 to -3.8
Thalamus
AP* -3.3 -3.3 -3.8 -3.8 -4.2
ML* +/-1.2 +/-0.4 +/-1.4 +/-0.4 +/-1.4
DV -5.8 to -4.3
-6.2 to -5.8
-6.2 to -4.3
-6.1 to -5.9
-6.1 to -4.8
* measured from bregma
.CC-BY-NC-ND 4.0 International licenseis made available under aThe copyright holder for this preprint (which was not peer-reviewed) is the author/funder. It. https://doi.org/10.1101/825810doi: bioRxiv preprint

Histology
At the end of the experiment, animals were euthanized (100 mg/kg ketamine and 10 mg/kg
xylazine, Patterson Veterinary), perfused with 4% paraformaldehyde (PFA), and their brains
were harvested for histology to confirm lesion size, injection sites and drug/ viral spread. The
brains were sectioned into 80 μm slices and stained in different ways. To determine lesion
location and size, slices were stained with Cresyl Violet following standard procedures. In a
subset of animals immunofluorescence stainings were performed instead of Cresyl Violet
stainings. After slicing, sections were blocked for 1h at room temperature in blocking solution
(1% BSA, 0.3% TritonX), stained overnight at 4C with primary antibodies for NeuN (to stain for
neuronal cell bodies; 1:500 in blocking solution; Millipore MAB377) and GFAP (to stain for glia
cells; 1:500 in blocking solution; Sigma) and subsequently with appropriate fluorescently-
coupled secondary antibodies (1:1000 in blocking solution) for 2h at room temperature. The
same staining protocol was used to visualize TeLC-GFP, using antibodies for NeuN and GFP
(1:1000 in blocking solution, Life Technologies) or to visualize ZIP-Biotin, using antibodies for
Biotin (1:400 in blocking solution, Jackson Immuno). In alternate slices, ZIP-Biotin was
visualized by incubation with fluorescein-coupled Avidin (1:100 in blocking solution, Thermo
Fisher) over night. Images of whole brain slices were acquired at 10x magnification with either a
VS210 Whole Slide Scanner (Olympus) or an Axioscan Slide Scanner (Zeiss).
Quantification of lesion size, viral infection and ZIP spread
To determine the extent and location of striatal lesions, we analyzed several sections (4-6)
spanning the anterior-posterior extent of the striatum, allowing for an estimate of the overall
lesion size. Lesion boundaries were determined throughout the striatum and adjacent areas,
blind to the animals’ identity and performance. Boundaries were marked manually based on
differences in cell morphology and density (loss of larger neuronal somata and accumulation of
smaller glial cells). The extent of the striatum was determined based on the Paxinos Rat Brain
Atlas, using anatomical landmarks (external capsule, ventricle) and cell morphology and
density. Additionally, we marked the GPe in posterior sections, since mistargeted injections may
lead to its partial lesioning, disrupting the output both of the DLS and DMS.
In addition to the overall lesion size, we also determined the lesioned fractions of the DLS/DMS.
Since the DLS and DMS are not clearly defined, we made use of their differential input patterns
from MC and PFC, respectively, which we had previously determined using viral anterograde
labeling11. We used these identified boundaries of the DLS and DMS to determine the lesioned
.CC-BY-NC-ND 4.0 International licenseis made available under aThe copyright holder for this preprint (which was not peer-reviewed) is the author/funder. It. https://doi.org/10.1101/825810doi: bioRxiv preprint

fractions in the experimental animals. We pre-defined a threshold based on our previous
observations 11 of at least 50% loss of the targeted region, less than 10% loss of the non-
targeted part of the striatum and no lesions in the GPe for inclusion of experimental animals in
our analysis. Based on this threshold, no animals had to be excluded.
To determine the spread of TeLC expression in our silencing experiments, we determined the
affected areas in motor cortex and thalamus, respectively. We manually labeled the extent of
the infections based on the presence of GFP-expressing somata in the respective regions.
Animals with no discernable expression of GFP in cortex or in thalamus were excluded from
behavioral analysis (n=2 and n=1, respectively). We further used co-injected fluorescent beads
to verify the injection sites of the retrograde viruses in the DLS.
To determine a lower boundary for the spread of ZIP injections in the different brain areas, we
manually labeled the extent of fluorescent labeling around the injection sites in the cohort of
animals injected with ZIP-Biotin. In experimental animals injected with non-labeled ZIP, we used
co-injections of retro-beads to verify the injection sites in the respective target areas. Based on
this, no animals had to be excluded.
Kinematic Tracking
To determine the movement trajectories of the forelimbs of animals performing our task, we
made use of recently developed machine learning approaches, using deep neuronal networks
to determine the position of specific body parts in individual video frames107.
Videos of animals performing the task were acquired at 30Hz and saved as snippets ranging
from 1s before the first lever press in a trial to 2s after the last lever press in the trial. We
extracted about 1000 frames randomly selected throughout the duration of the trials, balanced
across pre- and post-manipulation conditions and manually labeled the position of the forelimbs
in each frame, using custom-written Matlab code. This data was used to train individual neural
networks for each animal.
We trained ResNet-50 networks that were pretrained on ImageNet, using the original
DeeperCut implementation in TensorFlow (https://github.com/eldar/pose-tensorflow)107. Training
was performed using default parameters (1 million training iterations, 3 color channels, with
pairwise terms, without intermediate supervision). Data augmentation was performed during
training by rescaling images from a range of 85% to 115%.
.CC-BY-NC-ND 4.0 International licenseis made available under aThe copyright holder for this preprint (which was not peer-reviewed) is the author/funder. It. https://doi.org/10.1101/825810doi: bioRxiv preprint

The trained neural network was then used to predict the position of the forelimbs in all trials
across conditions, on a frame-by-frame basis. The position of a forelimb in a frame is given by
the peak of the network’s output score-map. Frames in which the forelimb was occluded were
identified as having a low peak score. For both the training and the subsequent predictions we
used GPUs in the Harvard Research Computing cluster.
Because the two forelimbs could often be confused for each other in the neural network’s
predictions from a single frame, we took advantage of correlations across time to constrain the
predictions. For each forelimb, the predicted score-maps for all frames in a single trial video
were passed through a Kalman filter using the Python toolbox filterpy. Specifically, a constant-
acceleration Kalman smoother was used which assumes that the forelimb on adjacent frames
will have the same acceleration (zero jerk) plus a small noise term. Only frames with a weak
neural-network prediction score were adjusted by the Kalman filter; otherwise the original
neural-network prediction was used as the forelimb position.
The tracking accuracy was validated post-hoc by visual inspection of at least 50 predicted
trajectories per animals. Initial training with lower frame numbers often led to inaccurate tracking
results. After settling on a 1000 training frames, none of the trained networks was discarded.
Missing frames in the trajectories, e.g. due to temporary occlusions of the forelimbs, were
linearly interpolated for a maximum of 5 consecutive frames. If occlusions lasted longer, the
trajectories were discarded. In a subset of animals, the quality of the recorded videos was not
sufficient for high-quality tracking of the forelimbs, due to inappropriate lighting conditions or due
to occlusions of the forelimbs over long durations of the trials and we had to discard the
trajectories (n=4).
Behavioral Data Analysis
Performance Metrics
Performance metrics were determined based on the timing of lever presses in our task. The
inter-press interval (IPI) was determined as the time between the first and second press in a
trial, the inter-trial interval (ITI) as the time between the last press in an unsuccessful trial and
the next occurring lever press. The CV during learning (Figs. 2, S2) was calculated across 100
trials and the moving average was low pass-filtered with a 300-trial boxcar filter. For the
manipulations in expert animals (Figs. 3, 4, S4, S6) a smaller moving window (25 trials) and
boxcar filter (50 trials) were used. The fraction of trials close to the target IPI was calculated
.CC-BY-NC-ND 4.0 International licenseis made available under aThe copyright holder for this preprint (which was not peer-reviewed) is the author/funder. It. https://doi.org/10.1101/825810doi: bioRxiv preprint

using the same windows and filters. Trials were labeled as close to the target if they were in the
IPI range of 700 ms +/- 20%.
Criterion Performance
We considered animals as having successfully learned the task and as having reached criterion
performance if the CV was below 0.25 and the mean of the IPI distribution was in the range of
700 ms +/- 10% for a 3000 trial sliding window.
JS Divergence
As a measure for the dissimilarity of the IPI and ITI distributions in individual animals, we
calculated the Jensen-Shannon (JS) Divergence of the distributions. The JS Divergence is a
symmetric derivative of the Kullback-Leibler divergence (KLD). We calculated the JS
Divergence (JSD) as:
JSD(IPI || ITI) = 0.5 x KLDIPI(IPI || M) + 0.5 x KLDITI (ITI || M)
Where
M = 0.5 x (IPI + ITI)
KLDIPI = SUM(IPI * log(IPI/ M))
KLDITI = SUM(ITI * log(ITI/ M))
Movement trajectory analysis
We compared the trajectories of both forelimbs of all tracked animals before and after Th-DLS
silencing (Fig. 5). We focused on the position of the forelimbs in the vertical dimension, in which
the movements in our task are more pronounced than in the horizontal dimension. To be able to
compare the stereotypy of the trajectories for the learned motor sequences, we sub-selected
trials which were successful and rewarded, and which occurred after unrewarded trials. This
allowed us to compare trials with the same start and end positions. This is necessary, since
animals move down to, and back up from, a reward port underneath the lever after successful
trials35. Some animals learn more than one stereotyped motor sequence as solutions to our
task. These solutions, to which we refer as ‘modes’, occur at different frequencies, usually with
one mode being predominant, but all become stereotyped and have similar properties. For our
analysis we sub-selected only trials from the most common mode, so that trajectories are
.CC-BY-NC-ND 4.0 International licenseis made available under aThe copyright holder for this preprint (which was not peer-reviewed) is the author/funder. It. https://doi.org/10.1101/825810doi: bioRxiv preprint

comparable. We determined the modes by hierarchical clustering of the time-warped forelimb
trajectories11. We plotted the average of the selected trajectories for before and after the
manipulation, calculated the SEM (Fig. 5A) and plotted a projection of all selected trials (Fig.
5B). To calculate the correlations between the individual trials, we linearly warped the
trajectories to the same duration by interpolating between the lever presses. Since the lever
presses themselves have stereotyped trajectories, largely independent of the trial duration, we
interpolated only the trajectories from 100 ms after the first to 100 ms before the second lever
press to preserve the shape of the presses. From these warped trajectories we calculated trial-
to-trial correlations separately for both forelimbs and averaged the correlations for each trial
(Fig. 5C). These correlations were averaged for the individual conditions within animals and
those means were averaged across animals and plotted with the SEM (Fig. 5D).
To compare the trajectories across animals, we linearly warped all trajectories and normalized
their amplitude to their individual maximum amplitude (Fig. 5E,F). To calculate the correlations
across animals, we first calculated the average pair-wise correlations across all trials within
individual animals, and then averaged these across the individual animals (Fig. 5G,H).
We separately compared the lever press movements, defined as the trajectory in the range of
+/-150 ms around a detected lever press (Fig. 5I,J). We normalize the lever press trajectories to
their individual maximum amplitude and plotted their overlay (Fig. 5I). To compare the lever
presses before and after the manipulation to the presses early in training, we additionally sub-
selected trials as described above from the first 2000 trials of training. As above, we calculated
the average pairwise correlations for all lever presses in all trials of all animals across the
conditions (early, pre- and post-silencing) and averaged them first by lever press (i.e. animal 1
press 1, animal 1 press 2, etc.) and then by condition (Fig. 5J).
Statistical analysis
All statistics on data pooled across animals is reported in the figures as mean +/- SEM. Multiple
comparison tests were used where justified. Statistical tests for specific experiments were
performed as described below.
Fig. 2D. Reaching of the learning criterion was compared between control and DMS-lesioned
animals. A two-tailed unpaired t-test revealed no significant differences in reaching the learning
criterion between the control and DMS-lesioned animals (n=6/4; P = 0.1179).
.CC-BY-NC-ND 4.0 International licenseis made available under aThe copyright holder for this preprint (which was not peer-reviewed) is the author/funder. It. https://doi.org/10.1101/825810doi: bioRxiv preprint

Fig. 2F. The JS divergences between the IPI and ITI were compared between early and late in
learning. A two-tailed paired t-test revealed significant differences for the control (n=6; P
=0.0088) and DMS-lesioned groups (n=4; P =0.005), but neither for the DLS-lesioned (n=5; P
=0.7537), nor the MC-DLS silencing group (n=9; P =0.4087).
Fig. 3E. The JS divergences between the IPI and ITI were compared between pre- and post-ZIP
for the MC and DMS groups, using a two-tailed paired t-test revealing no significant differences
(MC: n=7; P = 0.92; DMS: n=5; P =0.06). For the DLS group the JS divergences were
compared across 4 conditions (early, pre-ZIP, post-ZIP, late after ZIP). A repeated measures
ANOVA revealed significant differences between time points (F(3,15)=7.86, P=0.038). Post-hoc
comparisons using the Bonferroni test showed significant differences between early and pre-ZIP
(P=0.008) and between pre- and post-ZIP (P=0.012).
Fig. 4E. The JS divergences between the IPI and ITI were compared between pre- and post-
silencing for the Control and MC groups, using a two-tailed paired t-test revealing no significant
differences. For the thalamus group the JS divergences were compared across 4 conditions
(early, pre-silencing, post- silencing, late after silencing). A repeated measures ANOVA
revealed significant differences between time points (F(3,24)=13.37, P=0.0064). Post-hoc
comparisons using the Bonferroni test showed significant differences between early and pre-
silencing (P<0.001), between pre- and post-silencing (P<0.001) and between pre-silencing and
late (P=0.001).
Fig. 5D. The within trial-to-trial pairwise correlations per animal were compared for pre- and
post-silencing and between pre- and post-silencing. A repeated measures ANOVA revealed
significant differences between time points (F(2,6)=8.17, P=0.0194). Post-hoc comparisons
using the Bonferroni test showed significant differences between pre and pre-post (P=0.042)
and between post and pre-post (P=0.035).
Fig. 5H. The pairwise correlations for the forelimb trajectories were calculated between all trials
across animals. These correlations were averaged for individual animals and all correlations per
condition were averaged. A repeated measures ANOVA revealed significant differences
between time points (F(2,6)=18.40, P=0.0028). Post-hoc comparisons using the Bonferroni test
showed significant differences between pre and post (P=0.004) and between post and pre-post
(P=0.009).
.CC-BY-NC-ND 4.0 International licenseis made available under aThe copyright holder for this preprint (which was not peer-reviewed) is the author/funder. It. https://doi.org/10.1101/825810doi: bioRxiv preprint

Fig. 5J. The pairwise correlations for the lever press trajectories were calculated between all
trials across animals. These correlations were averaged for individual animals and all
correlations per condition were averaged. A repeated measures ANOVA revealed significant
differences between time points (F(5,35)=17.13, P<0.0000). Post-hoc comparisons using the
Bonferroni test showed significant differences between early and pre (P=0.003), early and early-
pre (P<0.001), early and pre-post (P=0.004), pre and post (P<0.001), pre and early-post
(P=0.021), post and earl-pre (P<0.001), post and pre-post (P<0.001), early-pre and early-post
(P<0.001) and early-post and pre-pose (P=0.024).
Fig. S2B. The IPI was compared between early and late learning for different performance
metrics. Two-tailed paired t-tests revealed significant differences for control (n=6; P=0.0147)
and DMS (n=4; P=0.0438) animals. For the CV two-tailed paired t-tests revealed significant
differences for control (n=6; P<0.001) and DMS (n=4; P=0.042) animals. For the Precision (trials
close to target) two-tailed paired t-tests revealed significant differences for control (n=6;
P<0.001) and DMS (n=4; P=0.0109) animals. For the ITI two-tailed paired t-tests revealed
significant differences for control (n=6; P<0.001) and DMS (n=4; P=0.0032) animals.
Fig. S4B. For the comparison of performance metrics before and after ZIP for the MC and DMS
group, two-tailed paired t-tests were used and did not yield any significant difference for any of
the comparisons. For the DLS group 4 time points were compared (early, pre-ZIP, post-ZIP, late
after ZIP). For the IPI a repeated measures ANOVA revealed significant differences between
time points (F(3,18)=10.62, P=0.0003). Post-hoc comparisons using the Bonferroni test showed
significant differences between early and pre (P<0.001) and early and late (P=0.001). For the
CV a repeated measures ANOVA revealed significant differences between time points
(F(3,18)=24.04, P<0.0000). Post-hoc comparisons using the Bonferroni test showed significant
differences between early and pre (P<0.001), early and post (P=0.010), early and late
(P<0.001) and pre and post (P=0.003). For the Precision a repeated measures ANOVA
revealed significant differences between time points (F(3,18)=34.3, P<0.0000). Post-hoc
comparisons using the Bonferroni test showed significant differences between early and pre
(P<0.001), early and late (P<0.001), pre and post (P<0.001) and post and late (P=0.002). For
the ITI a repeated measures ANOVA revealed significant differences between time points
(F(3,18)=9.6, P=0.0005). Post-hoc comparisons using the Bonferroni test showed significant
differences between early and pre (P=0.003), early and late (P=0.008), pre and post (P=0.009)
and post and late (P=0.023).
.CC-BY-NC-ND 4.0 International licenseis made available under aThe copyright holder for this preprint (which was not peer-reviewed) is the author/funder. It. https://doi.org/10.1101/825810doi: bioRxiv preprint

Fig. S6B. For the comparison of performance metrics before and after silencing for the Control
and MC group, two-tailed paired t-tests were used and did not yield any significant difference for
any of the comparisons. For the thalamus group 4 time points were compared (early, pre-
silencing, post- silencing, late after silencing). For the IPI a repeated measures ANOVA
revealed significant differences between time points (F(3,21)=4.75, P=0.0111). Post-hoc
comparisons using the Bonferroni test showed significant differences between early and pre
(P=0.014). For the CV a repeated measures ANOVA revealed significant differences between
time points (F(3,21)=13.73, P<0.0000). Post-hoc comparisons using the Bonferroni test showed
significant differences between early and pre (P<0.001), pre and post (P<0.001) and pre and
late (P=0.006). For the Precision a repeated measures ANOVA revealed significant differences
between time points (F(3,21)=16.38, P<0.0000). Post-hoc comparisons using the Bonferroni
test showed significant differences between early and pre (P<0.001), pre and post (P<0.001)
and pre and late (P<0.001). For the ITI a repeated measures ANOVA revealed significant
differences between time points (F(3,21)=19.17, P<0.0000). Post-hoc comparisons using the
Bonferroni test showed significant differences between early and pre (P<0.001), pre and post
(P<0.001) and pre and late (P<0.001).
.CC-BY-NC-ND 4.0 International licenseis made available under aThe copyright holder for this preprint (which was not peer-reviewed) is the author/funder. It. https://doi.org/10.1101/825810doi: bioRxiv preprint

Figures
.CC-BY-NC-ND 4.0 International licenseis made available under aThe copyright holder for this preprint (which was not peer-reviewed) is the author/funder. It. https://doi.org/10.1101/825810doi: bioRxiv preprint

MotorCortex*
Thalamus
Midbrain/Brain-stem
Movement
DLS** DMS
BG OutputGPi/SNr
A
Dopamine
Thalamus
MC
CIN
SPN
SPN
Figure 1
Learned Motor Behavior
Interval 1 ~ 700 ms
Inter-Press Interval
Inter-Trial Interval
Press 2 RewardPress1
Interval 2 > 1.2 s
Interval 1 out of range
Start
B
excitatoryinhibitorymodulatory
Necessary in the task in B): * for learning** for execution
Spinal-Cord
.CC-BY-NC-ND 4.0 International licenseis made available under aThe copyright holder for this preprint (which was not peer-reviewed) is the author/funder. It. https://doi.org/10.1101/825810doi: bioRxiv preprint
F
Control DMSDLS MC-DLS TeLC
Control (n=6) DMS (n=4)DLS (n=5)
Trials
IPI
ITI
Early Late
D
0.1
Frac
tion
of in
terv
als 0.2 IPI
ITI
0.7 1.20 0.7 1.20Interval length (s)
0.1
0.2
Figure 2A
IPI close to target Animals reaching Criterion
Trials0 30k
Frac
tion
of A
nim
als
0
1
0.5
Frac
tion
of T
rials
Trials
0
80
40
0 30k 0 30k
Early Late
0.7 1.20 0.7 1.20
DMS
DLS MC-DLS TeLC
Control
ITI above target
DLS LesionControl MC-DLS TeLCDMS Lesion
0.7
1.2
0.7
1.2
Inte
rval
(s)
B
E
C
JS Divergence IPI-ITI
0.3
JS D
iv.
Early Late
0.6
0.3
0.6
Early Late
DLS
Control
MC-DLS TeLC
DMS** **
n.s. n.s.
Excitotoxic Lesions Projection-specific silencing
5k Trials
MotorCortex
Thalamus
Midbrain/Brain-stem
Movement
DLS DMS
BG OutputGPi/SNr
Control / Lesion Lesion
MotorCortex
Thalamus
Midbrain/Brain-stem
DLS DMS
BG OutputGPi/SNr
CAV-Cre /rAAV-Cre
AAV-FLEX-TetanusToxin (TeLC)
Spinal-Cord
Movement
Spinal-Cord
0
max
Representative Examples
Representative Examples
.CC-BY-NC-ND 4.0 International licenseis made available under aThe copyright holder for this preprint (which was not peer-reviewed) is the author/funder. It. https://doi.org/10.1101/825810doi: bioRxiv preprint

DLS
Trials
pre-ZIP post-ZIP LateEarlyMC pre-ZIP post-ZIP
Trials
100 Trials
D IPIs close to target ITIs above target
Nor
mal
ized
frac
tion
0
100
50
1000 Trials
DLS ZIP (n=6)MC ZIP (n=7)DMS ZIP (n=5)Control (n=6)
DMSpre-ZIP post-ZIP
0.1
Frac
tion 0.2 IPI
ITI
Interval length (s)
AFigure 3
0.7
1.2
Inte
rval
(s)
0.71.2
Inte
rval
(s)
B
IPI
ITI
CDLSMC Early pre-ZIP
0.7 1.20 0.7 1.20 0.7 1.20
post-ZIP
0.7 1.200.7 1.20Interval length (s)
DMS pre-ZIP post-ZIP
Trials
pre-ZIP post-ZIP
Interval length (s)0.7 1.20 0.7 1.20
Late
0.7 1.20
JS Divergence IPI-ITI
0.3
JS D
iv.
0.6
pre-ZIP
post-ZIP
pre-ZIPpost-ZIP
E
Late
pre-ZIP
post-ZIP
DLSMC DMS
Early
n.s. ** *n.s.n.s.
MotorCortex
Thalamus
Midbrain/Brain-stem
DLS DMS
BG OutputGPi/SNr
ZIP ZIP
ZIP
Movement
Spinal-Cord
0
max
n.s.
.CC-BY-NC-ND 4.0 International licenseis made available under aThe copyright holder for this preprint (which was not peer-reviewed) is the author/funder. It. https://doi.org/10.1101/825810doi: bioRxiv preprint

Control (n=6)MC-DLS (n=5)Th-DLS (n=9)
AFigure 4
0.1
Frac
tion0.2
0.7
1.2
Inte
rval
(s)
0.71.2
Inte
rval
(s)
B
CTh-DLS
Early
0.7 1.20 0.7 1.200.7 1.20Interval length (s)
Late
0.7 1.20
pre post
D IPIs close to target ITIs above target
Nor
mal
ized
frac
tion
0
100
50
1000 Trials
JS Divergence IPI-ITI
0.3
JS D
iv.
0.6
pre
post
prepost
E
Late
pre
post
Th-DLSControl MC-DLS
Early
n.s. ******n.s.n.s.
Control
Interval length (s)0.7 1.20 0.7 1.20
pre postIPIITI
pre post
Interval length (s)
MC-DLS
0.7 1.20 0.7 1.20
**
n.s.
Projection-specific silencing
Thalamus
Midbrain/Brain-stem
MotorCortex
DLS DMS
BG OutputGPi/SNr
CAV-Cre /rAAV-Cre
AAV-FLEX-TetanusToxin (TeLC)
Movement
Spinal-Cord
Thalamus
Midbrain/Brain-stem
DLS DMS
BG OutputGPi/SNr
CAV-Cre /rAAV-Cre
AAV-FLEX-TetanusToxin (TeLC)
Movement
Spinal-Cord
MotorCortex
Control pre post
Trials
100 Trials
MC-DLS pre post
Trials
Th-DLS
Trials
pre post LateEarly
0
max
IPI
ITI
.CC-BY-NC-ND 4.0 International licenseis made available under aThe copyright holder for this preprint (which was not peer-reviewed) is the author/funder. It. https://doi.org/10.1101/825810doi: bioRxiv preprint

Figure 5
A
pre
post
Trajectories
E
Th-DLS TeLC
pre-
sile
ncin
gpo
st-
sile
ncin
g
Dominant Forelimb
Non-dominantForelimb
Dominant Forelimb
Non-dominantForelimb
Correlations1
-0.6
pre-
sile
ncin
gpo
st-
sile
ncin
g
Corr
elat
ion
1
-0.6
0
Within Animals (n=4)
pre post pre-post
**n.s.
Corr
elat
ion
1
-0.6
0
Across Animals (n=4)
pre post pre-post
** **n.s.
Correlations1
-0.8
Ani
mal
spre
post
1
41
4
pre
post A
nim
als
1
41
4
Trajectories
pre-
sile
ncin
gpo
st-
sile
ncin
g
I***
Across Animals (n=4)
[
[[
[
[
[[
[
D. limb Non-d. limb
D. limb Non-d. limb
B C D
F G H
J
Corr
elat
ion
1
-0.6
0 pre
post
pre-post
Early
Early-pre
Early-post
Within condition Across conditions
pre post
pre post
With
in A
nim
als
Acro
ss A
nim
als
Press 1 Press 2 Press 1 Press 2
Dominant Forelimb
Non-dominantForelimb
pre
post
Early
Acro
ss A
nim
als
Vertical Displacement
Vertical Displacement
max
min
Vertical Displacement
max
min0.5s 200 trials
0.5s 100 trials 80 trials 100 trials
******
***
**
***
*
***
.CC-BY-NC-ND 4.0 International licenseis made available under aThe copyright holder for this preprint (which was not peer-reviewed) is the author/funder. It. https://doi.org/10.1101/825810doi: bioRxiv preprint

Cg2
Cg1
IG
S1J
GI
AIV
DEn
Cl
AcbC
AcbSh
Pir
VP
VP
VP
ICj
Tu
fmi
ec
rf
lo
aca
mfba
mfba
LSI
SHi
DI
M1
M2
DP
SL
cg
AID
E
exc
LSS
LAcbSh
cg
Cg2
Cg1
M2
IG
GI
AIV
Cl
DEn
Pir
ICjM
AcbSh
ICj
VP
VP
2n
MS
VDB
LSI
LSD
LSV
SHi
aca
mfba
mfba
mfba
lo
gcc
Tu
IG
DI
S1J
S1JO
S1DZ
S1ULp
S1FL
M1
AID
ICj
rf
LSS
LAcbSh
ec
cg
IG
Cg2
cc
LSD
SHi
Ld
LSI
ZL
MS
PLd
LSV
VDB
mfbb
HDB
aca
SI VP
ICj
Tu
lo
mfba
rf
ec
2n
CB
DEn
Cl
Pir
AIP
GI
DI
S2
S1ULp
S1FL
M1
M2
Cg1
LV
S1DZ
LSS
SIB
1
2
3
4
5
6a
cg
ec
rf
lo
mfba
mfba
mfbb
acp
ic
st
f
acp ac
MnPO
Pe
3V
VMPO
MPA
VLPO
MPOL
ADP
PS
BSTMV
Fu
VP
BSTLV
BSTLP
BSTLD
LSV
SFi
SIB
Cl
DEn
IPACL
IPACM
HDB
MCPO
VP
ICj
CxA
Pir
Tu
AIP
GI
DI
S2
S1BF
S1FL
S1HL
M1
Cg1
Cg2
IG
LSD
df
pcf
LPO
ox
M2
LSS
VEn
S1DZ
BSTMA
AVPe
6b
LV
cc
LSI
StA
MPOM
MPOL
Cg2
IG
Cg1
M2
M1
S1HL
S1FL
S1BF
S2
AIP
Cl
DEn
VEn
Pir
CxA
VP
Tu
SO
HDB
MCPO
B
SIB
MPOC
MPA
Pe
StHy
BSTMPM
BAC
ox
LPO
BSTS
BSTMPI
CPu
SFO
TS
SFi
pcf
df
LSDcc
cg
st
ic
acp
IPACL
mfba
mfbb
lo
mch
APF
f
sm
vhc
3V
AAV
GI
IPACM
LV
DI
S1DZ
rf
LSS
BSTLI
BSTMPL
B
LGP
BSTLP
SID
PDP
VLPO
PaAM
PaAP
IG
Cg2
Cg1
M2
M1
S1HL
S1FL
S1BF
S2
AIP
ClLSS
DEn
Pir
VEn
CxA
ACo
3
LOT
1
2
AAD
SO
VLH
MCPO
LH
SIV
IPACL
IPACM
B
B
B
LGP
AD
AVVL
Rt
SFO
PVA
PT
PC
IAD
Re
SM
BSTMPL
MPO
AHA
LA
SCh
ox
3V
f
mfb
sm
ic
sm
fi
vhc
TS
cc
df
cg
ec
rf
lo
D3V
GI
DI
S1DZ
AM
AMV
SIB
SID
Pe
AStr
AVDM
AAV
BMA
MPA
st
PVA
MeAD
PaAP
LV
IG
Cg2
Cg1
M2
M1
S1FL
GI
DI
AIV
Cl
DEn
Pir
VP
VP
CB
Tu
VP
ICj
AcbC
2n
HDB
VDB
MS
mfbb
mfba
mfba
ICj
aca
ZL
Ld
LSV
LSI
SHi
LSD
LV
gcc
cg
ec
rf
AcbSh
ICjM
S1J
S1JO
S1DZ
S1ULp
E
LSS
LAcbSh
lo
AID
+1.2 mm
+1.7 mm
+0.2 mm
+0.7 mm
-0.3 mm
-1.3 mm
-0.8 mm
Supplementary Figure 1
CPCPC
E
3
21
DTT
DP
IL
PrL
Cg1
S1J
GI
AID
AIV
VO
DEn
Pir
Tu
VP
ICj
SL
AcbSh
AcbC
LSS
SHi
CPu
Cl
fmi
LV
rcc
aca
mfba
lo
rf
E
LO
AOD
AOL
AOV
AOM
VTT
E/OV
aci
rf
lo
PrL
MO
VO
DLO
ri
Cg2
Cg1
IG
S1J
CPu
GI
AIV
DEn
Cl
AcbC
AcbSh
Pir
VP
VP
VP
ICj
Tu
LV
fmi
ec
rf
lo
aca
mfba
mfba
LSI
SHi
DI
M1
DP
SL
cg
AID
E
exc
LSS
LAcbSh
cg
Cg2
Cg1
M2
IG
CPu
GI
AIV
Cl
DEn
Pir
AcbC
ICjM
AcbSh
ICj
VP
VP
2n
MS
VDB
LSI
LSD
LSV
SHi
aca
mfba
mfba
mfba
lo
LV
gcc
Tu
IG
DI
S1J
S1JO
S1DZ
S1ULp
S1FL
M1
AID
ICj
E
rf
LSS
LAcbSh
ec
cg
IG
Cg2
cc
LSD
SHi
Ld
LSI
ZL
MS
PLd
LSV
BSTL
BSTMA
VDB
mfbb
HDB
aca
SI VP
IPAC
CPu
ICj
Tu
lo
mfba
rf
ec
2n
CB
DEn
Cl
Pir
AIP
GI
DI
S2
S1ULp
Cg1
LV
S1DZ
LSS
SIB
1
2
3
4
5
6a
cg
ec
rf
lo
mfba
mfba
mfbb
acp
ic
st
f
acp ac
MnPO
Pe
3V
VMPO
MPA
VLPO
MPOL
ADP
PS
BSTMV
Fu
VP
BSTLV
BSTLP
BSTLD
BSTLJLGP
LSV
SFi
SIB
Cl
DEn
IPACL
IPACM
HDB
MCPO
VP
ICj
CxA
Pir
Tu
CPu
AIP
GI
DI
S2
S1BF
S1FL
S1HL
M1
Cg1
Cg2
IG
LSD
df
pcf
LPO
ox
M2
LSS
VEn
S1DZ
BSTMA
AVPe
6b
LV
cc
LSI
StA
MPOM
MPOL
Cg2
IG
Cg1
M2
M1
S1HL
S1FL
S1BF
S2
AIP
Cl
DEn
VEn
Pir
CxA
VP
Tu
SO
HDB
MCPO
B
SIB
MPOC
MPA
Pe
StHy
BSTMPM
BAC
ox
LPO
BSTS
BSTMPI
CPu
SFO
TS
SFi
pcf
df
LSDcc
cg
ec
st
ic
acp
IPACL
mfba
mfbb
lo
mch
APF
f
sm
vhc
3V
AAV
GI
IPACM
LV
DI
S1DZ
rf
LSS
BSTLI
BSTMPL
B
LGP
BSTLP
SID
PDP
VLPO
PaAM
PaAP
IG
Cg2
Cg1
M2
M1
S1HL
S1FL
S1BF
S2
AIP
ClLSS
DEn
Pir
VEn
CxA
ACo
3
LOT
1
2
AAD
SO
VLH
MCPO
LH
SIV
IPACL
IPACM
B
B
B
LGP
CPu
AD
AVVL
Rt
SFO
PVA
PT
PC
IAD
Re
SM
BSTMPL
MPO
AHA
LA
SCh
ox
3V
f
mfb
sm
ic
sm
fi
vhc
TS
cc
df
cg
ec
rf
lo
D3V
GI
DI
S1DZ
AM
AMV
SIB
SID
Pe
AStr
AVDM
AAV
BMA
MPA
st
PVA
MeAD
PaAP
LV
IG
Cg2
Cg1
M2
M1
S1FL
GI
DI
AIV
Cl
DEn
Pir
VP
VP
CB
Tu
VP
ICj
AcbC
2n
HDB
VDB
MS
mfbb
mfba
mfba
ICj
aca
ZL
Ld
LSV
LSI
SHi
LSD
LV
gcc
cg
ec
rf
CPu
AcbSh
ICjM
S1J
S1JO
S1DZ
S1ULp
E
LSS
LAcbSh
lo
AID
lo
aci
rf
E/OV
AOV
AOL
AOD
AOM
LO
PrL
MO
VO
FrA
DLO
1a
1b
LO
DTr
DEn
Pir 1
2
3
AOV
AOM
VTT
1
1
2
2
3
3
DTT
ri
E/OV
aci
lo
rf
MO
M2
M1
AI
VO
PrL
Cl
lo
rf
aca
E/OV
Tu
AOP
VTT
3
DTT
1
2
DEn
Pir
DP
IL
VOLO
AID
Cg1
PrLfmi
Cl
M2
M1
AIV
ri
rf
lo
aca
mfba
mfba
E/OV
fmi
ICj
TuPl
TuDC
TuPo
DEn
AOP
DP
IL
Cl
Pir
VO
LO
AIV
AID
Cg1
DTT
AcbShAcbC
SL
PrL
M2
M1
S1J
GI
+4.7 mm
+4.2 mm
+3.2 mm
+3.7 mm
+1.2 mm
+1.7 mm
+0.2 mm
+0.7 mm
-0.3 mm
+2.7 mm
-1.3 mm
-0.8 mm
+2.2 mm
M2
M1
M2
M1
S1FL
M1
S1FL
S1SS1
M2
M1
MC-DLS TeLC in naive animalsLesions of DLS and DMSin naive animals
largest DLS lesionsmallest DLS lesionlargest DMS lesionsmallest DMS lesion
largest extent of TeLC expression in MCsmallest extent of TeLC expression in MC
MotorCortex
Thalamus
Midbrain/Brain-stem
Movement
DLS DMS
BG OutputGPi/SNr
Control / Lesion Lesion
Spinal-Cord
MotorCortex
Thalamus
Midbrain/Brain-stem
DLS DMS
BG OutputGPi/SNr
CAV-Cre /rAAV-Cre
AAV-FLEX-TetanusToxin (TeLC)
Movement
Spinal-Cord
.CC-BY-NC-ND 4.0 International licenseis made available under aThe copyright holder for this preprint (which was not peer-reviewed) is the author/funder. It. https://doi.org/10.1101/825810doi: bioRxiv preprint

Supplementary Figure 2
BIPI
ms 700
500
CV
0.5
0.25
IPI close to target
0.8
0.4
ITI
600
1200
ms
frac
tion
EarlyLate
EarlyLateEarlyLateEarlyLateEarlyLate
EarlyLateEarlyLateEarlyLate
EarlyLateEarlyLateEarlyLateEarlyLate
EarlyLateEarlyLateEarlyLateEarlyLate
DLS (n=3) MC-DLS TeLC (n=3)
Extended training: IPI close to target
Frac
tion
of T
rials
Trials
0
80
40
0 60k
C
Performance measures
300
* *** ** *** * *** **n.s. n.s. n.s. n.s. n.s. n.s. n.s. n.s.
Control (n=6) DMS (n=4) DLS (n=5) MC-DLS TeLC (n=9)
AMotorCortex
Thalamus
Midbrain/Brain-stem
Movement
DLS DMS
BG OutputGPi/SNr
Control / Lesion Lesion
MotorCortex
Thalamus
Midbrain/Brain-stem
DLS DMS
BG OutputGPi/SNr
CAV-Cre /rAAV-Cre
Excitotoxic Lesions Projection-specific silencingAAV-FLEX-TetanusToxin (TeLC)
Spinal-Cord
Movement
Spinal-Cord
.CC-BY-NC-ND 4.0 International licenseis made available under aThe copyright holder for this preprint (which was not peer-reviewed) is the author/funder. It. https://doi.org/10.1101/825810doi: bioRxiv preprint

+3.2 mm
+3.7 mm
+1.2 mm
+1.7 mm
+0.7 mm+2.7 mm
+2.2 mm
Supplementary Figure 3
lo
rf
aca
E/OV
Tu
AOP
VTT
3
DTT
1
2
DEn
Pir
DP
IL
VOLO
AID
Cg1
PrLfmi
Cl
M2
M1
AIV
ri
Cg1
LO
DTr
DEn
Pir 1
2
3
AOV
AOM
VTT
1
1
2
2
3
3
DTT
ri
E/OV
aci
lo
rf
MO
M2
M1
AI
VO
PrL
fmi
Cl
Cg2
Cg1
IG
S1J
CPu
GI
AIV
DEn
Cl
AcbC
AcbSh
Pir
VP
VP
VP
ICj
Tu
LV
fmi
ec
rf
lo
aca
mfba
mfba
LSI
SHi
DI
M1
M2
DP
SL
cg
AID
E
exc
LSS
LAcbSh
cg
Cg2
Cg1
M2
IG
CPu
GI
AIV
Cl
DEn
Pir
AcbC
ICjM
AcbSh
ICj
VP
VP
2n
MS
VDB
LSI
LSD
LSV
SHi
aca
mfba
mfba
mfba
lo
LV
gcc
Tu
IG
DI
S1J
S1JO
S1DZ
S1ULp
S1FL
M1
AID
ICj
E
rf
LSS
LAcbSh
ec
IG
Cg2
Cg1
M2
M1
S1FL
GI
DI
AIV
Cl
DEn
Pir
VP
VP
CB
Tu
VP
ICj
AcbC
2n
HDB
VDB
MS
mfbb
mfba
mfba
ICj
aca
ZL
Ld
LSV
LSI
SHi
LSD
LV
gcc
cg
ec
rf
CPu
AcbSh
ICjM
S1J
S1JO
S1DZ
S1ULp
E
LSS
LAcbSh
lo
AID
rf
lo
aca
mfba
mfba
E/OV
fmi
ICj
TuPl
TuDC
TuPo
DEn
AOP
DP
IL
Cl
Pir
VO
LO
AIV
AID
Cg1
DTT
AcbSh
AcbC
SL
PrL
M2
M1
S1J
GI
3
21
DTT
DP
IL
PrL
Cg1
M2
M1
S1J
GI
AID
AIV
VO
DEn
Pir
Tu
VP
ICj
SL
AcbSh
AcbC
LSS
SHi
CPu
Cl
fmi
LV
rcc
aca
mfba
lo
rf
E
-0.8 mm
+0.2 mm
+1 mm
cg
IG
Cg2
cc
LSD
SHi
Ld
LSI
ZL
MS
PLd
LSV
BSTL
BSTMA
VDB
mfbb
HDB
aca
SIVP
IPAC
CPu
ICj
Tu
lo
mfba
rf
ec
2n
CB
DEn
Cl
Pir
AIP
GI
DI
S2
S1ULp
S1FL
M1
M2
Cg1
LV
S1DZ
LSS
SIB
MPOM
MPOL
Cg2
IG
Cg1
M2
M1
S1HL
S1FL
S1BF
S2
AIP
Cl
DEn
VEn
Pir
CxA
VP
Tu
SO
HDB
MCPO
B
SIB
MPOC
MPA
Pe
StHy
BSTMPM
BAC
ox
LPO
BSTS
BSTMPI
CPu
SFO
TS
SFi
pcf
df
LSD
cc
cg
ec
st
ic
acp
IPACL
mfba
mfbb
lo
mch
APF
f
sm
vhc
3V
AAV
GI
IPACM
LV
DI
S1DZ
rf
LSS
BSTLI
BSTMPL
B
LGP
BSTLP
SID
PDP
VLPO
PaAM
PaAP
+1.6 mm
MotorCortex
Thalamus
Midbrain/Brain-stem
DLS DMS
BG OutputGPi/SNr
ZIP ZIP
ZIP
Movement
Spinal-Cord
.CC-BY-NC-ND 4.0 International licenseis made available under aThe copyright holder for this preprint (which was not peer-reviewed) is the author/funder. It. https://doi.org/10.1101/825810doi: bioRxiv preprint

Supplementary Figure 4
Trials
IPI close to target
ITI above target
Frac
tion
of T
rials
0
80
40
0
80
40
0 25k
Control Learning (n=6)ZIP DLS (n=6)
C
MotorCortex
Thalamus
Midbrain/Brain-stem
DLS DMS
BG OutputGPi/SNr
ZIP ZIP
ZIP
Movement
Spinal-Cord
A
pre-ZIPpost-ZIP
pre-ZIPpost-ZIP
pre-ZIPpost-ZIP
Early
Late
B
IPI
ms 700
500
CV
0.5
0.25
0.8
0.4
ITI
500
1500
ms
frac
tion
Performance measures
300
****n.s. n.s.
***
**n.s. n.s.
***
**
n.s. n.s. ***n.s.******
**n.s. n.s.
**n.s.**
** *
pre-ZIPpost-ZIP
pre-ZIPpost-ZIP
pre-ZIPpost-ZIP
Early
Late
pre-ZIPpost-ZIP
pre-ZIPpost-ZIP
pre-ZIPpost-ZIP
Early
Late
pre-ZIPpost-ZIP
pre-ZIPpost-ZIP
pre-ZIPpost-ZIP
Early
Late
n.s.
MC ZIP (n=7) DMS ZIP (n=5) DLS ZIP (n=6)
IPI close to target
.CC-BY-NC-ND 4.0 International licenseis made available under aThe copyright holder for this preprint (which was not peer-reviewed) is the author/funder. It. https://doi.org/10.1101/825810doi: bioRxiv preprint

Supplementary Figure 5
3
21
DTT
DP
IL
PrL
Cg1
M2
S1J
GI
AID
AIV
VO
DEn
Pir
Tu
VP
ICj
SL
AcbSh
AcbC
LSS
SHi
CPu
Cl
fmi
LV
rcc
aca
mfba
lo
rf
E
LO
AOD
AOL
AOV
AOM
VTT
E/OV
aci
rf
lo
M2
PrL
MO
VO
DLO
ri
Cg2
Cg1
IG
S1J
CPu
GI
AIV
DEn
Cl
AcbC
AcbSh
Pir
VP
VP
VP
ICj
Tu
LV
fmi
ec
rf
lo
aca
mfba
mfba
LSI
SHi
DI
M1
M2
DP
SL
cg
AID
E
exc
LSS
LAcbSh
cg
Cg2
Cg1
M2
IG
CPu
GI
AIV
Cl
DEn
Pir
AcbC
ICjM
AcbSh
ICj
VP
VP
2n
MS
VDB
LSI
LSD
LSV
SHi
aca
mfba
mfba
mfba
lo
LV
gcc
Tu
IG
DI
S1J
S1JO
S1DZ
S1ULp
S1FL
M1
AID
ICj
E
rf
LSS
LAcbSh
ec
cg
IG
Cg2
cc
LSD
SHi
Ld
LSI
ZL
MS
PLd
LSV
BSTL
BSTMA
VDB
mfbb
HDB
aca
SI VP
IPAC
CPu
ICj
Tu
lo
mfba
rf
ec
2n
CB
DEn
Cl
Pir
AIP
GI
DI
S2
S1ULp
S1FL
M2
Cg1
LV
S1DZ
LSS
SIB
1
2
3
4
5
6a
cg
ec
rf
lo
mfba
mfba
mfbb
acp
ic
st
f
acp ac
MnPO
Pe
3V
VMPO
MPA
VLPO
MPOL
ADP
PS
BSTMV
Fu
VP
BSTLV
BSTLP
BSTLD
BSTLJLGP
LSV
SFi
SIB
Cl
DEn
IPACL
IPACM
HDB
MCPO
VP
ICj
CxA
Pir
Tu
CPu
AIP
GI
DI
S2
S1BF
S1FL
S1HL
M1
Cg1
Cg2
IG
LSD
df
pcf
LPO
ox
M2
LSS
VEn
S1DZ
BSTMA
AVPe
6b
LV
cc
LSI
StA
MPOM
MPOL
Cg2
IG
Cg1
M2
M1
S1HL
S1FL
S1BF
S2
AIP
Cl
DEn
VEn
Pir
CxA
VP
Tu
SO
HDB
MCPO
B
SIB
MPOC
MPA
Pe
StHy
BSTMPM
BAC
ox
LPO
BSTS
BSTMPI
CPu
SFO
TS
SFi
pcf
df
LSDcc
cg
ec
st
ic
acp
IPACL
mfba
mfbb
lo
mch
APF
f
sm
vhc
3V
AAV
GI
IPACM
LV
DI
S1DZ
rf
LSS
BSTLI
BSTMPL
B
LGP
BSTLP
SID
PDP
VLPO
PaAM
PaAP
IG
Cg2
Cg1
M2
M1
S1HL
S1FL
S1BF
S2
AIP
ClLSS
DEn
Pir
VEn
CxA
ACo
3
LOT
1
2
AAD
SO
VLH
MCPO
LH
SIV
IPACL
IPACM
B
B
B
LGP
CPu
AD
AVVL
Rt
SFO
PVA
PT
PC
IAD
Re
SM
BSTMPL
MPO
AHA
LA
SCh
ox
3V
f
mfb
sm
ic
sm
fi
vhc
TS
cc
df
cg
ec
rf
lo
D3V
GI
DI
S1DZ
AM
AMV
SIB
SID
Pe
AStr
AVDM
AAV
BMA
MPA
st
PVA
MeAD
PaAP
LV
IG
Cg2
Cg1
M2
M1
S1FL
GI
DI
AIV
Cl
DEn
Pir
VP
VP
CB
Tu
VP
ICj
AcbC
2n
HDB
VDB
MS
mfbb
mfba
mfba
ICj
aca
ZL
Ld
LSV
LSI
SHi
LSD
LV
gcc
cg
ec
rf
CPu
AcbSh
ICjM
S1J
S1JO
S1DZ
S1ULp
E
LSS
LAcbSh
lo
AID
lo
aci
rf
E/OV
AOV
AOL
AOD
AOM
LO
PrL
MO
VO
FrA
DLO
1a
1b
Cg1
LO
DTr
DEn
Pir 1
2
3
AOV
AOM
VTT
1
1
2
2
3
3
DTT
ri
E/OV
aci
lo
rf
MO
M2
M1
AI
VO
PrL
fmi
Cl
lo
rf
aca
E/OV
Tu
AOP
VTT
3
DTT
1
2
DEn
Pir
DP
IL
VOLO
AID
Cg1
PrLfmi
Cl
M2
M1
AIV
ri
rf
lo
aca
mfba
mfba
E/OV
fmi
ICj
TuPl
TuDC
TuPo
DEn
AOP
DP
IL
Cl
Pir
VO
LO
AIV
AID
Cg1
DTT
AcbShAcbC
SL
PrL
M2
M1
S1J
GI
+4.7 mm
+4.2 mm
+3.2 mm
+3.7 mm
+1.2 mm
+1.7 mm
+0.2 mm
+0.7 mm
-0.3 mm
+2.7 mm
-1.3 mm
-0.8 mm
+2.2 mm
FrFrFr
M2
S1FL
M1
2
3
4
6a
6b
M2
M1
M1
S1FL
M1
S1FL
S1HLS1S1
S1FS1S1
5
M1
MC-DLS TeLC in expert animals
Thalamus
Midbrain/Brain-stem
MotorCortex
DLS DMS
BG OutputGPi/SNr
CAV-Cre /rAAV-Cre
AAV-FLEX-TetanusToxin (TeLC)
Movement
Spinal-Cord
Thalamus
Midbrain/Brain-stem
DLS DMS
BG OutputGPi/SNr
CAV-Cre /rAAV-Cre
AAV-FLEX-TetanusToxin (TeLC)
Movement
Spinal-Cord
MotorCortex
largest extent of TeLC expression in MCsmallest extent of TeLC expression in MC
Th-DLS TeLC in expert animals
-4.3 mm
-4.16 mm
-3.6 mm
-3.14 mm
largest extent of TeLC expression in Thsmallest extent of TeLC expression in Th
.CC-BY-NC-ND 4.0 International licenseis made available under aThe copyright holder for this preprint (which was not peer-reviewed) is the author/funder. It. https://doi.org/10.1101/825810doi: bioRxiv preprint

prepost
prepost
prepost
Early
Late
Supplementary Figure 6
B
IPI
ms 700
500
CV
0.5
0.25
0.8
0.4
ITI
600
1200
ms
frac
tion
Performance measures
300
n.s. n.s. *n.s. n.s. n.s. n.s. n.s. n.s.
****** ***
****** *****
*** ***
A
Thalamus
Midbrain/Brain-stem
MotorCortex
DLS DMS
BG OutputGPi/SNr
CAV-Cre /rAAV-Cre
Projection-specific silencingAAV-FLEX-TetanusToxin (TeLC)
Thalamus
Midbrain/Brain-stem
DLS DMS
BG OutputGPi/SNr
CAV-Cre /rAAV-Cre
AAV-FLEX-TetanusToxin (TeLC)
Movement
Spinal-Cord
MotorCortex
Movement
Spinal-Cord
Control (n=6) MC-DLS (n=5) Th-DLS (n=9)
prepost
prepost
prepost
Early
Late
prepost
prepost
prepost
Early
Late
prepost
prepost
prepost
Early
Late
IPI close to target
.CC-BY-NC-ND 4.0 International licenseis made available under aThe copyright holder for this preprint (which was not peer-reviewed) is the author/funder. It. https://doi.org/10.1101/825810doi: bioRxiv preprint

Figure legends
Figure 1: Probing the role of excitatory inputs to the striatum in motor sequence learning and execution. A) Simple schematic of the motor network probed in this study with the Basal Ganglia (BG) at its center. Expanded view: The main excitatory inputs to the Dorsolateral Striatum (DLS) are from Motor Cortex (MC, blue) and thalamus (yellow). Both inputs target overlapping populations of spiny projection neurons (SPNs) in the DLS, but also cholinergic (CIN) and other interneurons (not shown). B) Behavioral paradigm to test the role of the DLS and its excitatory inputs during the learning and execution of a complex motor sequence. Rats are rewarded for pressing a lever twice with a specific delay between presses (inter-press interval (IPI)). After unsuccessful trials animals must refrain from pressing the lever for 1.2 seconds (inter-trial interval (ITI)) to initiate a new trial.
Figure 2: The DLS and its motor cortical input are required for learning complex motor sequences. A) Experimental schemes. Left: Excitotoxic lesions of either DLS or DMS, or DLS control injections in naïve animals. Right: Using a two-component viral strategy, we express Tetanus Toxin Light chain (TeLC) in DLS-projecting motor cortex neurons in naïve animals. Retrogradely infecting viruses for Cre expression are injected into the DLS and conditional AAVs for Cre-dependent expression of TeLC are injected into motor cortex. B) Representative examples of performance over the course of learning in animals subjected to different manipulations before the start of training (DLS control injection, DMS lesion, DLS lesion, silencing of motor cortex cells projecting to the DLS (MC-DLS) using Tetanus Toxin (TeLC)). Shown are heatmaps of the probability distributions of the IPIs and ITIs for representative example animals throughout learning. Colors indicate the probability of the occurrence of a certain interval in a given time windows (Methods). C) Averaged performance across animals for manipulations as in (B). Left: Fraction of trials with IPIs close to the target (700 ms +/- 20%). Right: Fraction of trials with ITIs above the threshold of 1.2 s. D) Fraction of animals reaching the learning criterion (see Methods) over the course of training. E) Distributions of durations between lever presses for the animals shown in (B) early (first 2000 trials) and late (trials 30,000 to 32,000) in training. F) Dissimilarity between the IPI and ITI distributions early and late in training as measured by the JS Divergence. Error bars represent standard error of the mean (SEM). **P < 0.01.
Figure 3: Pharmacological reversal of plasticity at excitatory synapses in DLS disrupts the execution of the learned behavior, but the same manipulation has no effect in motor cortex or DMS. A) Experimental scheme. ZIP, an inhibitor of an enzyme necessary for maintaining synaptic plasticity at excitatory synapses, was injected in either motor cortex, DMS or DLS. B) Representative examples of expert animals injected with ZIP in either motor cortex, DMS or DLS. Shown are heatmaps of the probability distributions of IPIs and ITIs before and after-ZIP for motor cortex and DMS injections. Additionally, performance early in training (first 2000 trials) and late (10,000 trials) after ZIP injection is shown for DLS ZIP animals. C) Distributions of durations between lever presses for the animals shown in (B) before and after ZIP injections.
.CC-BY-NC-ND 4.0 International licenseis made available under aThe copyright holder for this preprint (which was not peer-reviewed) is the author/funder. It. https://doi.org/10.1101/825810doi: bioRxiv preprint
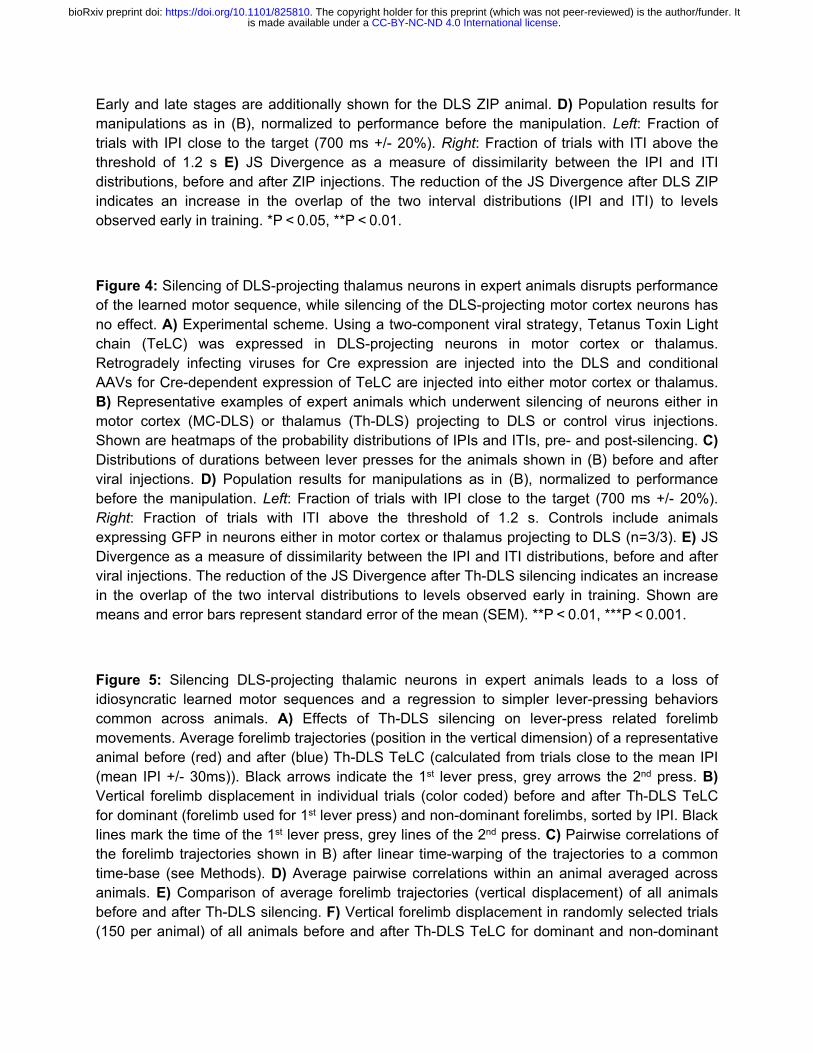
Early and late stages are additionally shown for the DLS ZIP animal. D) Population results for manipulations as in (B), normalized to performance before the manipulation. Left: Fraction of trials with IPI close to the target (700 ms +/- 20%). Right: Fraction of trials with ITI above the threshold of 1.2 s E) JS Divergence as a measure of dissimilarity between the IPI and ITI distributions, before and after ZIP injections. The reduction of the JS Divergence after DLS ZIP indicates an increase in the overlap of the two interval distributions (IPI and ITI) to levels observed early in training. *P < 0.05, **P < 0.01.
Figure 4: Silencing of DLS-projecting thalamus neurons in expert animals disrupts performance of the learned motor sequence, while silencing of the DLS-projecting motor cortex neurons has no effect. A) Experimental scheme. Using a two-component viral strategy, Tetanus Toxin Light chain (TeLC) was expressed in DLS-projecting neurons in motor cortex or thalamus. Retrogradely infecting viruses for Cre expression are injected into the DLS and conditional AAVs for Cre-dependent expression of TeLC are injected into either motor cortex or thalamus. B) Representative examples of expert animals which underwent silencing of neurons either in motor cortex (MC-DLS) or thalamus (Th-DLS) projecting to DLS or control virus injections. Shown are heatmaps of the probability distributions of IPIs and ITIs, pre- and post-silencing. C) Distributions of durations between lever presses for the animals shown in (B) before and after viral injections. D) Population results for manipulations as in (B), normalized to performance before the manipulation. Left: Fraction of trials with IPI close to the target (700 ms +/- 20%). Right: Fraction of trials with ITI above the threshold of 1.2 s. Controls include animals expressing GFP in neurons either in motor cortex or thalamus projecting to DLS (n=3/3). E) JS Divergence as a measure of dissimilarity between the IPI and ITI distributions, before and after viral injections. The reduction of the JS Divergence after Th-DLS silencing indicates an increase in the overlap of the two interval distributions to levels observed early in training. Shown are means and error bars represent standard error of the mean (SEM). **P < 0.01, ***P < 0.001.
Figure 5: Silencing DLS-projecting thalamic neurons in expert animals leads to a loss of idiosyncratic learned motor sequences and a regression to simpler lever-pressing behaviors common across animals. A) Effects of Th-DLS silencing on lever-press related forelimb movements. Average forelimb trajectories (position in the vertical dimension) of a representative animal before (red) and after (blue) Th-DLS TeLC (calculated from trials close to the mean IPI (mean IPI +/- 30ms)). Black arrows indicate the 1st lever press, grey arrows the 2nd press. B) Vertical forelimb displacement in individual trials (color coded) before and after Th-DLS TeLC for dominant (forelimb used for 1st lever press) and non-dominant forelimbs, sorted by IPI. Black lines mark the time of the 1st lever press, grey lines of the 2nd press. C) Pairwise correlations of the forelimb trajectories shown in B) after linear time-warping of the trajectories to a common time-base (see Methods). D) Average pairwise correlations within an animal averaged across animals. E) Comparison of average forelimb trajectories (vertical displacement) of all animals before and after Th-DLS silencing. F) Vertical forelimb displacement in randomly selected trials (150 per animal) of all animals before and after Th-DLS TeLC for dominant and non-dominant
.CC-BY-NC-ND 4.0 International licenseis made available under aThe copyright holder for this preprint (which was not peer-reviewed) is the author/funder. It. https://doi.org/10.1101/825810doi: bioRxiv preprint

forelimbs, sorted by IPI. Black lines mark the time of the 1st lever press, grey lines of the 2nd press. G) Pairwise correlations between the trials shown in F), averaged per animal. H) Averages of the correlations shown in G) by condition (average of all pre-to-pre, post-to-post and pre-to-post correlations). I) Comparison of average forelimb trajectories (vertical displacement) of all animals early in training, before and after Th-DLS silencing. J) Averages of the correlations of all trials of all animals within and across the conditions in I). Shown for all bar graphs are Mean +/- SEM. *P < 0.05, **P < 0.01, ***P < 0.001.
Figure 6: Alternative pathways for learning and execution of motor skills. A) Simplified view of the dominant circuit model for the learning and execution of motor skills. Motor Cortex plays a central role both for learning and control of motor skills. Motor cortex modulates the activity of the Basal Ganglia (BG) via its projection to the dorsolateral striatum (DLS). Over the course of learning this leads to plasticity at corticostriatal synapses. This allows the BG to modulate MC’s activity and output via the cortico-BG-thalamo-cortical loop in a more targeted manner. This, in turn, leads to plasticity within motor cortex, allowing motor cortex to control and effectively drive the execution of the desired, learned behaviors via its direct projections to motor control centers in the midbrain, brainstem and spinal cord. B) Our results suggest a different pathway for the learning and execution of motor skills. During learning, motor cortex ‘tutors’ the BG via its projections to the DLS. At least a part of this tutoring may be the gating or inducing of synaptic plasticity at thalamic input synapses to the DLS. Once the sequence has been learned, the subcortical circuitry, involving the BG-brainstem-thalamo-BG loop, is sufficient to drive the execution of the learned sequence and motor cortex input becomes dispensable. These pathways may interact to different degrees, depending on the behavior and the need for cortical involvement.
Supplementary Figure 1: Extent of lesions of the DLS and DMS and of TeLC expression in motor cortex. Left: Red/green: DLS/DMS lesions. Light and dark colors indicate the extent of the largest and smallest lesion. Right: Light and dark blue: largest and smallest extent of TeLC expression. Red and green outlines mark the extent of motor and prefrontal cortex projections to the striatum as previously identified by viral anterograde labeling of projection fibers11.
Supplementary Figure 2: A) Experimental schemes for Left: excitotoxic lesions and Right: projection-specific silencing (see Fig. 2) B) Comparisons of performance measures between different manipulations early and late in training (as in Fig. 2), show an improvement in performance for control and DMS animals, but not for DLS and MC-DLS TeLC animals. IPI: inter-press interval, CV of IPI: Coefficient of Variation of the IPI, IPI close to target: Fraction of trials close to target IPI (700ms +/- 20%), ITI: inter-trial interval. Early: First 2000 trials in training, Late: trials 30,000 to 32,000 in training. Bars represent means across animals and dots represent means within individual animals. Error bars represent standard error of the mean
(SEM). C) Population results for extended training in animals which underwent either DLS
.CC-BY-NC-ND 4.0 International licenseis made available under aThe copyright holder for this preprint (which was not peer-reviewed) is the author/funder. It. https://doi.org/10.1101/825810doi: bioRxiv preprint

lesions or MC-DLS silencing. Even after 60,000 trials animals’ performance did not improve. Shown is the fraction of trials with IPI close to the target (700 ms +/- 20%). *P < 0.05, **P < 0.01, ***P < 0.001.
Supplementary Figure 3: Spread of ZIP injections into motor cortex, DLS or DMS. Using biotinylated ZIP and fluorescently labeled avidin, we determined a lower bound for the spread of non-labeled ZIP (with lower molecular weight) in the different target areas. Blue: MC, Green: DMS, Red: DLS – dark and light colors indicate injections in different animals. Colored lines indicate the outlines of the DLS and DMS as previously determined by viral labeling of axons from motor cortex and prefrontal cortex, respectively11.
Supplementary Figure 4: A) Experimental scheme for ZIP injections in motor cortex, DMS or DLS (see Fig. 3). B) Comparison of performance measures at different stages before and after ZIP injections, showing a reduced performance after DLS-ZIP to levels observed early in training. IPI: inter-press interval, CV of IPI: Coefficient of Variation of the IPI, IPI close to target: Fraction of trials close to target IPI (700 ms +/- 20%), ITI: inter-trial interval. Early: First 2000 trials in training, pre-ZIP: last 2000 trials before ZIP, post-ZIP: first 2000 trials after ZIP, Late: trials 10,000 to 12,000 after ZIP. Bars represent means across animals and dots represent
means within individual animals. Error bars represent standard error of the mean (SEM). C) Development of the IPI and ITI after ZIP DLS injections, compared to the performance of control animals (compare Fig. 2) over the course of re-learning and initial learning, respectively. Both the development of the IPI and ITI after DLS ZIP resemble normal learning. *P < 0.05, **P < 0.01, ***P < 0.001.
Supplementary Figure 5: Extent of expression of TeLC in motor cortex or thalamus after projection-specific silencing. Left: Light blue: largest extent of expression of TeLC in motor cortex, Dark blue: smallest extent of expression. Right: Light yellow: largest extent of expression of TeLC in thalamus, Dark yellow: smallest extent of expression.
Supplementary Figure 6: A) Experimental scheme for projection-specific silencing in motor cortex or thalamus (see Fig. 4) in expert animals. B) Comparison of performance measures at different stages before and after viral injections, showing a reduction of performance after Th-DLS silencing to levels observed early in training. IPI: inter-press interval, CV of IPI: Coefficient of Variation of the IPI, IPI close to target: Fraction of trials close to target IPI (700 ms +/- 20%), ITI: inter-trial interval. Early: First 2000 trials in training, pre-silencing: last 2000 trials before silencing, post-silencing: first 2000 trials after silencing, Late: trials 10,000 to 12,000 after silencing. Bars represent means across animals and dots represent means within individual
.CC-BY-NC-ND 4.0 International licenseis made available under aThe copyright holder for this preprint (which was not peer-reviewed) is the author/funder. It. https://doi.org/10.1101/825810doi: bioRxiv preprint

animals. Error bars represent standard error of the mean (SEM). *P < 0.05, **P < 0.01, ***P < 0.001.
.CC-BY-NC-ND 4.0 International licenseis made available under aThe copyright holder for this preprint (which was not peer-reviewed) is the author/funder. It. https://doi.org/10.1101/825810doi: bioRxiv preprint

Acknowledgements
We thank Ashesh Dhawale for advice on data analysis and Keven Laboy Juarez and Tobias Messmer for technical support. We further thank Sean Escola, James Murray and members of the Ölveczky lab for advice on data analysis and for discussions and comments on the manuscript. We thank Steve Turney and the Harvard Center for Biological Imaging for infrastructure and support. We also thank Peer Wulff (University of Kiel) for sharing the TeLC construct and Alla Karpova (Janelia) and Adam Hantman (Janelia) for sharing the rAAV. This work was supported by NIH grants R01-NS099323-01 and R01NS105349 to B.P.Ö. and by EMBO and HFSP postdoctoral fellowships to S.B.E.W.
Author Contributions
S.B.E.W. and B.P.Ö. designed the study. S.B.E.W. conducted all experiments and analyzed the data with help from B.P.Ö. R.K. performed pilot lesion experiments. S.B.E.W. and B.P.Ö. wrote the manuscript.
References
1. Arber, S. & Costa, R. M. Connecting neuronal circuits for movement. Science 360, 1403–1404 (2018).
2. Shmuelof, L. & Krakauer, J. W. Are We Ready for a Natural History of Motor Learning? Neuron 72, 469–476 (2011).
3. Makino, H., Hwang, E. J., Hedrick, N. G. & Komiyama, T. Circuit Mechanisms of Sensorimotor Learning. Neuron 92, 705–721 (2016).
4. Alexander, G. E., DeLong, M. R. & Strick, P. L. Parallel Organization of Functionally Segregated Circuits Linking Basal Ganglia and Cortex. Annu. Rev. Neurosci. 9, 357–381 (1986).
5. Hintiryan, H. et al. The mouse cortico‐striatal projectome. Nat. Neurosci. 19, 1100–1114 (2016). 6. Hunnicutt, B. J. et al. A comprehensive excitatory input map of the striatum reveals novel
functional organization. eLife 5, e19103 (2016). 7. Lanciego, J. L., Luquin, N. & Obeso, J. A. Functional Neuroanatomy of the Basal Ganglia. Cold Spring
Harb. Perspect. Med. 2, (2012). 8. Schmitt, O., Eipert, P., Kettlitz, R., Leßmann, F. & Wree, A. The connectome of the basal ganglia.
Brain Struct. Funct. 221, 753–814 (2016). 9. Oldenburg, I. A. & Sabatini, B. L. Antagonistic but not symmetric regulation of primary motor
cortex by basal ganglia direct and indirect pathways. Neuron 86, 1174–1181 (2015). 10. Parent, A. & Hazrati, L.‐N. Functional anatomy of the basal ganglia. I. The cortico‐basal ganglia‐
thalamo‐cortical loop. Brain Res. Rev. 20, 91–127 (1995). 11. Dhawale, A. K., Wolff, S. B. E., Ko, R. & Olveczky, B. The Basal Ganglia can function independently
of motor cortex to generate learned motor sequences. bioRxiv (2019). 12. Grillner, S. & Robertson, B. The basal ganglia downstream control of brainstem motor centres‐‐an
evolutionarily conserved strategy. Curr. Opin. Neurobiol. 33, 47–52 (2015).
.CC-BY-NC-ND 4.0 International licenseis made available under aThe copyright holder for this preprint (which was not peer-reviewed) is the author/funder. It. https://doi.org/10.1101/825810doi: bioRxiv preprint

13. Grillner, S., Hellgren, J., Ménard, A., Saitoh, K. & Wikström, M. A. Mechanisms for selection of basic motor programs – roles for the striatum and pallidum. Trends Neurosci. 28, 364–370 (2005).
14. McHaffie, J. G., Stanford, T. R., Stein, B. E., Coizet, V. & Redgrave, P. Subcortical loops through the basal ganglia. Trends Neurosci. 28, 401–407 (2005).
15. Redgrave, P., Prescott, T. J. & Gurney, K. The basal ganglia: a vertebrate solution to the selection problem? Neuroscience 89, 1009–1023 (1999).
16. Redgrave, P., Vautrelle, N. & Reynolds, J. N. J. Functional properties of the basal ganglia’s re‐entrant loop architecture: selection and reinforcement. Neuroscience 198, 138–151 (2011).
17. Shipp, S. The functional logic of corticostriatal connections. Brain Struct. Funct. 222, 669–706 (2017).
18. Graybiel, A. M. & Grafton, S. T. The Striatum: Where Skills and Habits Meet. Cold Spring Harb. Perspect. Biol. 7, a021691 (2015).
19. Klaus, A., Alves da Silva, J. & Costa, R. M. What, If, and When to Move: Basal Ganglia Circuits and Self‐Paced Action Initiation. Annu. Rev. Neurosci. 42, 459–483 (2019).
20. Miyachi, S., Hikosaka, O., Miyashita, K., Kárádi, Z. & Rand, M. K. Differential roles of monkey striatum in learning of sequential hand movement. Exp. Brain Res. 115, 1–5 (1997).
21. Yin, H. H. The Sensorimotor Striatum Is Necessary for Serial Order Learning. J. Neurosci. 30, 14719–14723 (2010).
22. Yin, H. H., Knowlton, B. J. & Balleine, B. W. Lesions of dorsolateral striatum preserve outcome expectancy but disrupt habit formation in instrumental learning. Eur. J. Neurosci. 19, 181–189 (2004).
23. Yin, H. H. et al. Dynamic reorganization of striatal circuits during the acquisition and consolidation of a skill. Nat. Neurosci. 12, 333–341 (2009).
24. Ding, J., Peterson, J. D. & Surmeier, D. J. Corticostriatal and Thalamostriatal Synapses Have Distinctive Properties. J. Neurosci. 28, 6483–6492 (2008).
25. Ellender, T. J., Harwood, J., Kosillo, P., Capogna, M. & Bolam, J. P. Heterogeneous properties of central lateral and parafascicular thalamic synapses in the striatum. J. Physiol. 591, 257–272 (2013).
26. Koralek, A. C., Costa, R. M. & Carmena, J. M. Temporally Precise Cell‐Specific Coherence Develops in Corticostriatal Networks during Learning. Neuron 79, 865–872 (2013).
27. Kupferschmidt, D. A., Juczewski, K., Cui, G., Johnson, K. A. & Lovinger, D. M. Parallel, but Dissociable, Processing in Discrete Corticostriatal Inputs Encodes Skill Learning. Neuron 96, 476‐489.e5 (2017).
28. Nanda, B., Galvan, A., Smith, Y. & Wichmann, T. Effects of stimulation of the centromedian nucleus of the thalamus on the activity of striatal cells in awake rhesus monkeys. Eur. J. Neurosci. 29, 588–598 (2009).
29. Smeal, R. M., Keefe, K. A. & Wilcox, K. S. Differences in excitatory transmission between thalamic and cortical afferents to single spiny efferent neurons of rat dorsal striatum. Eur. J. Neurosci. 28, 2041–2052 (2008).
30. Vandermaelen, C. P. & Kitai, S. T. Intracellular analysis of synaptic potentials in rat neostriatum following stimulation of the cerebral cortex, thalamus, and substantia nigra. Brain Res. Bull. 5, 725–733 (1980).
31. Jin, X. & Costa, R. M. Start/stop signals emerge in nigrostriatal circuits during sequence learning. Nature 466, 457–462 (2010).
32. Koralek, A. C., Jin, X., Long, J. D., Costa, R. M. & Carmena, J. M. Corticostriatal plasticity is necessary for learning intentional neuroprosthetic skills. Nature 483, 331–335 (2012).
.CC-BY-NC-ND 4.0 International licenseis made available under aThe copyright holder for this preprint (which was not peer-reviewed) is the author/funder. It. https://doi.org/10.1101/825810doi: bioRxiv preprint

33. Pauli, W. M., Clark, A. D., Guenther, H. J., O’Reilly, R. C. & Rudy, J. W. Inhibiting PKMζ reveals dorsal lateral and dorsal medial striatum store the different memories needed to support adaptive behavior. Learn. Mem. 19, 307–314 (2012).
34. Santos, F. J., Oliveira, R. F., Jin, X. & Costa, R. M. Corticostriatal dynamics encode the refinement of specific behavioral variability during skill learning. eLife 4, (2015).
35. Kawai, R. et al. Motor cortex is required for learning but not for executing a motor skill. Neuron 86, 800–812 (2015).
36. Murray, J. M. & Escola, G. S. Remembrance of things practiced: A two‐pathway circuit for sequential learning. bioRxiv 797548 (2019) doi:10.1101/797548.
37. Akintunde, A. & Buxton, D. F. Origins and collateralization of corticospinal, corticopontine, corticorubral and corticostriatal tracts: a multiple retrograde fluorescent tracing study. Brain Res. 586, 208–218 (1992).
38. Bizzi, E., Tresch, M. C., Saltiel, P. & d’Avella, A. New perspectives on spinal motor systems. Nat. Rev. Neurosci. 1, 101–108 (2000).
39. Drew, T., Kalaska, J. & Krouchev, N. Muscle synergies during locomotion in the cat: a model for motor cortex control. J. Physiol. 586, 1239–1245 (2008).
40. Economo, M. N. et al. Distinct descending motor cortex pathways and their roles in movement. Nature 563, 79–84 (2018).
41. Ioffe, M. E. Pyramidal influences in establishment of new motor coordinations in dogs. Physiol. Behav. 11, 145–153 (1973).
42. Iriki, A., Keller, A., Pavlides, C. & Asanuma, H. Long‐lasting facilitation of pyramidal tract input to spinal interneurons. Neuroreport 1, 157–160 (1990).
43. Jeong, M. et al. Comparative three‐dimensional connectome map of motor cortical projections in the mouse brain. Sci. Rep. 6, 20072 (2016).
44. Lemon, R. N. Descending Pathways in Motor Control. Annu. Rev. Neurosci. 31, 195–218 (2008). 45. Mitchell, D. E., Santina, C. C. D. & Cullen, K. E. Plasticity within excitatory and inhibitory pathways
of the vestibulo‐spinal circuitry guides changes in motor performance. Sci. Rep. 7, 1–15 (2017). 46. Pearson, K. G. Neural Adaptation in the Generation of Rhythmic Behavior. Annu. Rev. Physiol. 62,
723–753 (2000). 47. Raineteau, O. & Schwab, M. E. Plasticity of motor systems after incomplete spinal cord injury. Nat.
Rev. Neurosci. 2, 263–273 (2001). 48. Kemp, J. M., Powell, T. P. S. & Harris, G. W. The site of termination of afferent fibres in the caudate
nucleus. Philos. Trans. R. Soc. Lond. B Biol. Sci. 262, 413–427 (1971). 49. Mandelbaum, G. et al. Distinct Cortical‐Thalamic‐Striatal Circuits through the Parafascicular
Nucleus. Neuron 102, 636‐652.e7 (2019). 50. Parent, A., Bourassa, J. & Deschênes, M. The Thalamostriatal Projection System in Rodents. in The
Basal Ganglia V (eds. Ohye, C., Kimura, M. & McKenzie, J. S.) 3–10 (Springer US, 1996). doi:10.1007/978‐1‐4899‐0194‐1_1.
51. Smith, Y., Raju, D. V., Pare, J.‐F. & Sidibe, M. The thalamostriatal system: a highly specific network of the basal ganglia circuitry. Trends Neurosci. 27, 520–527 (2004).
52. Smith, Y. et al. The thalamostriatal system in normal and diseased states. Front. Syst. Neurosci. 8, (2014).
53. Berendse, H. W. & Groenewegen, H. J. Organization of the thalamostriatal projections in the rat, with special emphasis on the ventral striatum. J. Comp. Neurol. 299, 187–228 (1990).
54. Wall, N. R., De La Parra, M., Callaway, E. M. & Kreitzer, A. C. Differential Innervation of Direct‐ and Indirect‐Pathway Striatal Projection Neurons. Neuron 79, 347–360 (2013).
.CC-BY-NC-ND 4.0 International licenseis made available under aThe copyright holder for this preprint (which was not peer-reviewed) is the author/funder. It. https://doi.org/10.1101/825810doi: bioRxiv preprint

55. Cornwall, J. & Phillipson, O. T. Afferent projections to the parafascicular thalamic nucleus of the rat, as shown by the retrograde transport of wheat germ agglutinin. Brain Res. Bull. 20, 139–150 (1988).
56. Huerta‐Ocampo, I., Mena‐Segovia, J. & Bolam, J. P. Convergence of cortical and thalamic input to direct and indirect pathway medium spiny neurons in the striatum. Brain Struct. Funct. 219, 1787–1800 (2014).
57. Lacey, C. J. et al. GABAB receptors at glutamatergic synapses in the rat striatum. Neuroscience 136, 1083–1095 (2005).
58. Bradfield, L. A., Matamales, M. & Bertran‐Gonzalez, J. The Thalamostriatal Pathway and the Hierarchical Control of Action. Neuron 100, 521–523 (2018).
59. Díaz‐Hernández, E. et al. The Thalamostriatal Projections Contribute to the Initiation and Execution of a Sequence of Movements. Neuron 100, 739‐752.e5 (2018).
60. Kato, S. et al. Action Selection and Flexible Switching Controlled by the Intralaminar Thalamic Neurons. Cell Rep. 22, 2370–2382 (2018).
61. Kimura, M., Minamimoto, T., Matsumoto, N. & Hori, Y. Monitoring and switching of cortico‐basal ganglia loop functions by the thalamo‐striatal system. Neurosci. Res. 48, 355–360 (2004).
62. Matsumoto, N., Minamimoto, T., Graybiel, A. M. & Kimura, M. Neurons in the Thalamic CM‐Pf Complex Supply Striatal Neurons With Information About Behaviorally Significant Sensory Events. J. Neurophysiol. 85, 960–976 (2001).
63. Minamimoto, T. & Kimura, M. Participation of the Thalamic CM‐Pf Complex in Attentional Orienting. J. Neurophysiol. 87, 3090–3101 (2002).
64. Smith, Y., Surmeier, D. J., Redgrave, P. & Kimura, M. Thalamic contributions to Basal Ganglia‐related behavioral switching and reinforcement. J. Neurosci. Off. J. Soc. Neurosci. 31, 16102–16106 (2011).
65. Guo, Q. et al. Whole‐Brain Mapping of Inputs to Projection Neurons and Cholinergic Interneurons in the Dorsal Striatum. PLOS ONE 10, e0123381 (2015).
66. Coynel, D. et al. Dynamics of motor‐related functional integration during motor sequence learning. NeuroImage 49, 759–766 (2010).
67. Poldrack, R. A. et al. The Neural Correlates of Motor Skill Automaticity. J. Neurosci. 25, 5356–5364 (2005).
68. Yin, H. H. & Knowlton, B. J. The role of the basal ganglia in habit formation. Nat. Rev. Neurosci. 7, 464–476 (2006).
69. Yin, H. H., Knowlton, B. J. & Balleine, B. W. Blockade of NMDA receptors in the dorsomedial striatum prevents action–outcome learning in instrumental conditioning. Eur. J. Neurosci. 22, 505–512 (2005).
70. Yin, H. H., Ostlund, S. B., Knowlton, B. J. & Balleine, B. W. The role of the dorsomedial striatum in instrumental conditioning. Eur. J. Neurosci. 22, 513–523 (2005).
71. Lehéricy, S. et al. Distinct basal ganglia territories are engaged in early and advanced motor sequence learning. Proc. Natl. Acad. Sci. 102, 12566–12571 (2005).
72. Miyachi, S., Hikosaka, O. & Lu, X. Differential activation of monkey striatal neurons in the early and late stages of procedural learning. Exp. Brain Res. 146, 122–126 (2002).
73. Thorn, C. A., Atallah, H., Howe, M. & Graybiel, A. M. Differential Dynamics of Activity Changes in Dorsolateral and Dorsomedial Striatal Loops during Learning. Neuron 66, 781–795 (2010).
74. Poddar, R., Kawai, R. & Ölveczky, B. P. A fully automated high‐throughput training system for rodents. PloS One 8, e83171 (2013).
75. Durieux, P. F., Schiffmann, S. N. & de Kerchove d’Exaerde, A. Differential regulation of motor control and response to dopaminergic drugs by D1R and D2R neurons in distinct dorsal striatum subregions. EMBO J. 31, 640–653 (2012).
.CC-BY-NC-ND 4.0 International licenseis made available under aThe copyright holder for this preprint (which was not peer-reviewed) is the author/funder. It. https://doi.org/10.1101/825810doi: bioRxiv preprint

76. Cheney, P. D. & Fetz, E. E. Functional classes of primate corticomotoneuronal cells and their relation to active force. J. Neurophysiol. 44, 773–791 (1980).
77. Lawrence, D. G. & Kuypers, H. G. J. M. THE FUNCTIONAL ORGANIZATION OF THE MOTOR SYSTEM IN THE MONKEYI. THE EFFECTS OF BILATERAL PYRAMIDAL LESIONS. Brain 91, 1–14 (1968).
78. Senn, V. et al. Long‐range connectivity defines behavioral specificity of amygdala neurons. Neuron 81, 428–437 (2014).
79. Hnasko, T. S. et al. Cre recombinase‐mediated restoration of nigrostriatal dopamine in dopamine‐deficient mice reverses hypophagia and bradykinesia. Proc. Natl. Acad. Sci. 103, 8858–8863 (2006).
80. Tervo, D. G. R. et al. A Designer AAV Variant Permits Efficient Retrograde Access to Projection Neurons. Neuron 92, 372–382 (2016).
81. Eisel, U. et al. Tetanus toxin light chain expression in Sertoli cells of transgenic mice causes alterations of the actin cytoskeleton and disrupts spermatogenesis. EMBO J. 12, 3365–3372 (1993).
82. Murray, A. J. et al. Parvalbumin‐positive CA1 interneurons are required for spatial working but not for reference memory. Nat. Neurosci. 14, 297–299 (2011).
83. Yu, C. R. et al. Spontaneous neural activity is required for the establishment and maintenance of the olfactory sensory map. Neuron 42, 553–566 (2004).
84. Link, E. et al. Tetanus toxin action: inhibition of neurotransmitter release linked to synaptobrevin proteolysis. Biochem. Biophys. Res. Commun. 189, 1017–1023 (1992).
85. Gao, P. P., Goodman, J. H., Sacktor, T. C. & Francis, J. T. Persistent Increases of PKMζ in Sensorimotor Cortex Maintain Procedural Long‐Term Memory Storage. iScience 5, 90–98 (2018).
86. Hayashi‐Takagi, A. et al. Labelling and optical erasure of synaptic memory traces in the motor cortex. Nature 525, 333–338 (2015).
87. Huber, D. et al. Multiple dynamic representations in the motor cortex during sensorimotor learning. Nature 484, 473–478 (2012).
88. Kraus, L. M. von, Sacktor, T. C. & Francis, J. T. Erasing Sensorimotor Memories via PKMζ Inhibition. PLOS ONE 5, e11125 (2010).
89. Monfils, M.‐H., Plautz, E. J. & Kleim, J. A. In Search of the Motor Engram: Motor Map Plasticity as a Mechanism for Encoding Motor Experience. The Neuroscientist 11, 471–483 (2005).
90. Peters, A. J., Chen, S. X. & Komiyama, T. Emergence of reproducible spatiotemporal activity during motor learning. Nature 510, 263–267 (2014).
91. Peters, A. J., Liu, H. & Komiyama, T. Learning in the Rodent Motor Cortex. Annu. Rev. Neurosci. 40, 77–97 (2017).
92. Rioult‐Pedotti, M.‐S., Friedman, D. & Donoghue, J. P. Learning‐Induced LTP in Neocortex. Science 290, 533–536 (2000).
93. Sanes, J. N. & Donoghue, J. P. Plasticity and primary motor cortex. Annu. Rev. Neurosci. 23, 393–415 (2000).
94. Xu, T. et al. Rapid formation and selective stabilization of synapses for enduring motor memories. Nature 462, 915–919 (2009).
95. Yang, G., Pan, F. & Gan, W.‐B. Stably maintained dendritic spines are associated with lifelong memories. Nature 462, 920–924 (2009).
96. Kwapis, J. L. & Helmstetter, F. J. Does PKM(zeta) maintain memory? Brain Res. Bull. 105, 36–45 (2014).
97. Pastalkova, E. et al. Storage of Spatial Information by the Maintenance Mechanism of LTP. Science 313, 1141–1144 (2006).
98. Sacktor, T. C. How does PKMζ maintain long‐term memory? Nat. Rev. Neurosci. 12, 9–15 (2011). 99. Sacktor, T. C. Memory maintenance by PKMζ — an evolutionary perspective. Mol. Brain 5, 31
(2012).
.CC-BY-NC-ND 4.0 International licenseis made available under aThe copyright holder for this preprint (which was not peer-reviewed) is the author/funder. It. https://doi.org/10.1101/825810doi: bioRxiv preprint

100. Shema, R., Sacktor, T. C. & Dudai, Y. Rapid erasure of long‐term memory associations in the cortex by an inhibitor of PKM zeta. Science 317, 951–953 (2007).
101. Tsokas, P. et al. Compensation for PKMζ in long‐term potentiation and spatial long‐term memory in mutant mice. eLife 5, (2016).
102. Serrano, P. et al. PKMζ Maintains Spatial, Instrumental, and Classically Conditioned Long‐Term Memories. PLoS Biol. 6, (2008).
103. Barry, J. M. et al. Inhibition of Protein Kinase Mζ Disrupts the Stable Spatial Discharge of Hippocampal Place Cells in a Familiar Environment. J. Neurosci. 32, 13753–13762 (2012).
104. Kwapis, J. L., Jarome, T. J., Gilmartin, M. R. & Helmstetter, F. J. Intra‐amygdala infusion of the protein kinase Mzeta inhibitor ZIP disrupts foreground context fear memory. Neurobiol. Learn. Mem. 98, 148–153 (2012).
105. Migues, P. V. et al. PKMζ maintains memories by regulating GluR2‐dependent AMPA receptor trafficking. Nat. Neurosci. 13, 630–634 (2010).
106. Murray, J. M. & Escola, G. S. Learning multiple variable‐speed sequences in striatum via cortical tutoring. eLife 6, e26084 (2017).
107. Insafutdinov, E., Pishchulin, L., Andres, B., Andriluka, M. & Schiele, B. DeeperCut: A Deeper, Stronger, and Faster Multi‐person Pose Estimation Model. in Computer Vision – ECCV 2016 (eds. Leibe, B., Matas, J., Sebe, N. & Welling, M.) 34–50 (Springer International Publishing, 2016).
108. Mathis, A. et al. DeepLabCut: markerless pose estimation of user‐defined body parts with deep learning. Nat. Neurosci. 21, 1281–1289 (2018).
109. Turner, R. S. & Desmurget, M. Basal ganglia contributions to motor control: a vigorous tutor. Curr. Opin. Neurobiol. 20, 704–716 (2010).
110. Hikosaka, O. et al. Parallel neural networks for learning sequential procedures. Trends Neurosci. 22, 464–471 (1999).
111. Karni, A. et al. The acquisition of skilled motor performance: Fast and slow experience‐driven changes in primary motor cortex. Proc. Natl. Acad. Sci. 95, 861–868 (1998).
112. Wong, A. L. & Krakauer, J. W. Why Are Sequence Representations in Primary Motor Cortex So Elusive? Neuron 103, 956–958 (2019).
113. Grillner, S. & Robertson, B. The Basal Ganglia Over 500 Million Years. Curr. Biol. CB 26, R1088–R1100 (2016).
114. Redgrave, P. & Coizet, V. Brainstem interactions with the basal ganglia. Parkinsonism Relat. Disord. 13 Suppl 3, S301‐305 (2007).
115. Reiner, A., Medina, L. & Veenman, C. L. Structural and functional evolution of the basal ganglia in vertebrates. Brain Res. Rev. 28, 235–285 (1998).
116. Stephenson‐Jones, M., Samuelsson, E., Ericsson, J., Robertson, B. & Grillner, S. Evolutionary conservation of the basal ganglia as a common vertebrate mechanism for action selection. Curr. Biol. CB 21, 1081–1091 (2011).
117. Ruder, L. & Arber, S. Brainstem Circuits Controlling Action Diversification. Annu. Rev. Neurosci. 42, 485–504 (2019).
118. Hikosaka, O. Role of Basal Ganglia in Control of Innate Movements, Learned Behavior and Cognition—A Hypothesis. in The Basal Ganglia IV: New Ideas and Data on Structure and Function (eds. Percheron, G., McKenzie, J. S. & Féger, J.) 589–596 (Springer US, 1994). doi:10.1007/978‐1‐4613‐0485‐2_61.
119. Hikosaka, O., Takikawa, Y. & Kawagoe, R. Role of the Basal Ganglia in the Control of Purposive Saccadic Eye Movements. Physiol. Rev. 80, 953–978 (2000).
120. Roseberry, T. K. et al. Cell‐Type‐Specific Control of Brainstem Locomotor Circuits by Basal Ganglia. Cell 164, 526–537 (2016).
.CC-BY-NC-ND 4.0 International licenseis made available under aThe copyright holder for this preprint (which was not peer-reviewed) is the author/funder. It. https://doi.org/10.1101/825810doi: bioRxiv preprint

121. Takakusaki, K., Saitoh, K., Harada, H. & Kashiwayanagi, M. Role of basal ganglia–brainstem pathways in the control of motor behaviors. Neurosci. Res. 50, 137–151 (2004).
122. Yasuda, M. & Hikosaka, O. To Wait or Not to Wait—Separate Mechanisms in the Oculomotor Circuit of Basal Ganglia. Front. Neuroanat. 11, (2017).
123. Berridge, K. C. & Fentress, J. C. Disruption of natural grooming chains after striatopallidal lesions. Psychobiology 15, 336–342 (1987).
124. Bjursten, L.‐M., Norrsell, K. & Norrsell, U. Behavioural repertory of cats without cerebral cortex from infancy. Exp. Brain Res. 25, (1976).
125. dos Santos, L. M. et al. The role of the ventrolateral caudoputamen in predatory hunting. Physiol. Behav. 105, 893–898 (2012).
126. Lopes, G. et al. A robust role for motor cortex. bioRxiv 058917 (2017) doi:10.1101/058917. 127. Gobel, E. W., Parrish, T. B. & Reber, P. J. Neural correlates of skill acquisition: Decreased cortical
activity during a serial interception sequence learning task. NeuroImage 58, 1150–1157 (2011). 128. Ma, L. et al. Changes in regional activity are accompanied with changes in inter‐regional
connectivity during 4 weeks motor learning. Brain Res. 1318, 64–76 (2010). 129. Mazzoni, P. Efficient motor control: how can less be more? J. Physiol. 586, 4031 (2008). 130. PICARD, N., MATSUZAKA, Y. & STRICK, P. L. Extended Practice of a Motor Skill Is Associated with
Reduced Metabolic Activity in M1. Nat. Neurosci. 16, 1340–1347 (2013). 131. Ungerleider, L. G., Doyon, J. & Karni, A. Imaging Brain Plasticity during Motor Skill Learning.
Neurobiol. Learn. Mem. 78, 553–564 (2002). 132. Wu, T., Kansaku, K. & Hallett, M. How Self‐Initiated Memorized Movements Become Automatic: A
Functional MRI Study. J. Neurophysiol. 91, 1690–1698 (2004). 133. Wu, T., Chan, P. & Hallett, M. Modifications of the interactions in the motor networks when a
movement becomes automatic. J. Physiol. 586, 4295–4304 (2008). 134. Hardt, O. & Nadel, L. Systems consolidation revisited, but not revised: The promise and limits of
optogenetics in the study of memory. Neurosci. Lett. 680, 54–59 (2018). 135. Kitamura, T. et al. Engrams and circuits crucial for systems consolidation of a memory. Science 356,
73–78 (2017). 136. Tonegawa, S., Morrissey, M. D. & Kitamura, T. The role of engram cells in the systems
consolidation of memory. Nat. Rev. Neurosci. 19, 485–498 (2018). 137. Brainard, M. S. & Doupe, A. J. Interruption of a basal ganglia‐forebrain circuit prevents plasticity of
learned vocalizations. Nature 404, 762–766 (2000). 138. Garst‐Orozco, J., Babadi, B. & Ölveczky, B. P. A neural circuit mechanism for regulating vocal
variability during song learning in zebra finches. eLife 3, e03697 (2014). 139. Mehaffey, W. H. & Doupe, A. J. Naturalistic stimulation drives opposing heterosynaptic plasticity at
two inputs to songbird cortex. Nat. Neurosci. 18, 1272–1280 (2015). 140. Fee, M. S. & Scharff, C. The songbird as a model for the generation and learning of complex
sequential behaviors. ILAR J. 51, 362–377 (2010). 141. Katz, P. S. Evolution of central pattern generators and rhythmic behaviours. Philos. Trans. R. Soc. B
Biol. Sci. 371, 20150057 (2016). 142. Alaverdashvili, M. & Whishaw, I. Q. Motor cortex stroke impairs individual digit movement in
skilled reaching by the rat. Eur. J. Neurosci. 28, 311–322 (2008). 143. Lawrence, D. G. & Hopkins, D. A. The development of motor control in the rhesus monkey:
evidence concerning the role of corticomotoneuronal connections. Brain J. Neurol. 99, 235–254 (1976).
144. Lemon, R. N. The G. L. Brown Prize Lecture. Cortical control of the primate hand. Exp. Physiol. 78, 263–301 (1993).
.CC-BY-NC-ND 4.0 International licenseis made available under aThe copyright holder for this preprint (which was not peer-reviewed) is the author/funder. It. https://doi.org/10.1101/825810doi: bioRxiv preprint

145. Whishaw, I. Q. Loss of the innate cortical engram for action patterns used in skilled reaching and the development of behavioral compensation following motor cortex lesions in the rat. Neuropharmacology 39, 788–805 (2000).
146. Lemke, S. M., Ramanathan, D. S., Guo, L., Won, S. J. & Ganguly, K. Emergent modular neural control drives coordinated motor actions. Nat. Neurosci. 22, 1122–1131 (2019).
147. Fino, E. & Venance, L. Spike‐timing dependent plasticity in striatal interneurons. Neuropharmacology 60, 780–788 (2011).
148. Perrin, E. & Venance, L. Bridging the gap between striatal plasticity and learning. Curr. Opin. Neurobiol. 54, 104–112 (2019).
149. Doig, N. M., Moss, J. & Bolam, J. P. Cortical and Thalamic Innervation of Direct and Indirect Pathway Medium‐Sized Spiny Neurons in Mouse Striatum. J. Neurosci. 30, 14610–14618 (2010).
150. Arbuthnott, G. W. Thalamostriatal synapses‐another substrate for dopamine action? Prog. Brain Res. 211, 1–11 (2014).
151. Calabresi, P., Picconi, B., Tozzi, A. & Di Filippo, M. Dopamine‐mediated regulation of corticostriatal synaptic plasticity. Trends Neurosci. 30, 211–219 (2007).
152. Gerfen, C. R. & Surmeier, D. J. Modulation of Striatal Projection Systems by Dopamine. Annu. Rev. Neurosci. 34, 441–466 (2011).
153. Kreitzer, A. C. & Malenka, R. C. Striatal Plasticity and Basal Ganglia Circuit Function. Neuron 60, 543–554 (2008).
154. Shen, W., Flajolet, M., Greengard, P. & Surmeier, D. J. Dichotomous Dopaminergic Control of Striatal Synaptic Plasticity. Science 321, 848–851 (2008).
155. Surmeier, D. J., Plotkin, J. & Shen, W. Dopamine and synaptic plasticity in dorsal striatal circuits controlling action selection. Curr. Opin. Neurobiol. 19, 621–628 (2009).
156. Teşileanu, T., Ölveczky, B. & Balasubramanian, V. Rules and mechanisms for efficient two‐stage learning in neural circuits. eLife 6, e20944 (2017).
157. Pratt, K. G. & Prather, J. F. Systems Neuroscience: How the Cortex Contributes to Skilled Movements. Curr. Biol. 26, R64–R66 (2016).
158. Bradfield, L. A., Bertran‐Gonzalez, J., Chieng, B. & Balleine, B. W. The Thalamostriatal Pathway and Cholinergic Control of Goal‐Directed Action: Interlacing New with Existing Learning in the Striatum. Neuron 79, 153–166 (2013).
159. Ding, J. B., Guzman, J. N., Peterson, J. D., Goldberg, J. A. & Surmeier, D. J. Thalamic gating of corticostriatal signaling by cholinergic interneurons. Neuron 67, 294–307 (2010).
160. Yamanaka, K. et al. Roles of centromedian parafascicular nuclei of thalamus and cholinergic interneurons in the dorsal striatum in associative learning of environmental events. J. Neural Transm. 125, 501–513 (2018).
161. Minamimoto, T., Hori, Y. & Kimura, M. Complementary Process to Response Bias in the Centromedian Nucleus of the Thalamus. Science 308, 1798–1801 (2005).
162. Yamanaka, K., Hori, Y., Ueda, Y., Minamimoto, T. & Kimura, M. Signals of reward value and actions represented in the neuronal activity of CM thalamus. Neurosci. Res. 68, e293 (2010).
163. Alloway, K. D., Smith, J. B. & Watson, G. D. R. Thalamostriatal projections from the medial posterior and parafascicular nuclei have distinct topographic and physiologic properties. J. Neurophysiol. 111, 36–50 (2013).
164. Bradfield, L. A., Hart, G. & Balleine, B. W. The role of the anterior, mediodorsal, and parafascicular thalamus in instrumental conditioning. Front. Syst. Neurosci. 7, (2013).
165. Kato, S. et al. Selective Neural Pathway Targeting Reveals Key Roles of Thalamostriatal Projection in the Control of Visual Discrimination. J. Neurosci. 31, 17169–17179 (2011).
166. Bechtel, W. & Richardson, R. C. Discovering complexity: Decomposition and localization as strategies in scientific research. (Princeton University Press, 1993).
.CC-BY-NC-ND 4.0 International licenseis made available under aThe copyright holder for this preprint (which was not peer-reviewed) is the author/funder. It. https://doi.org/10.1101/825810doi: bioRxiv preprint

167. Otchy, T. M. et al. Acute off‐target effects of neural circuit manipulations. Nature 528, 358–363 (2015).
168. Katz, L. C. & Iarovici, D. M. Green fluorescent latex microspheres: a new retrograde tracer. Neuroscience 34, 511–520 (1990).
169. Katz, L. C., Burkhalter, A. & Dreyer, W. J. Fluorescent latex microspheres as a retrograde neuronal marker for in vivo and in vitro studies of visual cortex. Nature 310, 498–500 (1984).
170. Paxinos, G. & Watson, C. A stereotaxic atlas of the rat brain. N. Y. Acad. (1998).
.CC-BY-NC-ND 4.0 International licenseis made available under aThe copyright holder for this preprint (which was not peer-reviewed) is the author/funder. It. https://doi.org/10.1101/825810doi: bioRxiv preprint