distance learning strategies in california schools
TRANSCRIPT
Distance Learning Strategies in California Schools
Technical Appendices
CONTENTS
Appendix A. PPIC Distance Learning Survey
Appendix B. Additional Tables and Figures
Appendix C. Survey Instruments
Niu Gao, Laura Hill, Julien Lafortune with research support from Emmanuel Prunty
Supported with funding from the Sobrato Family Foundation

PPIC.ORG Technical Appendices Distance Learning Strategies in California Schools 2
Appendix A. PPIC Distance Learning Survey
The distance learning survey was developed by researchers at PPIC. After reviewing existing literature (including RAND COVID-19 and the State of K–12 Schools survey, AIR National Survey of Public Education’s Response to COVID-19 and USC Coronavirus in America Survey) and talking to state and local policymakers, we identified a potential list of topics to be included in the survey. The draft survey was sent to multiple stakeholders including the California Department of Education (CDE), the California Association of Science Educators (CASE), the California County Superintendents Educational Services Association Curriculum and Instruction Steering Committee science subcommittee, district administrators, and the PPIC survey team, who gave us constructive feedback. The survey was launched in mid-November 2020. See Appendix C for the survey instrument.
We obtained district and school contact information from the California Department of Education (CDE), which publishes public school and district data files on a regular basis. The online survey was sent to 1,005 district superintendents and over 10,000 school principals with valid email addresses in mid-November. The email was addressed to district superintendents and school principals; however, superintendents and principals could forward the email to district/school staff. For this reason, we included in our survey a question asking the respondent’s position in the district. Several stakeholders (i.e., CDE and California County Superintendents Educational Services Association) provided invaluable assistance in disseminating the survey. Two rounds of email follow-ups were conducted in December (before the holiday break) and in January (before schools reopened).
A total of 205 districts responded to our survey. Most of the respondents were school or district administrators (Figure A1). Three quarters of rural respondents were district administrators, and about one in ten respondents in high-EL districts were teachers. A descriptive summary of survey respondents is included in Table A1.
FIGURE A1 School and district administrators make up most of the responses
SOURCE: PPIC survey of LEAs conducted between November 2020 and January 2021. Authors’ calculations using district survey responses.
The districts who responded to our survey are statistically similar to those who did not respond based on demographic characteristics. We examined characteristics of each group using data from the California
44%
48%
3%2%
District administrator
School administrator
Teacher
Board member

PPIC.ORG Technical Appendices Distance Learning Strategies in California Schools 3
Department of Education and National Center for Education Statistics, such as the percentage of their student populations that qualify for free or reduced-price lunch, the share of students who are high-need, and the share of students who are English Learners. However, there are statistically significant differences between respondents and non-respondents by students’ racial and ethnic makeup, and we also under-sampled rural districts and oversampled urban districts. To examine response disparities, we implemented an inverse probability weight. To do this, we first ran a probit regression where we regressed the probability of responding on demographic characteristics, the type of district, enrollment, and whether the district was urban or rural. Respondents post-weighting are illustrated in Table A2. Because we are unable to control for possible selection bias on unobservable district characteristics, we ultimately decided to present unweighted results throughout the report, unless otherwise noted.
TABLE A1 Characteristics of survey respondents, raw
Respondents Non Respondents
P-value of difference
Total enrollment 12,985 3,525 0.0000
Asian 9% 6% 0.0110
Black 7% 3% 0.0000
Latino 52% 43% 0.0000
White 31% 39% 0.0000
Free/reduced price lunch 54% 54% 0.8780
English Learners 18% 18% 0.7880
High-need students 61% 61% 0.8720
Urban 32% 14% 0.0000
Rural 16% 38% 0.0000
District type: county office of education 13% 4% 0.0000
District type: elementary district 25% 59% 0.0000
District type: high school district 7% 8% 0.8820
District type: unified school district 53% 30% 0.0000
High-need district 62% 62% 0.8050
High-poverty district 24% 25% 0.9150
High-Black/Latino district 36% 24% 0.0010
High-English Learner district 26% 26% 0.9950
Number of districts 205 800
SOURCES: PPIC distance learning survey, 2020. California Department of Education, 2019–20. National Center for Education Statistics: 2017-18

PPIC.ORG Technical Appendices Distance Learning Strategies in California Schools 4
TABLE A2 Characteristics of survey respondents, weighted
Respondents (Raw) Weighted
Total enrollment 12,985 5,608
Asian 9% 6%
Black 6% 4%
Latino 51% 47%
White 32% 37%
Free/reduced price lunch 54% 54%
English Learners 18% 20%
High-need students 61% 59%
Urban 31% 18%
Rural 15% 33%
District type: county office of education 13% 6%
District type: elementary district 27% 52%
District type: high school district 8% 8%
District type: unified school district 51% 32%
High-need district 64% 57%
High-poverty district 28% 26%
High-Black/Latino district 44% 27%
High-English Learner district 30% 28%
SOURCES: PPIC distance learning survey, 2020. California Department of Education, 2019–20. National Center for Education Statistics: 2017-18
NOTES: Survey responses were weighted by the inverse probably of response, which was calculated using a probit model that controls for enrollment, student demographics, educational needs, free/reduced price lunch share, district type and geographic location.
TABLE A3 Most high poverty districts are also high Black/Latino and high English Learner districts
% districts that are… High-poverty districts
High-Black/Latino
districts High-EL districts
High poverty districts 100% 46% 52%
High Black/Latino districts 85% 100% 79%
High English Learner districts 65% 52% 100%
SOURCES: PPIC distance learning survey, 2020. California Department of Education, 2019-20.
PPIC.ORG Technical Appendices Distance Learning Strategies in California Schools 5
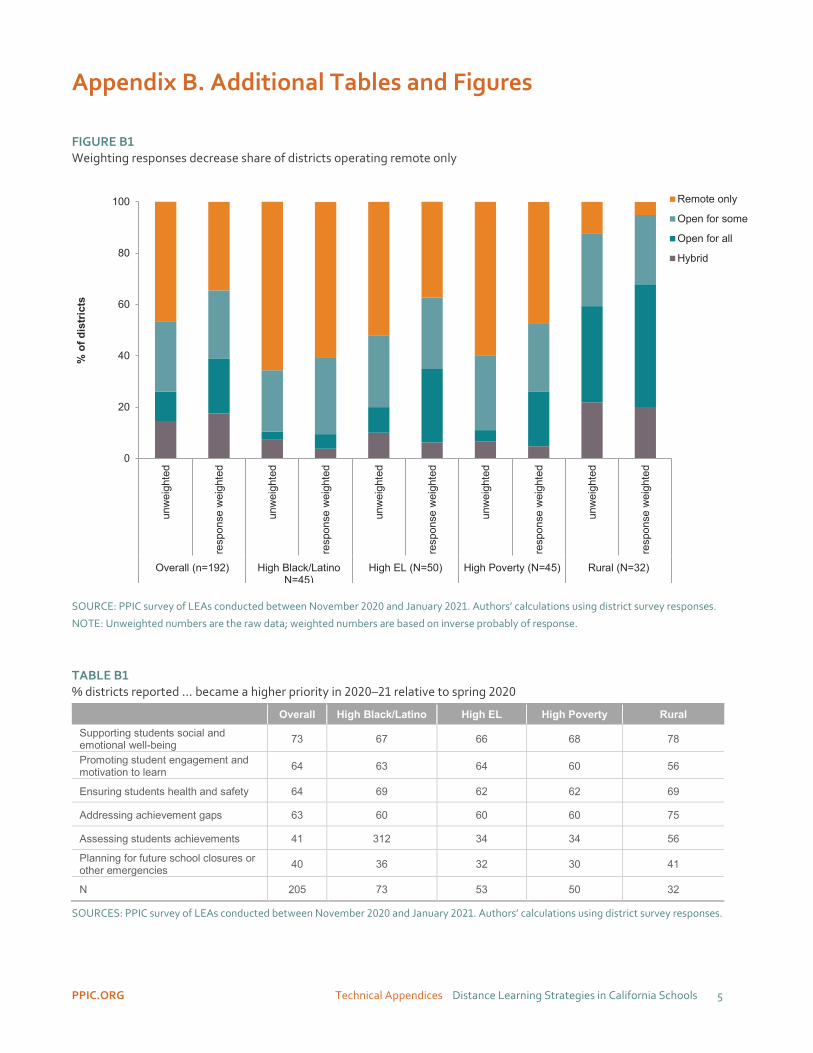
Appendix B. Additional Tables and Figures
FIGURE B1 Weighting responses decrease share of districts operating remote only
SOURCE: PPIC survey of LEAs conducted between November 2020 and January 2021. Authors’ calculations using district survey responses.
NOTE: Unweighted numbers are the raw data; weighted numbers are based on inverse probably of response.
TABLE B1 % districts reported … became a higher priority in 2020–21 relative to spring 2020
Overall High Black/Latino High EL High Poverty Rural Supporting students social and emotional well-being 73 67 66 68 78
Promoting student engagement and motivation to learn 64 63 64 60 56
Ensuring students health and safety 64 69 62 62 69
Addressing achievement gaps 63 60 60 60 75
Assessing students achievements 41 312 34 34 56
Planning for future school closures or other emergencies 40 36 32 30 41
N 205 73 53 50 32
SOURCES: PPIC survey of LEAs conducted between November 2020 and January 2021. Authors’ calculations using district survey responses.
0
20
40
60
80
100
unw
eigh
ted
resp
onse
wei
ghte
d
unw
eigh
ted
resp
onse
wei
ghte
d
unw
eigh
ted
resp
onse
wei
ghte
d
unw
eigh
ted
resp
onse
wei
ghte
d
unw
eigh
ted
resp
onse
wei
ghte
d
Overall (n=192) High Black/LatinoN=45)
High EL (N=50) High Poverty (N=45) Rural (N=32)
% o
f dis
tric
ts
Remote only
Open for some
Open for all
Hybrid

PPIC.ORG Technical Appendices Distance Learning Strategies in California Schools 6
FIGURE B2 SBAC interim assessments are much less popular than teacher/district developed assessments
SOURCE: PPIC survey of LEAs conducted between November 2020 and January 2021. Authors’ calculations using district survey responses.
NOTE: N=126 districts.
FIGURE B3
Learning loss strategies, weighted by student enrollment
SOURCE: Authors’ calculations using district survey data.
NOTE: Responses weighted by district enrollment in 2019–20.
10
31
31
47
52
66
76
0 20 40 60 80 100
Cast interim
math SBAC interim
ELA SBAC interim
Use other CDE approved diagnostic
Use ELPAC summative assessment for ELs
Use other assessments
Use Teacher/District developed assessments
% of districts
68%
66%
65%
64%
64%
60%
60%
56%
0% 10% 20% 30% 40% 50% 60% 70% 80%
1:1 tutoring
Family engagement
Teacher training
Assessing student learning
Individualized instruction
Targeted academic support
Addressing social-emotional learning
Individualized support

PPIC.ORG Technical Appendices Distance Learning Strategies in California Schools 7
FIGURE B4 Five most commonly used programs for foster youth and students experiencing homelessness
SOURCE: Authors’ calculations.
NOTE: Data based on Learning Continuity Plans from districts that (1) responded to our distance learning survey and (2) posted their LCPs online. N=166.
FIGURE B5 Most districts report 2020–21 budgets that are the same or higher than in 2019–20
SOURCE: Authors’ calculations using district survey responses.
NOTE: N=143.
47%
34%
25%
21%
18%
0% 5% 10% 15% 20% 25% 30% 35% 40% 45% 50%
Wrap-around services
Technology need
Designated staff to support student need
SEL learning
Tutoring
0%
10%
20%
30%
40%
50%
60%
About the same as 2019–20 Higher than 2019–20 Lower than 2019–20
Overall
High Black/Latino
High EL
High Poverty
Rural

PPIC.ORG Technical Appendices Distance Learning Strategies in California Schools 8
FIGURE B6 Respondents report the following programs should maintain as a high priority for the 2020–21 school year
SOURCE: Question: “What current programs, services, activities, and/or initiatives do you feel the district should maintain as a high priority for the 2020–21 school year?”
NOTE: N=162 districts. Chart excludes a small number of responses marked “other.”
FIGURE B7 Most districts were primarily teaching new content in fall 2020
SOURCE: Authors’ calculations using district survey responses
NOTE: N=159.
0% 20% 40% 60% 80% 100%
Aging infrastructural needs
Afterschool or enrichment programs
Maintaining reasonable class sizes
PD and or retention
English learners, special education students and/or foster students
Maintaining and enhancing programming and supports for students
Providing adequate resources to schools, educators, and students
Mitigating learning loss
Students social-emotional well-being
Technology access
1%
59%
40%
Primarily reviewing contentalready taught by teachers
Primarily teaching newcontent
Reviewing past content andteaching new content

PPIC.ORG Technical Appendices Distance Learning Strategies in California Schools 9
FIGURE B8 Districts closed for in-person instruction in 2020–21 had lower levels of student proficiency in 2019 (student weighted)
SOURCE: California Department of Education, 2019 SBAC exam results; authors’ calculations.
NOTE: Figure reports the share of students meeting or exceeding grade level standards across districts of different types. Scores from grades 3–8 and 11 are included. A small number of districts with missing or censored SBAC results are excluded. Remote only: LEA is physically closed for in-person instruction for all students; open for some: LEA is open for in-person instruction for some students; hybrid: all students receive instruction through a combination of in-person and distance learning; open for all: LEA is open for in-person instruction for all students every school day. Open includes open for some and open for all. Differences between remote only and hybrid or open are statistically significant in both ELA and math.
0
10
20
30
40
50
60
70
ELA Math
% a
t or a
bove
sta
ndar
d
Remote only
Hybrid
Open (Partial or Full)

PPIC.ORG Technical Appendices Distance Learning Strategies in California Schools 10
Appendix C. Survey Instruments (without skip/display logic) In this survey we use “district” and “LEA” interchangeably. If you are a charter school employee, please answer the following questions as they apply to your charter school.
Please select your county and local educational agency.
Please select your position (select all that apply).
District administrator (1)
School administrator (3)
School board member (7)
Teacher (5)
Other teaching staff (e.g., TOSA, instructional coach) (9)
English Learner coordinator / director of EL services (8)
Other, please specify: (6) ________________________________________________
Which grades does your LEA serve? (select all that apply)
Pre K/Kindergarten (1)
1 (2)
2 (3)
3 (4)
4 (5)
5 (6)
6 (7)
7–8 (8)
9–12 (9)
Adult students (10)
Which of the following best describe your LEA’s current status?
My LEA is physically closed for in-person instruction for all students (1)
My LEA is open for in-person instruction for some students (5)
My LEA is hybrid for all students (i.e. all students come at least some days) (9)
My LEA is open for in-person instruction for all students every school day (6)
Does your LEA plan to physically re-open in the 2020–21 school year?
Yes (1)
No (4)

PPIC.ORG Technical Appendices Distance Learning Strategies in California Schools 11
My LEA has not made a decision (5)
My LEA opened and had to close (7)
I don’t know (6)
Display This Question:
When does your LEA plan to physically re-open? (select all that apply)
As soon as public health conditions allow (1)
December 2020 (4)
January 2021 (5)
February 2021 (6)
March 2021 (7)
April 2021 (8)
May 2021 (9)
I don’t know (10)
Please select all grades currently allowed back in person (even if only some students in that grade are allowed)
Pre K/Kindergarten (1)
1 (2)
2 (3)
3 (4)
4 (5)
5 (6)
6 (7)
7–8 (8)
9–12 (9)
Adult students (10)
Which of the following students are allowed back for in-person instruction?
Special education students (1)
English learners (4)
Homeless / Foster students (5)
Children of essential workers (6)
Students with learning loss (7)
Students without internet or device access at home (8)
New arrivals / recent immigrant students (11)

PPIC.ORG Technical Appendices Distance Learning Strategies in California Schools 12
Other, please specify (9) ________________________________________________
I don’t know (10)
To the best of your knowledge, what percentage of students are being taught in person in the district currently?
<25% (1)
25–50% (2)
50–75% (3)
75–100% (4)
I don't know (5)
Please indicate whether you expect each of the following goals to become a higher or lower priority for your LEA in 2020-21 relative to spring 2020.
Higher priority (1) About the same (2) Lower priority (3)
Ensuring students’ health and safety (2)
Assessing students’ achievements (5)
Supporting students’ social and emotional well-
being (6)
Promoting student engagement and
motivation to learn (7)
Addressing achievement gaps (8)
Planning for future school closures or other emergencies (9)
In the next few questions, we ask questions about your districts approaches to distance learning in fall 2020.
PPIC.ORG Technical Appendices Distance Learning Strategies in California Schools 13
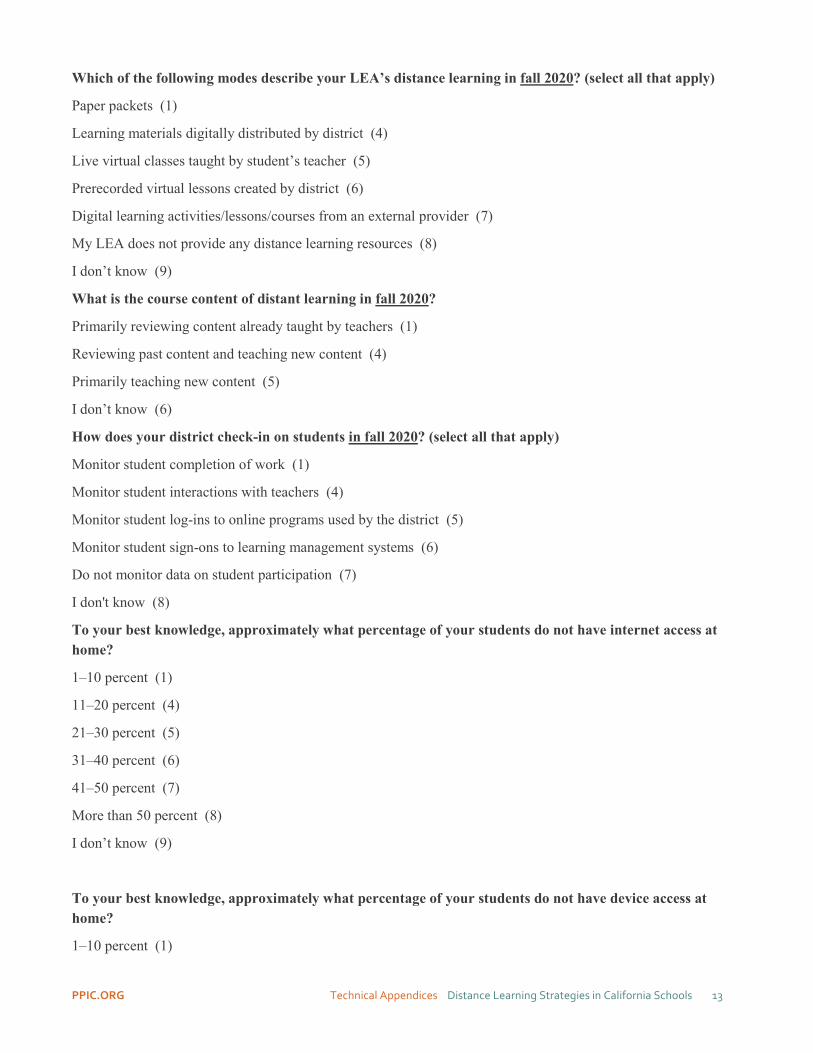
Which of the following modes describe your LEA’s distance learning in fall 2020? (select all that apply)
Paper packets (1)
Learning materials digitally distributed by district (4)
Live virtual classes taught by student’s teacher (5)
Prerecorded virtual lessons created by district (6)
Digital learning activities/lessons/courses from an external provider (7)
My LEA does not provide any distance learning resources (8)
I don’t know (9)
What is the course content of distant learning in fall 2020?
Primarily reviewing content already taught by teachers (1)
Reviewing past content and teaching new content (4)
Primarily teaching new content (5)
I don’t know (6)
How does your district check-in on students in fall 2020? (select all that apply)
Monitor student completion of work (1)
Monitor student interactions with teachers (4)
Monitor student log-ins to online programs used by the district (5)
Monitor student sign-ons to learning management systems (6)
Do not monitor data on student participation (7)
I don't know (8)
To your best knowledge, approximately what percentage of your students do not have internet access at home?
1–10 percent (1)
11–20 percent (4)
21–30 percent (5)
31–40 percent (6)
41–50 percent (7)
More than 50 percent (8)
I don’t know (9)
To your best knowledge, approximately what percentage of your students do not have device access at home?
1–10 percent (1)

PPIC.ORG Technical Appendices Distance Learning Strategies in California Schools 14
11–20 percent (4)
21–30 percent (5)
31–40 percent (6)
41–50 percent (7)
More than 50 percent (8)
I don’t know (9)
In a typical day, how much time are students expected to spend on instructional activities for distance learning?
< 3 hrs (1) 3–6 hrs (2) > 6 hrs (3) Don't know (4) N/A (We do not
serve those grades) (5)
TK/K (1)
Grades 1–3 (6)
Grades 4–5 (7)
Grades 6–8 (8)
Grades 9–12 (9)
Please indicate what type of feedback or grades students receive on their work during distance learning in fall 2020. (select all that apply)
Teachers are monitoring completion but not providing feedback (1)
Students receive feedback on their work, but no grade (4)
Students receive pass or fail grades (5)
Students receive letter grades (6)
I don’t know (7)

PPIC.ORG Technical Appendices Distance Learning Strategies in California Schools 15
If students are not completing the distance learning activities, to what extent is it due to:
A small extent (1) A moderate extent
(2) A great extent (3) I don't know (5)
Lack of access to internet/device at
home (1)
Teacher shortage (4)
Lack of student engagement (5)
Lack of parental engagement (6)
Lack of academic support (7)
Lack of other support services (8)
Has your district reached an agreement with the local union about minimum instructional minutes for fall 2020?
Yes (1)
No (4)
Negotiation is still underway (5)
I don’t know (6)
To your best knowledge, what percentage of required instructional minutes must be live? Examples of live interaction include synchronous online instruction and two-way phone calls. One-way communication including emails, voicemails or print materials, are not live interactions.
None (live instruction not required) (1)
About 25 percent (4)
About 50 percent (5)
About 75 percent (6)
All (all instruction must be live) (7)
I don’t know (8)
Please provide your opinion about each of the following statements in regard to your district learning plan in fall 2020.

PPIC.ORG Technical Appendices Distance Learning Strategies in California Schools 16
Disagree (2) Neither agree nor
disagree (4) Agree (5) I don't know (8)
There is a district wide effort to align
math instruction with the Common
Core math standards (1)
There is a district wide effort to align
ELA instruction with the Common
Core ELA standards (4)
There is a district wide effort to align science instruction
with the Next Generation Science
Standards (5)
There is a district wide effort to align English language
development instruction with the English language
development standards (6)
Please indicate whether each of the following statement applies to your district.
Compared to fall 2019...
Increased (1) About the same (2) Decreased (3) I don't know (4)
The number of math courses being
offered has… (7)

PPIC.ORG Technical Appendices Distance Learning Strategies in California Schools 17
The number of English courses
being offered has… (4)
The number of science courses
being offered has … (5)
The number of English language
development courses being offered has …
(6)
Has your LEA provided any the following professional development for teachers since spring 2020 school closures? (select all that apply)
Technology platforms for remote instruction (1)
Instructional methods for distance learning (9)
Instructional methods for English Learner students for distance learning (10)
Instructional methods for students with disabilities for distance learning (11)
Other (please specify) (12) ________________________________________________
I don’t know (13)
Aside from district communications, how have teachers and staff communicated with students’ families during distance learning? (select all that apply)
Text (10)
Email (11)
Phone (12)
Video calls (e.g., Zoom, FaceTime, Skype, Google Meet) (13)
Social media (e.g., Facebook) (15)
Other (please describe) (14) ________________________________________________
Not aware of teachers/staff communicating with families (9)
Does you LEA use any assessments to measure student learning in fall 2020?
Yes (1)
No (4)
I don’t know (5)

PPIC.ORG Technical Appendices Distance Learning Strategies in California Schools 18
Which of the following assessments does your district use to measure student learning in fall 2020? (select all that apply)
SBAC interim assessments, math (1)
SBAC interim assessments, ELA (4)
CAST interim assessments, science (5)
Other CDE-approved diagnostic assessments (e.g., Easy CBM, MAP, iReady) (6)
Teacher/District developed assessments (7)
ELPAC summative assessment for English Learners (8)
Other (please specify) (9) ________________________________________________
I don’t know (10)
Is your district administering any assessments to place students into 9th grade math courses?
No (1)
Yes, in-person (4)
Yes, but remotely (5)
Yes, both in-person and remotely (6)
I don’t know (7)
How familiar are you with your LEA’s policies and programs concerning English Learners?
Not at all familiar (1)
Slightly familiar (4)
Somewhat familiar (5)
Very familiar (6)
Does the district provide separate or additional educational resources for English Learners during distance learning?
Yes (1)
No (4)
I don’t know (5)
What additional resources are being provided to English Learners? (please check all that apply)
extra time with ELD teacher/aide (1)
small group instruction (4)
formative/diagnostic assessments for ELs (5)
extra instructional materials for students (6)
extra material for families translated into home language (7)

PPIC.ORG Technical Appendices Distance Learning Strategies in California Schools 19
communication (e.g., text, email, phone, zoom) with families in home language (8)
other, please describe (9)
Is your district administering 2019–2020 ELPAC summative assessment?
No (1)
Yes, in-person (4)
Yes, remotely (5)
Yes, both in-person and remotely (6)
I don’t know (7)
Which English learners are taking 2019–20 ELPAC summative assessment?
All English Learners (1)
Just those English Learners otherwise eligible for reclassification (4)
Other (please specify) (5) ________________________________________________
I don’t know (6)
How did the district determine ELD course placement for EL students this fall? How familiar are you with your LEA’s policies and programs concerning special education students?
Not at all familiar (1)
Slightly familiar (4)
Somewhat familiar (5)
Very familiar (6)
Does the district provide separate or additional educational resources for students with disabilities during distance learning?
Yes (1)
No (4)
I don’t know (5)
What sorts of additional resources are being provided to students with disabilities? (select all that apply)
Assistive technology (1)
Small group instruction (4)
Occupational therapy (5)
Physical therapy (6)
in-person (home or school) IEP meetings, evaluations, and related services (7)
communication (e.g., text, email, phone, zoom) with families (8)

PPIC.ORG Technical Appendices Distance Learning Strategies in California Schools 20
Other, please describe (9) ________________________________________________
Compared to spring 2020, how has your district improved in the following areas?
Worse (1) Unchanged (2) Improved (4) I don't know (5)
Providing internet and/or device access
(1)
Maintaining regular contacts with
students and their families (5)
Instruction (synchronous and asynchronous) (6)
Monitoring student attendance (7)
Grading student work (8)
Assessing student learning outcomes
(9)
Providing meal services to students
(10)
Providing support services to English
learners (11)
Providing support services to students
with special education needs (12)
Providing training to teachers,

PPIC.ORG Technical Appendices Distance Learning Strategies in California Schools 21
administrators, and support staff (13)
In your opinion, how well did your district handle distance learning during spring 2020? Very well (1)
Well (4)
Adequately (5)
Poorly (6)
Very poorly (7)
How familiar are you with your district's science education?
Not at all familiar (1)
Slightly familiar (2)
Somewhat familiar (3)
Very familiar (4)
To what extent is science a priority in your district's distance learning in fall 2020?
Not a priority (1)
Somewhat priority (2)
Moderate priority (3)
High priority (4)
Which of the following best describes your district's budget for science education during 2020–21?
About the same as 2019–20 (1)
Lower than 2019–20 (2)
Higher than 2019–20 (3)
I don't know (4)
Does your district plan to cut science programs or services in 2020–21?
Yes (1)
No (2)
I don't know (4)
How will the new financial constraints impact your district's goals for science education?
No significant impact (1)
Minor impact (3)
Moderate impact (4)

PPIC.ORG Technical Appendices Distance Learning Strategies in California Schools 22
Major impact (5)
In the next few questions, we ask about your district’s budget decisions.
In response to the COVID-19 pandemic, what did your district spend money on: (in excess of normal costs)
School safety (e.g., sanitation, cleaning, and disinfection of school buildings, additional janitorial staff and time, personal protection equipment) (1)
Distance learning toolkits (e.g., BrainPop, Synergy) (4)
Professional development for staff (5)
Devices and home connectivity for students and staff (6)
Meal services for students (7)
Other COVID-19 related expenditures (please specify) (8) ________________________________________________
I don’t know (9)
How were these expenditures financed? (select all that apply)
By cutting expenditures on other programs (1)
By reducing staff hours, salaries, or benefits (4)
By deferring maintenance or renovation of existing facilities (5)
By finding savings in the budget without decreasing services (e.g. efficiencies) (6)
By relying on reserves or savings (7)
By finding new revenue sources (e.g. donations) (8)
Federal and state COVID mitigation funds (9)
Using cost savings from no/reduced in-person operations (10)
Other (please specify) (11) ________________________________________________
I don’t know (12)
Which of the following best describes your district’s budget for 2020-21?
About the same as 2019-20 (1)
Lower than 2019-20 (4)
Higher than 2019-20 (5)
I don’t know (6)
What current programs, services, activities, and/or initiatives do you feel the district should maintain as a high priority for the 2020-21 school year?
Technology access (e.g., internet access and devices) (1)
After school or enrichment programs (4)
Teacher recruitment, PD and or retention (5)

PPIC.ORG Technical Appendices Distance Learning Strategies in California Schools 23
Mitigating learning loss (6)
Providing adequate resources to schools, educators, and students. (7)
Maintaining and enhancing programming and supports for students (8)
Maintaining reasonable class sizes (9)
Aging infrastructural needs (10)
Programs for English learners, special education students and/or foster students (11)
Students social-emotional well-being (12)
Other, please specify (13) _____________________________________________

The Public Policy Institute of California is dedicated to informing and improving public policy in California through independent, objective, nonpartisan research.
Public Policy Institute of California 500 Washington Street, Suite 600 San Francisco, CA 94111 T: 415.291.4400 F: 415.291.4401 PPIC.ORG
PPIC Sacramento Center Senator Office Building 1121 L Street, Suite 801 Sacramento, CA 95814 T: 916.440.1120 F: 916.440.1121