tools and strategies - rural & distance education - cap nsw
TRANSCRIPT

TOOLS AND
STRATEGIES
Table of Contents
Preface.............................................................................................................................. 4

Tools and Strategies (version 2.0) © NSW Country Areas Program Page 2 of 76
Action Plan........................................................................................................................ 4
Affinity Diagram ................................................................................................................ 6
Alphabet key ..................................................................................................................... 8
Appointment Clock............................................................................................................ 9
The B A R Key .................................................................................................................. 10
Bloom's Taxonomy .......................................................................................................... 11
Bone Diagram.................................................................................................................. 12
Brainstorm ...................................................................................................................... 14
Bubble/ Double Bubble ................................................................................................... 16
Capacity Matrix ............................................................................................................... 17
Cluster diagrams.............................................................................................................. 18
Combination Key ............................................................................................................. 19
COMPARE and CONTRAST GRID. ..................................................................................... 20
Consensogram................................................................................................................. 21
Fishbone Diagram............................................................................................................ 22
Fish Philosophy ............................................................................................................... 24
Five Whys........................................................................................................................ 26
Flow chart ....................................................................................................................... 27
Force Field Analysis ......................................................................................................... 28
Gantt Chart ..................................................................................................................... 29
Global Café...................................................................................................................... 30
Hot Potato....................................................................................................................... 31
Human Graph.................................................................................................................. 33
Internet Search Techniques ............................................................................................. 34
Interpretation Key........................................................................................................... 35
Invention Key .................................................................................................................. 36
Jigsaw.............................................................................................................................. 37
KWL................................................................................................................................. 39
Lotus Diagram ................................................................................................................. 40
Mind Map ....................................................................................................................... 41
Model Mapping............................................................................................................... 41
Multiple Intelligences ...................................................................................................... 43

Tools and Strategies (version 2.0) © NSW Country Areas Program Page 3 of 76
Multi-‐voting .................................................................................................................... 44
NGT (Nominal Group Technique)..................................................................................... 47
Pairing............................................................................................................................. 48
Parking Lot ...................................................................................................................... 50
PCQ ............................................................................................................................... 51
Placemat Consensus ........................................................................................................ 52
Plus/Delta ....................................................................................................................... 53
PMI ................................................................................................................................. 54
POPE ............................................................................................................................... 55
Question Matrix .............................................................................................................. 56
Radar Chart ..................................................................................................................... 57
Right Angled Thinking...................................................................................................... 59
Reverse Key..................................................................................................................... 60
Review, Review, Review.................................................................................................. 61
Six Thinking Hats ............................................................................................................. 62
Stay and Stray ................................................................................................................. 64
SWOT .............................................................................................................................. 66
SCAMPER ........................................................................................................................ 67
Think Pair Share .............................................................................................................. 69
Venn Diagram ................................................................................................................. 70
Walk and Talk.................................................................................................................. 71
What If Key ..................................................................................................................... 72
WIFLE – (What If I Feel Like Expressing) ......................................................................... 73
WOEDIL -‐ (What On Earth Did I Learn) ............................................................................. 74
Y-‐Chart ............................................................................................................................ 75

Tools and Strategies (version 2.0) © NSW Country Areas Program Page 4 of 76
Preface This document is a compendium of the tools and strategies that were previously published as individual web pages and documents on the previous CAP website.
It is a collection of resources that have been sourced from a wide range of teachers and thinkers over the years. In particular the Thinking Keys strategies are reprinted from publications with kind permission from Tony Ryan Many thanks Tony!
This is a fluid document that will evolve over time. We hope you find it useful.
Regards
NSW Country Areas Program Team.
Friday, 11 February 2011

Tools and Strategies (version 2.0) © NSW Country Areas Program Page 5 of 76
Action Plan
Steps that must be taken, or activities that must be performed well, for a strategy to succeed. An action plan has three major elements:
(1) Specific tasks: what will be done and by whom.
(2) Time horizon: when will it be done.
(3) Resource allocation: what specific funds are available for specific activities. Also called action program.
A description of what needs to be done, when and by whom to achieve the results called for by one or more objectives. It contains task assignments, schedules, resource allocations and evaluation criteria. May be a simpler version of a project plan.
A corrective action plan is step-by-step plan of action and schedule for correcting a process or a quality issue.
Tools and Strategies (version 2.0) © NSW Country Areas Program Page 6 of 76
Affinity Diagram
What
The Affinity Diagram is an interactive data collection method, which enables the identification and sorting of large quantities of ideas within a short time frame. Affinity means likeness or close relationship.
When
The Affinity is used when a non-judgemental process is required for gathering and categorizing ideas
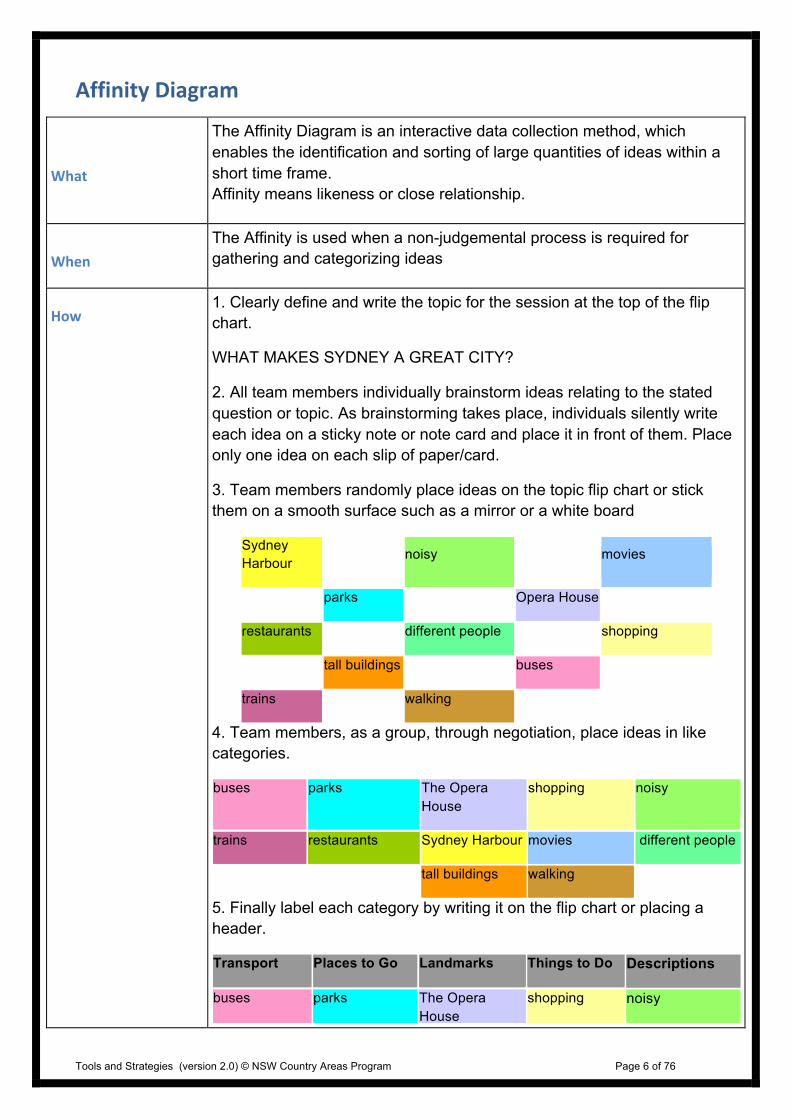
How 1. Clearly define and write the topic for the session at the top of the flip chart.
WHAT MAKES SYDNEY A GREAT CITY?
2. All team members individually brainstorm ideas relating to the stated question or topic. As brainstorming takes place, individuals silently write each idea on a sticky note or note card and place it in front of them. Place only one idea on each slip of paper/card.
3. Team members randomly place ideas on the topic flip chart or stick them on a smooth surface such as a mirror or a white board
Sydney Harbour
noisy movies
parks Opera House
restaurants different people shopping
tall buildings buses
trains walking
4. Team members, as a group, through negotiation, place ideas in like categories.
buses parks The Opera House
shopping noisy
trains restaurants Sydney Harbour movies different people
tall buildings walking
5. Finally label each category by writing it on the flip chart or placing a header.
Transport Places to Go Landmarks Things to Do Descriptions
buses parks The Opera House
shopping noisy

Tools and Strategies (version 2.0) © NSW Country Areas Program Page 7 of 76
House
trains restaurants Sydney Harbour movies different people
tall buildings walking
Samples
Types of Questions which could be supported by the use of an Affinity Diagram What makes a quality classroom? What are the causes of our poor performance? What do I already know about frogs?

Tools and Strategies (version 2.0) © NSW Country Areas Program Page 8 of 76
Alphabet key
Alphabet Key The ALPHABET Key
Choose an object or general category of objects which features in the area of study and compile a list of words from A to Z which have some relevance to the object/s. Then try to expand on some ideas which link with each of the words.
THE JUSTIFICATION:
Using the alphabetical format clarifies students’ thinking. It is a sorting process which is made easier by considering one aspect at a time.
THE EXAMPLE:
Sport (specifically tennis)
A. Antbed courts - does this mean that ants can play tennis while in bed?; perhaps a miniature game of tennis could be devised as a board game, with each of the players being activated by remote control.
B. Bouncing - could tennis racquets be constructed of a special rubber so that they could bounce as well?; this feature could be included in a new version of tennis. Perhaps the rules would require each player to bounce the racquet after every shot is played.
Then continue with C through to Z. If the students draw a blank with a particular letter, simply move on, and return to that letter at a later stage.
In a more simplified version, merely list single objects from A to Z, e.g. Foods:
A - artichoke B - beetroot etc.

Tools and Strategies (version 2.0) © NSW Country Areas Program Page 9 of 76
Appointment Clock
What The Appointment Clock is a tool to organise partners in a class.
When Useful for cooporate learning opportunities, pair/share activities.
How Each student is given an appointment clock. They walk around and ask a different person to make appointments on each hour. Write the person's name on the given line for that time. Teacher can now ask: "Find your 11:00 appointment and . . .(given task)." For odd numbers some groups could have three participants per appointment.

Tools and Strategies (version 2.0) © NSW Country Areas Program Page 10 of 76
The B A R Key
BAR Key The B A R Key
The following acronym, or ladder of words, can be used by different age groups (ranging from Yr 1 to adults) to reinvent or redesign everyday objects.
THE JUSTIFICATION:
A practical step-by-step strategy for developing innovative and highly unusual products. This type of strategy is often used in today’s high tech product development laboratories to create new products for the market.
The Ladder is:
Bigger
Add
Replace
THE EXAMPLE:
B A R a skateboard. Ask the students to draw a standard skateboard, and then direct them through the steps one at a time.
Here's one series of possibilities:
B igger Extend the rear of the skateboard, making it much bigger, and put some shelves on it for storage space. Place a counterweight on the front to balance it out.
A dd Add a small rocket motor, which can be controlled with a foot throttle near the back of the skateboard.
R eplace Replace the wheels with a small hovercraft unit, which is controlled by a hand-held rotating device. It is very important that SILLY and INNOVATIVE ideas are encouraged. Very few new ideas emerge from predictable and tedious efforts.
Tools and Strategies (version 2.0) © NSW Country Areas Program Page 11 of 76
Bloom's Taxonomy
What
Bloom's Revised Taxonomy of cognitive objectives is one of the best ways to differentiate the curriculum to meet the needs of your students. Because of its six levels of thinking, Bloom's Revised Taxonomy can provide a framework for planning units that incorporate low to high-level thinking activities. Therefore, when we use
When
A tool for categorising the level of abstraction of questions. Bloom’s Taxonomy is used for teaching critical thinking skills. Educators can use the Blooms' Taxonomy as a planning framework to plan for student thinking at all levels.
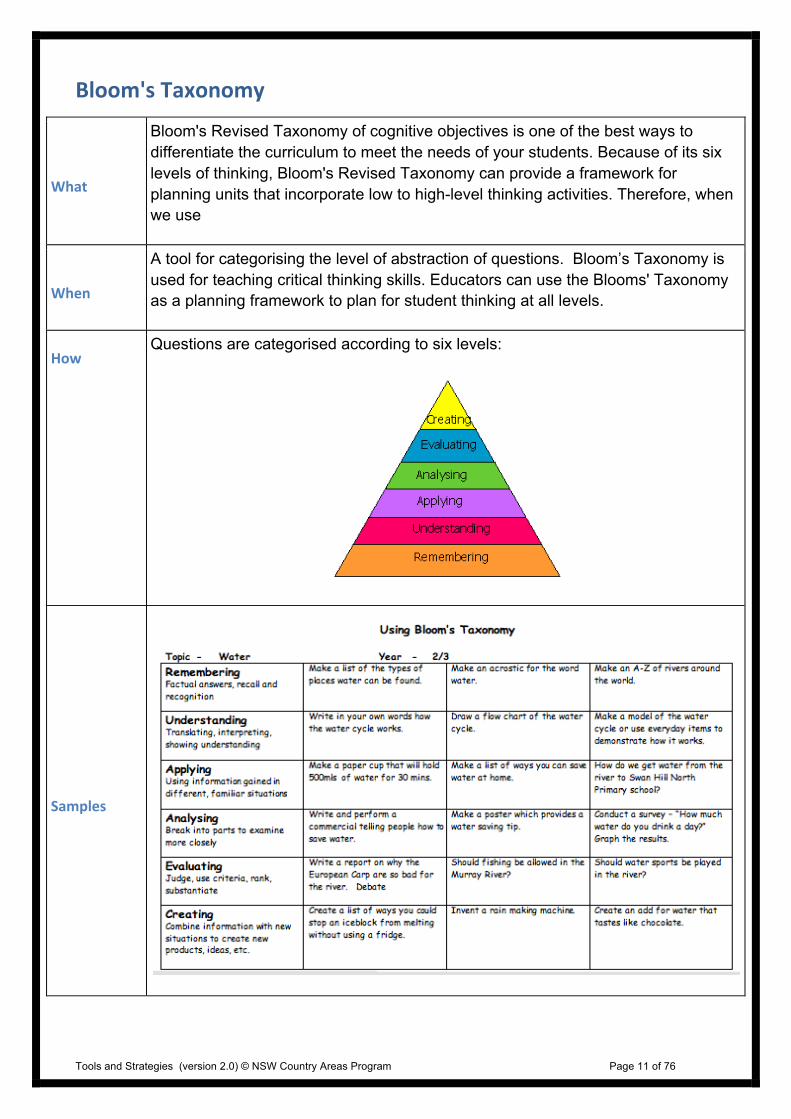
How Questions are categorised according to six levels:
Samples
Tools and Strategies (version 2.0) © NSW Country Areas Program Page 12 of 76
Bone Diagram
What George Noyes from the Defence Systems Management College Fort Belvoir Virginia designed the Bone Diagram.
A Bone Diagram allows us to reflect on our current situation as well as plan or visualise a future or desired situation. The Bone Diagram is a helpful tool in developing a big picture or future concept whilst providing a mechanism to assist teams or groups in moving from where they are currently situated towards achieving that “big picture” or desired situation.
Why
The tool encourages inclusively and creativity, provides a great opportunity for reflection and allows for clarity in planning
How How does it work?
1. Draw a large bone or shapes representing a bone onto a whiteboard or paper
2. Brainstorm ideas which represent the current situation in the lower section of the bone
3. Have the group brainstorm ideas that they identify as a desired situation or “the picture” they would like to see happening in the upper section of the bone
4. Identify the positive forces that will help the growth of the “bigger picture” and place on the upper left side of the bone
5. In the lower right section identify and list the forces, which will inhibit growth of the future or “big picture”.
6. Prioritise the negative forces using a ranking or voting system.
7. Select those issues which will need to be worked on if the desired state is to be achieved
Samples
* Use to have students determine the optimum behaviour for a classroom
* Use for the development of a school vision statement
* Use as a tool for students to determine their goals

Tools and Strategies (version 2.0) © NSW Country Areas Program Page 13 of 76
TOPIC/TITLE
+ DRIVING FORCES
- RESTRAINING FORCES

Tools and Strategies (version 2.0) © NSW Country Areas Program Page 14 of 76
Brainstorm
What
Brainstorming is the free, uninhabited generation of ideas, usually in a group setting. The key to a successful brainstorm is to provide an environment free of criticism, where each person can present or state their opinions. A brainstorm is used to explore or develop ideas and can be used at all levels from kindergarten to executive levels. It’s a great way to break away from old ideas and to explore new thinking.
Why
This tool is a simple strategy, which :
* Can produce a large number of ideas in a short time * Encourages inclusively by enabling everyone an equal say * Encourages creativity through stimulating the expansion of ideas * Ensures a sense of ownership as all participants will see their ideas included in the list
How *Select group facilitator and or a recorder
*A time limit is set
*Participants are invited to give their ideas. This can be done in a structured manner where each person is asked to contribute and nominates to PASS if they cannot think of an idea when it is their turn, or alternately participants can freely call out their ideas.
*ALL ideas are recorded and displayed exactly as they have been stated
*No judgments (neither positive or negative) are allowed by either the facilitator or other participants
*After the brainstorm, go over the list to make sure that all group understand the ideas. Remember this is only a clarification time not an opportunity for comment
*Eliminate duplication
*Brainstorming acts as a springboard for other tools such as the Fishbone, Motivating, Affinity Diagram
Samples
What can be done to reduce graffiti in the school toilets?
What are the behaviours expected of a good student leader?
How can we improve the information flow within our organisation?

Tools and Strategies (version 2.0) © NSW Country Areas Program Page 15 of 76

Tools and Strategies (version 2.0) © NSW Country Areas Program Page 16 of 76
Bubble/ Double Bubble
What
The Double Bubble Map is a visual organising tool. It is similar in concept to a Venn Diagram
When
The Double Bubble is used to compare and contrast, situations, places, an issues or items and objects.
How 1. Two bubbles or circles are drawn in the centre of a page.
2. The two concepts to be compared and contrasted are each placed in one of the bubbles
3. Smaller bubbles are drawn outside of the two larger bubbles. These bubbles show the qualities they share with only one of the larger bubbles. (These are the contrasting aspects or qualities) 4. The bubbles between the two items being compared will hold the items which are similar.
Samples
Simple examples could include Comparing and contrasting
Mum and Dad
Day and Night
Two of the latest movies
Vietnam War and the War on Terror
Baby Boomers and Generation X
Tools and Strategies (version 2.0) © NSW Country Areas Program Page 17 of 76
Capacity Matrix
What
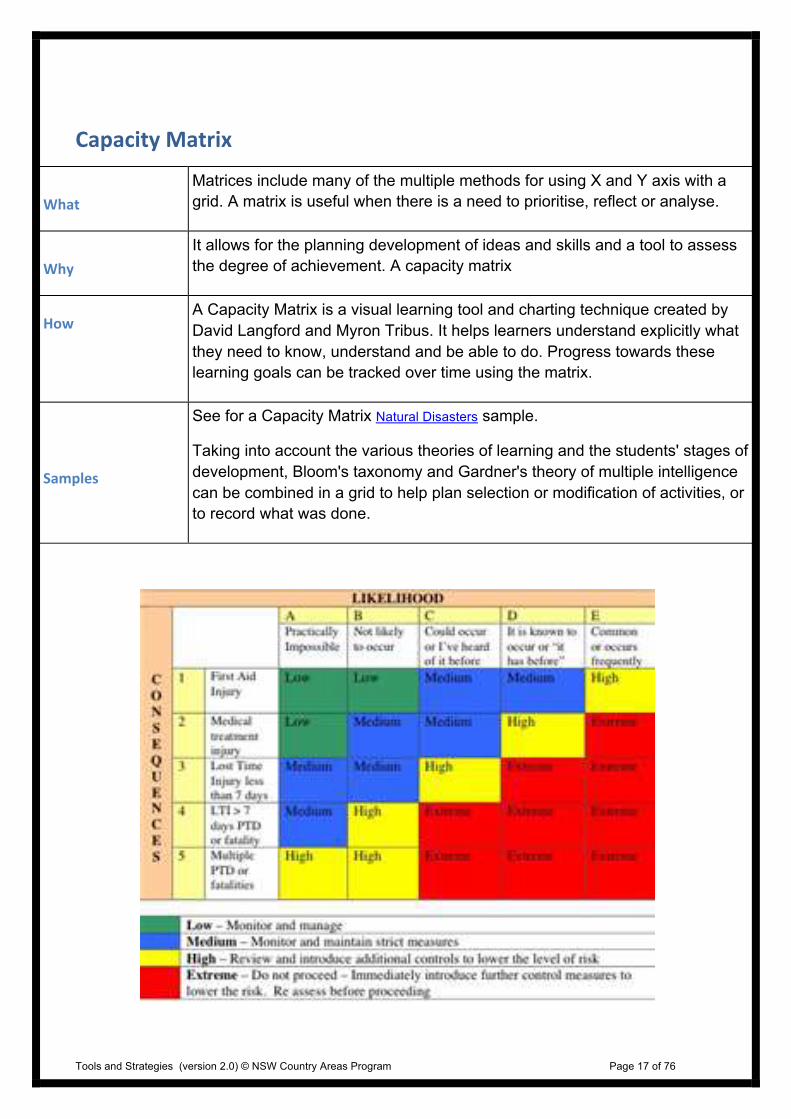
Matrices include many of the multiple methods for using X and Y axis with a grid. A matrix is useful when there is a need to prioritise, reflect or analyse.
Why
It allows for the planning development of ideas and skills and a tool to assess the degree of achievement. A capacity matrix
How A Capacity Matrix is a visual learning tool and charting technique created by David Langford and Myron Tribus. It helps learners understand explicitly what they need to know, understand and be able to do. Progress towards these learning goals can be tracked over time using the matrix.
Samples
See for a Capacity Matrix Natural Disasters sample.
Taking into account the various theories of learning and the students' stages of development, Bloom's taxonomy and Gardner's theory of multiple intelligence can be combined in a grid to help plan selection or modification of activities, or to record what was done.

Tools and Strategies (version 2.0) © NSW Country Areas Program Page 18 of 76
Cluster diagrams
What
Cluster diagrams (also called cloud diagrams) are a type of non-linear graphic organiser that can help to systematize the generation of ideas based upon a central topic.
When
Using this type of diagram, the student can more easily brainstorm a theme, associate about an idea, or explore a new subject.
How The cluster diagram can be generated electronically or manually, sorting research and organising topics and sub-topics.
Samples
TOPIC

Tools and Strategies (version 2.0) © NSW Country Areas Program Page 19 of 76
Combination Key
Combination Key List the attributes of 2 dissimilar objects (one within your area of study, one outside), then combine the attributes into a single object. THE JUSTIFICATION: Many important inventions, such as the disposable razor (the concept of loading bullets into a rifle, combined with a normal razor) and the first printing press (the wine press and the coin punch) were created in this way. THE EXAMPLE: A leaf and a mousetrap.
The Leaf The Mousetrap
They change colours through the year.
They are made of wood and wire
Insects often eat them. They can kill mice.
There are millions of them. They can be left in lots of places.
THE COMBINATIONS: 1. A miniature mousetrap for placing on leaves, that can kill insects when they try to eat the leaf. 2. Mousetraps that can change colour and blend in with the surface on which they are placed.

Tools and Strategies (version 2.0) © NSW Country Areas Program Page 20 of 76
COMPARE and CONTRAST GRID.
What
Comparison-Contrast Charts are for looking at how things are similar and in what ways they are different.
When A useful tool when comparing data, surveys, a variety of criteria.
How Decide on items or things you want to compare.
Decide on the qualities or characteristics to compare.
First you look at the similarities.
Then you consider the differences
Making sure to indicate on what criteria you are drawing out the dissimilarities.
Samples

Tools and Strategies (version 2.0) © NSW Country Areas Program Page 21 of 76
Consensogram
What
Consensogram is a tool used to identify a knowledge level or opinion that a student has on a topic. It is a way to quickly measure readiness levels of students based on student’s own self-evaluation.
When
When you want to know how comfortable students are with a topic.
· When you want to survey and compare opinions.
· To gain insight into how much children know about a topic before or after learning new material.
How Ask students to rate themselves on a scale of 1 to 10 on the topic of discussion. A 1 means "I know nothing about this topic" and a 10 means "I can teach the class about this topic." Allow students to place a marker on the chart as to where their comfort level is. After the lesson, allow students to revisit the Consensogram and rate themselves again. This is an easy way for the teacher to see if more instruction is needed.
Samples

Tools and Strategies (version 2.0) © NSW Country Areas Program Page 22 of 76
Fishbone Diagram
What
The Fishbone Diagram or the Ishikawa Diagram, also known as the Cause-and-Effect Diagram, is a tool used for identifying and presenting the possible causes of a particular problem in visual format.
Why
The Fishbone is employed as a tool for collating information relating to the causes of the problem which needs addressing. It is a systematic and visual approach with the input for the diagram usually coming from a brainstorming session. It enables a team or group to focus on why the problem occurs, and not on the history or symptoms of the problem, or other topics that can cause a group to digress from the discussion. It also a great tool to capture a 'snap-shot' of the collective thoughts of the group as a whole.
How The Diagram resembles a fishbone in its construction - it has a box (the 'fish head') that contains the statement of the problem at one end. From this box originates the 'fish spine' or the main branch of the diagram. Sticking out of the spine are the bones where major causes are organized. Minor causes are placed along these bones. Experienced users of the diagram often add more branches.
How does this tool operate?
1. Prepare the basic framework of the Fishbone Diagram on a a whiteboard or a flipchart;
2. Define the problem that needs to be addressed and write it in clear and simple terms in the fish head of the diagram;
3. Collaboratively define the categories of the major branches and write these at the tips of the major bones. These headings could be developed through a brainstorming session or from using an Affinity Diagram, which focuses on the problem in the fish’s head.
4. Tease out the Major Causes by further brainstorming adding these ideas and suggestions to the smaller bones on the diagram. 5. Interpret the Fishbone Diagram once it's finished.
There are many ways to interpret the Fishbone Diagram.
The fastest and simplest way to do this is to have the group prioritise or for the group to choose the top five causes on the diagram and rank them

Tools and Strategies (version 2.0) © NSW Country Areas Program Page 23 of 76
How The Diagram resembles a fishbone in its construction - it has a box (the 'fish head') that contains the statement of the problem at one end. From this box originates the 'fish spine' or the main branch of the diagram. Sticking out of the spine are the bones where major causes are organized. Minor causes are placed along these bones. Experienced users of the diagram often add more branches.
How does this tool operate?
1. Prepare the basic framework of the Fishbone Diagram on a a whiteboard or a flipchart;
2. Define the problem that needs to be addressed and write it in clear and simple terms in the fish head of the diagram;
3. Collaboratively define the categories of the major branches and write these at the tips of the major bones. These headings could be developed through a brainstorming session or from using an Affinity Diagram, which focuses on the problem in the fish’s head.
4. Tease out the Major Causes by further brainstorming adding these ideas and suggestions to the smaller bones on the diagram. 5. Interpret the Fishbone Diagram once it's finished.
There are many ways to interpret the Fishbone Diagram.
The fastest and simplest way to do this is to have the group prioritise or for the group to choose the top five causes on the diagram and rank them
The selection of the major causes may be done by voting or any other process that allows the group to agree on the ranking. The selected causes are then encircled on the diagram, with their ranks written beside them.
Once identified the facilitator will need to determine a process to enable further investigation of these causes.
Samples
* Study the causes of global warming * Investigate the causes of poor participation * Study the causes for poor results in the HSC * Study the causes for our rivers drying up

Tools and Strategies (version 2.0) © NSW Country Areas Program Page 24 of 76
Fish Philosophy
The Fish Philosophy is a set of simple, interconnected principles that everyone can tailor to their own life and work – old wisdom for a new day. When you choose to incorporate these principles – Play, Be There, Choose Your Attitude and Make Someone’s Day – you’ll see a positive change in the relationships you create at work and at home. The underlying view of the Fish Philosophy is that meaningful learning occurs, when the learner is directly linked to and involved with, the content being presented.
PLAY Everyone can benefit from a little lightening up during the day. People who find ways to incorporate
play into their daily lives approach their work, responsibilities and challenges with energy and enthusiasm. Some of the best innovations come from playing with ideas. Playfulness allows us to tap
into our inner being - the child inside all of us. It is that person who won’t hesitate to ask “why” or “how come”. It is the person who looks at the world creatively and openly and who never hesitates to
see the humour in it all.
BE THERE To “Be There” for another person has a powerful effect as it is about giving others our undivided
attention. Listening is a big part of being there but it’s more than that. Too often we listen like we are in a debate, our minds focused on gathering information for our own brilliant comeback, rather than being emotionally as well as physically present. It is difficult to hear what another person is saying if
our minds are stuck on what we want to hear. Being truly present means suspending judgement while you’re listening and realising that this takes awareness, commitment and practise.
Tools and Strategies (version 2.0) © NSW Country Areas Program Page 25 of 76
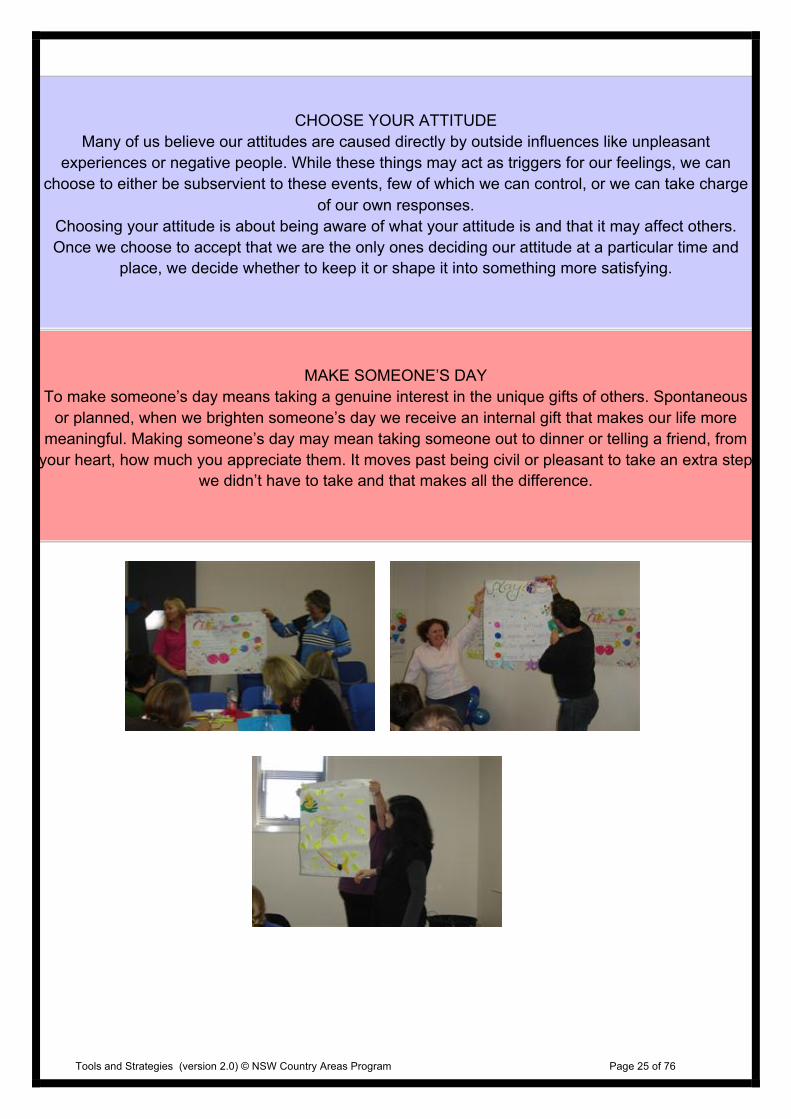
CHOOSE YOUR ATTITUDE Many of us believe our attitudes are caused directly by outside influences like unpleasant
experiences or negative people. While these things may act as triggers for our feelings, we can choose to either be subservient to these events, few of which we can control, or we can take charge
of our own responses. Choosing your attitude is about being aware of what your attitude is and that it may affect others. Once we choose to accept that we are the only ones deciding our attitude at a particular time and
place, we decide whether to keep it or shape it into something more satisfying.
MAKE SOMEONE’S DAY To make someone’s day means taking a genuine interest in the unique gifts of others. Spontaneous
or planned, when we brighten someone’s day we receive an internal gift that makes our life more meaningful. Making someone’s day may mean taking someone out to dinner or telling a friend, from
your heart, how much you appreciate them. It moves past being civil or pleasant to take an extra step we didn’t have to take and that makes all the difference.

Tools and Strategies (version 2.0) © NSW Country Areas Program Page 26 of 76
Five Whys
What Five Whys
When At any time to promote deep thinking through questioning
Process To employ a "Five Whys” a question, problem or issue is asked. This is answered by asking "why ?".
The answer then becomes the question and 'why' is then asked again
The process is repeated five times with the final answer providing a deeper example of student thinking.
Example:
Q. Why am I returning to Year 11? A. Because I would like to attain my Higher School Certificate.
Q Why do I want to receive my Higher School Certificate? A. Because I would like to study Art at the University?
Q. Why would I like to study Art at the University? A. Because it it will allow me to gain employment in an area I am particularly interested in.
Q. Why is important to gain employment in an area I am interested in? A. This will enable me to have job and personal satisfaction
Q. Why is important for me to have job and personal satisfaction? A. So that my life will be more fulfilling

Tools and Strategies (version 2.0) © NSW Country Areas Program Page 27 of 76
Flow chart
What
A Flow chart is a diagrammatic representation or visual depiction of a set of steps that clearly guide us through a process. Flow charts are made up of different boxes, which each have different functions.
When
Flow charts are used when it is necessary to have a common language and approach to process or project. Flow charts are a systematic approach to clarify a process.
How 1. Flow charts tend to use simple and easily recognisable symbols
2.Clearly define the starting and stopping points of the process
3.Gather or Brainstorm the tasks and actions involved in the process
4. Use symbols to document the flow of the processes
5. Place/ document the symbols according to the order of the process
6. Connect the symbols with an arrow pointing to the next symbol in the sequence of the process 7. Review the flow chart to determine how where and when the process can be improved
Samples
Flow Charts can be used to:
plan an event, project or activity which involves a series of tasks
document a process that requires a systematic approach
examine how various steps in a process work together
stream-line administration and or organisation in a school or business
ensure students understand the steps to be taken in an activity or task

Tools and Strategies (version 2.0) © NSW Country Areas Program Page 28 of 76
Force Field Analysis
Force field analysis is an influential development in the field of social science. It provides a framework for looking at the factors (forces) that influence a situation, originally social situations. It looks at forces that are either driving movement toward a goal (helping forces) or blocking movement toward a goal (hindering forces).
Tools and Strategies (version 2.0) © NSW Country Areas Program Page 29 of 76
Gantt Chart
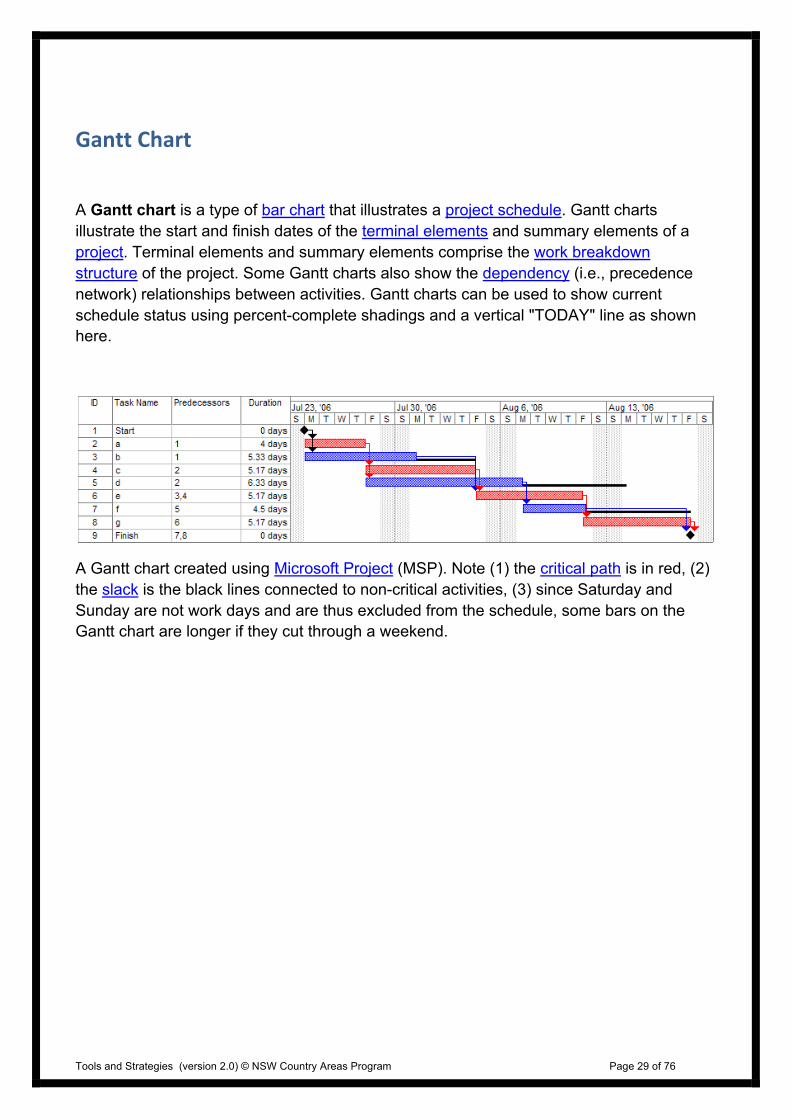
A Gantt chart is a type of bar chart that illustrates a project schedule. Gantt charts illustrate the start and finish dates of the terminal elements and summary elements of a project. Terminal elements and summary elements comprise the work breakdown structure of the project. Some Gantt charts also show the dependency (i.e., precedence network) relationships between activities. Gantt charts can be used to show current schedule status using percent-complete shadings and a vertical "TODAY" line as shown here.
A Gantt chart created using Microsoft Project (MSP). Note (1) the critical path is in red, (2) the slack is the black lines connected to non-critical activities, (3) since Saturday and Sunday are not work days and are thus excluded from the schedule, some bars on the Gantt chart are longer if they cut through a weekend.

Tools and Strategies (version 2.0) © NSW Country Areas Program Page 30 of 76
Global Café
What Global Cafe
When This strategy is a cooperative learning strategy that allows students/participants to gather and share information quickly. It also allows students to piggyback ideas, thoughts and experiences.
Process • Students form random groups of between of 4-8
• Each group labels their café location with a name
• Assign a recorder to each group. This person remains at the table
throughout the entire process and records the conversation as authentically as possible.
• Students are given a topic to discuss. Topics can be the new learning point, a review of previously learnt information or a reflection of understanding up to this point
• At table groups, the conversation flows as in a coffee shop with students sharing factual information, opinion, and personal experiences related to the topic. The recorder can contribute while capturing the key aspects of the conversation.
• Every 5 to 8 minutes, students randomly move to a new coffee shop. New groups at coffee shops are formed with different members.
• When the new coffee shop groups is formed, the recorder shares the key aspects of previous conversations. This new group continues with conversing about the topic while the recorder takes notes.
• This process can be continued for 3 to 5 movements.
• The activity concludes with feedback from each recorder on interesting points.
• Ideas from here • Create a list of interesting points • Multivote the most important points and use these to build learning
opportunities • Gather facts about the topic, force field etc

Tools and Strategies (version 2.0) © NSW Country Areas Program Page 31 of 76
Hot Potato
What This strategy (Diagram 2) involves the use of a ‘round robin’ format in developing and sharing information within a group.
Why Hot Potato encourages team members to pass their work onto other people in their group.
How 1. Divide into teams containing an equal number of members, if possible.
2. Ask each of the teams to sit in a circle, so that sheets of paper can be easily passed from one person to the next.
3. Provide each team member with a sheet of paper for recording their ideas.
4. Assign a particular task to all teams eg develop a list of proposals for beautifying the school grounds.
5. Each team member then records as many ideas as possible in a set time eg two minutes.
6. On the appointed signal eg a ringing bell, they pass their sheet to the next person.
7. That person then reads the ideas in front of them, and proceeds to add some more ideas to that sheet, again within two minutes.
This process of passing the ‘Hot Potato’ continues until each team member ends up with their original sheet. All students should be reminded that once an idea has been recorded, or an idea has been read on another sheet, it cannot be written down a second time. No repeats are allowed. Although groups of four or five students tend to work best, this structure is capable of working with virtually any group size.
Variations
Instead of allowing one piece of paper for each team member, give a single sheet to the entire team. The first person then writes an idea onto the sheet, and passes it onto the next person, who does the same. This then continues all of the way around the group.
Ideas can also be rotated between different teams rather than the individuals in each team. To establish this rotation:
a. Appoint a recorder for each team, who is responsible for writing down all of the ideas given by their team.
b. Each team can then brainstorm ideas on a particular topic eg how to

Tools and Strategies (version 2.0) © NSW Country Areas Program Page 32 of 76
get Frisbees down from the roof. This can be undertaken in a set period of time, perhaps three minutes.
c. At the end of this time, each team rotates their ideas onto the next team. After reading out the ideas on that sheet, the team then attempts to add some further ideas.

Tools and Strategies (version 2.0) © NSW Country Areas Program Page 33 of 76
Human Graph
What Human Graph
Why
This is a strategy is a physical process to gain an understanding of the scope of the individual and group knowledge. This strategy is allows the facilitator/teacher to quickly gain an overview of the current level of knowledge of individuals and the group. It also allows individuals to think about and evaluate their level of knowledge. It can also be used to show learning growth when used throughout the learning process.
How 1. Ask the students/participants to think about there level of knowledge and understanding of a particular topic.
2. Ask the students/participants to stand in a line that represents a continuum of knowledge 1 to 100. 1 being very little or no knowledge of the topic and 100 being expert.
3. Teacher and students/participants can then gain a visual representation of current knowledge and understanding.
4. Learning activities can then be pitched according to the knowledge eg whole group learning, small group learning, individual learning.
Ideas from here
· Participants can be paired form either end of the continuum to from cooperative learning groups so that at least one member of the group has some knowledge.
· Mixed groups can be formed and activities can be facilitated that continues to build on the group knowledge eg Hot Potato, brainstorm,
· Group knowledge can then be display and circulated so that all students/participants have access to this foundation level of information.
· The process can be used again through the learning situation and again at the end to assess the knowledge growth.

Tools and Strategies (version 2.0) © NSW Country Areas Program Page 34 of 76
Internet Search Techniques
Tips for Google, Yahoo!, Exalead, and most other search engines
Use specific terms. Ex: war of 1812 causes, not just history
Use quotes to require an exact phrase. Ex: "one small step for a man"
Use capitalized OR to get either word. Ex: (ucb OR cal) bears
Use - (dash) to exclude a word Ex: proliferation -nuclear
Use "site:" to specify a particular website or Internet domain. Ex:global warming site:whitehouse.gov Ex:immigration attitudes site:edu
Use the "Advanced Search" links for guidance in limiting by language, field, Internet domain, etc.

Tools and Strategies (version 2.0) © NSW Country Areas Program Page 35 of 76
Interpretation Key
Interpretation Key Describe an unusual situation and then think of some different explanations for the existence of that situation. THE JUSTIFICATION: Another innovative thinking exercise. Develops the ability to consider a wide range of consequences. THE EXAMPLE: Your neighbour is making large circles in his backyard by pouring sump oil from a can. Some Explanations:
1. He is a disguised alien and is sending cryptic messages to his friends in outer space.
2. He considers himself to be another Pro Hart, and he will soon be rolling around in the grass, attempting to create an environmental masterpiece.
3. He has had a fixation for circles since his childhood.

Tools and Strategies (version 2.0) © NSW Country Areas Program Page 36 of 76
Invention Key
Invention Key Encourage students to develop inventions which are constructed in an unusual manner. The first step would be to outline the product on paper, which would then lead into possible construction.
THE JUSTIFICATION: Kids (and grownups too) love to invent things if given the opportunity. Tragically, the opportunities in today’s society seem to be growing fewer and fewer. THE EXAMPLE: Invent some or all of the following:
An eggshell peeler.
A combination knife and fork.
Devices which would - catch mosquitoes make your bed do the ironing comb your hair wake you up in the morning

Tools and Strategies (version 2.0) © NSW Country Areas Program Page 37 of 76
Jigsaw
What The Jigsaw strategy encourages the development of specific skills within individual team members.
Why Originally developed by Eliot Aronson, it is perhaps one of the most effective cooperative strategies for promoting responsibility within each of the students in the team.
How Basic Jigsaw:
1. Break into teams of four, and number the members from 1 to 4.
2. Present a mini-project to each team, such as ‘a study of the local community’.
3. Assign specific tasks to each member, such as:
No.1: Collect all available brochures from the local council.
No.2: Research any information available in the school library.
No.3: Construct a large map of the local area.
No.4: Compile a list of goods and services available in the local area.
4. Each of the members then is required to complete their specific task.
5. The team reforms, and the students share their information with each other. This information then can be collated, and the project can be completed.
The most difficult aspect of this strategy will involve the formulation of the specific tasks. It sometimes can also be worthwhile to assign tasks to the students according to the level of difficulty, and the interests of the different students. Extra students could be asked to share a role with someone else in a team. This means that there could be two No.1’s in the team, who could work together on the particular task.
VARIATIONS
One of the most effective variations is known as Expert Jigsaw and it employs the use of Home Teams and Expert Teams. To implement this structure:
1. Form students into Home Teams of four members, and number them from 1 to 4.
2. Introduce the project or activity to the Home Teams eg ‘Design a future home’.

Tools and Strategies (version 2.0) © NSW Country Areas Program Page 38 of 76
3. The specific functions of the Expert Teams are then outlined in the following fashion:
Expert Team 1: Basic design layout of the future home.
Expert Team 2: The furniture.
Expert Team 3: The entertainment facilities.
Expert Team 4: The food preparation process.
4. The Home Teams are then reformed into Expert Teams, which means that all of the
Home Team No.1’s move to Expert Team No.1,
Home TeamNo.2’s into Expert Team No.2, and so on.
5. The Expert Teams then research their specialized area, and develop a range of ideas.
6. Expert Teams then split up, and all members return to their original Home Team. At this stage, there then will be an ‘expert’ on each of the areas, such as ‘furniture’, within each of the Home Teams.
7. By pooling their collective knowledge, the team members then can undertake their original task in a professional manner.

Tools and Strategies (version 2.0) © NSW Country Areas Program Page 39 of 76
KWL
"What I Know" - Starting with what they already know (data and skills) makes good sense. It shows respect, accesses prior knowledge, shows gaps in knowledge, allows mistakes, errors and misconceptions to be aired and generally builds self-esteem individually and as a class. The K column is for supposed facts but not opinion.
"What I Want to Know" - This is an exciting column, where students are encouraged to ask probing and even uncomfortable, "silly" questions, especially when you explain that there is no such thing as a stupid question. Encourage them to be lateral, to ask awkward questions and to probe like a detective, an investigative journalist or a forensic scientist.
"What I Have Learnt" - Record new ideas at the end of a unit. However, one can also challenge the learner to see the bigger picture, related concepts and metaphors. Learners are making sense of new topics in terms of what they already know, making more sense of their learning.
Tools and Strategies (version 2.0) © NSW Country Areas Program Page 40 of 76
Lotus Diagram
The Lotus Diagram is an analytical, organisational tool for breaking broad topics into a number of components, which may be prioritised for implementation.

Tools and Strategies (version 2.0) © NSW Country Areas Program Page 41 of 76
Mind Map
A mind map is a diagram used to represent words, ideas, tasks, or other items linked to and arranged around a central key word or idea. Mind maps are used to generate, visualize, structure, and classify ideas, and as an aid to studying and organizing information, solving problems, making decisions, and writing.
The elements of a given mind map are arranged intuitively according to the importance of the concepts, and are classified into groupings, branches, or areas, with the goal of representing semantic or other connections between portions of information. Mind maps may also aid recall of existing memories.
By presenting ideas in a radial, graphical, non-linear manner, mind maps encourage a brainstorming approach to planning and organizational tasks. Though the branches of a mindmap represent hierarchical tree structures, their radial arrangement disrupts the prioritizing of concepts typically associated with hierarchies presented with more linear visual cues. This orientation towards brainstorming encourages users to enumerate and connect concepts without a tendency to begin within a particular conceptual framework.
Model Mapping

Tools and Strategies (version 2.0) © NSW Country Areas Program Page 42 of 76
Model Maps are based on the fact that thinking occurs in a holographic way. Model Maps organise thinking through using visual, auditory and kinesthetic senses. While education is often structured around a liner system, Model Maps allow individual learners to translate information, whether spoken or written, into their own holographic maps Model Maps are a flexible and creative way to organise thinking and assist memory. It is not about getting ideas down quickly, as in brainstorming, but organising thinking using visual stimuli such as lines, pictures and words. For the process to work effectively it is suggested that students are provided with an opportunity to participate in the visual, auditory and kinesthetic elements of the process. Remapping provides an opportunity to embed their thinking. of understanding.
Model Maps are a flexible and creative way to organise thinking and assist memory. It is not about getting ideas down quickly, as in brainstorming, but organising thinking using visual stimuli such as lines, pictures and words. For the process to work effectively it is suggested that students are provided with an opportunity to participate in the visual, auditory and kinesthetic elements of the process. Remapping provides an opportunity to embed their thinking. Step One Use key words/images Start from a strong central image/concept and work outwards Put key words on lines and then expand on these Step Two Explain the Model Map to a partner, using either a pen or a finger along the links Variations Step Three Put the map aside for a while Step Four Create another map for the same topic. Some people will recreate their original map and others will reorganise theirs This stage is designed to reassert, clarify or rearrange the mapper’s thinking. Elements may be expanded upon or linked differently. It is also possible for a key word or image to nowbecome the central image or idea, although the topic remains the same. Share the Model Map with a partner

Tools and Strategies (version 2.0) © NSW Country Areas Program Page 43 of 76
Multiple Intelligences
Multiple intelligences: the several independent forms of human intelligence that exist, according to one psychological theory, including verbal, quantitative, spatial, musical, kinaesthetic, interpersonal, and intrapersonal intelligence.

Tools and Strategies (version 2.0) © NSW Country Areas Program Page 44 of 76
Multi-‐voting
What
This is a strategy is a collaborative process to select the most important items.
Why
This strategy is used when there is a variety of issues and opinions and group consensus is required.
How Create a list of issues, ideas, opportunities, problem etc. The list can be created individually and then as a whole group.
Record the list for everyone to see (eliminate duplicates) eg white board, blackboard, flip chart etc
Provide individuals with sticky dots. (1 or more dots per person dependent on the number of items and the need to prioritise. 1 to 5 dots is usual)
Each individual uses there dots to select the items they consider important. All dots can be placed on one item or spread across a number of items.
eg FITNESS
weight training ☻☻☻☻☻☻
running ☻☻☻☻
aerobics ☻☻☻
cricket ☻
dancing ☻☻☻
fencing ☻☻☻☻☻
elbow bending ☻☻☻☻☻☻☻☻☻☻
5. You can visually see the priority areas, in the example it is clearly “elbow bending”.
Ideas from here
The top priority for each person could be in a different colour eg top priority could be a green dot and other priorities yellow dots
Teams could be allocated to work on the first priority
Lower items could be eliminated from all aspect of planning
Develop action plans with roles and responsibilities around priority items

Tools and Strategies (version 2.0) © NSW Country Areas Program Page 45 of 76

Tools and Strategies (version 2.0) © NSW Country Areas Program Page 46 of 76

Tools and Strategies (version 2.0) © NSW Country Areas Program Page 47 of 76
NGT (Nominal Group Technique)
This is a strategy is a collaborative process to make decisions on important issues. It puts team members on an equal footing.
Why
This strategy is a structured process to gather the important issues. It allows individuals to come to a consensus by voting on the issues in priority order. In this way least popular items are eliminated.
How • Create a list of issues, ideas, opportunities, problem etc. The
list can be created individually and then as a whole group. • Record the list for everyone to see (eliminate duplicates) eg
white board, blackboard, flip chart etc • Assign letters to each item • Example Engaging students
A Attendance
B Subject choice
C Gender balance
D Classroom environment
• Each team member lists the letters and ranks them according to importance ( in this example, 4 is most important)
• The rankings are recorded against the items and totalled
A 2 2 1 3 = 8
B 4 1 3 2 = 10
C 1 4 2 1 = 8
D 3 3 4 4 = 14
• The team would work on the item that scores the highest points.
• Ideas from here
· Teams could be allocated to work on the first top items
· Lower items could be eliminated from all aspect of planning
· Develop action plans with roles and responsibilities around priority items

Tools and Strategies (version 2.0) © NSW Country Areas Program Page 48 of 76
Pairing
What
A cooperative learning strategy where students interact with a partner to complete their work requirements.
Why
This strategy sometimes appears so obvious that its full potential often is neglected. It is an excellent introductory structure for a teacher who has displayed some initial interest in co-operative learning arrangements. The skills gained during this activity can be used in many other activities associated with learning in a team situation.
How
1. Ask students to form into pairs.
2. Outline a particular task to be completed by each pair of students. If there is an ‘extra’ student left over after the pairs have been organized, try the following options:
a. The teacher can become the partner (but be careful; the ‘last’ child may have difficulty socializing with other children, and may simply prefer to work with the teacher);
b. Form one 3-way group, and ask them to share the activities.
VARIATIONS:
Pair-Check (Spencer Kagan):
a. Students divide into pairs.
b. Each student is given a problem to complete.
c. When they finish, they take turns to check their partner’s answer, and then praise their partner for their efforts. Roles are then reversed.

Tools and Strategies (version 2.0) © NSW Country Areas Program Page 49 of 76
Think-Pair-Share (Spencer Kagan):
a. Divide the students into pairs.
b. The class is asked a question by the teacher.
c. Each person silently thinks about the possible answer for at least five seconds (this amount of time can vary widely).
d. Partners turn to each other, and discuss possible answers.
e. The teacher then asks for one pair to share their answer with the class.
3. Moving Circles:
a. Form two concentric circles, with half of the students in the outside circle, and half on the inside.
b. Create pairs by linking an inside person with an outside person.
(N.B. It becomes an easy matter to constantly reform the pairs; the outside circle merely needs to be moved one place to the left. In fact, this strategy has been used in activities such as bush dancing for many years.)

Tools and Strategies (version 2.0) © NSW Country Areas Program Page 50 of 76
Parking Lot A reflective tool to share ideas and pose questions.

Tools and Strategies (version 2.0) © NSW Country Areas Program Page 51 of 76
PCQ
What Pros, Cons and Questions
Why
This is a reflective tool useful at the end of an activity, event or unit of work.
How Individually or in groups, students can reflect on a completed task and note points under the headings Pros, Cons and Questions
Pros
Cons
Questions

Tools and Strategies (version 2.0) © NSW Country Areas Program Page 52 of 76
Placemat Consensus A cooperative learning tool to promote group discussion.

Tools and Strategies (version 2.0) © NSW Country Areas Program Page 53 of 76
Plus/Delta
What
A Plus/Delta is a simple inclusive strategy enabling everyone to consider the pluses - what went well, and the deltas -what you would like to see changed. The Plus Delta is a great feedback tool.
How
To use a Plus Delta simply make two columns. Label one column with a plus + sign and the other with the Greek sign for delta
Have students brainstorm under the plus sign what they believe is good about the activity, event, or action whilst under the delta sign how they could improve the activity, event or action.
Samples
* Use a plus delta to assess your last art assignment * Using a plus delta have staff assess their last semesters work
Sample Chart
+

Tools and Strategies (version 2.0) © NSW Country Areas Program Page 54 of 76
PMI
What
This strategy uses brainstorming to discover the pluses, minuses and interesting ideas.
When
This is a useful reflection tool used at the end of an activity/event/unit of work.
How The participant brainstorms the pluses, minuses and interesting ideas of a chosen topic or issue. Point out to the participants that one person's plus may be another person's minus. The interesting column often contains a list of questions for further research.
Samples

Tools and Strategies (version 2.0) © NSW Country Areas Program Page 55 of 76
POPE

Tools and Strategies (version 2.0) © NSW Country Areas Program Page 56 of 76
Question Matrix
EVENT SITUATION CHOICE PERSON REASON MEANS
Present What is/are? Where/when is/are?
Which is/are?
Who is/are? Why is/are? How is/are?
Past What did/do/does?
Where/when did/do/does?
Which did/do/does?
Who did/do/does?
Why did/do/does?
How did/do/does?
Possibility What can? Where/when can? Which can? Who can? Why can? How can?
Probability What would/could?
Where/when would/could?
Which would/could?
Who would/could?
Why would/could?
How would/could?
Prediction What will? Where/when will? Which will? Who will? Why will? How will?
Imagination What might? Where/when might?
Which might? Who might? Why might? How might?

Tools and Strategies (version 2.0) © NSW Country Areas Program Page 57 of 76
Radar Chart
RADAR CHART/SPIDER CHART
What it is:
A radar chart graphically shows the size of the gaps among five to ten organizational performance areas. The chart displays the important categories of performance and makes visible concentrations of strengths and weaknesses.
When to use it:
A radar chart shows how a team has evaluated a number of organizational performance areas. It is therefore essential that the initial evaluation include varied perspectives to provide an overall realistic and useful picture of performance.
How to use it:
Create categories. Use headers from an affinity diagram or brainstorm major categories of organizational performance to be plotted. A radar chart can normally include five to ten categories.
Standardize performance definitions. Have all evaluators agree to use standardized definitions of both full performance and non-performance in each category so that ratings are performed consistently. Define the scoring range (e.g., 0 to 5 with 5 being full performance).
Rate each performance category. Each evaluator rates each category individually, and the team then develops an average or consensus score for each category. Alternatively, the team as a whole may initially develop an average or consensus score for each category.
Construct the chart.
1. Draw a large circle and insert as many spokes or radii as there are performance categories.
2. Around the perimeter of the circle, label each spoke with the title of a performance
category.
3. Subdivide each spoke into the number of increments established in the rating scale. Label the center of the circle where spokes join as 0 (no performance) and place the highest rating number (full or exceptional performance) at the end of the spoke at the outer ring. (You may want to draw additional concentric circles linking equal values on each spoke.)
Tools and Strategies (version 2.0) © NSW Country Areas Program Page 58 of 76
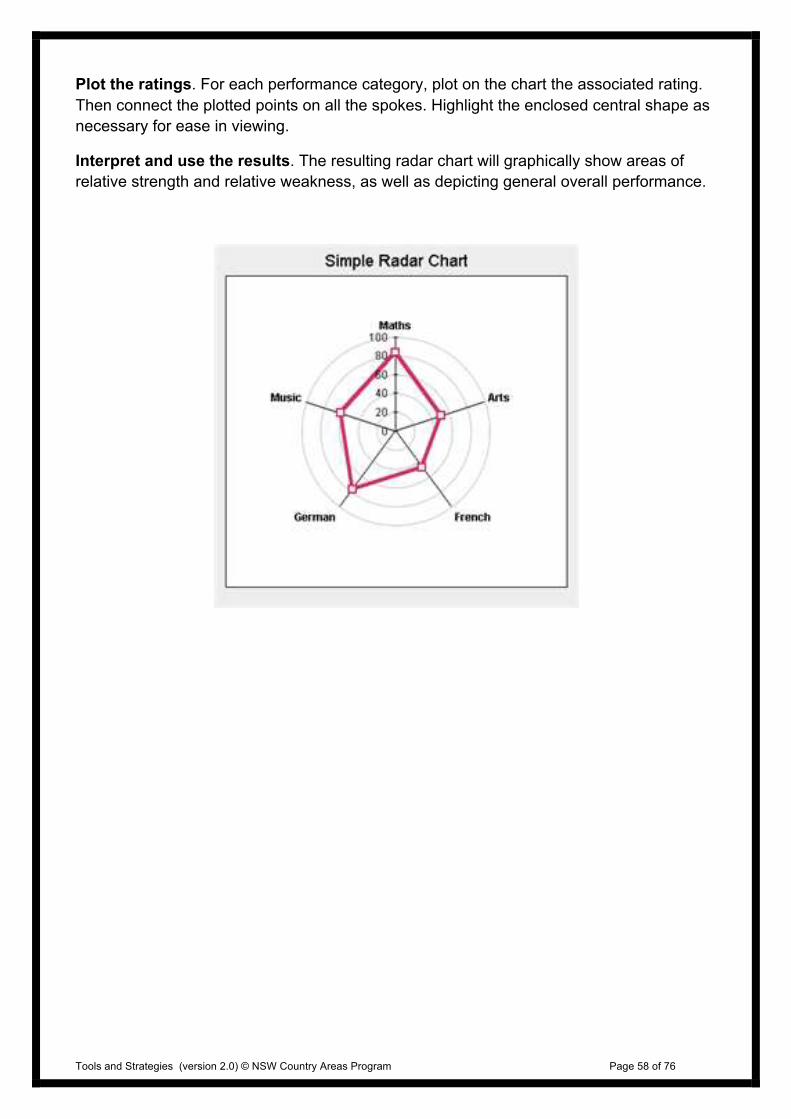
Plot the ratings. For each performance category, plot on the chart the associated rating. Then connect the plotted points on all the spokes. Highlight the enclosed central shape as necessary for ease in viewing.
Interpret and use the results. The resulting radar chart will graphically show areas of relative strength and relative weakness, as well as depicting general overall performance.

Tools and Strategies (version 2.0) © NSW Country Areas Program Page 59 of 76
Right Angled Thinking
What This strategy provides student with an opportunity to integrate left and right brain thinking.
Why This strategy is a structured thinking process which scaffolds thinking in a linear structured manner as well as making connections to associated ideas and creative thoughts. This strategy also provides students with a whole brained approach to note taking and gathering and organizing information
How Provide students with the Right Angled Thinking Sheet Ask students to use the sheet to record information while listening to information, reading for information and during discussions Students record information in two ways; Facts and associated ideas Provide students with extra time to complete the right angled thinking process so that they have the opportunity to note more facts and associated ideas, ensuring a whole brained approach Ideas from here Students can pair with another and share their information to enrich their note taking further Create a whole class list of facts and display or distribute to students for reference Students could organize their information from the Right Angled Thinking sheet through another process such as a Lotus Diagram or Fishbone
Right Angled Thinking
Associated Ideas
Fact
s
Tools and Strategies (version 2.0) © NSW Country Areas Program Page 60 of 76
Reverse Key
Reverse Key The REVERSE Key
Place words such as cannot, never and not in sentences which are commonly displayed in a listing format.
THE JUSTIFICATION:
Students are too often required to regurgitate endless lists of facts. Moving in the opposite direction still requires a sound knowledge base, but it forces students to think.
THE EXAMPLE:
Name 10 things that you could not clean.
List 5 sounds that you have never heard.
Name 10 things that you could not photograph.
From Tony Ryan's Thinkers Keys Download a free copy

Tools and Strategies (version 2.0) © NSW Country Areas Program Page 61 of 76
Review, Review, Review
What Review, Review, Review
When This strategy provides student with an opportunity to review their learning through a VAK cooperative learning process.
Why This strategy allows the students to use their three sensory modes of learning – Visual, Auditory, and Kinesthetic. It also provides three opportunities to review quickly material learnt.
Process Provide students with a proforma for Review, review, review or post it notes.
First step to Review (Visual)
Ask students to complete the sentence “What I know about ……is………… ” The student complete that sentence related to the topic provided. eg What I know about rain forests is that they have an upper canopy and lower story plants.
Second step to Review (Visual and Kinesthetic)
Students place their sheets/post its onto a table. Ask students to pick up a sheet and read. Continue to do this for a minute or two so that the students have the opportunity to read many sheets.
Third step to Review (Auditory)
Students select a sheet and read it to the whole group. This needs to be done in the following way. What I know about rain forests is that they have an upper canopy and lower story plants. The reason for reading the whole statement is so that the statement becomes that of the student.
Ideas from here
· Individual statements could be pasted onto A3 paper and then students can brainstorm additional information onto that sheet. This can then be Hot potatoed by rotating the sheets to other groups.

Tools and Strategies (version 2.0) © NSW Country Areas Program Page 62 of 76
Six Thinking Hats
Yellow Hat
What are the positives?
Green Hat
What are the alternatives?
Red Hat
Our thoughts and our feelings about the topic.
Black Hat
What are the negatives or problems that may arise?
Blue Hat
Thinking about thinking.
'Six Thinking Hats' is an important and powerful technique. It is used to look at decisions from a number of important perspectives. This forces you to move outside your habitual thinking style, and helps you to get a more rounded view of a situation.
Many successful people think from a very rational, positive viewpoint. This is part of the reason that they are successful. Often, though, they may fail to look at a problem from an emotional, intuitive, creative or negative viewpoint. This can mean that they underestimate resistance to plans, fail to make creative leaps and do not make essential contingency plans.
Similarly, pessimists may be excessively defensive, and more emotional people may fail to look at decisions calmly and rationally.
If you look at a problem with the 'Six Thinking Hats' technique, then you will solve it using all approaches. Your decisions and plans will mix ambition, skill in execution, public sensitivity, creativity and good contingency planning.

Tools and Strategies (version 2.0) © NSW Country Areas Program Page 63 of 76
How to Use the Tool:
You can use Six Thinking Hats in meetings or on your own. In meetings it has the benefit of blocking the confrontations that happen when people with different thinking styles discuss the same problem.
Each 'Thinking Hat' is a different style of thinking. These are explained below:
• White Hat: Finding out the facts. With this thinking hat you focus on the data available. Look at the information you have, and see what you can learn from it. Look for gaps in your knowledge, and either try to fill them or take account of them. This is where you analyse past trends, and try to extrapolate from historical data.
• Red Hat: Our thoughts and our feelings about the topic. 'Wearing' the red hat, you look at problems using intuition, gut reaction, and emotion. Also try to think how other people will react emotionally. Try to understand the responses of people who do not fully know your reasoning.
• Black Hat: What are the negatives or problems that may arise? Using black hat thinking, look at all the bad points of the decision. Look at it cautiously and defensively. Try to see why it might not work. This is important because it highlights the weak points in a plan. It allows you to eliminate them, alter them, or prepare contingency plans to counter them. Black Hat thinking helps to make your plans 'tougher' and more resilient. It can also help you to spot fatal flaws and risks before you embark on a course of action. Black Hat thinking is one of the real benefits of this technique, as many successful people get so used to thinking positively that often they cannot see problems in advance. This leaves them under-prepared for difficulties.
• Yellow Hat : What are the positives? The yellow hat helps you to think positively. It is the optimistic viewpoint that helps you to see all the benefits of the decision and the value in it. Yellow Hat thinking helps you to keep going when everything looks gloomy and difficult.
• Green Hat: What are the alternatives? The Green Hat stands for creativity. This is where you can develop creative solutions to a problem. It is a freewheeling way of thinking, in which there is little criticism of ideas. A whole range of creativity tools can help you here.
• Blue Hat: Thinking about thinking. The Blue Hat stands for process control. This is the hat worn by people chairing meetings. When running into difficulties because ideas are running dry, they may direct activity into Green Hat thinking. When contingency plans are needed, they will ask for Black Hat thinking, etc.
A variant of this technique is to look at problems from the point of view of different professionals (e.g. doctors, architects, sales directors, etc.) or different customers.

Tools and Strategies (version 2.0) © NSW Country Areas Program Page 64 of 76
Stay and Stray
What Stay and Stray
When At the beginning of an investigation into a topic or theme to help build knowledge or at the end to summarise learning.
Why Stay and Stray can encourage everyone to contribute their point of view. Help build collaborative knowledge. Build group confidence.
Process • Identify the theme or topic to be discussed • Develop three questions which focus on the topic. Each question
should seek to build onto the question prior to it • Whole group into seated or standing groups of three • Each group member is given a number 1-3 • Inform No2 that they will be the time keeper in the strategy and will
stay where they are when 1 and 3 are asked to move on • Ask the first question to whole group informing them that each
person in the group will have only 30 secs to share their thoughts about that question with their own group
• Remind timekeeper they will be responsible for managing the time of discussion in their group
• When all participants have shared their input call final time on this question and provide instructions for movement
• Instructions for movement. 1 moves clockwise to the nearest group whilst 3 moves anticlockwise to their nearest group. Remind 2 that they must stay where they are
• When group members arrive at their new group, inform everyone that each person will have 30 secs to share the discussions from the first question with their new group. Remind timekeeper (number 2s) they will be responsible for managing the time of discussion in their group
• Call time when all sharing has been completed. • Whole group facilitator asks second question on topic and steps 6-
11.
Sample Uses To investigate how we can build a better team? What characteristics do you believe are the most important for good leaders? Discuss how gender roles have changed since our parents/carers days/ Share your knowledge, experiences and insights about an area of learning.

Tools and Strategies (version 2.0) © NSW Country Areas Program Page 65 of 76

Tools and Strategies (version 2.0) © NSW Country Areas Program Page 66 of 76
SWOT SWOT analysis is a strategic planning method used to evaluate the Strengths, Weaknesses, Opportunities, and Threats involved in a project or in a business venture. It involves specifying the objective of the business venture or project and identifying the internal and external factors that are favorable and unfavorable to achieve that objective.
• Strengths: characteristics of the business or team that give it an advantage over others in the industry.
• Weaknesses: are characteristics that place the firm at a disadvantage relative to others.
• Opportunities: external chances to make greater sales or profits in the environment. • Threats: external elements in the environment that could cause trouble for the
business.

Tools and Strategies (version 2.0) © NSW Country Areas Program Page 67 of 76
SCAMPER
S: Substitute - Think about substituting part of your product/process for something else. By looking for something to substitute you can often come up with new ideas.
Typical questions: What can I substitute to make an improvement? What if I swap this for that and see what happens? How can I substitute the place, time, materials or people?
C: Combine - Think about combining two or more parts of your probortunity to achieve a different product/process or to enhance synergy.
Typical questions: What materials, features, processes, people, products or components can I combine? Where can I build synergy?
A: Adapt - Think about which parts of the product/process could be adapted to remove the probortunity or think how you could change the nature of the product/process.
Typical questions: What part of the product could I change? And in exchange for what? What if I were to change the characteristics of a component?
M: Modify/ Distort - Think about changing part or all of the current situation, or to distort it in an unusual way. By forcing yourself to come up with new ways of working, you are often prompted into an alternative product/process.
Typical questions: What happens if I warp or exaggerate a feature or component? What will happen if I modify the process in some way?
P: Put to other purposes - Think of how you might be able to put your current solution/ product/process to other purposes, or think of what you could reuse from somewhere else in order to solve your own probortunity. You might think of another way of solving your own probortunity or finding another market for your product.
Typical questions: What other market could I use this product in? Who or what else might be able to use it?
E: Eliminate - Think of what might happen if you eliminated various parts of the product/process/probortunity and consider what you might do in that situation. This often leads you to consider different ways of tackling the probortunity.
Typical questions: What would happen if I removed a component or part of it? How else would I achieve the solution without the normal way of doing it?
R: Rearrange/ Reverse - Think of what you would do if part of your probortunity/product/process worked in reverse or done in a different order. What would you do if you had to do it in reverse? You can use this to see your probortunity from different angles and come up with new ideas.
Typical questions: What if I did it the other way round? What if I reverse the order it is done or the way it is used? How would I achieve the opposite effect?

Tools and Strategies (version 2.0) © NSW Country Areas Program Page 68 of 76
The SCAMPER technique uses a set of directed questions which you answer about your probortunity in order to come up with new ideas. The stimulus comes from forcing yourself to answer questions which you would not normally pose. The questions direct you to thinking about a probortunity in ways which typically come up with new ideas.

Tools and Strategies (version 2.0) © NSW Country Areas Program Page 69 of 76
Think Pair Share
What A cooperative learning strategy where students interact with a partner and then partners to share information.
Why This strategy is a structured process to share information efficiently. It can be used as a reflective tool at any stage throughout the learning process. The process can lead to other learning situations that builds on background knowledge and understanding.
How Think - As individuals Outline a particular task or discussion point. Students think about the task or topic, take notes or jot down ideas Pair – In pairs Ask students to form pairs. The pairs of students then discuss their thoughts and ideas about the task or discussion point. Notes can be taken or an activity completed. Share – Pairs pair (group of 4) Ask pairs to join with another pair The pairs then discuss their thoughts and ideas about the task or discussion point. Notes can be taken or an activity completed. Timing It is important to state the time allowed for each activity and stick to it. Depending on the complexity of the task, the time for each activity can be variable eg Think 3mins, Pair 10 mins, Pair Share – 20 mins. Ideas from here You could gather a whole group brainstormed list of ideas. This group of 4 could become a cooperative learning group Each paired groups could present to the whole group

Tools and Strategies (version 2.0) © NSW Country Areas Program Page 70 of 76
Venn Diagram
What Venn Diagram
When To visually compare and contrast similarities and differences.
Process Draw two overlapping circles. Each Circle will represent one subject.
2. Students write the unique characteristics of that subject into the identified circle
3. Common characteristics are placed in the overlapping sections of the circles
Variation
Venn Diagrams can be made more complex by drawing three or more overlapping circles
The number of circles drawn will depend on the number of subjects or ideas to be contrasted.
Sample Uses Venn Diagrams can be used to compare and contrast almost anything, eg to examine or analyse events, religions, politics, characters, environments and stories.

Tools and Strategies (version 2.0) © NSW Country Areas Program Page 71 of 76
Walk and Talk
What Walk and Talk
When This process is best used at the conclusion of a learning situation, lesson or day. It is also well suited when a learning concept requires reinforcement.
Why This strategy is a structured cooperative learning process to share learning and provide opportunities to learn from others
Process • Identify the theme or topic to be discussed • Develop three questions which focus on the topic. Each question
should seek to build onto the question prior to it • Whole group into seated or standing groups of three • Each group member is given a number 1-3 • Inform No2 that they will be the time keeper in the strategy and will
stay where they are when 1 and 3 are asked to move on • Ask the first question to whole group informing them that each
person in the group will have only 30 secs to share their thoughts about that question with their own group
• Remind timekeeper they will be responsible for managing the time of discussion in their group
• When all participants have shared their input call final time on this question and provide instructions for movement
• Instructions for movement. 1 moves clockwise to the nearest group whilst 3 moves anticlockwise to their nearest group. Remind 2 that they must stay where they are
• When group members arrive at their new group, inform everyone that each person will have 30 secs to share the discussions from the first question with their new group. Remind timekeeper (number 2s) they will be responsible for managing the time of discussion in their group
• • Call time when all sharing has been completed.
• • Whole group facilitator asks second question on topic and steps 6-11
Sample Uses To investigate how we can build a better team? What characteristics do you believe are the most important for good leaders? Discuss how gender roles have changed since our parents/carers days/ Share your knowledge, experiences and insights about an area of learning

Tools and Strategies (version 2.0) © NSW Country Areas Program Page 72 of 76
What If Key
What If Key You can ask virtually any What If question. They can be either serious or frivolous.
One excellent means of displaying ideas from this key is to draw up an Ideas Wheel.
THE JUSTIFICATION: Great for introducing an area of study, and for tapping into the students’ knowledge base. It also generates loads of innovative ideas.
THE EXAMPLE: 1. What if the price of petrol was immediately doubled? 2. What if all cars turned into skateboards?
Now construct an Ideas Wheel. Place the base statement in the middle circle, and put 5 consequences of that event in the 5 outer circles. Then deal with each of the 5 outer circles in turn. Put 3 consequences of each of these into the smaller circles (see download for examples and proforma)

Tools and Strategies (version 2.0) © NSW Country Areas Program Page 73 of 76
WIFLE – (What If I Feel Like Expressing)
What
WIFLE is a process that allows the student to express their thoughts, ideas, opinions, concerns, feelings etc about their learning or learning situation.
Why
This strategy is a structured process to allow students to express themselves in a safe and scaffolded manner.
It can also be used to diffuse emotionally charged situations so emotions can be dealt with in a timely open fashion.
Teachers may choose to use this process to ascertain students thoughts and emotions.
How This process can be used at any point in the learning situation however it is most powerful when emotions are evident (happy, excited, frustrated, irritated annoyed angry, flat etc)
1. Students are in a circle or at table groups. In turn they begin their response by saying “What I feel like expressing is ……………”
2. If a student does not wish to “WIFLE” they pass.
3. If during the WIFLE process, it is evident that there is an issue, then it may be desirable to implement another cooperative learning process such as:
Ø brainstorm strategies to address the issue
Ø affinity the suggested strategies
Ø force filed analysis an issue
Ø relationship diagraph the issues with the broader context
Ø radar chart the issues to show the relationship with the context etc
Ideas from here
Generally, students each get one turn but it could continue until “WIFLE’s” are exhausted

Tools and Strategies (version 2.0) © NSW Country Areas Program Page 74 of 76
WOEDIL -‐ (What On Earth Did I Learn)
What
WOEDIL is a reflective process that allows the student to verbalise what they have learnt.
Why
This strategy is a structured process to allow students to express what they have learnt.
It is a cooperative learning strategy providing opportunities to learn from others.
Teachers may use this process as a verbal assessment of individual and whole class learning.
How This process is best used at the conclusion of a learning situation, lesson or day. It is a culmination activity.
1. Students are in a circle or at table groups. In turn they begin their response by saying “What On Earth Did I Learn today is ………………”
2. If a student does not wish to “WOEDIL” they can pass.
3. WOEDIL can be recorded on a retrieval chart and displayed for future reference.
Ideas from here
WOEDILs can be developed into a data bank to review topics, content etc.
A WOEDIL can be used to develop an mind or concept map

Tools and Strategies (version 2.0) © NSW Country Areas Program Page 75 of 76
Y-‐Chart
What is it?
An visual that organises the brainstorming of ideas around three dimensions:
what a particular topic/situation ‘looks like’, ‘sounds like’ and ‘feels like’.
What is its purpose?
To encourage students to be critical thinkers and identify appropriate behaviours for achieving this, for example, what does a co-operative classroom looks like, feels like and sounds like.
Looks like
lots of speaking and listening
interaction, sharing, positives
consulting, helping, not put downs
lots of team- work.
Feels likes Sounds like
happy, worthwhile, lots of on task chatter
everyone valued positive, laughter,
motivated, engaged, praise, encouragement
on task, comfortable,
purposeful, exciting

Tools and Strategies (version 2.0) © NSW Country Areas Program Page 76 of 76
How do I do it?
* Decide on the topic/social skill you wish to explore with your students
* Divide students into small groups, allocating tasks to each group member such as recorder, reporter, time-keeper, organiser
* Hand out Y chart proforma, A3 size
* Have students brainstorm as many possibilities as they can within a specific time limit
* Each group reports back
* Discussion and clarification follows
* Strengths and weaknesses are identified as the topic/social skill is utilised in the classroom over several days or lessons and follow-up action is suggested.