dissertation for the degree of doctor of philosophy drying
TRANSCRIPT
Dissertation for the Degree of Doctor of Philosophy
Drying and smoking of capelin (Mallotus villosus) and sardine (Sardinella
gibbosa) – the influence on physicochemical properties and consumers
acceptance
Cyprian Ogombe Odoli
Faculty of Food Science and Nutrition
School of Health Sciences
University of Iceland
Reykjavik, October 2015
I
Academic dissertation
Faculty of Food Science and Nutrition, University of Iceland, Reykjavik Iceland
In collaboration with
Matis (Iceland Food and Biotech R&D), Reykjavik, Iceland
United Nations University-Fisheries Training Programme, Reykjavik, Iceland
Kenya Marine & Fisheries Research Institute, Mombasa, Kenya
Supervised by
Professor Sigurjon Arason, Faculty of Food Science and Nutrition, University of Iceland and
Matis (Iceland Food and Biotech R&D)
PhD Committee
Professor Gudjon Thorkelsson, Faculty of Food Science and Nutrition, University of Iceland and
Matis (Iceland Food and Biotech R&D)
Dr. Tumi Tomasson, Director United Nations University-Fisheries Training Programme
Dr. Kolbrun Sveinsdottir, Matis (Iceland Food and Biotech R&D)
Dr. Minh Van Nguyen, Nha Trang University, Vietnam
Mr. Asbjorn Jonsson (MSc.), Matis (Iceland Food and Biotech R&D)
Opponents
Dr. Morten Sivertsvik, Director of Research, Processing Technology, Nofima, Norway
Dr. Hjörleifur Einarsson, Professor at the Faculty of Natural Resource Sciences, University of
Akureyri, Iceland
ISBN 978-9935-9130-8-1

II
Abstract
Drying and smoking are affordable fish preservation methods that are commonly used in most developing countries
where poorly developed logistics limit marketing of fresh fish. In Eastern Africa dried and smoked fish are
important sources of low cost stable dietary protein. Small fish, mainly sardine, is commonly blanched in brine prior
to drying on the ground. The dried fish is often of low quality, restricting the sales of dried fish to low income
groups shopping in open-air markets. At the same time there is an increasing demand among middle class
consumers for dried and smoked small fish of high quality sold in supermarkets. Increased demand for dried and
smoked small fish could be met by imports or improved processing methods. The aim of this study was to improve
the quality and safety of dried and smoked small fish, and study acceptability of new products such as dried capelin
caught in Icelandic waters in markets accustomed to dried small fish. The effects of blanching, drying and smoking
methods on fish quality were evaluated. The influence of lipid content and packaging methods on lipid degradation,
sensory properties and microbial quality during storage of dried and smoked fish was assessed, as well as the
marketing potential of sardine dried under more hygienic conditions and imported dried capelin.
Blanching prior to drying of sardine and capelin resulted in low quality and sensory properties, and protein
denaturation/aggregation. Fat content of capelin depends on the time of year and when capelin of 9-10% lipid
content rather than 7-7.5% was used, drying rate was reduced and moisture content in the end product increased,
while the fat protected proteins during blanching, drying and smoking. Drying under controlled conditions improved
quality demonstrating the need for developing a commercial drier for processing of small fish. Industrially dried and
smoked capelin and sardine were found to be rich in essential polyunsaturated fatty acids. Eicosapentaenoic acid
(EPA) and docosahexaenoic acid (DHA) constituted approximately 13% and 20% of the total fatty acids of these
fish respectively. Lipid content and microbial stability as well dehydration were higher in hot smoked than cold
smoked capelin and sardine but hot smoking reduced the yield. Lipid content influenced hydrolysis and oxidation as
well as sensory properties during storage of smoked and dried capelin. Lipid hydrolysis was higher in lower lipid
capelin while lipid oxidation was higher in fatty capelin. When atmospheric oxygen was removed by vacuum
packaging, dried and smoked fatty capelin became more stable during storage with less lipid degradation, less rancid
odour and lower counts of microbes. Vacuum packaging had no influence on lipid hydrolysis.
Vacuum packaged hot smoked fish was stable during four weeks of chill storage. Dried capelin had moisture content
<25% and water activity <0.70 and was stable and safe, during five months storage at room temperature. Improved
dried sardine and capelin received high acceptability ratings, indicating consumers of traditional dried small fish
might accept new dried fish products. The results from this study show that well processed and packaged dried and
smoked small fish can be highly nutritious and could contribute to the reduction of malnutrition prevailing in many
developing countries.
Keywords: Capelin, sardine, lipid content, lipid degradation, fish proteins, drying conditions, smoking methods,
blanching, brining, microbial changes, consumers’ acceptance.
III
Ágrip
Þurrkun og reyking eru hagkvæmar varðveisluaðferðir sem almennt eru notaðar í þróunarlöndum, þar sem
vanþróaðir flutningaferlar takmarka markaðssetningu á ferskum fiski. Í A-Afríku er þurrkaður og reyktur fiskur
mikilvæg uppspretta próteina í mataræði íbúa. Smáfiskur, aðallega sardínur, er venjulega settur í saltpækil og
forsoðinn til að stöðva ensímvirkni og örveruvöxt áður en hann er þurrkaður utandyra. Þurrkaði fiskurinn er oft
lélegur að gæðum og takmarkast sala hans við tekjulægri hópa er versla á útimörkuðum. Á sama tíma er aukin
eftirspurn meðal neytenda millistéttar eftir þurrkuðum og reyktum smáfiski í stórmörkuðum sem uppfyllir
gæðakröfur þeirra. Þessari eftirspurn mætti mæta með innflutningi eða bættum vinnsluaðferðum. Markmið þessarar
rannsóknar var að bæta gæði og öryggi í vinnslu smáfisks og kanna viðbrögð neytenda við nýrri afurð eins og
þurrkaðri loðnu veiddri við Ísland sem er ekki þekkt á mörkuðum í A-Afríku. Áhrif forsuðu, þurrkunar og reykingar
á gæði afurða voru metin, ásamt áhrifum pökkunaraðferða á niðurbrot fitu. Einnig voru kannaðir
skynmatseiginleikar og magn örvera í þurrkuðum og reyktum afurðum. Að síðustu var hugað að markaðssetningu á
hollari þurrkaðri sardínu og innfluttri þurrkaðri loðnu.
Forsuða fyrir hefðbundna þurrkun á sardínum og loðnu leiddi til minni afurðagæða, lakara skynmats og minni
próteingæða. Magn fitu í loðnu er árstíðabundið og þegar loðna með fituinnihald 9-10% í stað 7-7,5% var þurrkuð,
tók þurrkunin lengri tíma og rakainnihald í lokaafurð jókst. Jafnframt dró fitan úr afmyndun próteina í
vinnsluferlinu. Við stýrðar þurrkaðstæður jukust gæði afurða, en það bendir til að nauðsynlegt sé að þróa þurrkara
fyrir vinnslu á smáfiski. Í þurrkaðri og reyktri loðnu og sardínum greindist hátt hlutfall lífsnauðsynlegra
fjölómettaðra fitusýra eins og eicosapentaenoic sýru (EPA) og docosahexaenoic sýru (DHA), nákvæmlega 13% í
loðnu og 20% í sardínum. Í heitreyktri loðnu og sardínum, var meiri fita, minni raki og aukinn stöðugleiki gegn
örverum, miðað við kaldreykta afurð, en heitreyking minnkaði nýtingu. Fituinnihald hafði áhrif á vatnsrof próteina,
oxun fitu og bætti skynmatseiginleika við geymslu á reyktri og þurrkaðri loðnu. Niðurbrot fitu var mest í loðnu með
lágu fituinnihaldi á meðan þránun var mest í loðnu með háu fituinnihaldi. Pökkun á reyktri og þurrkaðri feitri loðnu í
loftfirrtar umbúðir, leiddi til minni þránunar fitu, og færri örvera. Pökkun hafði ekki áhrif á niðurbrot fitu.
Heitreyktur fiskur í loftfirrtum umbúðum hélt upphaflegum eiginleikum sínum eftir fjögurra vikna geymslu í kæli.
Þurrkuð loðna með rakainnihaldi undir 25% og vatnsvirkni undir 0,7 geymist óskemmd við stofuhita í 5 mánuði í
loftfirrtum umbúðum. Bætt vinnsluferli við þurrkun á sardínum og loðnu skilaði góðum árangri og afurðinni var vel
tekið hjá neytendum hefðbundins þurrkaðs smáfisks í Kenía. Niðurstöður þessarar rannsóknar sýna að þurrkaður og
reyktur smáfiskur getur verið mjög næringarrík fæða, og ef verklag við vinnslu og pökkun er rétt, gætu þessar
afurðir hjálpað til við að draga úr vannæringu sem er ríkjandi í þróunarlöndum.
Lykilorð: Loðna, sardína, fituinnihald, fituniðurbrot, fiskprótein, þurrkaðstæður, reykingaraðferðir, forsuða,
pæklun, örverubreytingar, neytendakönnun.

IV
List of original papers
The thesis is based on the following papers referred in the text by their respective Roman numerals. The
papers are appended at the end of the thesis.
I. Cyprian, O.O., Nguyen, M.V., Sveinsdottir, K., Tomasson, T., Thorkelsson, G., Arason, S.
(2015). Influence of blanching treatment and drying methods on the drying characteristics and
quality changes in dried sardine (Sardinella gibbosa) during storage. Drying Technology, under
review.
II. Cyprian, O.O., Nguyen, M.V., Sveinsdottir, K., Jonsson, A., Thorkelsson, G., Arason, S. (2015).
Influence of lipid content and blanching on capelin (Mallotus villosus) drying rate and lipid
oxidation under low temperature drying. Journal of Food Process Engineering (In Press,
doi:10.1111/jfpe.12215).
III. Cyprian, O.O., Nguyen, M.V., Tomasson, T., Thorkelsson, G., Arason, S. (2015).
Conformational changes in Capelin (Mallotus villosus) proteins during smoking and drying.
Food Chemistry, under review.
IV. Cyprian, O.O., Nguyen, M.V., Sveinsdottir, K., Jonsson, A., Tomasson, T., Thorkelsson, G.,
Arason, S. (2015). Influence of smoking and packaging methods on lipid stability and microbial
quality of Capelin (Mallotus villosus) and Sardine (Sardinella gibossa). Food Science &
Nutrition, 3(5), 404–414.
V. Cyprian, O.O., Sveinsdottir, K., Jonsson, A., Nguyen, M.V., Tomasson, T., Thorkelsson, G.,
Arason, S. (2015). Influence of lipid content and packaging methods on the quality of dried
capelin (Mallotus villosus) during storage. Journal Food Science and Technology, under review.
VI. Cyprian, O.O., Sveinsdottir, K., Jonsson, A., Tomasson, T., Thorkelsson, G., Arason, S. (2015).
Marketing potential of improved dried sardine (Sardinella gibossa) and capelin (Mallotus
villosus) in markets accustomed to traditional dried fish. Journal of Sensory Studies, under
review.
The following papers were published during the study period but are not regarded as part of the thesis:
Cyprian, O.O., Sveinsdóttir, K., Magnússon, H., Arason, S., Jóhannsson, R., & Martinsdóttir, E. (2014).
Development of Quality Index Method (QIM) Scheme for Farmed Tilapia Fillets and Its
Application in Shelf Life Study. Journal of Aquatic Food Product Technology, 23(3), 278–290.
Cyprian, O.O., Lauzon, H. L., Jóhannsson, R., Sveinsdóttir, K., Arason, S., & Martinsdóttir, E. (2013).
Shelf life of air and modified atmosphere-packaged fresh tilapia (Oreochromis niloticus) fillets
stored under chilled and superchilled conditions. Food Science & Nutrition, 1(2), 130–140.
Cyprian, O.O., Oduor-Odote, P., Lauzon, H., Martinsdottir, E., Sigurjon, Arason. (2013).
Microbiological quality and shelflife of fresh packaged Tilapia fillets stored under different chill
temperatures. Journal of Microbiology, Biotechnology and Food Sciences, 2(4), 2431–2455.

V
The author’s contributions to the papers
The author designed and implemented all the experiments in collaboration with the PhD study committee
(co-authors). The author carried out all the analysis and wrote the articles in collaboration with co-
authors.
VI
Acknowledgements
The study was carried out at Matis (Iceland Food and Biotech R&D) Iceland and Kenya Marine and
Fisheries Research Institute (KMFRI) Kenya. It was funded by the United Nations University- Fisheries
Training Programme (Iceland) and AVS (Added Value of Seafood) Fund of the Ministry of Fisheries and
Agriculture, Iceland (Project No. R 15-074-14, Drying of pelagic fish).
I express my sincere gratitude to my supervisor Professor Sigurjon Arason for guiding me through this
interesting field of improving drying and smoking of small pelagic fish. He always kept the door open for
questions and discussions concerning various aspects of this work. I wish to thank the study committee
Professor Gudjon Thorkelsson, Dr. Tumi Tomasson, Dr. Kolbrun Sveinsdottir, Dr. Minh Van Nguyen and
Mr. Asbjorn Jonsson for the advice and constructive criticism during the review of the manuscripts and
dissertation. I also wish to specifically thank Dr. Tumi Tomasson and Professor Gudjon Thorkelsson for
opening up my scientific writing during the many discussion and meetings.
Dr. Minh Van Nguyen is acknowledged for helping me through the hard laboratory work at the start of
the experiments. I am grateful for Dr. Magnea Karlsdottir and other staff of the chemical laboratory, Mr.
Pall Steinporsson of microbiology laboratory and Vigfus Asbjornsson of Matis Hornarfordur for
contributing towards the success of my laboratory work/smoking trials. I am thankful to HB Grandi
fishing company and Síldarvinnslan Neskaupstað for providing the capelin, the directors of Vestfirska and
Haustak for the drying facilities and of course the wonderful people of Iceland for making my life there
such a unique experience.
Part of the data for the thesis was collected in Kenya. I am grateful to Mr. Raymond Ruwa of KMFRI for
translating the questionnaire into the local language (Swahili) and his assistance in the marketing
research. I wish to also thank my colleagues at KMFRI especially Mr. Peter Oduor-Odote, Bernard
Ogongo, Levy Otwoma, Johnstone Omukoto and Victor Mwakha for much helpful advice.
My warm thanks I owe to my parents Mr. Bernard Oballa and Milliana Anyango for supporting the
foundation to this long academic journey, and my brothers and sisters for unconditional caring and at
times stepping in for me when in Iceland.
Finally my precious thanks belong to my wife Hellen Namugeere for sharing your life with me. To my
twins (Millies) I dedicate this dissertation to you, for growing up at an early age without seeing your dad
while in pursuit of this accomplishment, may you be God fearing daughters. We all made it happen!
VII
Abbreviations
a* Redness
aw Water activity
ANOVA Analysis of variance
b* Yellowness
BR Brined
BL Blanched in brine
CFU Colony forming units
DHA Docosahexaenoic acid
EPA Eicosapentaenoic acid
FFA Free fatty acids
GDC Generic descriptive analysis
L* Lightness
Mc Moisture content
MUFA Monounsaturated fatty acids
OFR Fluorescence interaction compounds
O2 Oxygen
PCA Principal Component Analysis
PL Phospholipid
PUFA Polyunsaturated fatty acids
PV Peroxide value (hydroperoxides)
R Drying rate
r Correlation coefficient
SFA Saturated fatty acids
SH Sulfhydryl
S-S Disulphide bond
TBARS Thiobarbituric acid reactive substances
TL Total lipid
TPC Total plate count
W Weight
VIII
Table of contents
1 Introduction ............................................................................................................................. 1
2 State of the art ......................................................................................................................... 4 2.1 Species of interest............................................................................................................. 4
2.1.1 Sardine ...................................................................................................................... 4 2.1.2 Capelin ...................................................................................................................... 5
2.2 Fish drying and smoking .................................................................................................. 6
2.2.1 Fish drying ................................................................................................................ 6 2.2.2 Fish smoking ............................................................................................................. 7
2.3 Packaging of dried and smoked fish ................................................................................ 8
2.4 Degradation of dried and smoked fish ............................................................................. 9 2.4.1 Microbial spoilage .................................................................................................. 10 2.4.2 Lipid degradation (oxidation and hydrolysis) ......................................................... 11
2.4.3 Interactions between proteins and lipid oxidation .................................................. 14 2.5 Protein denaturation and aggregation ............................................................................. 15 2.6 Consumption of dried and smoked fish.......................................................................... 16
3 Objectives of the study.......................................................................................................... 17 4 Materials and methods .......................................................................................................... 19
4.1 Experimental design ....................................................................................................... 19 4.1.1 Influence of blanching treatment and drying methods on the drying characteristics
and quality changes in sardine (Sardinella gibbosa) during storage (Paper I) ..................... 19
4.1.2 Influence of lipid content and blanching on capelin (Mallotus villosus) drying rate
and lipid oxidation under low temperature drying (Paper II) ............................................... 20 4.1.3 Conformational changes in capelin (Mallotus villosus) proteins during smoking and
drying (paper III)................................................................................................................... 20
4.1.4 Influence of smoking and packaging methods on lipid stability and microbial
quality of capelin (Mallotus villosus) and sardine (Sardinella gibossa) (Paper IV)............. 21
4.1.5 Influence of lipid content and packaging methods on dried capelin (Mallotus
villosus) stability (Paper V) .................................................................................................. 22 4.1.6 Marketing potential of improved dried sardine (Sardinella gibossa) and capelin
(Mallotus villosus) in markets accustomed to traditional dried fish (Paper VI) ................... 22
4.2 Raw material and processing.......................................................................................... 23 4.3 Evaluation of stability and quality ................................................................................. 23 4.4 Marketing potential ........................................................................................................ 24
4.5 Statistical analysis .......................................................................................................... 25 5 Main results and discussion .................................................................................................. 26
5.1 Factors that influence fish drying characteristics and quality ........................................ 26 5.1.1 Drying system ......................................................................................................... 26
5.1.2 Raw material treatments (brining and blanching in brine) ..................................... 29 5.1.3 Lipid content ........................................................................................................... 33 5.1.4 Summary ................................................................................................................. 35
5.2 Conformation changes in capelin proteins during drying and smoking......................... 36 5.2.1 Changes in lipid, water and salt content ................................................................. 36 5.2.2 Changes in protein solubility (salt soluble proteins) ............................................... 37
IX
5.2.3 Changes in sulfhydryl (SH) groups and disulfide bond content ............................. 39
5.2.4 Summary ................................................................................................................. 43 5.3 Stability of dried and smoked capelin and sardine ......................................................... 44
5.3.1 Influence of lipid content and smoking methods on fish stability .......................... 44
5.3.2 Influence of packaging methods on fish stability ................................................... 52 5.3.3 Summary ................................................................................................................. 56
5.4 Marketing potential of dried capelin and sardine ........................................................... 57 5.4.1 Dried fish consumption patterns ............................................................................. 57 5.4.2 Acceptability rating ................................................................................................. 58
5.4.3 Willingness to buy .................................................................................................. 59 5.4.4 Summary ................................................................................................................. 61
6 Conclusions and future prospects ......................................................................................... 62 7 Industrial application ............................................................................................................ 64
8 References ............................................................................................................................. 65 9 Appendices ............................................................................................................................ 78
1
1 Introduction
Fish and other marine organisms give rise to products of great economic importance all over the
world. Fresh fish is highly perishable and various preservation techniques such as chilling,
freezing, drying, salting and smoking are used to extend its shelf life. Drying and smoking are
affordable fish preservation methods that are commonly used in many developing countries
(Darvishi et al., 2013; Akintola et al., 2013; Bellagha et al., 2007). Dried and smoked fish, in
particular small pelagic fish, is an important source of low cost stable dietary protein. In Eastern
Africa, particularly Kenya, Tanzania and Uganda, the consumption of dried small fish is
common and widespread (IOC, 2012; Oduor-Odote et al., 2010). Dried and smoked fish has a
long shelf life and is sold in small portions to meet the needs of low-income consumers.
Small pelagic fish, specifically dagaa (Rastrineobola argentea) in Lake Victoria and sardine
(Sardinella gibbosa) along the coast of the Indian Ocean are caught in Kenya using light
attraction and small meshed seine nets (Government of Kenya, 2011). Highest catches occur
during dark moonless nights when light attraction is most effective. Fishing usually takes place
for 18 to 24 days in a month with a break around full moon (Government of Kenya, 2011).
Superimposed on the lunar cycles of the catches, are larger seasonal and inter-annual fluctuations
which are typical of short lived fish species (Thiaw et al., 2011). Fresh fish is preferred by
consumers, but fluctuating catches, high perishability and poorly developed logistics restrict
marketing of fresh fish to areas near landing sites and retail stores that have refrigeration and
freezing facilities (Oduor-Odote et al., 2010). Dagaa and sardine are caught by artisanal
fishermen. The fish is not iced on board, exposing it to ambient temperatures during fishing and
transportation to landing sites (Odoli et al., 2013). This practice leads to landing of fish with
reduced shelf life further restricting marketing and consumption of fresh fish to local villages.
Drying and smoking are necessary if the fish is destined for distant markets.
Sardinella gibbosa is commonly blanched in brine to inhibit microbial growth and enzymatic
activities prior to open air drying (Omodara & Olaniyan, 2012). The processing often results in
products contaminated with soil, droppings from birds and rodents, and infested with flies.
Quality uncertainty is the main barrier in accessing national retail stores restricting sales of dried
fish to low price open-air markets, and people with low income. The growing middle income
2
groups in East Africa (African Development Bank, 2011) and reduced availability of high value
fish species in local markets (IOC, 2012) has resulted in increased demand for dried small fish.
Middle income consumers demand fish of high sensory quality and accessible in retail stores
particularly supermarkets. East Africa member countries are also changing policies regarding
cross-border trade of fish and fishery products (IOC, 2012), necessitating changes along the
value chain to ensure product quality and safety.
Drying racks that are open air ventilated platforms are presently used to meet the quality
standards for dried fish intended for national retail stores (Oduor-Odote et al., 2010). Since rack
drying depends on weather conditions, the quality of the fish is variable. Despite this uncertainty
in quality, small quantities of rack dried fresh water dagaa (R. argentea) have in recent years
been sold in national retail stores.
Fish can be smoke-dried to extend shelf life and improve flavor. Smoking of small pelagic
species has been reported in East Africa (Mhongole & Mhina, 2012). Smoking is traditionally
done in simple kilns that are not energy efficient and at times result in quantitative (physical)
spoilage (Oduor-Odote & Obiero, 2009).
In Africa there is a growing awareness of the nutritional and health benefits associated with fish
consumption (Akintola et al., 2013). Properly processed and packaged dried and smoked fish can
be an important source of stable dietary protein and also of omega-3 polyunsaturated fatty acids
(Bilgin et al., 2008; Akintola et al., 2013). In 2010- 2012 a third or more of the population in
East Africa suffered from malnutrition, with an estimated prevalence of 30% in Kenya, 35% in
Uganda and 39% in Tanzania (FAO, 2014). Cereals and roots are reportedly supplying more than
a half of the dietary energy, with meat contributing less than 3% in 2012 (FAO, 2014).
Nutritional status of the population and food security can be improved if supply of correctly
dried and smoked packaged fish can be enhanced in East Africa and other developing countries.
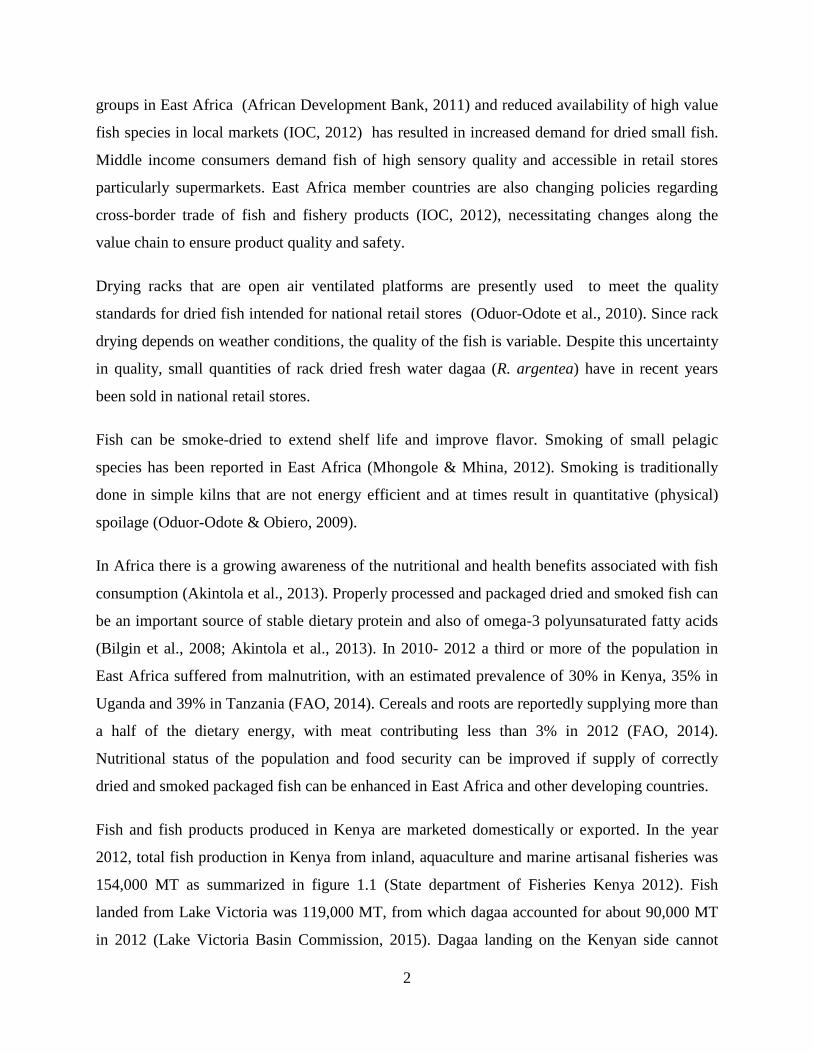
Fish and fish products produced in Kenya are marketed domestically or exported. In the year
2012, total fish production in Kenya from inland, aquaculture and marine artisanal fisheries was
154,000 MT as summarized in figure 1.1 (State department of Fisheries Kenya 2012). Fish
landed from Lake Victoria was 119,000 MT, from which dagaa accounted for about 90,000 MT
in 2012 (Lake Victoria Basin Commission, 2015). Dagaa landing on the Kenyan side cannot
3
meet the demand for small pelagic fish in Kenya (IOC, 2012). Landings of small pelagic fish
mainly sardine approximated at 900 MT from the coastal fisheries cannot fill the gap. Besides,
aquaculture considered to be an alternative source of fish production in Kenya has been tried
with only moderate success, producing 21,500 MT in 2012 representing 14% of the national fish
production Figure 1.1.
Inland capture
fishery,
123,663 , 80%
Marine artisanal
capture fishery,
8,865 , 6%
Fish farming,
21,487 , 14%
Figure 1.1 Total fish production in Kenya in 2012, quantity in MT and ratio in % (with
permission from State department of Fisheries Kenya 2012).
It is a common practice in most developing countries that low value fish, mainly small pelagic, is
imported while more valuable species landed from their waters is exported. In 2008 75% of
fishery exports (in value terms) from developing countries were exported to developed countries,
while 40% of fish they imported (in value terms) for local consumption (mainly low-priced small
pelagic and also high-value species for their processing industries) originated from the developed
countries (FAO, 2010). During 2012 Kenya exported a total of 10,165 metric tons of fish and
fish products valued at KES 4,000 million (approximately 40 million USD) (State department of
Fisheries Kenya 2012). The exported fish was mainly Nile perch, octopus, sword fish and crabs
with Nile perch accounting for 87% of the total quantity and 85% of the total earnings. The fish
was mainly exported to Israel (40%), Netherlands (15%), Germany (8%) and Portugal (7%)
among others. Over the same period 2,622 metric tons of fish excluding dagaa imported from the
4
region were imported largely from Asian countries, notably India, Pakistan, Japan and Korea
mainly as frozen mackerel (62.3%) and sardine (13.7%). The demand for dried small fish in
Kenya can be met by reducing post-harvest losses in the small pelagic species fishery through
improved processing methods and imports or producing dried fish from imported raw material
like capelin (Mallotus villosus) caught in the North Atlantic Ocean.
Dried and smoked fish can easily be contaminated with microbes if sold unpackaged in open-air
markets. Packaging is important in delivering safe and attractive dried and smoked products.
Sardine and capelin that are hygienically produced under controlled drying and smoking
conditions would be new products to the market. Before a decision is made to launch them, they
need to be tested for consumers acceptability and pricing on the intended markets.
2 State of the art
Herein the scientific background relevant to this Ph.D. study is put into perspective giving an
overview of the existing status on the drying, smoking and utilization of small pelagic fish
species in East Africa. Packaging methods, lipid degradation, protein and microbial changes
associated with drying and smoking of fish, distribution and marketing were studied to
understand the mechanisms resulting in degradation in search of ways to enhance quality and
stability. Marketing and utilization of dried and smoked small pelagic fish species are discussed
with emphasis on the East African countries.
2.1 Species of interest
Two fish species were used in the study, sardine (Sardinella gibbosa) and capelin (Mallotus
villosus).
2.1.1 Sardine
Sardine (S. gibbosa) is a species of the family Clupeidae which supports important coastal
fisheries in parts of tropical waters of the western Indo-Pacific, western Indian ocean, Indonesia
and off the coast of Taiwan, Korea and Australia (Okera, 1969; Froese & Pauly, 2006; Wakwabi,
1981). It occurs in shallow waters associated with coral reefs and lives at depths of up to 70 m. S.
gibbosa grows up to 17 cm in length and dominates the sardine catches landed along the East
5
African coast throughout the year (Wakwabi, 1981; Okera, 1969). Almost 900 tons of sardine
were reportedly landed in Kenya in 2012 being 10% of 8,947 tons of artisanal marine fish landed
in Kenya (State Department of Fisheries Kenya 2012). However, personal observation at landing
sites indicates that a much larger quantity than reported is landed, mostly in the southern part of
the Kenyan coast. Data collection and reporting systems on marine fisheries in Kenya are often
poor and landings of low valued species are often ignored or under-reported (Malleret-King et
al., 2009; Gitonga, 2005), resulting in gross underestimation of production statistics. The species
is utilized for human consumption mainly in dried form (Froese & Pauly, 2006; Oduor-Odote et
al., 2010) by low income consumers. It is processed by washing, boiling in brine (blanching) and
sun drying before bulk packaging in woven baskets and sacks.
2.1.2 Capelin
Capelin (M. villosus) is a small pelagic schooling fish that is economically and ecologically
important in the northern hemisphere (ICES, 2009). Large populations occur in the Atlantic and
Pacific Oceans, and important commercial fisheries have developed in the Atlantic (Carscadden
et al., 2013). In Iceland it is caught during spawning migration in winter, from January to March.
Its lipid content depends on maturity and season, and varies from about 4% to 20% body weight
(Bragadóttir et al., 2002) with the highest lipid content in late fall (November-December) and
lowest during the spawning season in March-April (Vilhjálmsson, 2002). Capelin catch in
Iceland has exceeded half a million tons in recent years (Statistics Iceland, 2015). A small
portion of it is used for human food, with about 80% reduced to fishmeal and oil (Statistics
Iceland, 2015). Some female capelin is exported because of the roe while male capelin is less
valued and is usually reduced to fish meal and oil. In 2012, about 570,000 tons of capelin was
landed in Iceland. Fifty five thousand two hundred tons of female capelin was exported to Japan
and Europe as whole fresh/frozen product (valued at ISK 87,000 per ton) and 11,500 tons
exported as roe (valued at ISK 414,000 per ton) altogether valued at ISK 10 billion (approx.
USD 77 million) (Statistics Iceland, 2015). The remaining 500,000 tons mainly males and
females without roe was reduced to fish meal and oil valued together at ISK 40,000 per ton of
raw material. There is a potential to use male capelin that is reduced to fish meal as raw material
for dried and smoked small fish.
6
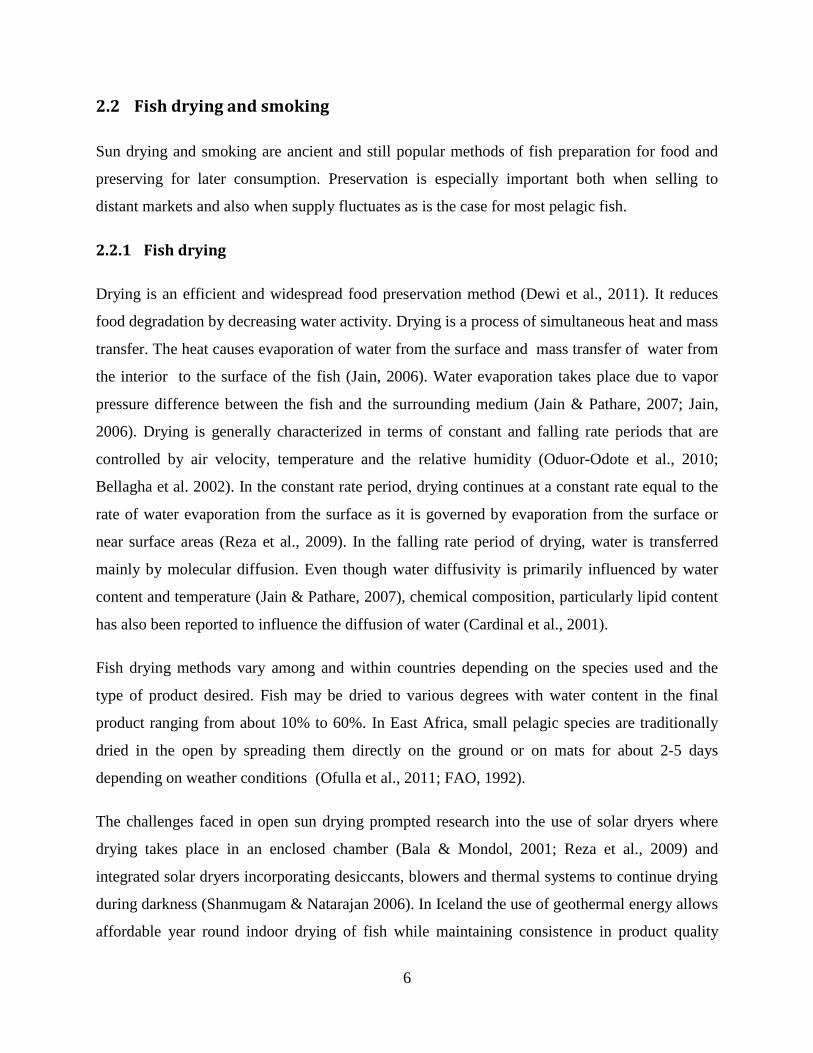
2.2 Fish drying and smoking
Sun drying and smoking are ancient and still popular methods of fish preparation for food and
preserving for later consumption. Preservation is especially important both when selling to
distant markets and also when supply fluctuates as is the case for most pelagic fish.
2.2.1 Fish drying
Drying is an efficient and widespread food preservation method (Dewi et al., 2011). It reduces
food degradation by decreasing water activity. Drying is a process of simultaneous heat and mass
transfer. The heat causes evaporation of water from the surface and mass transfer of water from
the interior to the surface of the fish (Jain, 2006). Water evaporation takes place due to vapor
pressure difference between the fish and the surrounding medium (Jain & Pathare, 2007; Jain,
2006). Drying is generally characterized in terms of constant and falling rate periods that are
controlled by air velocity, temperature and the relative humidity (Oduor-Odote et al., 2010;
Bellagha et al. 2002). In the constant rate period, drying continues at a constant rate equal to the
rate of water evaporation from the surface as it is governed by evaporation from the surface or
near surface areas (Reza et al., 2009). In the falling rate period of drying, water is transferred
mainly by molecular diffusion. Even though water diffusivity is primarily influenced by water
content and temperature (Jain & Pathare, 2007), chemical composition, particularly lipid content
has also been reported to influence the diffusion of water (Cardinal et al., 2001).
Fish drying methods vary among and within countries depending on the species used and the
type of product desired. Fish may be dried to various degrees with water content in the final
product ranging from about 10% to 60%. In East Africa, small pelagic species are traditionally
dried in the open by spreading them directly on the ground or on mats for about 2-5 days
depending on weather conditions (Ofulla et al., 2011; FAO, 1992).
The challenges faced in open sun drying prompted research into the use of solar dryers where
drying takes place in an enclosed chamber (Bala & Mondol, 2001; Reza et al., 2009) and
integrated solar dryers incorporating desiccants, blowers and thermal systems to continue drying
during darkness (Shanmugam & Natarajan 2006). In Iceland the use of geothermal energy allows
affordable year round indoor drying of fish while maintaining consistence in product quality
7
(Arason, 2003). The initial investments in controlled drying systems are high, but dried fish is
stable during long periods of storage and safe for consumption (Reza et al., 2009).
Drying can be done at high temperatures for a short time or at low temperatures for a longer time
(Arason, 2003; Lewicki, 2006). Low drying temperatures have been shown to minimize lipid
oxidation and reduce protein denaturation, resulting in lower nutrient degradation (Bellagha et
al., 2002; Lewicki, 2006). Shelf life of dried fish varies considerably depending on species (lean
or fatty), amounts of salt, degree of drying, packaging and storage temperature.
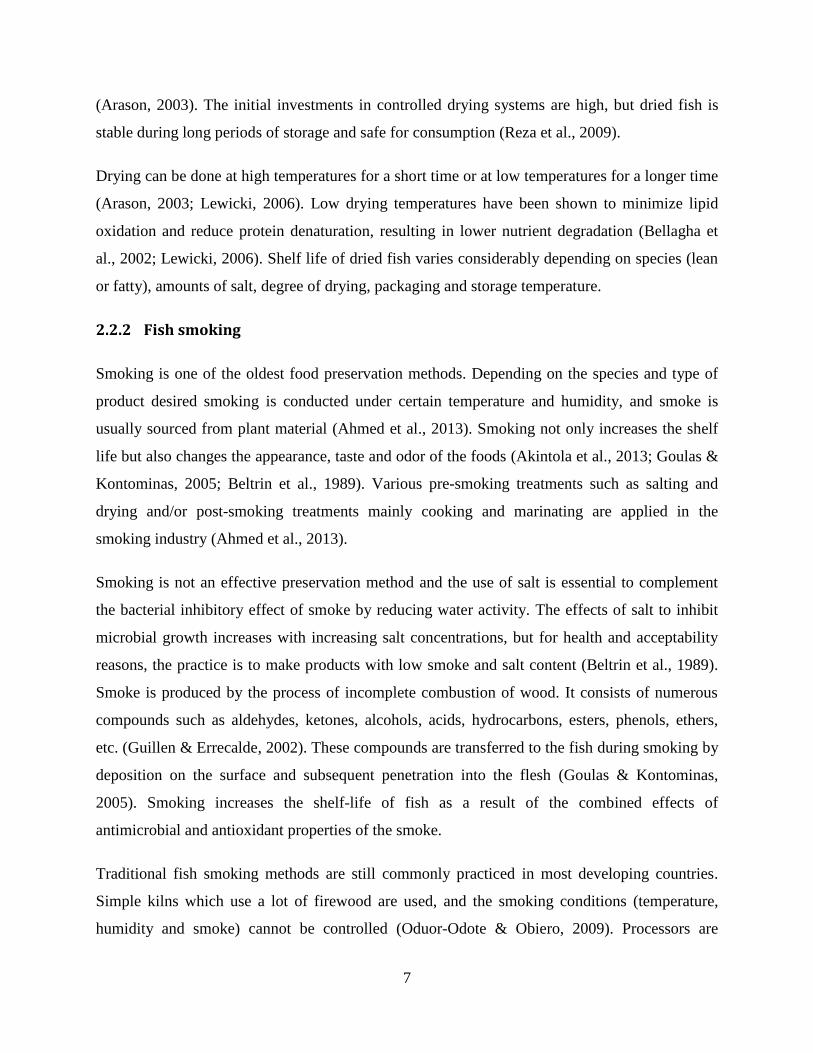
2.2.2 Fish smoking
Smoking is one of the oldest food preservation methods. Depending on the species and type of
product desired smoking is conducted under certain temperature and humidity, and smoke is
usually sourced from plant material (Ahmed et al., 2013). Smoking not only increases the shelf
life but also changes the appearance, taste and odor of the foods (Akintola et al., 2013; Goulas &
Kontominas, 2005; Beltrin et al., 1989). Various pre-smoking treatments such as salting and
drying and/or post-smoking treatments mainly cooking and marinating are applied in the
smoking industry (Ahmed et al., 2013).
Smoking is not an effective preservation method and the use of salt is essential to complement
the bacterial inhibitory effect of smoke by reducing water activity. The effects of salt to inhibit
microbial growth increases with increasing salt concentrations, but for health and acceptability
reasons, the practice is to make products with low smoke and salt content (Beltrin et al., 1989).
Smoke is produced by the process of incomplete combustion of wood. It consists of numerous
compounds such as aldehydes, ketones, alcohols, acids, hydrocarbons, esters, phenols, ethers,
etc. (Guillen & Errecalde, 2002). These compounds are transferred to the fish during smoking by
deposition on the surface and subsequent penetration into the flesh (Goulas & Kontominas,
2005). Smoking increases the shelf-life of fish as a result of the combined effects of
antimicrobial and antioxidant properties of the smoke.
Traditional fish smoking methods are still commonly practiced in most developing countries.
Simple kilns which use a lot of firewood are used, and the smoking conditions (temperature,
humidity and smoke) cannot be controlled (Oduor-Odote & Obiero, 2009). Processors are
8
exposed to smoke and generally poor quality products are produced (Oduor-Odote et al., 2010).
In developed countries, smoking is generally carried out under controlled conditions and can be
in two forms, hot and cold smoking. Hot smoking involves cooking and can be considered mild
(30-50°C) or high temperature (50-80°C) (Marc et al., 1997), but it is commonly carried out at
temperatures of 70-80°C (Erkan et al., 2012). In contrast, cold smoking is achieved without
cooking usually at temperatures ≤30°C resulting in lower nutrient degradation (Goulas &
Kontominas, 2005).
Although small pelagic species are mainly consumed dried in developing countries (Oduor-
Odote et al., 2010; Darvishi et al., 2013), they are also often smoked (Akande & Asuquo-King,
2001; Mhongole & Mhina, 2012). Improved smoking of small pelagic fish could be a promising
method for species such as capelin whose existing fresh markets cannot absorb the large catches
for human consumption.
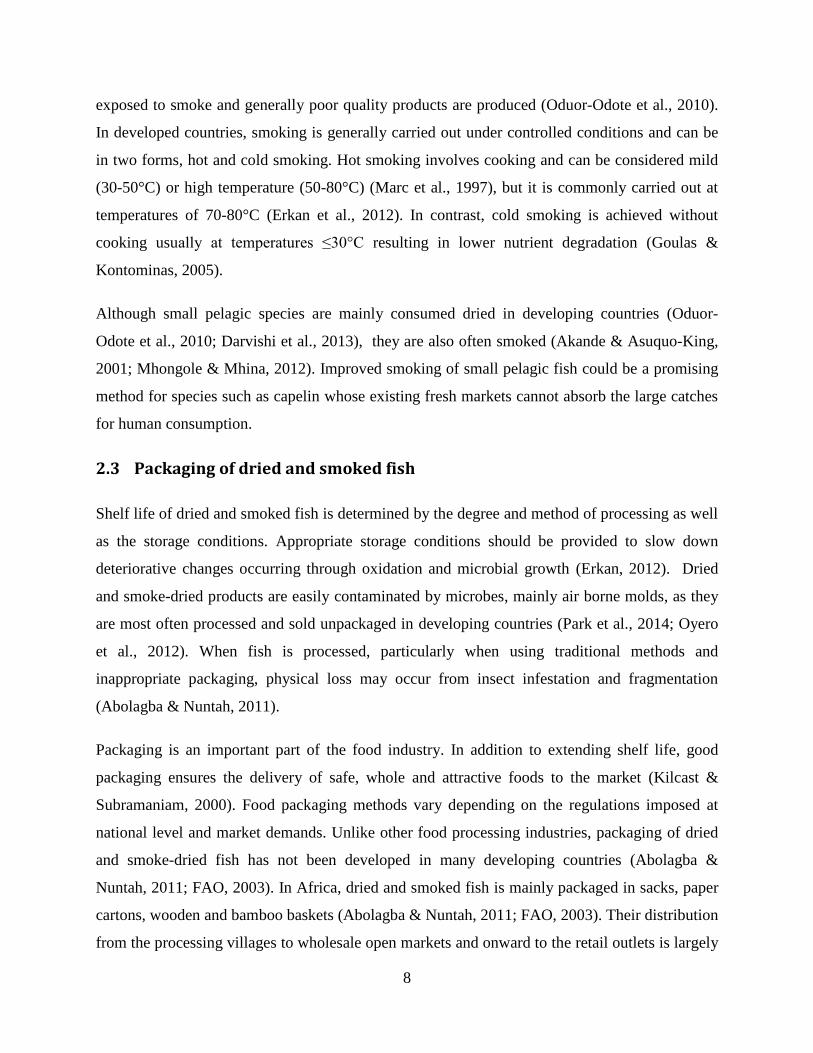
2.3 Packaging of dried and smoked fish
Shelf life of dried and smoked fish is determined by the degree and method of processing as well
as the storage conditions. Appropriate storage conditions should be provided to slow down
deteriorative changes occurring through oxidation and microbial growth (Erkan, 2012). Dried
and smoke-dried products are easily contaminated by microbes, mainly air borne molds, as they
are most often processed and sold unpackaged in developing countries (Park et al., 2014; Oyero
et al., 2012). When fish is processed, particularly when using traditional methods and
inappropriate packaging, physical loss may occur from insect infestation and fragmentation
(Abolagba & Nuntah, 2011).
Packaging is an important part of the food industry. In addition to extending shelf life, good
packaging ensures the delivery of safe, whole and attractive foods to the market (Kilcast &
Subramaniam, 2000). Food packaging methods vary depending on the regulations imposed at
national level and market demands. Unlike other food processing industries, packaging of dried
and smoke-dried fish has not been developed in many developing countries (Abolagba &
Nuntah, 2011; FAO, 2003). In Africa, dried and smoked fish is mainly packaged in sacks, paper
cartons, wooden and bamboo baskets (Abolagba & Nuntah, 2011; FAO, 2003). Their distribution
from the processing villages to wholesale open markets and onward to the retail outlets is largely
9
by road transportation. Means of transportation includes bicycles, motorcycles, pick-up vehicles,
buses and trucks.
In Kenya, only fish marketed in national retail stores (supermarkets) is packaged, which is a
small portion of the total dried and smoke-dried fish in the country. In the traditional open-air
markets where bulk of dried and smoke-dried fish is marketed, fish is sold in open bins of
varying volumes and wrapped afterwards in polyethylene bags or old newspapers. This kind of
packaging can expose polyunsaturated oil in dried and smoked fish to oxygen and microbial
contamination.
Modified atmosphere (MAP) and vacuum packaging are commonly used in the food industry to
extend shelf life and meet consumer demands for better quality products (Sivertsvik et al., 2002;
Etemadian et al., 2012). MAP extends food shelf life by retarding microbial growth especially
when carbon dioxide level is increased. Although most MAP might be too costly for application
in artisanal fisheries, vacuum packaging could be affordable. Vacuum packaging eliminates the
air and is known to improve the shelf life and overall quality of muscle foods (Etemadian et al.,
2012). It inhibits oxidation and aerobic microbial growth.
Due to health reasons, consumers demand smoked fish that contain low quantities of smoke and
salt (Beltrin et al., 1989). Therefore, packaging technologists should be aware of a major concern
limiting the development of vacuum packaging for smoked fish, namely Clostridium botulinum.
C. botulinum has often been reported in seafood products that have been packaged under regimes
designed to limit the availability of oxygen (Aberoumand 2010; Sivertsvik et al. 2002).
Specifically C. botulinum type E is of most concern in this type of packaging as it is a naturally
occurring aquatic organism. Efforts should be considered to assure safety and success of vacuum
packaging of smoked fish by balancing salt content and refrigeration temperature.
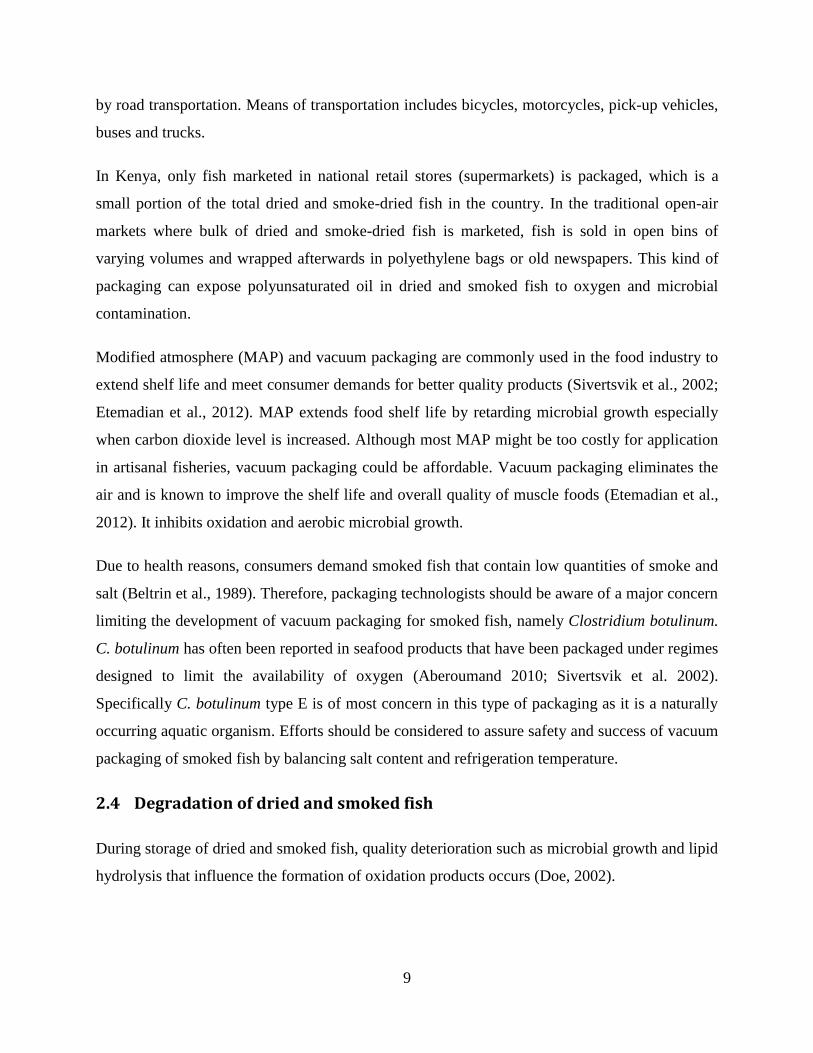
2.4 Degradation of dried and smoked fish
During storage of dried and smoked fish, quality deterioration such as microbial growth and lipid
hydrolysis that influence the formation of oxidation products occurs (Doe, 2002).
10
2.4.1 Microbial spoilage
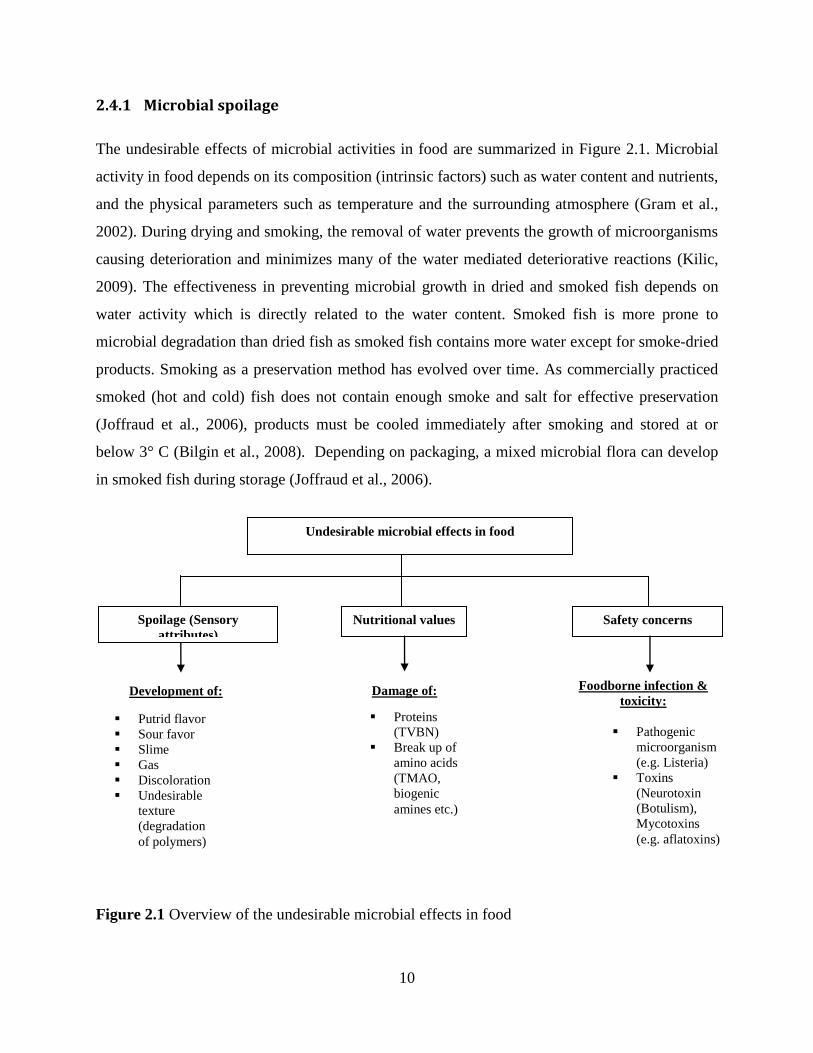
The undesirable effects of microbial activities in food are summarized in Figure 2.1. Microbial
activity in food depends on its composition (intrinsic factors) such as water content and nutrients,
and the physical parameters such as temperature and the surrounding atmosphere (Gram et al.,
2002). During drying and smoking, the removal of water prevents the growth of microorganisms
causing deterioration and minimizes many of the water mediated deteriorative reactions (Kilic,
2009). The effectiveness in preventing microbial growth in dried and smoked fish depends on
water activity which is directly related to the water content. Smoked fish is more prone to
microbial degradation than dried fish as smoked fish contains more water except for smoke-dried
products. Smoking as a preservation method has evolved over time. As commercially practiced
smoked (hot and cold) fish does not contain enough smoke and salt for effective preservation
(Joffraud et al., 2006), products must be cooled immediately after smoking and stored at or
below 3° C (Bilgin et al., 2008). Depending on packaging, a mixed microbial flora can develop
in smoked fish during storage (Joffraud et al., 2006).
Figure 2.1 Overview of the undesirable microbial effects in food
Undesirable microbial effects in food
Spoilage (Sensory
attributes)
Nutritional values Safety concerns
Proteins
(TVBN)
Break up of
amino acids
(TMAO,
biogenic
amines etc.)
Development of: Foodborne infection &
toxicity:
Putrid flavor
Sour favor
Slime
Gas
Discoloration
Undesirable
texture
(degradation
of polymers)
Damage of:
Damage of:
Pathogenic
microorganism
(e.g. Listeria)
Toxins
(Neurotoxin
(Botulism),
Mycotoxins
(e.g. aflatoxins)
11
In most developing countries, dried and smoked fish are often processed and sold in open-air
markets where they are displayed uncovered on tables. Unsanitary handling by both processors
and sellers, dust and insects, expose the fish to contamination (Ikutegbe & Sikoki, 2014). In
dried fish products, yeasts and molds are the most important quality parameters (Kilic, 2009).
Indoor drying and suitable packaging can minimize contaminations by microbes mainly air borne
yeasts and molds (Park et al., 2014). Retailers in the Kenyan markets occasionally re-dry and
smoke unsold products in order to extend shelf-life even further as this is observed to reduce the
incidence of spoilage microorganisms.
2.4.2 Lipid degradation (oxidation and hydrolysis)
Lipids are among the most important constituents of fish muscle and may be divided into two
major components: phospholipids and triglycerides. The phospholipids make up the integral
structure of the cell membranes and are often referred to as structural lipids. Triglycerides are
lipids used for energy storage usually within special fat cells and are often referred to as depot
fat. Fish lipids differ from mammalian lipids in that they contain a higher percent of long-chain
fatty acids that are highly unsaturated, explaining why they are more vulnerable to degradation
mainly through oxidation and hydrolysis (Bragadóttir et al., 2002). The long chain
polyunsaturated fatty acids (PUFA) especially the omega-3 have an excellent nutritional value
(Stołyhwo et al., 2006).
2.4.2.1 Lipid oxidation
Due to relatively high amounts of PUFA in fish (Stołyhwo et al., 2006; Bragadóttir et al., 2002),
lipid oxidation is the most important deteriorative reaction that occurs during fish drying or
smoking, and distribution and marketing (Doe, 2002; Oduor-Odote & Obiero, 2009). It adversely
affects nutritional quality (Underland et al., 1999), wholesomeness and sensory value of food
(Ozen et al., 2011; Stapelfeldt et al., 1997; Driscoll & Madamba, 1994). The undesirable effects
of lipid oxidation on food quality are summarized in Figure 2.2. Lipid oxidation depends on
several factors such as the amount of lipids present, the degree of unsaturated fatty acids and
their location in fish. The primary components for lipid oxidation are the PUFA, oxygen,
proteins and catalysts including metals, enzymes and iron contained in proteins.

12
Figure 2.2 Overview of undesirable effects of lipid oxidation on food quality (modified from
Kolakowska, 2003)
Lipid oxidation can be initiated by non-enzymatic (autoxidation), photogenic (photooxidation)
and/or enzymatic (lipoxygenase) reactions. Photooxidation is caused by UV light, electric
shining light or irradiation, whereas enzymatic initiated lipid oxidation processes are catalyzed
by enzymatic activities and are influenced by temperature, pH, nature of the substrate and
presence/absence of co-factors among others. On the other hand, autoxidation is the primary
cause of lipid oxidation in post mortem fish and it involves a free radical chain mechanism
proceeding via initiation, propagation and termination (Frankel 2005; Erickson 2002). Factors
such as light, temperature, pH and water activity influence the initiation and rate of lipid
oxidation. The autoxidation process of unsaturated lipid is as depicted in Figure 2.3.
Initially a labile hydrogen atom is abstracted from a methylene group adjacent to double bonds in
a lipid molecule, a process triggered by an initiator (Shahidi et al., 1995). The free radical (L·)
reacts with molecular oxygen to form peroxyl radical (LOO·). The peroxyl radical abstracts
hydrogen from adjacent lipid molecules to form lipid hydroperoxide (LOOH) a process referred
to as propagation. Lipid hydroperoxides undergoes further reactions due to metal catalysts to
Proteins
(conformation
and formation
of protein
radicals)
Essential
amino acids
Amino acids
(oxidation)
S-S bonding
Lipid-protein
interaction
Loss of:
Damage
of:
Undesirable effects of lipid oxidation
Sensory attributes Nutritional values Toxicity Technological
Development of: Generation of: Decrease in:
Off odor
Off flavor
Discoloration
Undesirable
texture
Damage of:
Damage of: PUFA
Vitamins
A,D,E
Carotenoids
Physosterols
Other
antioxidants
Hydroperoxides
Aldehydes
Epoxides
Dimers
Oxycholesterols
Trans fatty acids
Maillard type
products
Emulsifying
activity of
proteins
Protein
solubility
13
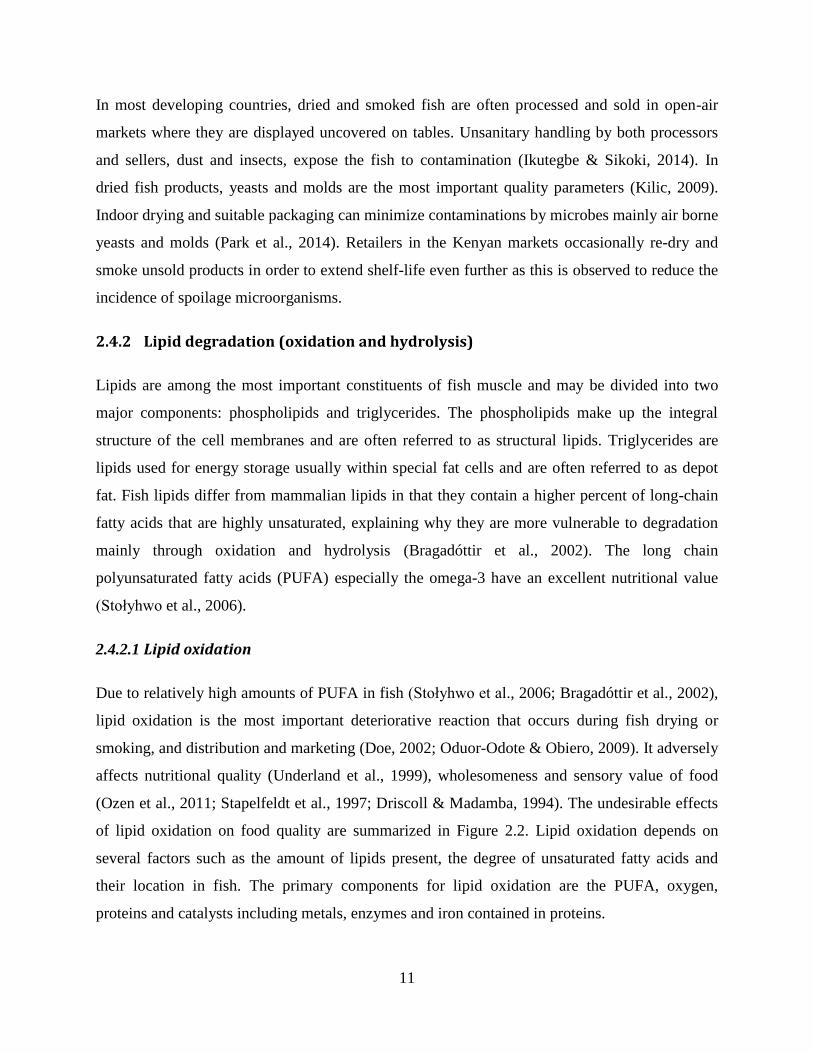
form secondary intermediates of shorter chain length. The secondary autoxidation products
(aldehydes, ketones, alcohols, small carboxylic acids and alkanes) are the cause of off-odor and
off-flavor development during lipid oxidation (Underland et al., 1999; Huss, 1995). The free
radicals of lipid oxidation terminate when their reaction are reduced by a reaction with other
radicals or antioxidant.
Figure 2.3 Autoxidation of polyunsaturated lipid (Adopted from Huss 1995)
2.4.2.2 Lipid hydrolysis
Lipid degradation results in the production of a range of substances that cause rancidity in food
characterized by unpleasant flavor and odor thereby making it undesirable for consumers. The
reactions are either non-enzymatic or catalyzed by microbial enzymes or by intracellular and/or
digestive enzymes from the fish themselves (Huss, 1995). In fish lipid, hydrolysis is largely due
to enzymatic activities mainly of lipase and phospholipases (Chaijan et al., 2006; Shah et al.,
2009).
Hydrolysis of glycerol-fatty acid esters occurs in fish lipid with the liberation of free fatty acids
(Figure 2.4) whose accumulation has been associated with unpleasant sensory properties
(Chaijan et al., 2006; Lopez-Amaya & Marangoni, 2000). The main enzymes involved in fish
lipid hydrolysis are triacyl lipase, phospholipase A2 and phospholipase B (Shah et al., 2009).
14
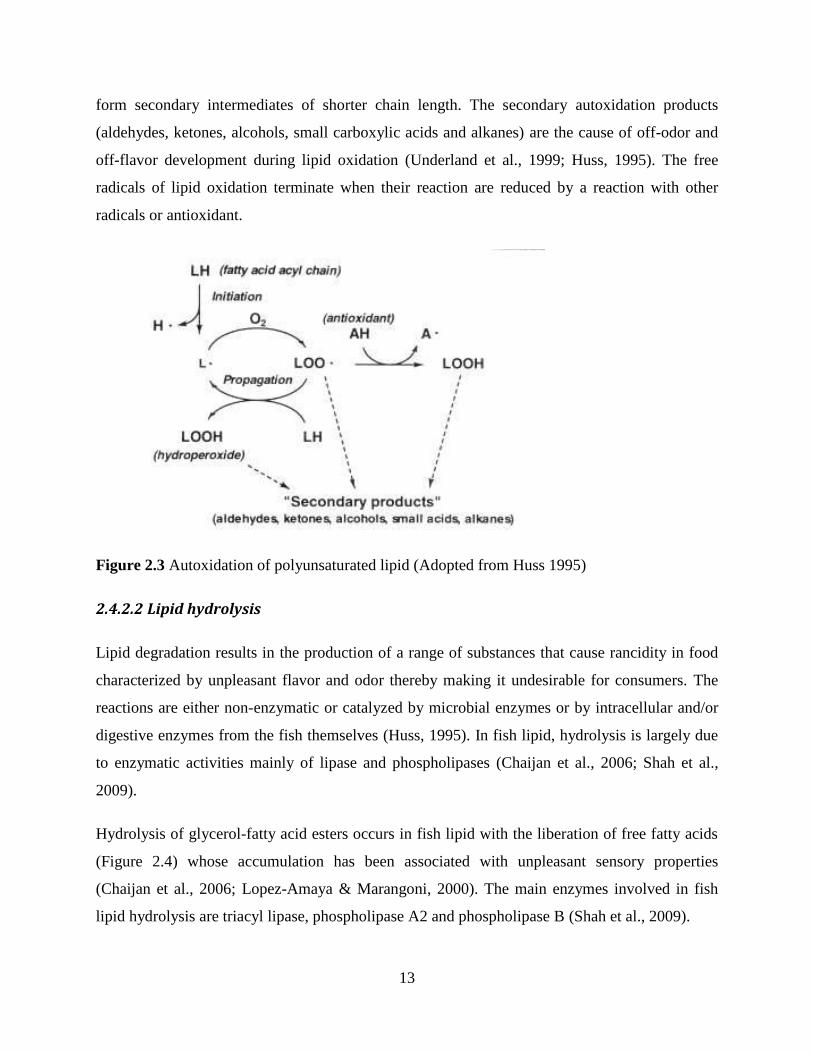
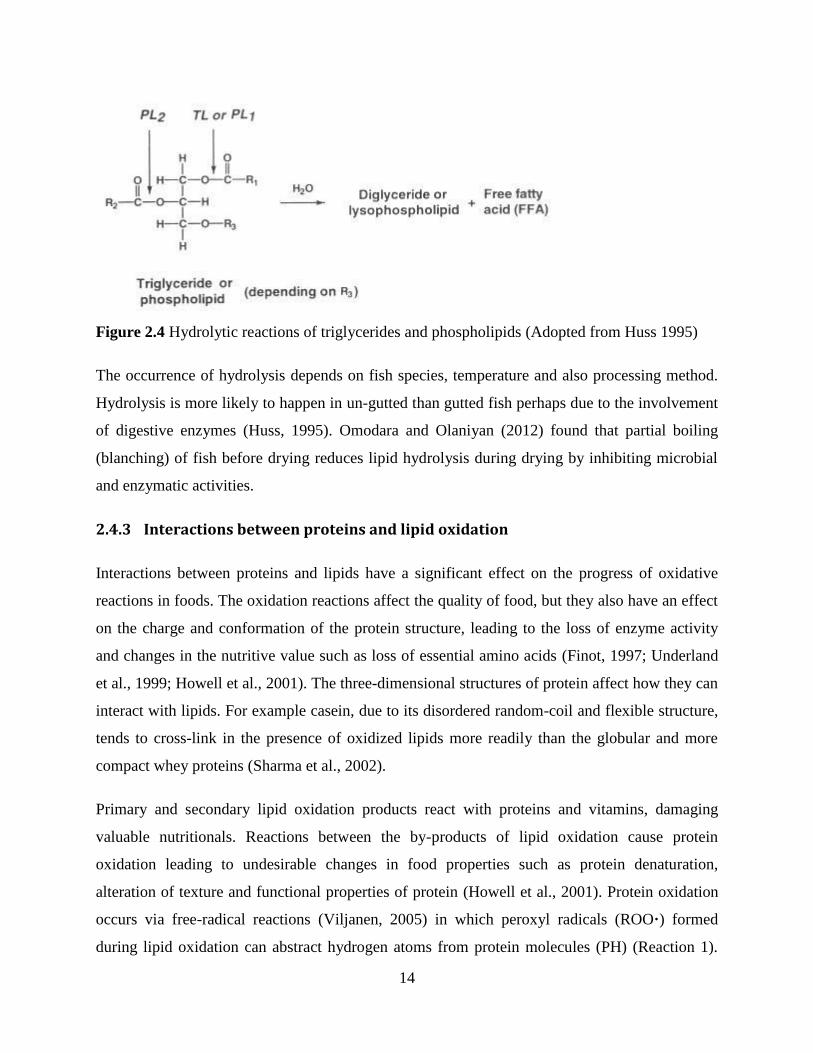
Figure 2.4 Hydrolytic reactions of triglycerides and phospholipids (Adopted from Huss 1995)
The occurrence of hydrolysis depends on fish species, temperature and also processing method.
Hydrolysis is more likely to happen in un-gutted than gutted fish perhaps due to the involvement
of digestive enzymes (Huss, 1995). Omodara and Olaniyan (2012) found that partial boiling
(blanching) of fish before drying reduces lipid hydrolysis during drying by inhibiting microbial
and enzymatic activities.
2.4.3 Interactions between proteins and lipid oxidation
Interactions between proteins and lipids have a significant effect on the progress of oxidative
reactions in foods. The oxidation reactions affect the quality of food, but they also have an effect
on the charge and conformation of the protein structure, leading to the loss of enzyme activity
and changes in the nutritive value such as loss of essential amino acids (Finot, 1997; Underland
et al., 1999; Howell et al., 2001). The three-dimensional structures of protein affect how they can
interact with lipids. For example casein, due to its disordered random-coil and flexible structure,
tends to cross-link in the presence of oxidized lipids more readily than the globular and more
compact whey proteins (Sharma et al., 2002).
Primary and secondary lipid oxidation products react with proteins and vitamins, damaging
valuable nutritionals. Reactions between the by-products of lipid oxidation cause protein
oxidation leading to undesirable changes in food properties such as protein denaturation,
alteration of texture and functional properties of protein (Howell et al., 2001). Protein oxidation
occurs via free-radical reactions (Viljanen, 2005) in which peroxyl radicals (ROO·) formed
during lipid oxidation can abstract hydrogen atoms from protein molecules (PH) (Reaction 1).

15
Consequently, protein radicals are formed (P·), and they can in turn create a protein net (P-P) due
to the cross-linking (Reaction 2).
ROO· + PH P· + ROOH Reaction 1
P· + P· P-P (Protein net) Reaction 2
Lipid oxidation by-products can also physically complex with protein through hydrophobic
association and hydrogen bonds to form various types of covalent bonds (Viljanen, 2005). In the
covalent interaction one or more secondary lipid oxidation product can react with protein
molecules present at the interface of the oil droplets in the oil-in-water emulsion. Amino acids
have also been reported to react with secondary lipid oxidation products forming carbonyl
groups in the proteins thereby generating fluorescent compounds and promoting polymerization
(Zamora et al., 1997). In addition, the hydrophobic environment of proteins is reduced due to
protein lipid interaction leading to the modification of the environment of aromatic amino acids
(Viljanen, 2005).
2.5 Protein denaturation and aggregation
Processing affects the denaturation and aggregation of proteins, particularly if the processing
method involves heating (Ghelichpour & Shabanpour, 2011). Fish protein denaturing
temperature is mainly affected by fish species and water content. Proteins become more
thermally stable with reduced water content (Rustad & Nesse, 1983). Tropical fish species
contain proteins that are more thermally stable than proteins of temperate species (Poulter et al.,
1985). Proteins become more thermally stable with higher habitat temperature (Meneshi et al.,
1976).
Protein denaturation and aggregation is associated with the formation of disulfide bonds and
conformational changes. This includes changes in the reactive groups, mainly loss of hydrophilic
surface, exposure of hydrophobic areas and sulfhydryl groups that are buried or blocked in native
proteins (Nguyen et al., 2011; Baylan et al., 2015; Raman & Mathew, 2014). Secondary and
tertiary structures of proteins can be lost during heating due to a split in hydrogen bonds,
resulting in unfolding of native conformation (Baylan et al., 2015; Raman & Mathew, 2014). The
conformation of proteins plays an important role in defining their functional properties

16
(Ghelichpour & Shabanpour, 2011). Therefore, changes in protein conformation can lead to the
loss of some of their physical and chemical properties (Skipnes et al., 2008; Rustad & Nesse,
1983) affecting the nutritional and textural characteristics of products (Raman & Mathew, 2014).
2.6 Consumption of dried and smoked fish
Depending on the consumer preference, there are several forms in which fish can be consumed;
fresh, dried, fermented, brined etc. The choice and acceptability of a food product are mainly
based on their sensory properties. If a product has low sensory acceptability, no brand or
nutritional and/or health benefit promise will manage to get it accepted by consumers (Sosa et
al., 2008; Hough et al., 2006). But if a product has high sensory acceptability, there are
additional issues that have to be resolved to ensure overall acceptability for instance, packaging,
price, convenience and cultural habits.
Dried and smoked fish are a traditional part of the diet of a large section of the world’s
population (Ahmed et al., 2013; Huda et al., 2010; Reza et al., 2009; Chukwu & Shaba, 2009).
Dried and smoked fish are nutritious food containing highly unsaturated fatty acids, fat soluble
vitamins, essential minerals as well as proteins containing essential amino acids (Bilgin et al.
2008; Ahmed et al. 2011). Fresh fish is preferred by most consumers (Ikutegbe & Sikoki, 2014).
There are however limitations such as high perishability of fish after harvest (Cyprian et al.,
2008; Cyprian et al., 2013) and the distances between fishing grounds and marketing outlets that
make marketing of fresh fish difficult, especially in developing nations. The challenges of
extending fresh fish shelf life in many developing countries, results in a higher consumption of
dried and smoke-dried fish (Oduor-Odote et al., 2010; IOC, 2012). In addition to a longer shelf-
life, smoked and dried fish have a desirable taste and remain whole when cooked, making it more
appealing to consumers in some market segments than fresh fish which disintegrates when
cooked (Ikutegbe & Sikoki, 2014).
A considerable proportion of smoked fish is consumed. In Europe, cold and hot smoked fish
products constitute about 15% of the total fish consumption (Huda et al., 2010; Stołyhwo &
Sikorski, 2005). The consumer preference for these products is not only for their traditionally
desirable flavor but also the preservation of nutritional quality such as the highly polyunsaturated
fatty acids (PUFAs) and essential amino acids (Stołyhwo et al., 2006; Bilgin et al., 2008).
17
In Eastern Africa, particularly Kenya, Uganda and Tanzania dried small pelagic species are the
most widely consumed fish product (IOC, 2012). Originally the main market for small pelagic
fish was the animal feeds industry. However, due to an increase in human population, decline in
valued species in local markets and improved drying methods, about 80% of small pelagic fish in
East Africa goes for human consumption (IOC, 2012). The consumer preference for these
products is not only because of the flavor, but also the reasonable price (Oduor-Odote et al.,
2010).
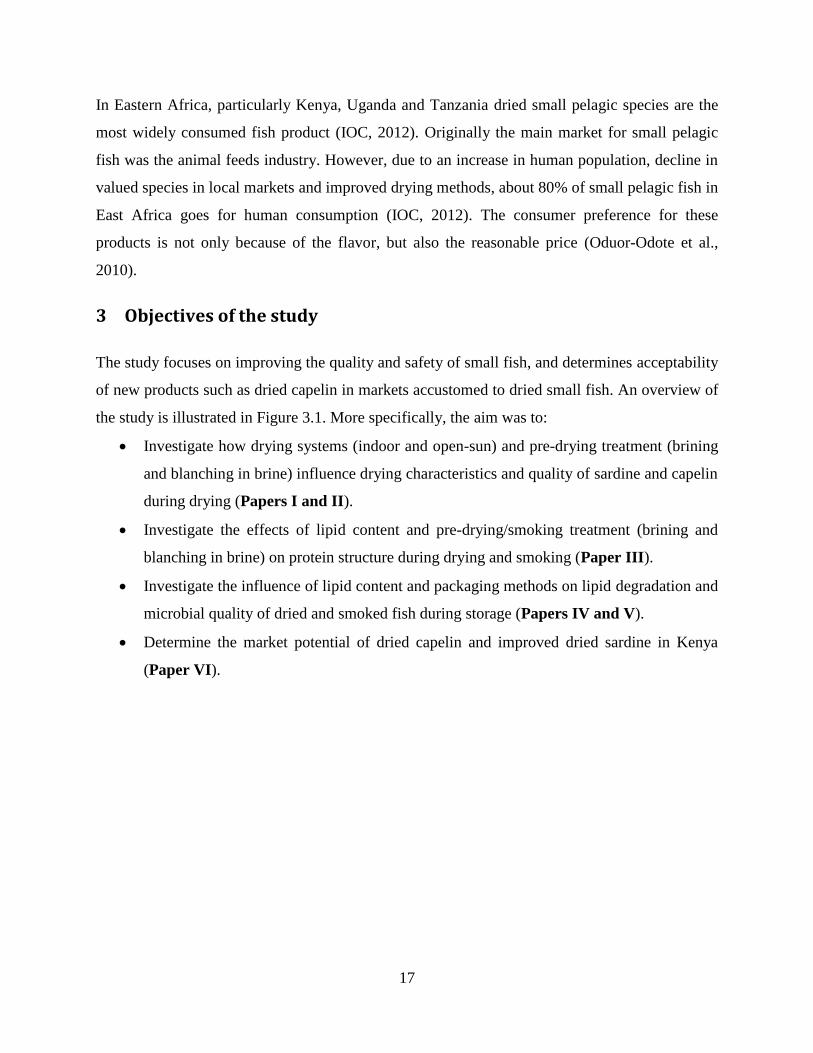
3 Objectives of the study
The study focuses on improving the quality and safety of small fish, and determines acceptability
of new products such as dried capelin in markets accustomed to dried small fish. An overview of
the study is illustrated in Figure 3.1. More specifically, the aim was to:
Investigate how drying systems (indoor and open-sun) and pre-drying treatment (brining
and blanching in brine) influence drying characteristics and quality of sardine and capelin
during drying (Papers I and II).
Investigate the effects of lipid content and pre-drying/smoking treatment (brining and
blanching in brine) on protein structure during drying and smoking (Paper III).
Investigate the influence of lipid content and packaging methods on lipid degradation and
microbial quality of dried and smoked fish during storage (Papers IV and V).
Determine the market potential of dried capelin and improved dried sardine in Kenya
(Paper VI).
18
Figure 3.1 An overview of the studies contained in this thesis (Roman numerical in bold refers
to original papers from the studies).
Measurements
Drying rate
Water content
Lipid oxidation
Proteins solubility
Sensory
attributes
Colour intensity
Measurements
Drying rate
Total lipid
Moisture content
Water activity
Salt content
Lipid oxidation
Colour intensity
Protein conformation (SSP, SH-content, S-S content)
Measurements
Smoking yield
Water and salt
content
Lipid content
Lipid oxidation
Free fatty acids
Phospholipids
Fatty acids profile
Microbial
Sensory attributes
Measurements
Socio-economic
characteristics
Home use test
(acceptability
and willingness
to pay)
Effects of drying methods
on fish quality
Effects of lipid content on
fish quality during drying
and smoking
Effects of packaging
methods on dried and
smoked fish stability
Market potential and
consumer acceptability of
improved dried fish
I II & III IV & V VI
Industrial drying Traditional
drying
Cold & Hot
smoking
Open/sealed/vacuum
packed
Final dried products
(sealed packed)
Sardines Different capelin
materials
19
4 Materials and methods
General descriptions of the materials and methods used are presented here. More detailed
descriptions of the materials and methods can be found in the original papers I-VI in the
appendix.
4.1 Experimental design
The experimental designs of the studies contained in this thesis are described under this chapter
as well as in papers I to VI.
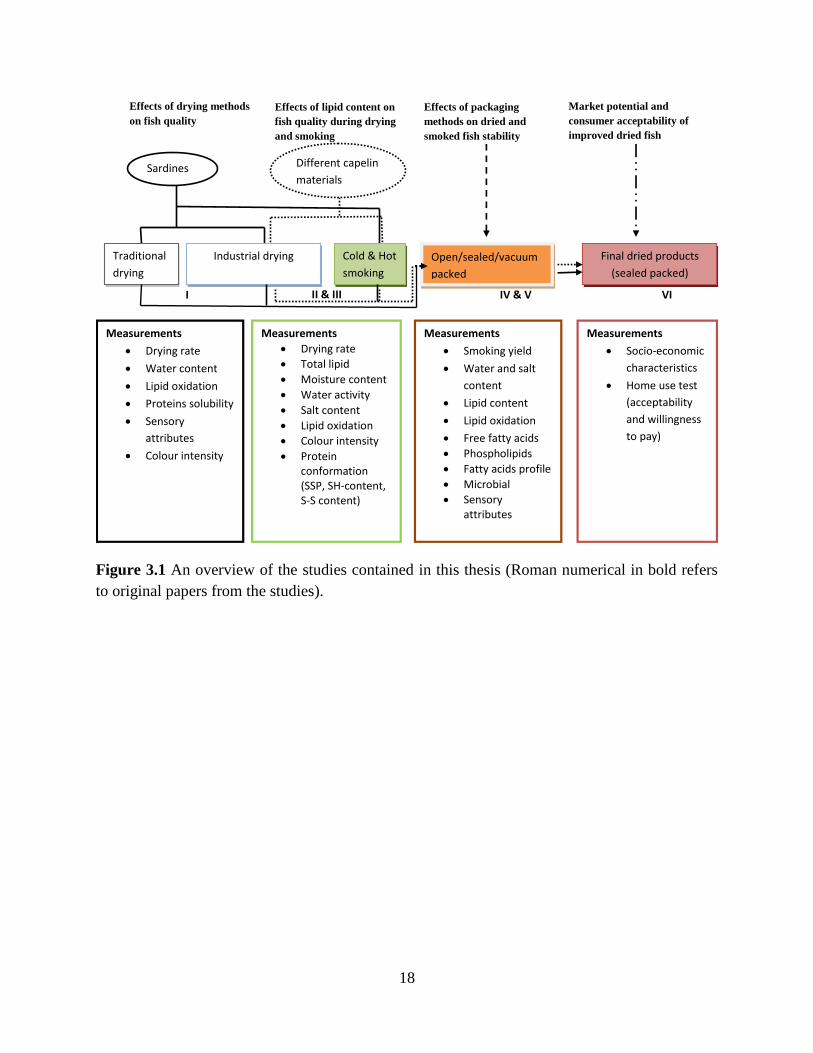
4.1.1 Influence of blanching treatment and drying methods on the drying characteristics
and quality changes in sardine (Sardinella gibbosa) during storage (Paper I)
Frozen sardine caught on 21st March, 2013 was used in the study (Figure 4.1). Sardine was
thawed overnight in open air and upon thawing divided into two equal portions. One portion was
blanched in brine for three minutes and the other portion brined for two hours and used as
control.
Figure 4.1 Experimental design for study on the influence of blanching and drying methods on
the drying rate, quality and lipid stability of sardine (paper I).
Raw
material
Sardine
Pre-
treatment
Blanching in
brine
Brining
Brine 5%
NaCl salt
Drying system
Industrial
Traditional
Varied
conditions
Measuments
Temperature RH Sample weight Water content Salt content Lipid oxidation Colour intensity FAC SSP Sensory attributes
Sampling
point
During drying
and storage
0 Month
1 Month
2 Months
3 Months
4 Months
5 Months
20
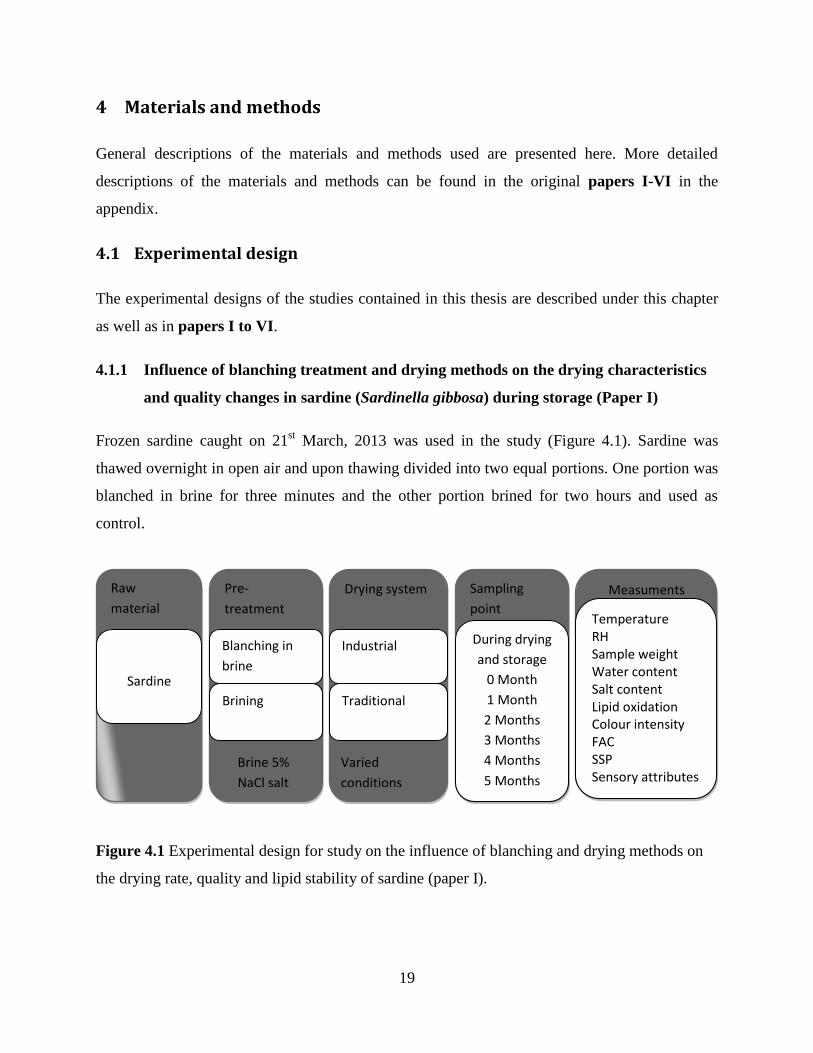
4.1.2 Influence of lipid content and blanching on capelin (Mallotus villosus) drying rate
and lipid oxidation under low temperature drying (Paper II)
Two batches of capelin frozen two days post catch on 13th
February and 7th
March, 2013,
differing in lipid content were used to establish the effects of lipid content and blanching on
capelin drying characteristics and oxidation (Figure 4.2). Fish was thawed overnight in open air,
after which each group was divided into two equal portions for blanching in brine and brining
prior to indoor drying.
Figure 4.2 Experimental design for studying the influence of lipid content and blanching on
capelin drying rate and lipid oxidation (paper II).
4.1.3 Conformational changes in capelin (Mallotus villosus) proteins during smoking and
drying (paper III)
Two batches of frozen capelin caught on 13th
February and 7th
March, 2013 were used in the
study to determine the effects of raw material treatments (blanching in brine and brining) and
lipid content on conformational changes in proteins during fish drying and smoking (Figure 4.3).
Raw
material
Capelin
Lipid content
9%
7%
Pre-
treatment
Blanching in
brine
Brining
Brine 5% NaCl
salt
Measurements
Sample weight Temperature RH Water content Water activity Salt content Total lipid Lipid oxidation Colour intensity
Sampling
time
0 h
17 h
24 h
48 h
72 h
112 h
160 h
184 h
21
Figure 4.3 Experimental design for studying conformational changes in capelin proteins during
smoking and drying (paper III).
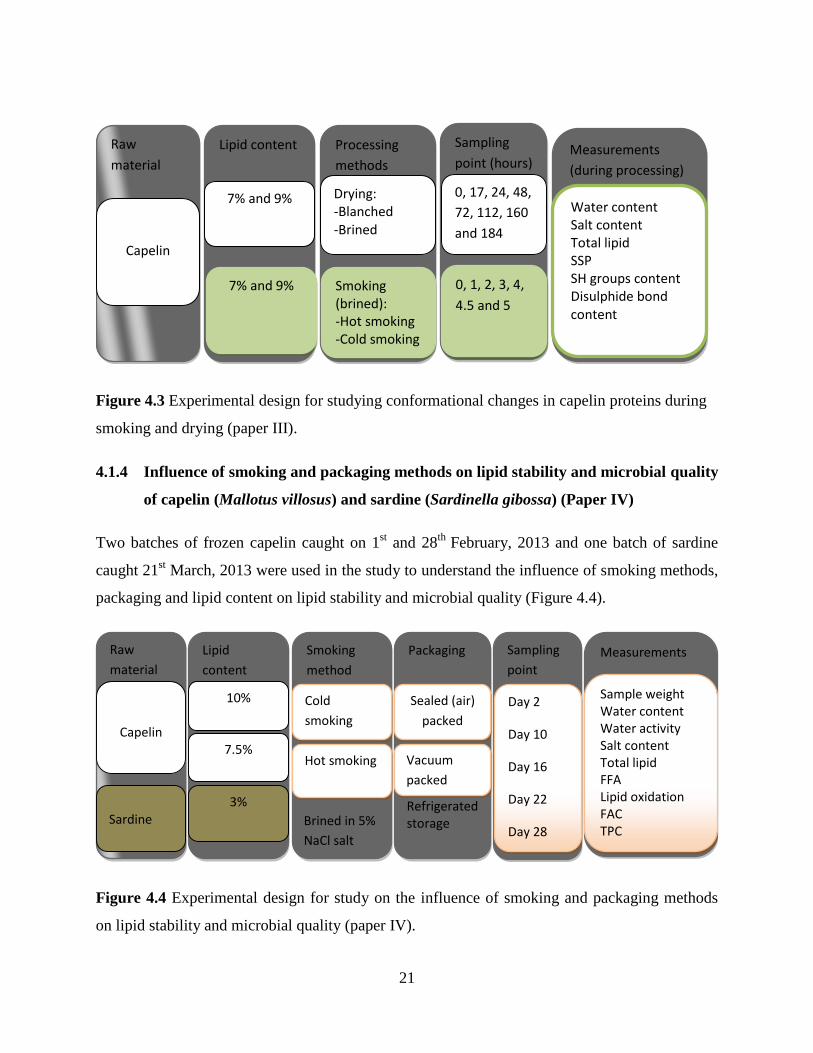
4.1.4 Influence of smoking and packaging methods on lipid stability and microbial quality
of capelin (Mallotus villosus) and sardine (Sardinella gibossa) (Paper IV)
Two batches of frozen capelin caught on 1st and 28
th February, 2013 and one batch of sardine
caught 21st March, 2013 were used in the study to understand the influence of smoking methods,
packaging and lipid content on lipid stability and microbial quality (Figure 4.4).
Figure 4.4 Experimental design for study on the influence of smoking and packaging methods
on lipid stability and microbial quality (paper IV).
Raw
material
Capelin
Sampling
point (hours)
0, 1, 2, 3, 4,
4.5 and 5
0, 17, 24, 48,
72, 112, 160
and 184
Processing
methods
Drying: -Blanched -Brined
Smoking (brined): -Hot smoking -Cold smoking
Lipid content
7% and 9%
7% and 9%
Measurements
(during processing)
Water content Salt content Total lipid SSP SH groups content Disulphide bond content
Raw
material
Capelin
Sardine
Smoking
method
Cold
smoking
Hot smoking
Brined in 5%
NaCl salt
Packaging
Sealed (air)
packed
Vacuum
packed
Refrigerated storage
Lipid
content
10%
7.5%
3%
Measurements
Sample weight Water content Water activity Salt content Total lipid FFA Lipid oxidation FAC TPC
Sampling
point
Day 2
Day 10
Day 16
Day 22
Day 28
22
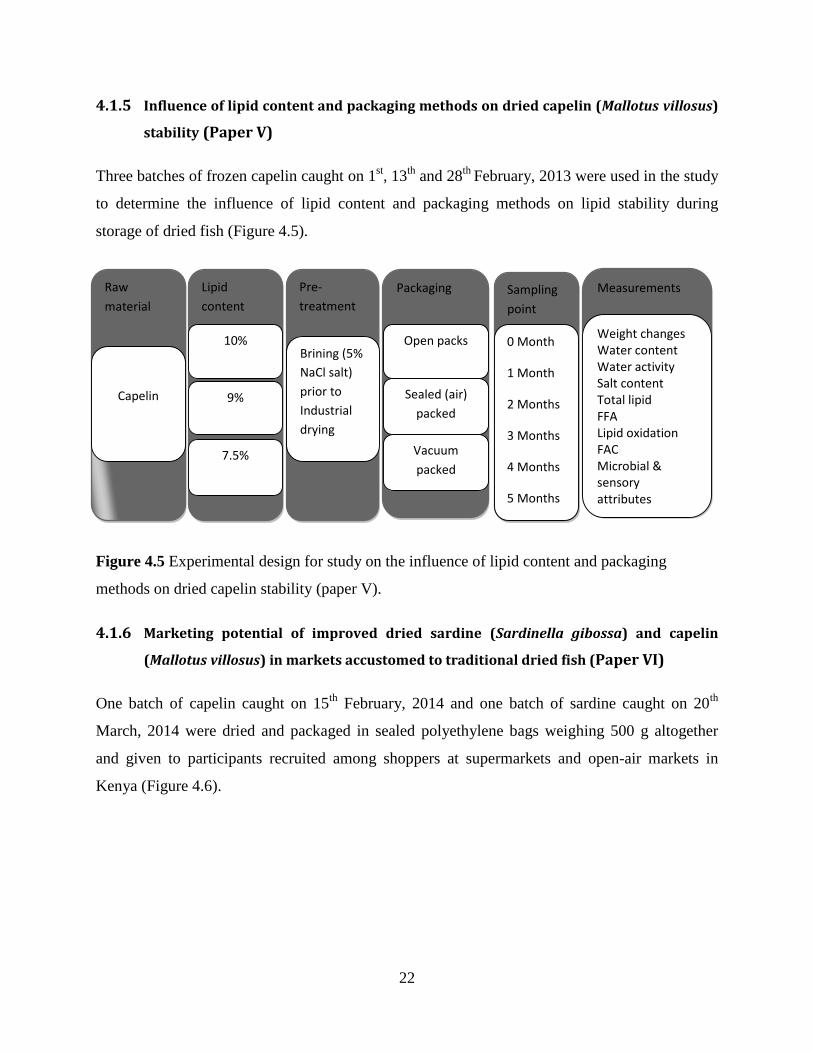
4.1.5 Influence of lipid content and packaging methods on dried capelin (Mallotus villosus)
stability (Paper V)
Three batches of frozen capelin caught on 1st, 13
th and 28
th February, 2013 were used in the study
to determine the influence of lipid content and packaging methods on lipid stability during
storage of dried fish (Figure 4.5).
Figure 4.5 Experimental design for study on the influence of lipid content and packaging
methods on dried capelin stability (paper V).
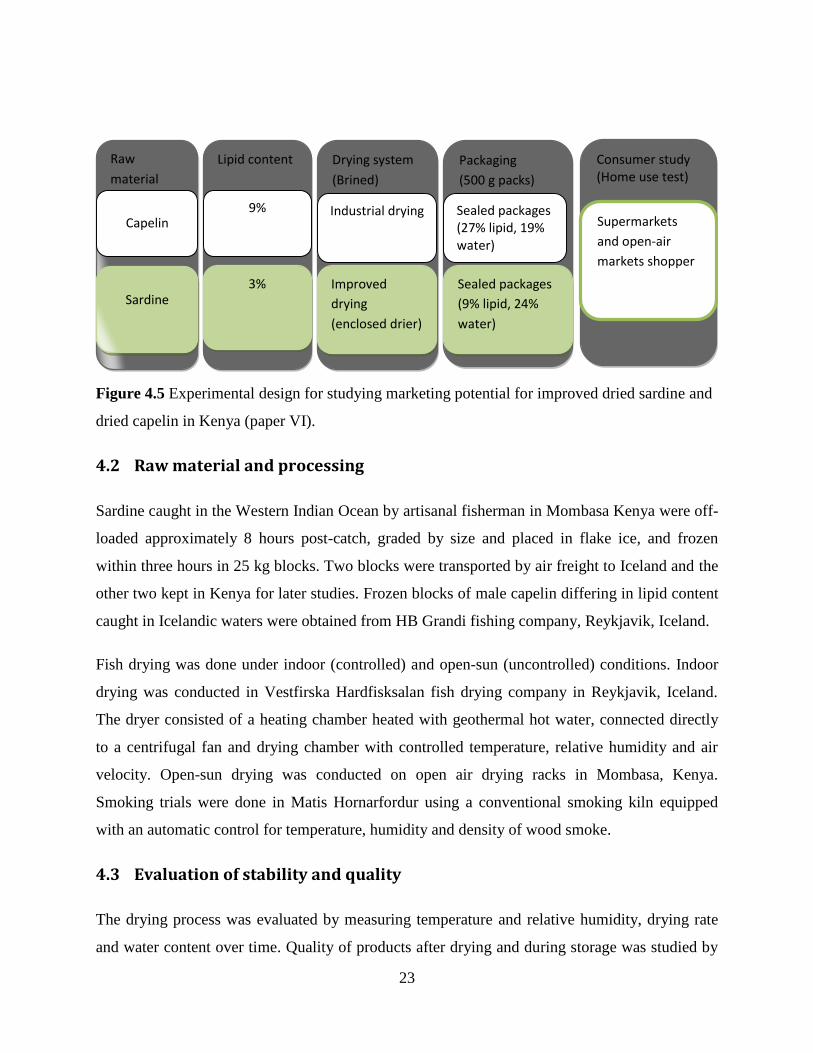
4.1.6 Marketing potential of improved dried sardine (Sardinella gibossa) and capelin
(Mallotus villosus) in markets accustomed to traditional dried fish (Paper VI)
One batch of capelin caught on 15th
February, 2014 and one batch of sardine caught on 20th
March, 2014 were dried and packaged in sealed polyethylene bags weighing 500 g altogether
and given to participants recruited among shoppers at supermarkets and open-air markets in
Kenya (Figure 4.6).
Raw
material
Capelin
Lipid
content
10%
9%
7.5%
Pre-
treatment
Brining (5%
NaCl salt)
prior to
Industrial
drying
Packaging
Sealed (air)
packed
Vacuum
packed
Open packs
Measurements
Weight changes Water content Water activity Salt content Total lipid FFA Lipid oxidation FAC Microbial & sensory attributes
Sampling
point
0 Month
1 Month
2 Months
3 Months
4 Months
5 Months
23
Figure 4.5 Experimental design for studying marketing potential for improved dried sardine and
dried capelin in Kenya (paper VI).
4.2 Raw material and processing
Sardine caught in the Western Indian Ocean by artisanal fisherman in Mombasa Kenya were off-
loaded approximately 8 hours post-catch, graded by size and placed in flake ice, and frozen
within three hours in 25 kg blocks. Two blocks were transported by air freight to Iceland and the
other two kept in Kenya for later studies. Frozen blocks of male capelin differing in lipid content
caught in Icelandic waters were obtained from HB Grandi fishing company, Reykjavik, Iceland.
Fish drying was done under indoor (controlled) and open-sun (uncontrolled) conditions. Indoor
drying was conducted in Vestfirska Hardfisksalan fish drying company in Reykjavik, Iceland.
The dryer consisted of a heating chamber heated with geothermal hot water, connected directly
to a centrifugal fan and drying chamber with controlled temperature, relative humidity and air
velocity. Open-sun drying was conducted on open air drying racks in Mombasa, Kenya.
Smoking trials were done in Matis Hornarfordur using a conventional smoking kiln equipped
with an automatic control for temperature, humidity and density of wood smoke.
4.3 Evaluation of stability and quality
The drying process was evaluated by measuring temperature and relative humidity, drying rate
and water content over time. Quality of products after drying and during storage was studied by
Packaging
(500 g packs)
Sealed packages (27% lipid, 19% water)
Sealed packages
(9% lipid, 24%
water)
Drying system
(Brined)
Industrial drying
Improved
drying
(enclosed drier)
Lipid content
9%
3%
Raw
material
Sardine
Capelin
Consumer study (Home use test)
Supermarkets
and open-air
markets shopper
24
analyzing lipid oxidation (PV and TBARS, fluorescence), lipid hydrolysis (FFA, phospholipids),
fatty acid composition, color (CIELAB, Lab), sensory attributes (Generic Descriptive Analysis)
and protein solubility. Microbial development (total plate counts, yeasts and molds) were also
measured.
The effects of treatments (blanching in brine and brining), lipid content, smoking and drying
methods on the conformational changes in capelin proteins were studied by analyzing water
content, salt content, salt soluble proteins, disulfide bonds content and sulfhydryl groups (total S-
H and available S-H) content.
The effects of smoking, packaging and refrigerated storage on lipid changes, stability and quality
of smoked sardine and capelin were studied by analyzing water, salt, water activity and lipid
content. Lipid oxidation and hydrolysis as well as changes in fatty acid composition and
microbial development (TPC) were also evaluated.
4.4 Marketing potential
Acceptability and willingness to buy dried capelin and improved dried sardine were investigated
in a consumer study carried out in Mombasa and Kwale counties located in the southern part of
the Kenyan coast. Mombasa is cosmopolitan in nature and hosts the main supermarkets along the
Kenyan coast, with the majority of its population belonging to the middle class (Ipsos-Synovate
2013; Kenya National Bureau of Statistics 2015). The main sardine landing beaches along the
Kenyan coast are in Kwale county where consumption of dried sardine is common. Majority of
the population in Kwale county belong to low income class (Ipsos-Synovate 2013; Kenya
National Bureau of Statistics 2015).
Home use test was used in the present study. Participants were recruited from shoppers in three
supermarkets in Mombasa County and three open-air markets in Kwale County over a four week
period. Participants were adults willing to take part in the study. Participants’ details, for instance
phone number and place of residence (when appropriate) were obtained. In the open-air markets
a local person from each area was hired during the period of study to visit particpants in their
homes to ensure complete questionnaires were returned. Participants in supermarkets who
returned completed questionnaires could win a prize which was announced on the radio. A total

25
of 120 consumers participated; 60 supermarket shoppers and 60 open-air market shoppers.
Description of evaluation protocol is as provide in Paper VI.
4.5 Statistical analysis
Data was analyzed using Microsoft Excel 2010 (Microsoft Inc. Redmond, Wash., U.S.A.). One
way analysis of variance (ANOVA), Duncan’s Multiple-Comparison Test (Post-hoc) and
Pearson’s correlation analysis were performed on means of the variable values using the NCSS
2000 statistical program (NCSS, Utah, USA) (Papers I to V). P values of < 0.05 were
considered significant.
Multivariate comparison of different variables and samples was performed using Principal
Component Analysis (PCA) on mean level corrected values using full cross-validation in the
Unscrambler ® statistical program (Version 8.0 CAMO, Trondheim, Norway) to identify
similarities and differences between samples (Paper V). Panelcheck V 1.4.0 (Nofima, Tromsø,
Norway) was additionally used in multivariate comparison of different sensory attributes with
Principal Component Analysis (PCA) (Paper I). Descriptive analyses were done by use of
means, standard error, percentages and frequency distribution of consumers responses’ using the
Statistical Package for the Social Sciences (IBM - SPSS Inc. version 20.0) (Paper VI).
26
5 Main results and discussion
The main results of the study are presented in the following subchapters. More detailed results
can be found in papers I to VI.
5.1 Factors that influence fish drying characteristics and quality
5.1.1 Drying system
Effects on drying characteristics
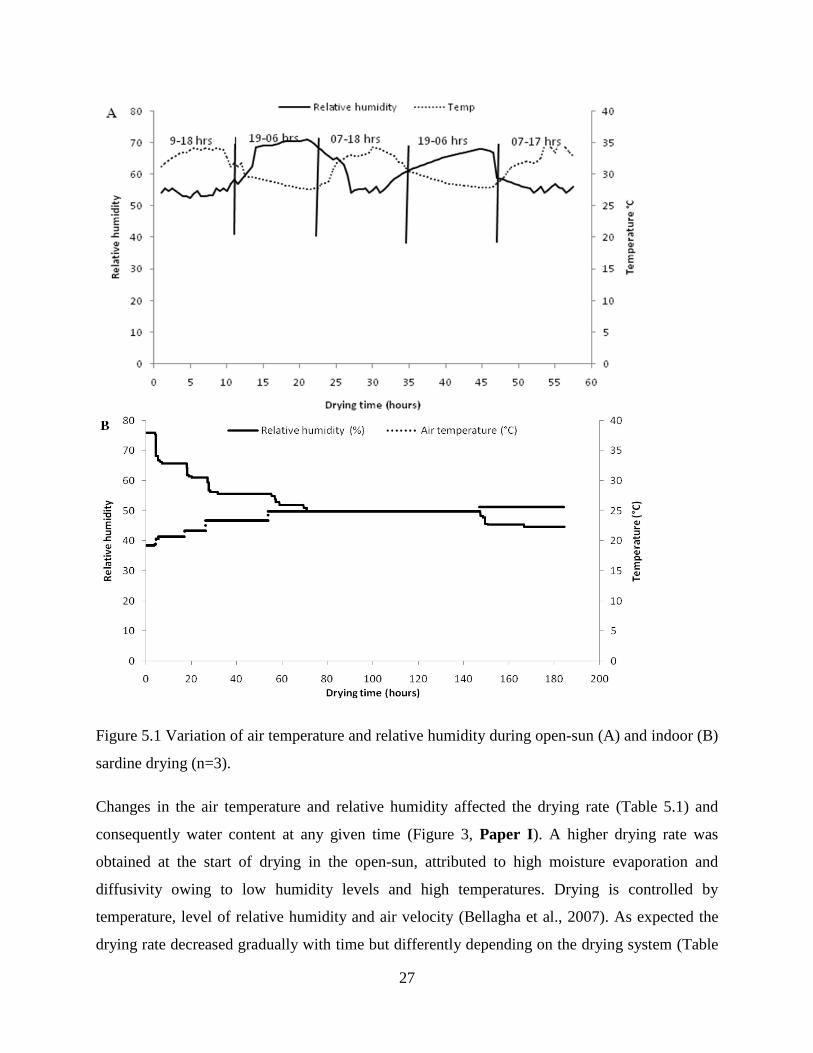
Average air temperature and relative humidity varied during drying in both systems (open-sun
and indoor), with higher temperature in the open-sun drying (Figure 5.1 A and B). Temperature
varied based on weather conditions and time of day during open-sun drying, while it was
increased gradually as drying progressed during indoor drying. Relative humidity was inversely
related to temperature in both drying experiments as can be expected (Oduor-Odote et al., 2010)
and was highest at the start of drying in the indoor system.
27
Figure 5.1 Variation of air temperature and relative humidity during open-sun (A) and indoor (B)
sardine drying (n=3).
Changes in the air temperature and relative humidity affected the drying rate (Table 5.1) and
consequently water content at any given time (Figure 3, Paper I). A higher drying rate was
obtained at the start of drying in the open-sun, attributed to high moisture evaporation and
diffusivity owing to low humidity levels and high temperatures. Drying is controlled by
temperature, level of relative humidity and air velocity (Bellagha et al., 2007). As expected the
drying rate decreased gradually with time but differently depending on the drying system (Table
28
5.1). Water binding in the products increases with drying and in the later drying stages water
diffuses from the interior to reach the surface (Duan et al., 2005; Bellagha et al., 2002). An
increase in drying rate was observed at the beginning of each day after keeping samples
overnight (darkness hours) during traditional drying (after 12 hours interval in Table 5.1). This
was probably due to internal diffusion in the night that allowed water to exit to the surface (with
no external diffusion), resulting to an increasing rate in the drying process at the beginning of the
following day. In general, the drying rate curves were similar with no constant rate period and
had only a falling rate period except at the beginning of each day after keeping samples
overnight under traditional drying conditions (Figure 2, Paper I). It took about 60 and 52 hours
to dry fish to steady moisture content under indoor and open-sun drying conditions respectively.
But indoor dried fish had lower moisture ratio at the end of drying than open-sun dried fish
(Figure 3, Paper I).
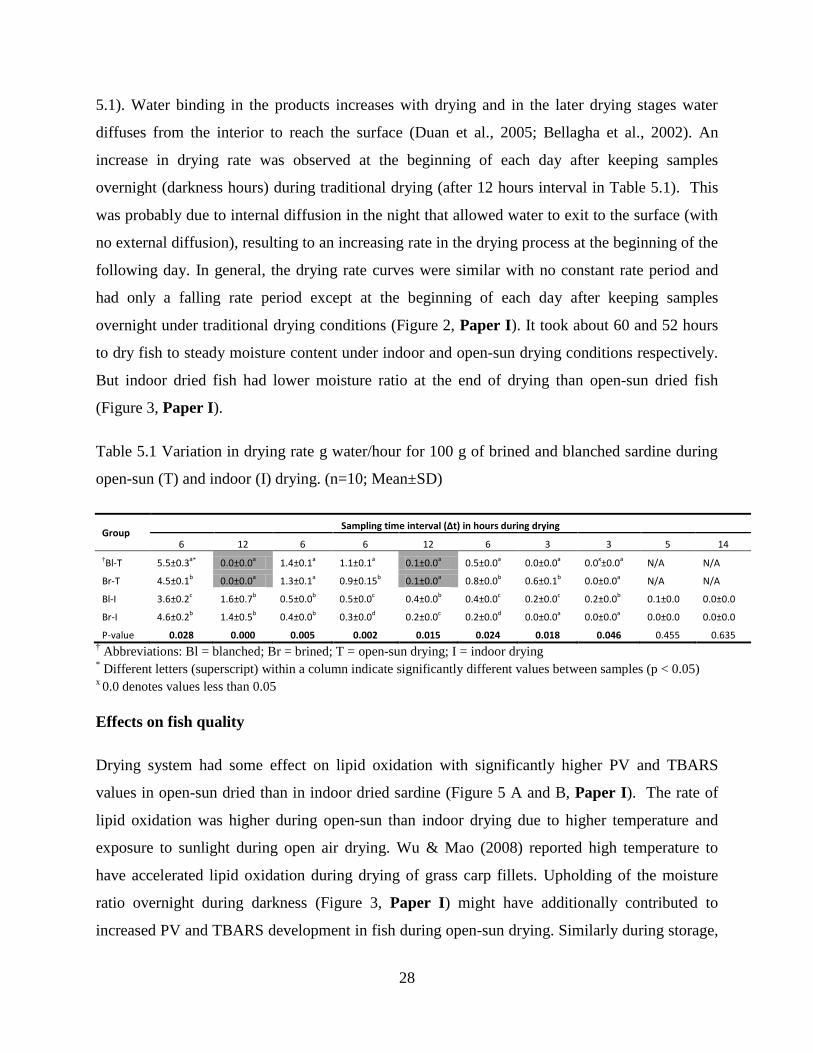
Table 5.1 Variation in drying rate g water/hour for 100 g of brined and blanched sardine during
open-sun (T) and indoor (I) drying. (n=10; Mean±SD)
Group Sampling time interval (∆t) in hours during drying
6 12 6 6 12 6 3 3 5 14
†Bl-T 5.5±0.3a* 0.0±0.0a 1.4±0.1a 1.1±0.1a 0.1±0.0a 0.5±0.0a 0.0±0.0a 0.0x±0.0a N/A N/A
Br-T 4.5±0.1b 0.0±0.0a 1.3±0.1a 0.9±0.15b 0.1±0.0a 0.8±0.0b 0.6±0.1b 0.0±0.0a N/A N/A
Bl-I 3.6±0.2c 1.6±0.7b 0.5±0.0b 0.5±0.0c 0.4±0.0b 0.4±0.0c 0.2±0.0c 0.2±0.0b 0.1±0.0 0.0±0.0
Br-I 4.6±0.2b 1.4±0.5b 0.4±0.0b 0.3±0.0d 0.2±0.0c 0.2±0.0d 0.0±0.0a 0.0±0.0a 0.0±0.0 0.0±0.0
P-value 0.028 0.000 0.005 0.002 0.015 0.024 0.018 0.046 0.455 0.635 † Abbreviations: Bl = blanched; Br = brined; T = open-sun drying; I = indoor drying
* Different letters (superscript) within a column indicate significantly different values between samples (p < 0.05)
x 0.0 denotes values less than 0.05
Effects on fish quality
Drying system had some effect on lipid oxidation with significantly higher PV and TBARS
values in open-sun dried than in indoor dried sardine (Figure 5 A and B, Paper I). The rate of
lipid oxidation was higher during open-sun than indoor drying due to higher temperature and
exposure to sunlight during open air drying. Wu & Mao (2008) reported high temperature to
have accelerated lipid oxidation during drying of grass carp fillets. Upholding of the moisture
ratio overnight during darkness (Figure 3, Paper I) might have additionally contributed to
increased PV and TBARS development in fish during open-sun drying. Similarly during storage,
29
open-sun dried fish had a higher rate of hydroperoxide (PV) and TBARS accumulation and
decomposition (Figure 5 A and B, Paper I) implying open-sun dried sardine was more
vulnerable to lipid oxidation processes (Oduor-Odote & Obiero 2009) than when dried indoor.
Drying conditions also influenced fatty acids (FA) composition with a faster decline in
unsaturated FA during open-sun drying and storage of dried sardine (Table 3, Paper I). The
decline in unsaturated FA was most rapid in fatty acids with double bonds suggesting the impact
of oxidation was higher in PUFA than in other fatty acids. Raw sardine had 26.85 g PUFA/100 g
lipid. PUFA declined in value by 19% and 31% in indoor dried brined and blanched in brine
sardine respectively at the end of 5 months storage. While it declined by 37% and 44% in their
open-sun dried counterparts. DHA that constituted a high proportion of PUFA exhibited the
biggest decline, meaning that it oxidized more readily than other PUFA. This is of concern given
that PUFA, especially EPA and DHA are beneficial to the health of consumers (Bilgin et al.,
2008; Stołyhwo et al., 2006).
The sensory attributes (flavor, odor and texture) of dried fish were not much different between
systems (Figure 7, Paper I). Even though it took longer for the fish to attain stable moisture
during indoor drying, the final products were of better quality and more stable during storage.
5.1.2 Raw material treatments (brining and blanching in brine)
Effects on drying characteristics
Drying rate and water content changes were highest at the start of drying in capelin blanched in
brine (Tables 5.2 and Figure 5.2). Higher drying rate and water loss in blanched capelin was
attributed to denaturation and hydrolysis of myofibrillar proteins that might have occurred during
blanching, affecting muscle water holding capacity (Rustad & Nesse, 1983). More so, high
temperature encountered during blanching may have increased the activity of the water
molecules accelerating their diffusivity. This contradicts our other results obtained during sardine
drying, where no significant difference in drying rate and moisture ratio was obtained between
blanched in brine and brined groups (Table 5.1; Figure 2, Paper I). This could probably be
because the blanching time of 2- 3 minutes used was not long enough to cause greater
denaturation and hydrolysis in sardine proteins since capelin is a temperate species unlike
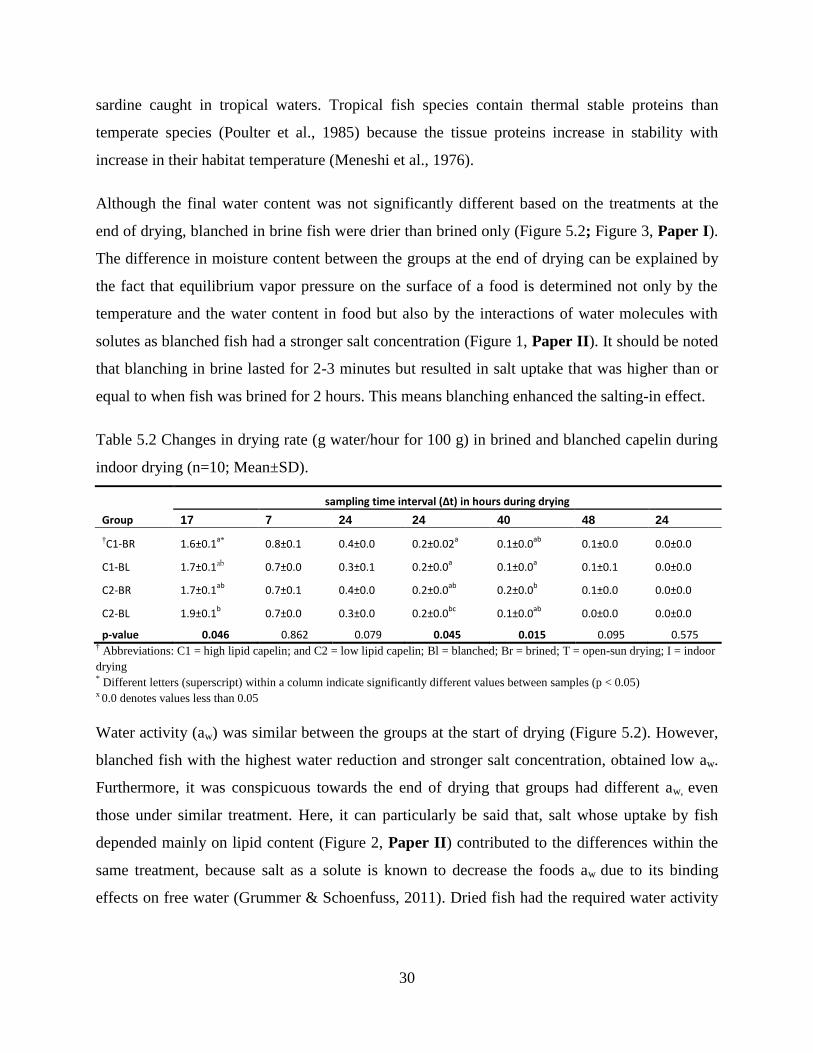
30
sardine caught in tropical waters. Tropical fish species contain thermal stable proteins than
temperate species (Poulter et al., 1985) because the tissue proteins increase in stability with
increase in their habitat temperature (Meneshi et al., 1976).
Although the final water content was not significantly different based on the treatments at the
end of drying, blanched in brine fish were drier than brined only (Figure 5.2; Figure 3, Paper I).
The difference in moisture content between the groups at the end of drying can be explained by
the fact that equilibrium vapor pressure on the surface of a food is determined not only by the
temperature and the water content in food but also by the interactions of water molecules with
solutes as blanched fish had a stronger salt concentration (Figure 1, Paper II). It should be noted
that blanching in brine lasted for 2-3 minutes but resulted in salt uptake that was higher than or
equal to when fish was brined for 2 hours. This means blanching enhanced the salting-in effect.
Table 5.2 Changes in drying rate (g water/hour for 100 g) in brined and blanched capelin during
indoor drying (n=10; Mean±SD).
sampling time interval (∆t) in hours during drying
Group 17 7 24 24 40 48 24
†C1-BR 1.6±0.1a* 0.8±0.1 0.4±0.0 0.2±0.02
a 0.1±0.0
ab 0.1±0.0 0.0±0.0
C1-BL 1.7±0.1ab 0.7±0.0 0.3±0.1 0.2±0.0a 0.1±0.0
a 0.1±0.1 0.0±0.0
C2-BR 1.7±0.1ab
0.7±0.1 0.4±0.0 0.2±0.0ab
0.2±0.0b 0.1±0.0 0.0±0.0
C2-BL 1.9±0.1b 0.7±0.0 0.3±0.0 0.2±0.0
bc 0.1±0.0
ab 0.0±0.0 0.0±0.0
p-value 0.046 0.862 0.079 0.045 0.015 0.095 0.575 † Abbreviations: C1 = high lipid capelin; and C2 = low lipid capelin; Bl = blanched; Br = brined; T = open-sun drying; I = indoor
drying * Different letters (superscript) within a column indicate significantly different values between samples (p < 0.05) x 0.0 denotes values less than 0.05
Water activity (aw) was similar between the groups at the start of drying (Figure 5.2). However,
blanched fish with the highest water reduction and stronger salt concentration, obtained low aw.
Furthermore, it was conspicuous towards the end of drying that groups had different aw, even
those under similar treatment. Here, it can particularly be said that, salt whose uptake by fish
depended mainly on lipid content (Figure 2, Paper II) contributed to the differences within the
same treatment, because salt as a solute is known to decrease the foods aw due to its binding
effects on free water (Grummer & Schoenfuss, 2011). Dried fish had the required water activity
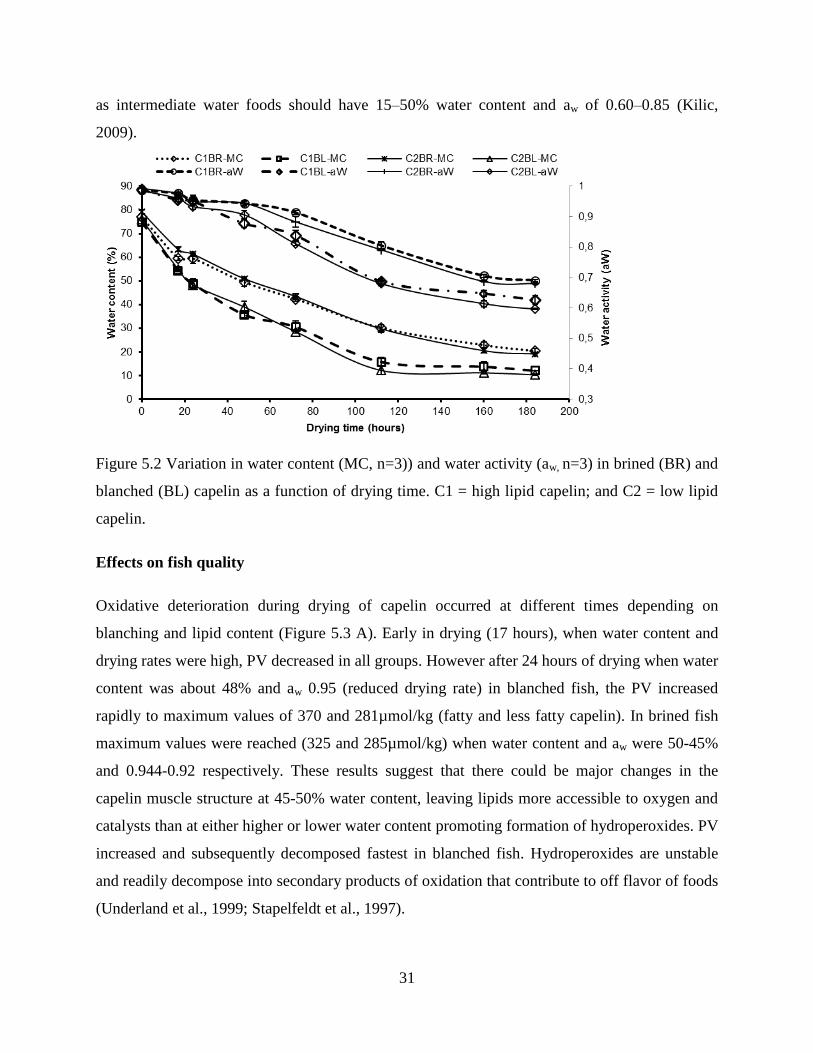
31
as intermediate water foods should have 15–50% water content and aw of 0.60–0.85 (Kilic,
2009).
Figure 5.2 Variation in water content (MC, n=3)) and water activity (aw, n=3) in brined (BR) and
blanched (BL) capelin as a function of drying time. C1 = high lipid capelin; and C2 = low lipid
capelin.
Effects on fish quality
Oxidative deterioration during drying of capelin occurred at different times depending on
blanching and lipid content (Figure 5.3 A). Early in drying (17 hours), when water content and
drying rates were high, PV decreased in all groups. However after 24 hours of drying when water
content was about 48% and aw 0.95 (reduced drying rate) in blanched fish, the PV increased
rapidly to maximum values of 370 and 281µmol/kg (fatty and less fatty capelin). In brined fish
maximum values were reached (325 and 285µmol/kg) when water content and aw were 50-45%
and 0.944-0.92 respectively. These results suggest that there could be major changes in the
capelin muscle structure at 45-50% water content, leaving lipids more accessible to oxygen and
catalysts than at either higher or lower water content promoting formation of hydroperoxides. PV
increased and subsequently decomposed fastest in blanched fish. Hydroperoxides are unstable
and readily decompose into secondary products of oxidation that contribute to off flavor of foods
(Underland et al., 1999; Stapelfeldt et al., 1997).
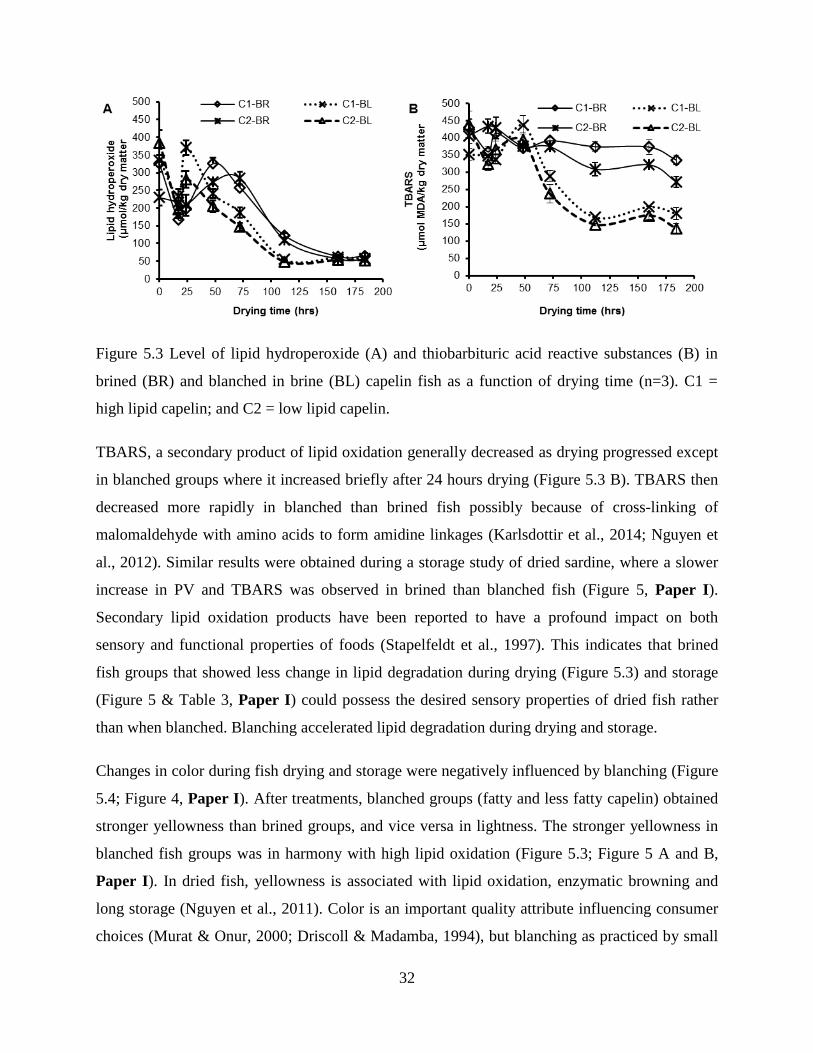
32
Figure 5.3 Level of lipid hydroperoxide (A) and thiobarbituric acid reactive substances (B) in
brined (BR) and blanched in brine (BL) capelin fish as a function of drying time (n=3). C1 =
high lipid capelin; and C2 = low lipid capelin.
TBARS, a secondary product of lipid oxidation generally decreased as drying progressed except
in blanched groups where it increased briefly after 24 hours drying (Figure 5.3 B). TBARS then
decreased more rapidly in blanched than brined fish possibly because of cross-linking of
malomaldehyde with amino acids to form amidine linkages (Karlsdottir et al., 2014; Nguyen et
al., 2012). Similar results were obtained during a storage study of dried sardine, where a slower
increase in PV and TBARS was observed in brined than blanched fish (Figure 5, Paper I).
Secondary lipid oxidation products have been reported to have a profound impact on both
sensory and functional properties of foods (Stapelfeldt et al., 1997). This indicates that brined
fish groups that showed less change in lipid degradation during drying (Figure 5.3) and storage
(Figure 5 & Table 3, Paper I) could possess the desired sensory properties of dried fish rather
than when blanched. Blanching accelerated lipid degradation during drying and storage.
Changes in color during fish drying and storage were negatively influenced by blanching (Figure
5.4; Figure 4, Paper I). After treatments, blanched groups (fatty and less fatty capelin) obtained
stronger yellowness than brined groups, and vice versa in lightness. The stronger yellowness in
blanched fish groups was in harmony with high lipid oxidation (Figure 5.3; Figure 5 A and B,
Paper I). In dried fish, yellowness is associated with lipid oxidation, enzymatic browning and
long storage (Nguyen et al., 2011). Color is an important quality attribute influencing consumer
choices (Murat & Onur, 2000; Driscoll & Madamba, 1994), but blanching as practiced by small
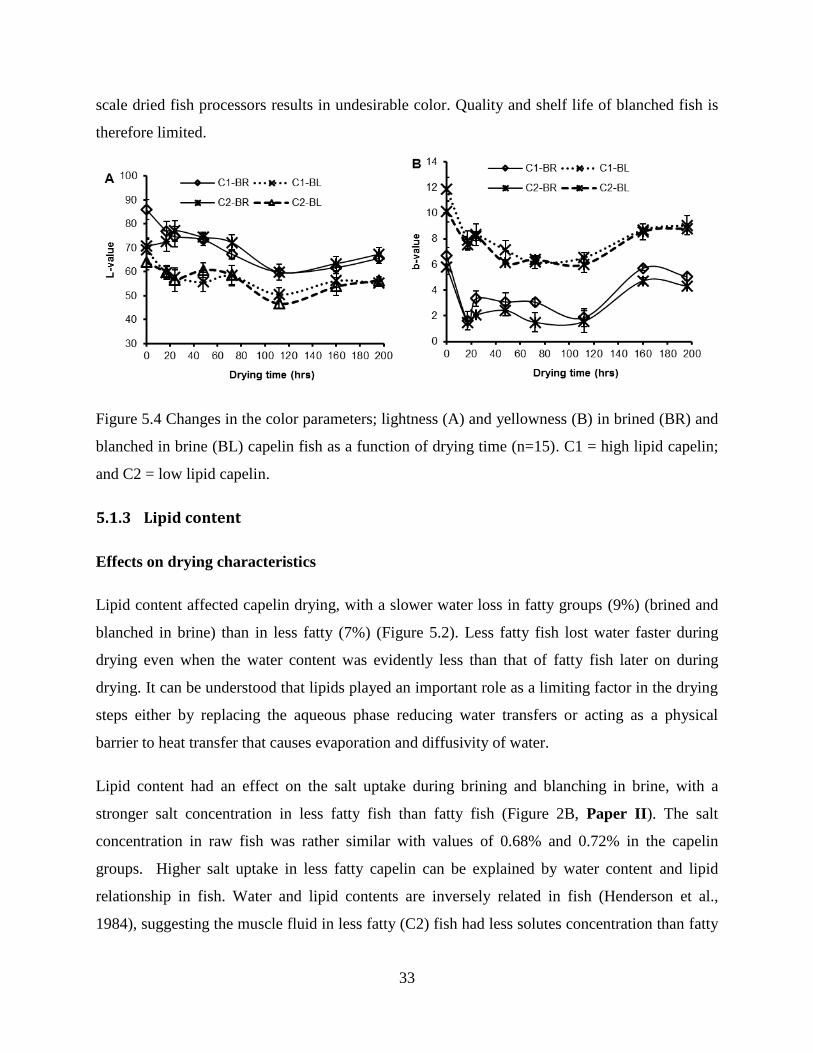
33
scale dried fish processors results in undesirable color. Quality and shelf life of blanched fish is
therefore limited.
Figure 5.4 Changes in the color parameters; lightness (A) and yellowness (B) in brined (BR) and
blanched in brine (BL) capelin fish as a function of drying time (n=15). C1 = high lipid capelin;
and C2 = low lipid capelin.
5.1.3 Lipid content
Effects on drying characteristics
Lipid content affected capelin drying, with a slower water loss in fatty groups (9%) (brined and
blanched in brine) than in less fatty (7%) (Figure 5.2). Less fatty fish lost water faster during
drying even when the water content was evidently less than that of fatty fish later on during
drying. It can be understood that lipids played an important role as a limiting factor in the drying
steps either by replacing the aqueous phase reducing water transfers or acting as a physical
barrier to heat transfer that causes evaporation and diffusivity of water.
Lipid content had an effect on the salt uptake during brining and blanching in brine, with a
stronger salt concentration in less fatty fish than fatty fish (Figure 2B, Paper II). The salt
concentration in raw fish was rather similar with values of 0.68% and 0.72% in the capelin
groups. Higher salt uptake in less fatty capelin can be explained by water content and lipid
relationship in fish. Water and lipid contents are inversely related in fish (Henderson et al.,
1984), suggesting the muscle fluid in less fatty (C2) fish had less solutes concentration than fatty
34
(C1) fish resulting in more salt ions diffusion into C2 than C1. Salt concentration influenced
water activity (aw) in fish which was reduced with increasing salt concentration (Figure 5.2). Salt
as a solute is known to decrease the aw due to its binding effects on free water (Grummer &
Schoenfuss, 2011).
Effects on fish quality
Lipid content had no influence on lipid oxidation during capelin drying (Figure 5.3). Fatty and
less fatty capelin generally had similar trends of hydroperoxide (PV) and TBARS buildup and
breakdown during drying, with relatively high TBARS levels in fatty capelin groups towards the
end of drying. Although fatty fish are particularly susceptible to lipid degradation, capelin
batches used in the study were of medium lipid content (7- 9%) possibly explaining why we did
not obtain differences between the groups. A decrease in hydroperoxides as a result of
decomposition was noted, but could not have influenced fish quality since hydroperoxides are
known to have no impact on sensory properties of food (Stapelfeldt et al., 1997). TBARS known
to contribute to off flavor in foods (Underland et al., 1999) remained moderately stable during
drying.
Changes in color were not significantly different between fatty and less fatty fish, despite a
strong yellowness in fatty groups (Figure 5.4). This suggests that changes in yellowness during
drying might have been caused mainly by enzymatic browning since a weak correlation between
yellowness and PV (r ≤ 0.02), yellowness and TBARS (r ≤ 0.05) was obtained in all groups.
Lightness decreased in all groups during drying.
35
5.1.4 Summary
Blanching enhanced fish salt uptake and water loss during drying thereby resulting in low
water content and water activity desired for product stability.
Blanching and open-sun drying had a negative influence of fish quality as demonstrated
in development of undesirable yellowness, faster rate of lipid oxidation and decline in
PUFA.
Indoor drying conditions and fish batches studied produced dried products with required
moisture content and water activity for stability during storage.
A stable dried product of superior quality was produced from un-blanched fish dried
under controlled conditions (indoor system), demonstrating the need for developing of
controlled drying systems for commercial small fish drying.
Lipid content affected the drying rate and products moisture content, with less fatty fish
exhibiting faster drying, stability in quality during drying and lower moisture content.
36
5.2 Conformation changes in capelin proteins during drying and smoking
Capelin harvested at two different times was used to evaluate the effects of brining and
blanching in brine on conformational changes in the proteins during drying and smoking and
how the changes were affected by variation in lipid content. The lipid content in fatty capelin
was 9%, whereas less fatty capelin had 7%.
5.2.1 Changes in lipid, water and salt content
Changes in lipid, water and salt content were measured as they are believed to influence protein
conformation. Blanching reduced lipid content of capelin more than brining (Table 5.3). This
might be due to exudation of lipid during blanching and drip drying. Similarly, water content
was reduced after the treatments, and more after blanching, a phenomenon attributed to the
reduced water holding capacity due to protein denaturation (Rustad & Nesse, 1983).
Contrary to lipid and water contents, salt concentration increased after fish treatments, increasing
most in less fatty and blanched brined capelin (Table 5.3). This could be due to the differences in
raw material water and salt contents. Moreover, higher salt concentration in less fatty capelin
after brining and blanching in brine imply that lipid act as a barrier to salt uptake since the uptake
was slower in fatty fish. Lipid and salt concentration increased after drying and smoking, with
significant differences between the groups reported only in salt concentration. This could be
explained by the dehydration level and loss of lipid during blanching. The drier the fish became
the higher the salt content.

37
Table 5.3 Lipid, salt and content of raw and processed (dried and smoked) capelin differing in
lipid content (n=4; Mean±SD)
Capelin batch Variable Raw
material
Treatment
Dried products
Smoked products
Brined Blanched-Brined * Brined Blanched-Brined Brined-Cold Brined-Hot
High lipid (C1) Lipida 9.1±0.2a
9.±0.4a 7.4±0.0b
28.1±0.5c 27.1±0.7c
- -
Salt 0.7±0.0
∆a
2.0±0.2b 2.2±0.0b
6.2±0.2c 7.6±0.1d
- -
Water 76.8±0.1a
76.9±1.1a 74.9±0.9b
20.4±1.0c 12.0±0.5d
- -
Low lipid (C2) Lipid 7.0±0.3a
6.8±0.1a 6.3±0.2b
27.2±0.1c 27.4±0.8c
- -
Salt 0.7±0.0a
2.4±0.0b 2.4±0.1b
8.8±0.1c 9.6±0.3d
- -
Water 78.2±1.1ab
79.1±1.6a 76.1±1.0b
19.1±0.6c 10.3±0.7d
- -
High lipid (C1) Lipid 9.1±0.2a
9.00±0.4a -
- -
16.0±0.5b 17.8±0.6c
Salt 0.7±0.0a
2.0±0.2b -
- -
3.5±0.4c 3.8±0.4c
Water 76.8±0.1a
76.9±1.1a -
- -
59.1±1.5b 54.5±0.8c
Low lipid (C2) Lipid 7.0±0.3a
6.75±0.1a -
- -
13.2±0.7b 15.2±1.0c
Salt 0.7±0.0a
2.4±0.0b -
- -
4.3±0.3c 4.7±0.2c
Water 78.2±1.1a
79.1±1.6a -
- -
57.8±1.2b 53.7±0.8c aAbbreviations: Lipid (% lipid content), Salt (% lipid content), (% content).
*Treatment done only for drying trials. -Reported earlier/later.
a-dDifferent letters within a row indicate significantly different values between samples (p < 0.05).
∆Values equal to 0.0 are values less than 0.05
5.2.2 Changes in protein solubility (salt soluble proteins)
Protein solubility (SSP) was reduced in all groups as drying progressed and was lowest in
blanched brined less fatty capelin (Figure 5.5). The significant decrease in SSP after blanching
in brine and during drying (Figure 5.5 A) is thought to be due to conformational changes in the
proteins. Denaturation and hydrolysis of myofibrillar proteins result in increased hydrophobicity.
This might have occurred during blanching thereby reducing the content of thermolabile
compounds such as amino acids (Ghelichpour & Shabanpour, 2011; Finot, 1997). Although
blanched brined capelin contained more salt than brined capelin after the treatments (Table 5.3),
it was not significantly different. Therefore influence of salt on protein solubility was not
detected mainly due to low salt concentrations after treatments (< 2.5%). Similar results were
obtained before smoking in which case only brined capelin groups were used (Figure 5.5 B).
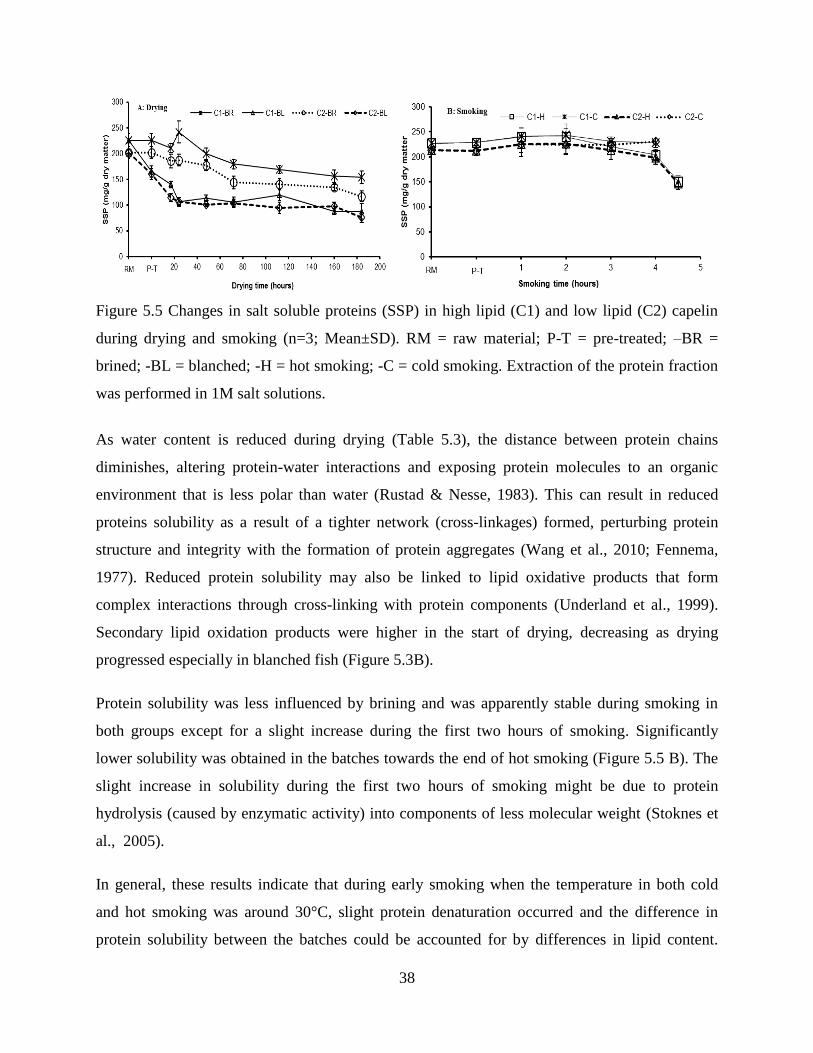
38
Figure 5.5 Changes in salt soluble proteins (SSP) in high lipid (C1) and low lipid (C2) capelin
during drying and smoking (n=3; Mean±SD). RM = raw material; P-T = pre-treated; –BR =
brined; -BL = blanched; -H = hot smoking; -C = cold smoking. Extraction of the protein fraction
was performed in 1M salt solutions.
As water content is reduced during drying (Table 5.3), the distance between protein chains
diminishes, altering protein-water interactions and exposing protein molecules to an organic
environment that is less polar than water (Rustad & Nesse, 1983). This can result in reduced
proteins solubility as a result of a tighter network (cross-linkages) formed, perturbing protein
structure and integrity with the formation of protein aggregates (Wang et al., 2010; Fennema,
1977). Reduced protein solubility may also be linked to lipid oxidative products that form
complex interactions through cross-linking with protein components (Underland et al., 1999).
Secondary lipid oxidation products were higher in the start of drying, decreasing as drying
progressed especially in blanched fish (Figure 5.3B).
Protein solubility was less influenced by brining and was apparently stable during smoking in
both groups except for a slight increase during the first two hours of smoking. Significantly
lower solubility was obtained in the batches towards the end of hot smoking (Figure 5.5 B). The
slight increase in solubility during the first two hours of smoking might be due to protein
hydrolysis (caused by enzymatic activity) into components of less molecular weight (Stoknes et
al., 2005).
In general, these results indicate that during early smoking when the temperature in both cold
and hot smoking was around 30°C, slight protein denaturation occurred and the difference in
protein solubility between the batches could be accounted for by differences in lipid content.
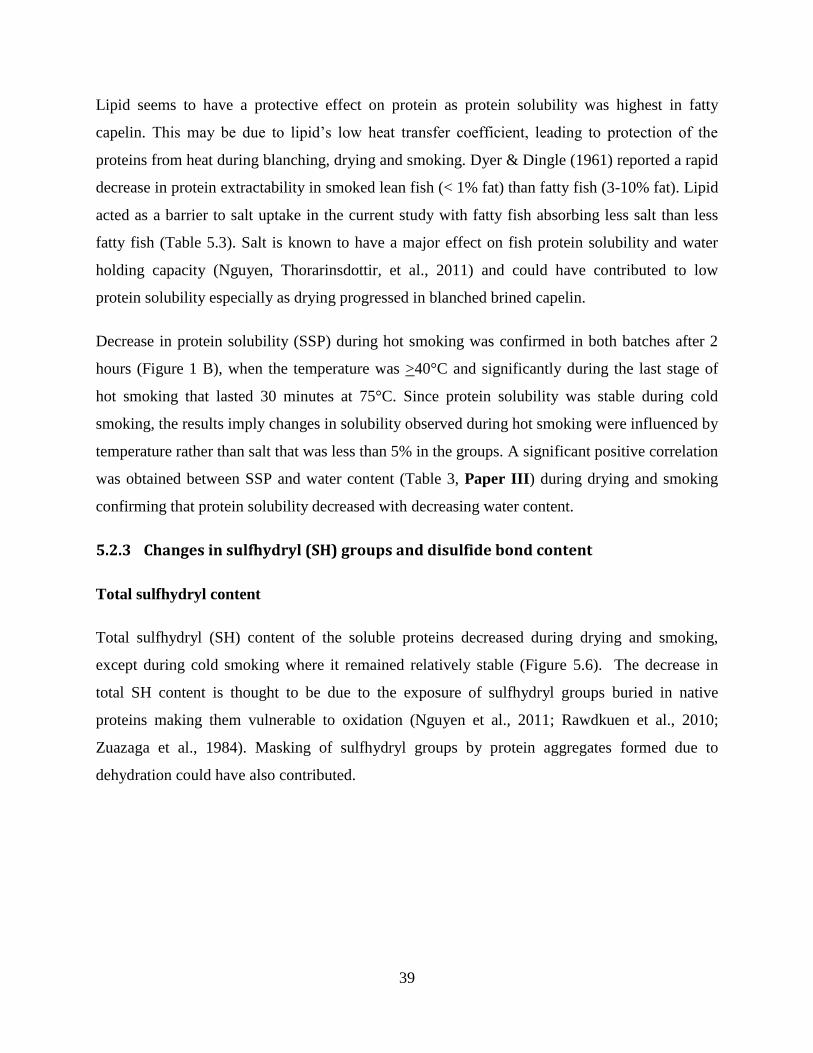
39
Lipid seems to have a protective effect on protein as protein solubility was highest in fatty
capelin. This may be due to lipid’s low heat transfer coefficient, leading to protection of the
proteins from heat during blanching, drying and smoking. Dyer & Dingle (1961) reported a rapid
decrease in protein extractability in smoked lean fish (< 1% fat) than fatty fish (3-10% fat). Lipid
acted as a barrier to salt uptake in the current study with fatty fish absorbing less salt than less
fatty fish (Table 5.3). Salt is known to have a major effect on fish protein solubility and water
holding capacity (Nguyen, Thorarinsdottir, et al., 2011) and could have contributed to low
protein solubility especially as drying progressed in blanched brined capelin.
Decrease in protein solubility (SSP) during hot smoking was confirmed in both batches after 2
hours (Figure 1 B), when the temperature was >40°C and significantly during the last stage of
hot smoking that lasted 30 minutes at 75°C. Since protein solubility was stable during cold
smoking, the results imply changes in solubility observed during hot smoking were influenced by
temperature rather than salt that was less than 5% in the groups. A significant positive correlation
was obtained between SSP and water content (Table 3, Paper III) during drying and smoking
confirming that protein solubility decreased with decreasing water content.
5.2.3 Changes in sulfhydryl (SH) groups and disulfide bond content
Total sulfhydryl content
Total sulfhydryl (SH) content of the soluble proteins decreased during drying and smoking,
except during cold smoking where it remained relatively stable (Figure 5.6). The decrease in
total SH content is thought to be due to the exposure of sulfhydryl groups buried in native
proteins making them vulnerable to oxidation (Nguyen et al., 2011; Rawdkuen et al., 2010;
Zuazaga et al., 1984). Masking of sulfhydryl groups by protein aggregates formed due to
dehydration could have also contributed.
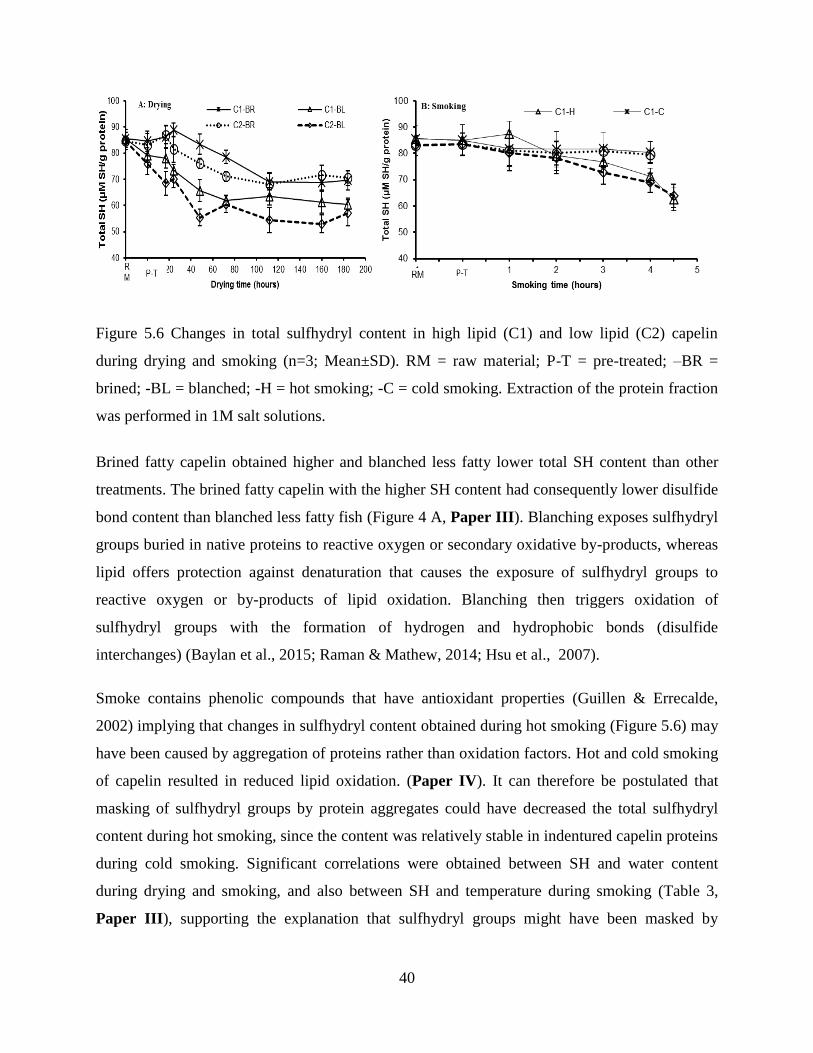
40
Figure 5.6 Changes in total sulfhydryl content in high lipid (C1) and low lipid (C2) capelin
during drying and smoking (n=3; Mean±SD). RM = raw material; P-T = pre-treated; –BR =
brined; -BL = blanched; -H = hot smoking; -C = cold smoking. Extraction of the protein fraction
was performed in 1M salt solutions.
Brined fatty capelin obtained higher and blanched less fatty lower total SH content than other
treatments. The brined fatty capelin with the higher SH content had consequently lower disulfide
bond content than blanched less fatty fish (Figure 4 A, Paper III). Blanching exposes sulfhydryl
groups buried in native proteins to reactive oxygen or secondary oxidative by-products, whereas
lipid offers protection against denaturation that causes the exposure of sulfhydryl groups to
reactive oxygen or by-products of lipid oxidation. Blanching then triggers oxidation of
sulfhydryl groups with the formation of hydrogen and hydrophobic bonds (disulfide
interchanges) (Baylan et al., 2015; Raman & Mathew, 2014; Hsu et al., 2007).
Smoke contains phenolic compounds that have antioxidant properties (Guillen & Errecalde,
2002) implying that changes in sulfhydryl content obtained during hot smoking (Figure 5.6) may
have been caused by aggregation of proteins rather than oxidation factors. Hot and cold smoking
of capelin resulted in reduced lipid oxidation. (Paper IV). It can therefore be postulated that
masking of sulfhydryl groups by protein aggregates could have decreased the total sulfhydryl
content during hot smoking, since the content was relatively stable in indentured capelin proteins
during cold smoking. Significant correlations were obtained between SH and water content
during drying and smoking, and also between SH and temperature during smoking (Table 3,
Paper III), supporting the explanation that sulfhydryl groups might have been masked by
41
protein aggregates. The influence of lipid content was not pronounced during smoking since
groups within the same smoking method were not significantly different.
Available sulfhydryl content
Available SH content increased after blanching, during early drying of brined capelin and during
smoking, but raised most after blanching and towards the end of hot smoking (Figure 3, Paper
III). Proteins were denatured during blanching exposing the sulfhydryl groups that are
unavailable (buried in native proteins) thereby increasing the proportion of available SH in the
total SH content. The increase in available SH content in brined capelin during early drying may
be related to protein hydrolysis caused by enzymatic activity or the groups increased salt content
in the fish muscle resulting in protein swelling (salting-in effect), exposing SH groups (Nguyen
et al., 2011; Baylan et al., 2015). It may also be due to changes in the reactive groups, mainly
loss of hydrophilic surface and exposure of hydrophobic areas (Raman & Mathew, 2014).
Available SH content in blanched brined capelin decreased during early drying, stabilizing
towards end of drying in all groups. The decrease in available SH was related to the masking of
sulfhydryl groups by protein aggregates.
During smoking, available SH increased but significantly during hot smoking when temperature
was higher than 40°C (Figure 3, Paper III). Although high temperature during hot smoking
exposed SH groups buried in native proteins, the reactive SH groups were less oxidized and
underwent minimal disulfide interchanges as revealed in disulfide content changes that were not
significantly different during smoking (Figure 4 B & Table 3, Paper III). This can be explained
by the antioxidant properties of the smoke (Guillen & Errecalde, 2002). Generally available SH
content correlated strongly with disulfide content.
Disulphide bond content
The disulfide bond content was mainly influenced by raw material treatments, with blanched
brined capelin obtaining relatively higher content (Figure 4 A, Paper III). Disulphide content
increased after blanching, whereas brining had no effect. Only a slight increase in disulphide
content was observed during early drying. The disulphide content remained apparently stable
during later stages of drying. The results are in agreement with total SH content in that higher
42
disulphide content was obtained in blanched brined capelin, that had lower total SH content and
vice versa in brined capelin. This is because sulfhydryl groups get oxidized when they are
exposed and subsequently undergo disulfide interchanges (Baylan et al., 2015; Raman &
Mathew, 2014; Hsu et al., 2007), resulting in reduced total SH content and increased disulphide
content.
The results suggest that as proteins aggregate after blanching, disulfide bonds increase and the
total SH content is reduced. Disulfide bond content became stable in the later stages of drying,
corresponding with the stability in SH groups. Although lipids had some effect on the available
SH and disulfide content during drying and smoking of capelin, the effect was not significant
considering changes in disulphide bond content.
43
5.2.4 Summary
SSP and total SH content were reduced while available SH and disulfide content
increased during drying and hot smoking.
Blanching reduced protein solubility and SH content due to high protein aggregation
during drying that might have reduced the eating quality of dried fish mainly due to
change in texture.
Conformational changes occurred in early drying when water content and dehydration
rate were relatively high.
Protein conformation in particular during hot smoking was attributed to protein
denaturation that resulted in reduced yield and possibly loss in nutritional value.
Lipids have a protective effect on capelin proteins as less conformational changes were
observed in fatty fish after blanching and during drying and smoking.
Blanching and drying had greater influence on protein conformational changes than
brining and smoking.

44
5.3 Stability of dried and smoked capelin and sardine
Capelin harvested at three different times and sardine was dried and smoked, and used to
evaluate the effects of lipid content and packaging methods on stability of dried and smoked fish.
Quality changes in hot and cold smoked fish were evaluated during refrigerated storage of fatty
and less fatty capelin batches and sardine, packaged in sealed (air) and vacuum packages (Paper
IV). Changes the three batches of dried capelin (fatty, moderate and less fatty) stored in open,
sealed and vacuum packages at room temperature were evaluated (Paper V).
5.3.1 Influence of lipid content and smoking methods on fish stability
Smoked fish
Lipid content and smoking method had no influence on salt concentration (3.18- 3.87%) (Table 1
A, Paper IV). Salt is important as in addition to the preservative effects, it inhibits growth of
food poisoning organisms, particularly C. botulinum, that is of particular concern in vacuum
packaged fish. Lund & Peck (1991) reported a concentration of 3% to be the minimum level
needed to inhibit the growth of C. botulinum type E. Smoked fish had water activity values of
0.944-0.953 (Table 5.4 A), that are below the critical level of 0.97 for the formation of botulinum
toxin (Lund & Peck 1991). It can also be mentioned that for health reasons salt concentration
should be kept low in food and salt level of 4% was found to be acceptable (Cardinal et al.,
2001). Capelin and sardine in this experiment had salt content of 3.18- 3.87% and met that
criterion.
Lipid content increased in all treatments after smoking compared to raw materials, with highest
increase in hot smoked fish (Figure 1, Paper IV). The increase in lipid was also influenced by
the initial lipid level as the greatest increase was in fatty capelin. No changes in lipid content
occurred during storage. Similar results with nominal variations in total lipid were reported
during storage of dried fish (migaki-nishin) (Shah et al., 2009) and sardine stored in ice (Chaijan,
2009).
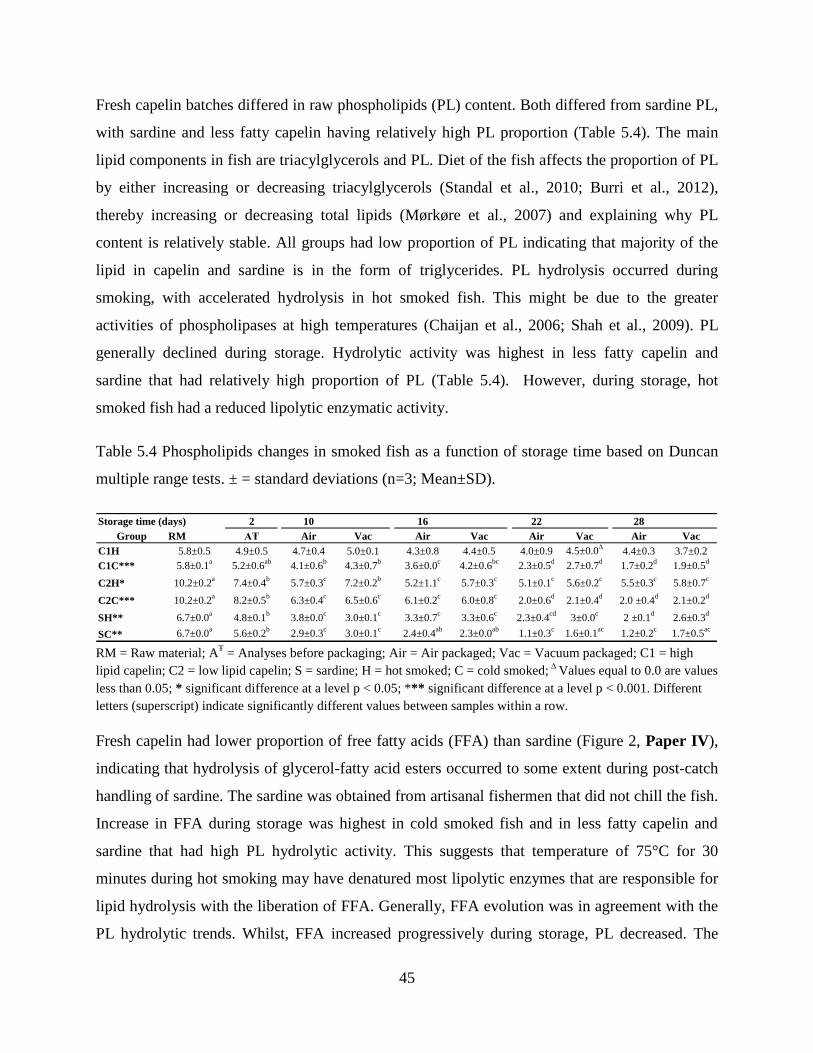
45
Fresh capelin batches differed in raw phospholipids (PL) content. Both differed from sardine PL,
with sardine and less fatty capelin having relatively high PL proportion (Table 5.4). The main
lipid components in fish are triacylglycerols and PL. Diet of the fish affects the proportion of PL
by either increasing or decreasing triacylglycerols (Standal et al., 2010; Burri et al., 2012),
thereby increasing or decreasing total lipids (Mørkøre et al., 2007) and explaining why PL
content is relatively stable. All groups had low proportion of PL indicating that majority of the
lipid in capelin and sardine is in the form of triglycerides. PL hydrolysis occurred during
smoking, with accelerated hydrolysis in hot smoked fish. This might be due to the greater
activities of phospholipases at high temperatures (Chaijan et al., 2006; Shah et al., 2009). PL
generally declined during storage. Hydrolytic activity was highest in less fatty capelin and
sardine that had relatively high proportion of PL (Table 5.4). However, during storage, hot
smoked fish had a reduced lipolytic enzymatic activity.
Table 5.4 Phospholipids changes in smoked fish as a function of storage time based on Duncan
multiple range tests. ± = standard deviations (n=3; Mean±SD).
Storage time (days) 2 10 16 22 28
Group RM AŦ Air Vac Air Vac Air Vac Air Vac
C1H 5.8±0.5 4.9±0.5 4.7±0.4 5.0±0.1 4.3±0.8 4.4±0.5 4.0±0.9 4.5±0.0∆
4.4±0.3 3.7±0.2
C1C*** 5.8±0.1a
5.2±0.6ab
4.1±0.6b
4.3±0.7b
3.6±0.0c
4.2±0.6bc
2.3±0.5d
2.7±0.7d
1.7±0.2d
1.9±0.5d
C2H* 10.2±0.2a
7.4±0.4b
5.7±0.3c
7.2±0.2b
5.2±1.1c
5.7±0.3c
5.1±0.1c
5.6±0.2c
5.5±0.3c
5.8±0.7c
C2C*** 10.2±0.2a
8.2±0.5b
6.3±0.4c
6.5±0.6c
6.1±0.2c
6.0±0.8c
2.0±0.6d
2.1±0.4d
2.0 ±0.4d
2.1±0.2d
SH** 6.7±0.0a
4.8±0.1b
3.8±0.0c
3.0±0.1c
3.3±0.7c
3.3±0.6c
2.3±0.4cd
3±0.0c
2 ±0.1d
2.6±0.3d
SC** 6.7±0.0a
5.6±0.2b
2.9±0.3c
3.0±0.1c
2.4±0.4ab
2.3±0.0ab
1.1±0.3c
1.6±0.1ac
1.2±0.2c
1.7±0.5ac
RM = Raw material; A
Ŧ = Analyses before packaging; Air = Air packaged; Vac = Vacuum packaged; C1 = high
lipid capelin; C2 = low lipid capelin; S = sardine; H = hot smoked; C = cold smoked; ∆
Values equal to 0.0 are values
less than 0.05; * significant difference at a level p < 0.05; *** significant difference at a level p < 0.001. Different
letters (superscript) indicate significantly different values between samples within a row.
Fresh capelin had lower proportion of free fatty acids (FFA) than sardine (Figure 2, Paper IV),
indicating that hydrolysis of glycerol-fatty acid esters occurred to some extent during post-catch
handling of sardine. The sardine was obtained from artisanal fishermen that did not chill the fish.
Increase in FFA during storage was highest in cold smoked fish and in less fatty capelin and
sardine that had high PL hydrolytic activity. This suggests that temperature of 75°C for 30
minutes during hot smoking may have denatured most lipolytic enzymes that are responsible for
lipid hydrolysis with the liberation of FFA. Generally, FFA evolution was in agreement with the
PL hydrolytic trends. Whilst, FFA increased progressively during storage, PL decreased. The
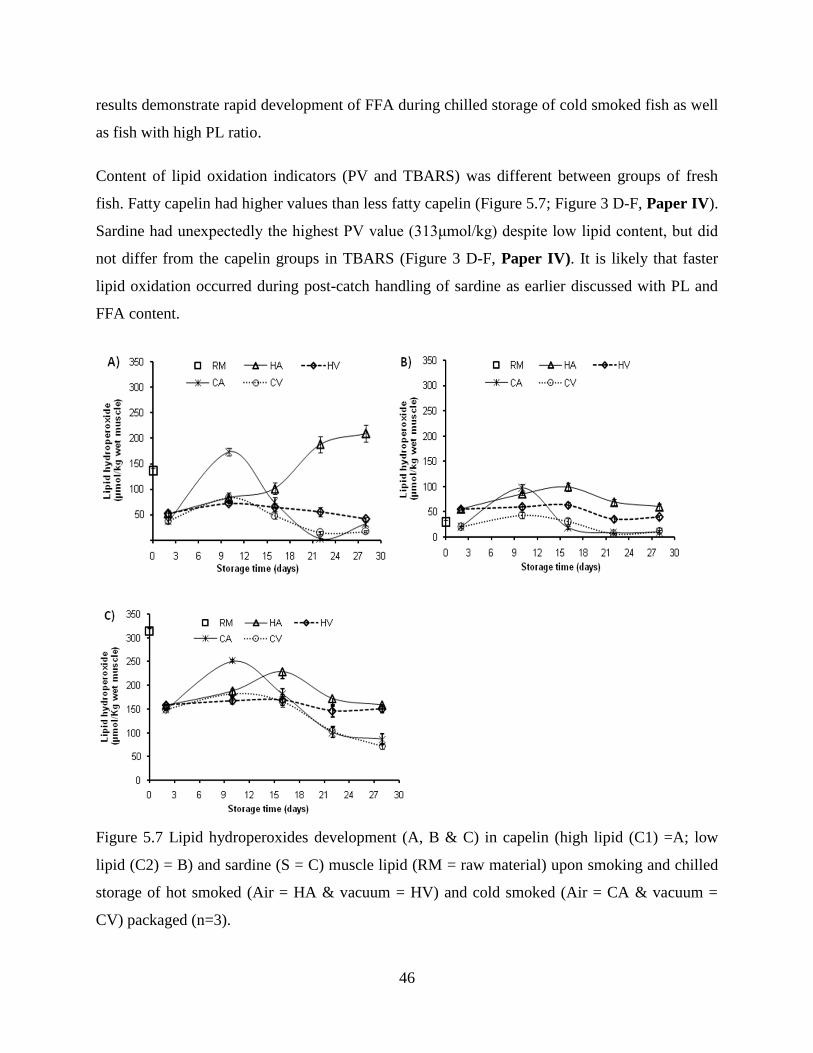
46
results demonstrate rapid development of FFA during chilled storage of cold smoked fish as well
as fish with high PL ratio.
Content of lipid oxidation indicators (PV and TBARS) was different between groups of fresh
fish. Fatty capelin had higher values than less fatty capelin (Figure 5.7; Figure 3 D-F, Paper IV).
Sardine had unexpectedly the highest PV value (313μmol/kg) despite low lipid content, but did
not differ from the capelin groups in TBARS (Figure 3 D-F, Paper IV). It is likely that faster
lipid oxidation occurred during post-catch handling of sardine as earlier discussed with PL and
FFA content.
Figure 5.7 Lipid hydroperoxides development (A, B & C) in capelin (high lipid (C1) =A; low
lipid (C2) = B) and sardine (S = C) muscle lipid (RM = raw material) upon smoking and chilled
storage of hot smoked (Air = HA & vacuum = HV) and cold smoked (Air = CA & vacuum =
CV) packaged (n=3).
47
PV and TBARS decreased in all groups unlike PL and FFA except for PV in less fatty capelin
(C2) that had the least PV in raw fish. Although smoking entails high temperature generally
known to accelerate lipid oxidation (Marc et al., 1997), results show the influence of temperature
on lipid oxidation during smoking may have been surpassed by the effects of smoke antioxidant
properties (Guillen & Errecalde, 2002). But temperature differences and water content during hot
and cold smoking, contributed to the differences in PV and TBARS obtained in the groups. Hot
smoked fish was more dehydrated and thus saturated with lipid than cold smoked fish.
Cold smoked sardine and fatty fish were more vulnerable to lipid oxidation during storage shown
by the fast accumulation and decomposition of hydroperoxides and TBARS. The vulnerability to
lipid oxidation during chilled storage of cold smoked fish was in harmony with the changes in
phospholipids and FFA. There was an elevation of PV and TBARS during early storage of
sardine, probably due to the high content in fresh fish (Chaijan et al., 2006). Generally less fatty
capelin that had high phospholipid content accumulated less PV and TBARS throughout the
storage time.
The aerobic plate count in raw fish was log 2 - 2.7 CFU/g and 4 CFU/g for capelin groups and
sardine respectively (Figure 5.8). Decline in total plate counts was observed after smoking in all
groups and under limit of detection in hot smoked fish (log 1 CFU/g). This occurrence could be
attributed to the effects of dehydration and antimicrobial properties of the smoke constituents
(Rorvik, 2000) besides the high temperature during hot smoking. Microbial counts increased in
all groups during storage. Lipid content had no influence on microbial development of smoked
fish.
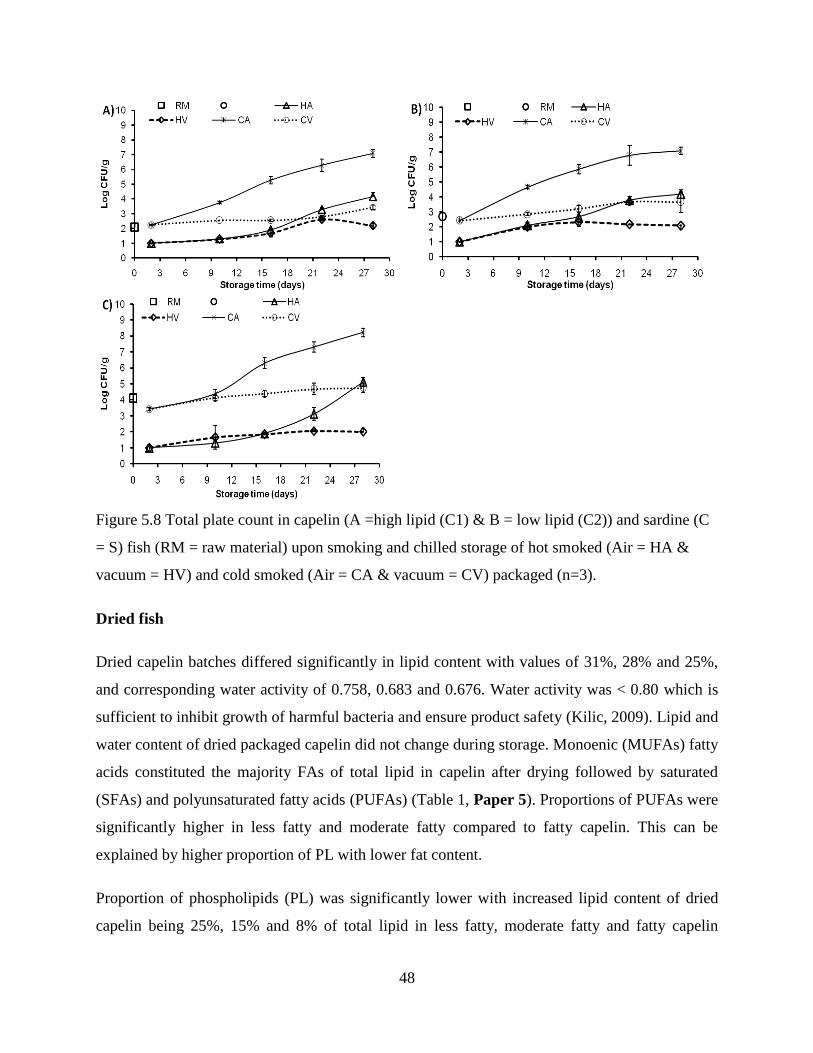
48
Figure 5.8 Total plate count in capelin (A =high lipid (C1) & B = low lipid (C2)) and sardine (C
= S) fish (RM = raw material) upon smoking and chilled storage of hot smoked (Air = HA &
vacuum = HV) and cold smoked (Air = CA & vacuum = CV) packaged (n=3).
Dried fish
Dried capelin batches differed significantly in lipid content with values of 31%, 28% and 25%,
and corresponding water activity of 0.758, 0.683 and 0.676. Water activity was < 0.80 which is
sufficient to inhibit growth of harmful bacteria and ensure product safety (Kilic, 2009). Lipid and
water content of dried packaged capelin did not change during storage. Monoenic (MUFAs) fatty
acids constituted the majority FAs of total lipid in capelin after drying followed by saturated
(SFAs) and polyunsaturated fatty acids (PUFAs) (Table 1, Paper 5). Proportions of PUFAs were
significantly higher in less fatty and moderate fatty compared to fatty capelin. This can be
explained by higher proportion of PL with lower fat content.
Proportion of phospholipids (PL) was significantly lower with increased lipid content of dried
capelin being 25%, 15% and 8% of total lipid in less fatty, moderate fatty and fatty capelin
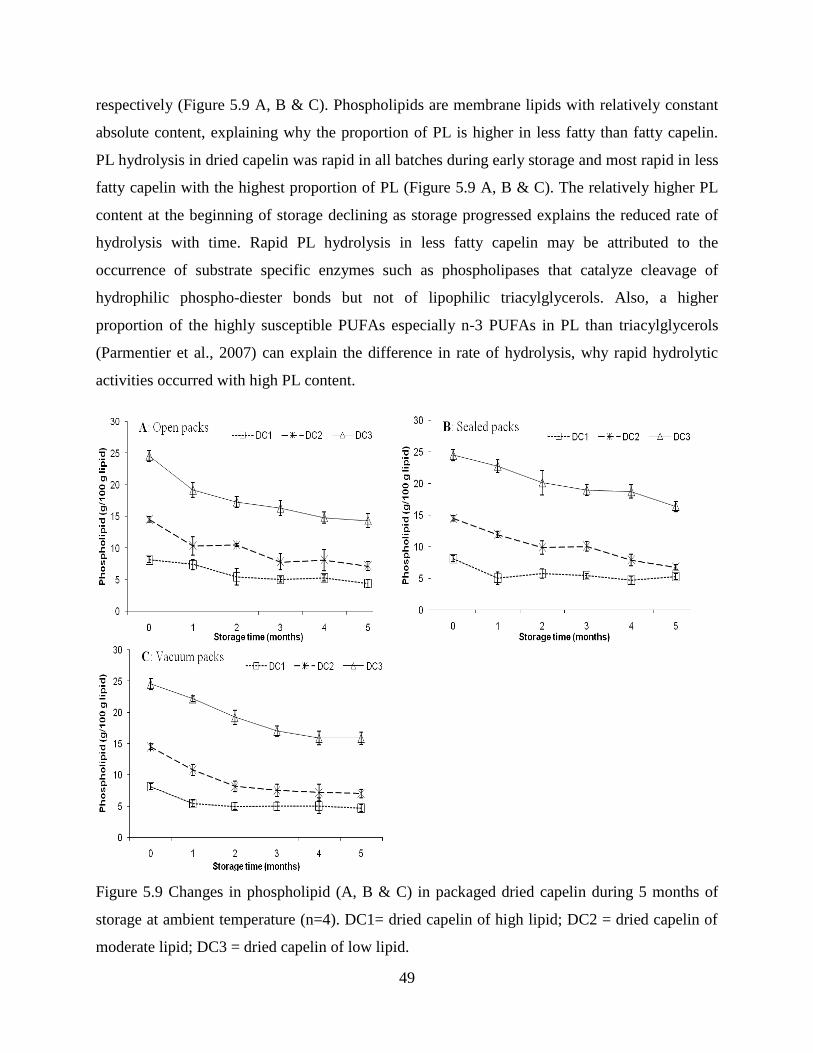
49
respectively (Figure 5.9 A, B & C). Phospholipids are membrane lipids with relatively constant
absolute content, explaining why the proportion of PL is higher in less fatty than fatty capelin.
PL hydrolysis in dried capelin was rapid in all batches during early storage and most rapid in less
fatty capelin with the highest proportion of PL (Figure 5.9 A, B & C). The relatively higher PL
content at the beginning of storage declining as storage progressed explains the reduced rate of
hydrolysis with time. Rapid PL hydrolysis in less fatty capelin may be attributed to the
occurrence of substrate specific enzymes such as phospholipases that catalyze cleavage of
hydrophilic phospho-diester bonds but not of lipophilic triacylglycerols. Also, a higher
proportion of the highly susceptible PUFAs especially n-3 PUFAs in PL than triacylglycerols
(Parmentier et al., 2007) can explain the difference in rate of hydrolysis, why rapid hydrolytic
activities occurred with high PL content.
Figure 5.9 Changes in phospholipid (A, B & C) in packaged dried capelin during 5 months of
storage at ambient temperature (n=4). DC1= dried capelin of high lipid; DC2 = dried capelin of
moderate lipid; DC3 = dried capelin of low lipid.
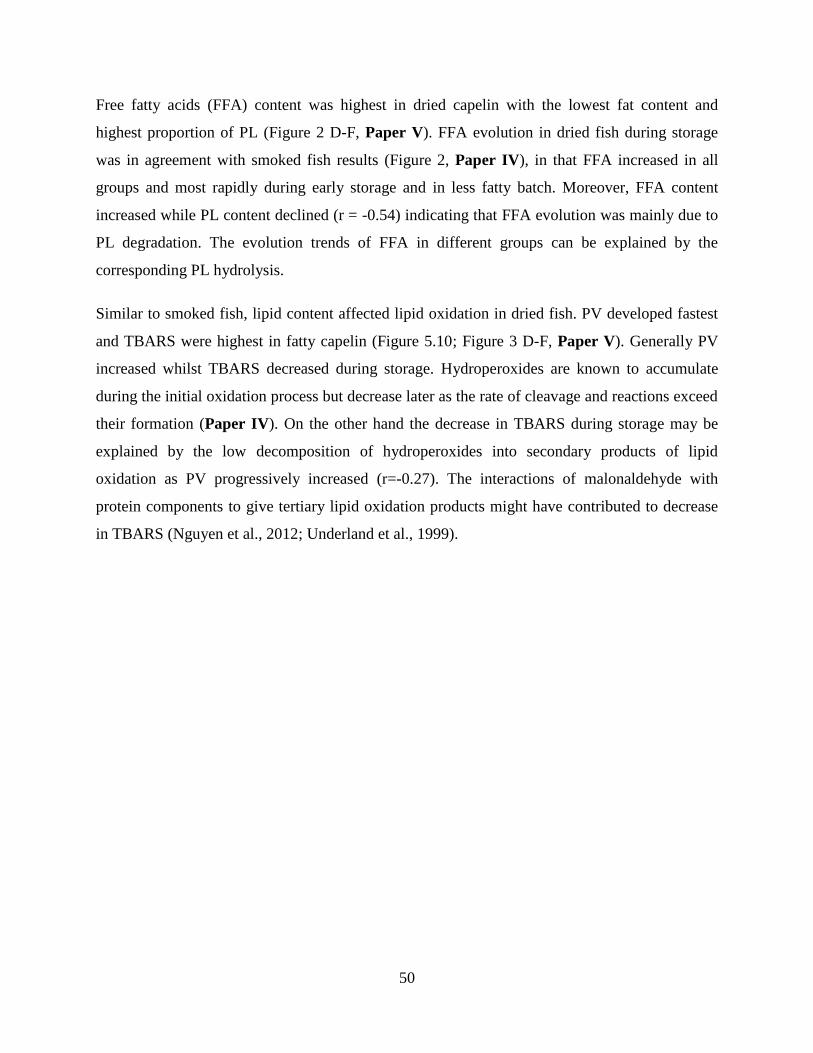
50
Free fatty acids (FFA) content was highest in dried capelin with the lowest fat content and
highest proportion of PL (Figure 2 D-F, Paper V). FFA evolution in dried fish during storage
was in agreement with smoked fish results (Figure 2, Paper IV), in that FFA increased in all
groups and most rapidly during early storage and in less fatty batch. Moreover, FFA content
increased while PL content declined (r = -0.54) indicating that FFA evolution was mainly due to
PL degradation. The evolution trends of FFA in different groups can be explained by the
corresponding PL hydrolysis.
Similar to smoked fish, lipid content affected lipid oxidation in dried fish. PV developed fastest
and TBARS were highest in fatty capelin (Figure 5.10; Figure 3 D-F, Paper V). Generally PV
increased whilst TBARS decreased during storage. Hydroperoxides are known to accumulate
during the initial oxidation process but decrease later as the rate of cleavage and reactions exceed
their formation (Paper IV). On the other hand the decrease in TBARS during storage may be
explained by the low decomposition of hydroperoxides into secondary products of lipid
oxidation as PV progressively increased (r=-0.27). The interactions of malonaldehyde with
protein components to give tertiary lipid oxidation products might have contributed to decrease
in TBARS (Nguyen et al., 2012; Underland et al., 1999).
51
Figure 5.10 Lipid hydroperoxides development (A, B & C) in packaged dried capelin during 5 of
months storage at ambient temperature (n=4). DC1= dried capelin of high lipid; DC2 = dried
capelin of moderate lipid; DC3 = dried capelin of low lipid.
Slow microbial growth was observed during storage of dried capelin with TPC increments of less
than log 1 colony-forming unit by the end of five months storage. At the beginning of storage,
total plate count (TPC) was log 5.48, 5.24 and 5.38 CFU/g in fatty, moderate fatty and less fatty
capelin respectively. Slow microbial growth during storage may be explained by the low water
content (< 25 %) and water activity (< 0.80) in dried capelin (Kilic, 2009). Lipid content like in
smoked fish study had no effect on TPC development. Yeast and molds were generally not
detected in the dried capelin except after extended storage in open packages in fatty and
moderate fatty fish.
52
5.3.2 Influence of packaging methods on fish stability
Smoked fish
Packaging method had as expected no influence on phospholipids (PL) and FFA during storage
(Table 5.4 and Figure 2, Paper IV). PL hydrolysis occurs mainly due to enzymatic activities
(Chaijan et al., 2006) that are not influenced by access to oxygen. The increase in FFA is mainly
derived from PL hydrolysis.
Packaging methods had significant effects on lipid oxidation during storage of smoked fish
(Figure 5.7; Figure 3 D-F, Paper IV). Lipid oxidation was more intense in open packaged than
vacuum packaged capelin. Vacuum packaging limits access to molecular oxygen thereby
preventing lipid oxidation. Packaging methods and lipid content influenced FA composition
during storage (Table 2, Paper IV). Fish lipids are easily oxidized because of high proportion of
PUFAs (Stołyhwo et al., 2006). PUFAs declined during storage. More rapid decline was
observed in air packed than vacuum packed fish. This related well with the formation and
decomposition of lipid oxidation indicators suggesting the losses might be due to oxidation.
Vacuum packaging can ensure smoked products stability from lipid oxidation, but not enzymatic
related lipid hydrolysis.
A lag phase in bacterial growth was observed in all packaged smoked fish groups during early
storage (Figure 5.8), probably due to cold shock on the microbes and also the occurrence of
antimicrobial smoke constituents. During late storage high microbial growth was evident in air
packages, attributed to the diminishing intensity of antimicrobial smoke constituents, presence of
oxygen and re-establishment or succession by cold loving bacteria. Total counts reached log 7
CFU/g & log 4 CFU/g in cold and hot smoked air packaged capelin groups and log 8 CFU/g &
log 5 CFU/g in cold and hot smoked sardine respectively at the end of storage. Aerobic counts of
log 5 CFU/g has been used in smoked fish as limit for consumption (Leroi et al., 2000; Hansen et
al., 1995). This indicates air packaged cold smoked fish in all batches had surpassed the limit for
consumption on day 28 during chilled storage. On the other hand aerobic counts in air packaged
hot smoked capelin groups did not reach log 5 CFU/g consumption limit on day 28, while hot
smoked sardine had reached the limit on day 28.
53
Vacuum packaged groups showed delayed growth (p<0.05) obtaining lower aerobic counts
throughout the storage not reaching log 5 CFU/g consumption limit. This could be due to low O2
level, retention of smoke with antimicrobial properties and to a lesser extent the low storage
temperature used in the study that may have inhibited aerobic micro-flora development.
Dried fish
Phospholipid hydrolysis occurred during storage of packaged dried capelin, but was not
influenced by packaging methods (open, sealed and vacuum) (Figure 5.9 A, B & C). Supporting
the earlier explanation that PL hydrolytic processes were largely driven by enzymatic activities.
Similarly FFA evolutions obtained in dried capelin was not influenced by packaging methods
(Figure 2 D-F, Paper V). Generally, the results are in agreement with those of smoked fish that
lipid hydrolysis was mainly influenced by PL content.
Packaging methods affected the lipid oxidation, with accelerated oxidation occurring in dried
fish with access to oxygen (Figure 5.10; Figure 3 D-F, Paper V). Peroxide value increased
during storage in open and sealed bags except towards the end of storage when it decreased in
the fatty and moderate fatty capelin in open bags (5.10 A, B). Vacuum packaged dried capelin
was stable during storage (Figure 5.10 C).
Degradation of TBARS in dried capelin was higher when fish is packaged in open and sealed
bags than vacuum bags, but with an increase in open bags towards the end of storage (Figure 3
D-F, Paper V). Increase in TBARS in dried fish packaged in open bags towards the end of
storage may be attributed to faster decomposition of existing hydroperoxides into TBARS since
the corresponding PV were decreasing. Packaging methods had therefore some impact on
TBARS decomposition with capelin being more stable when vacuum packaged than in open and
sealed bags. The results agree with PV data in explaining the importance of limiting access to
oxygen to minimize lipid oxidation.
Packaging method influenced microbial development in dried capelin as the lowest total plate
counts (TPC) were found in vacuum packaged capelin, a fact attributed to the air elimination
retarding growth of aerobic microorganisms. As earlier observed yeasts and molds were
generally not detected in dried capelin, except in fatty and moderate fatty capelin after extended
54
storage in open bags. This may in addition to the low water content be explained by the drying
conditions and packaging methods used. Indoor drying, sealing and vacuum packaging
minimized contamination by microbes mainly air borne yeasts and molds (Park et al., 2014). The
results indicate that vacuum packed dried capelin was microbiologically stable during storage.
Lipid content and packaging methods affected rancidity (Table 2 A & B, Paper V). A stronger
rancid odor was detected in fatty as well as open packaged samples. These results are in
agreement with primary lipid oxidation indicator showing a positive correlation (r = 0.67 with
PV). Rancid odor was below 20 on the scale of 0-100, a limit that has been used to indicate that
samples are becoming rancid (Magnússon et al., 2006). The stock-fish odor was slightly reduced
as storage time progressed, with more reduction in fatty and open packaged capelin (Table 2 B,
Paper V). The changes were however, not significantly different (p ˃ 0.05) between groups
(lipid levels, packaging methods) during storage. This can be explained by slow accumulation of
TBARS with time but they have a profound impact on food sensory properties (Stapelfeldt et al.,
1997). Stock-fish odor was inversely correlated to PV and TBARS (r = -0.22 and -0.21
respectively).
To gain an overview of the similarities and differences between sample groups over storage time
principal component analysis (PCA) was carried out (Figure 5.11). Microbial and fatty acid
composition data analyzed at the beginning, middle and the end of storage were not included in
the model. The samples varied mainly in phospholipid, total lipid, water content and rancidity
along the first principal component (PC-1), explaining 49% of the variations in the samples. Less
fatty (DC3) samples were located to the left of the scores plot along PC-1 described by
phospholipid and stock-fish odor variables whereas fatty (DC1) samples were located on the
right side described mainly by the total lipid, water content and rancid odor. The variables
describing less fatty were negatively correlated to those that described fatty capelin. Capelin that
had moderate lipid content were centrally located implying they were marginally described by
the variables that described both less fatty and fatty capelin.
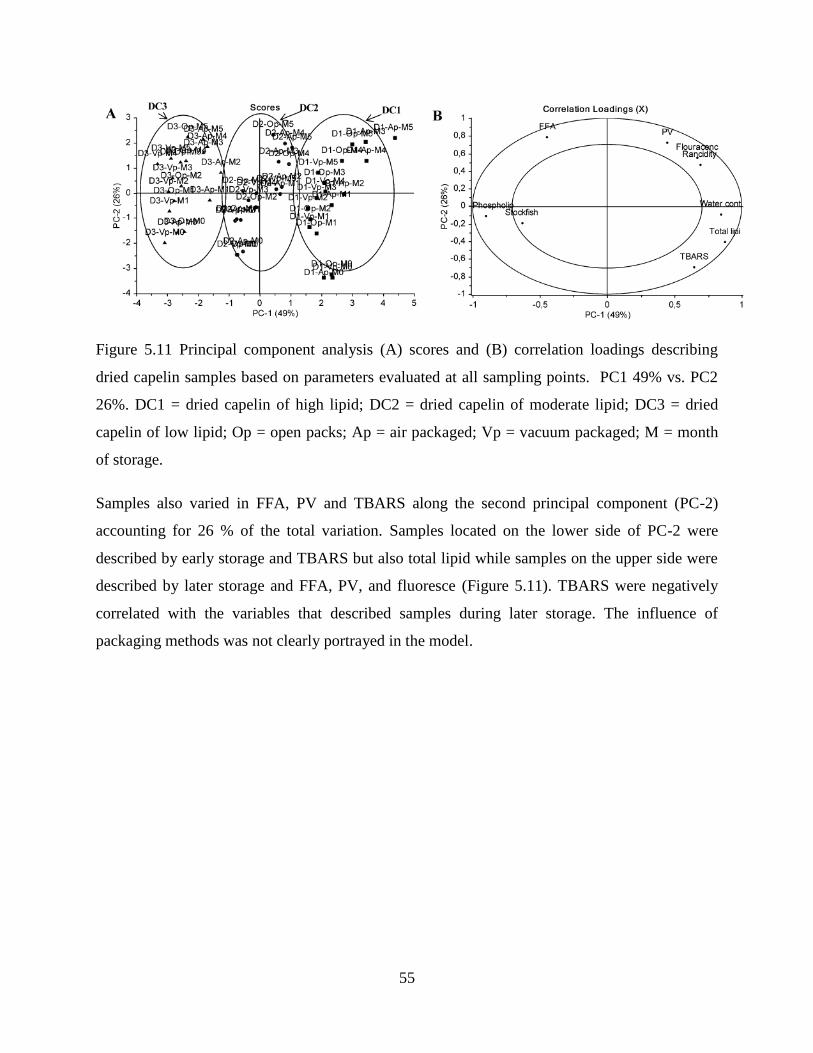
55
Figure 5.11 Principal component analysis (A) scores and (B) correlation loadings describing
dried capelin samples based on parameters evaluated at all sampling points. PC1 49% vs. PC2
26%. DC1 = dried capelin of high lipid; DC2 = dried capelin of moderate lipid; DC3 = dried
capelin of low lipid; Op = open packs; Ap = air packaged; Vp = vacuum packaged; M = month
of storage.
Samples also varied in FFA, PV and TBARS along the second principal component (PC-2)
accounting for 26 % of the total variation. Samples located on the lower side of PC-2 were
described by early storage and TBARS but also total lipid while samples on the upper side were
described by later storage and FFA, PV, and fluoresce (Figure 5.11). TBARS were negatively
correlated with the variables that described samples during later storage. The influence of
packaging methods was not clearly portrayed in the model.
56
5.3.3 Summary
Lipid degradation was greater during hot smoking than cold smoking of fish (capelin and
sardine), but hot smoked fish was more stable during chilled storage.
Capelin and sardine are valuable sources of essential PUFAs, but lipids in smoked
sardine are less stable during chilled storage than lipids in smoked capelin (all batches).
The spoilage of lipids in dried and smoked fish was both due to oxidation (PUFAs and
oxygen) and hydrolysis (enzyme activity).
Lipid hydrolysis was fastest in the lowest lipid capelin, while lipid oxidation was
relatively higher in fatty capelin.
All capelin batches were of medium lipid content (7.5- 10 %) and a stable safe dried
product at room temperature with water activity of less than 0.70 could be produced from
the raw materials.
Dried and smoked fatty capelin was more stable during storage if oxygen in the
atmosphere was excluded by vacuum packaging.
57
5.4 Marketing potential of dried capelin and sardine
Improved dried sardine (water content 24%, fat 9%) and indoor dried capelin (water content
19.5%, fat 27%) packaged in sealed polyethylene bags weighing 500 g each were used in a
marketing study carried out among shoppers in open-air markets and supermarkets in Kenya.
5.4.1 Dried fish consumption patterns
Majority of the respondents shopping in open-air markets (72%) had only elementary education,
followed by high school level (28%) with none of the respondents having obtained a university
degree (Table 1, Paper VI). Majority of respondents shopping in supermarkets had completed
high school (63%), followed by those with a university degree (30%) and elementary education
(7%).
Respondents shopping in open-air markets consumed dried fish more frequently (33%, more
than or equal to four times a week) than those shopping in supermarkets (5%, four times a week
or more often) (Table 5.5). This indicates that shoppers in open-air market consume dried fish on
a regular basis. Consumption of dried fish was negatively influenced by education, with high
consumption frequency among less educated consumers (Table 5.5). Educated consumers are
generally more aware of the health and other benefits associated with fish consumption. In a
study on preferences for fish and seafood using an ‘evoked set’ analysis education was found to
positively influence consumers preference for fish (Kinnucan et al,. 1993). Health benefits are
however questionable when it comes to products of low quality that are contaminated. Kenyan
consumers consider dried small fish an inferior/low quality product sold mainly in rural areas
(Peter Oduor-Odote et al., 2010), where a majority of the population are poor with limited
education. A majority of respondents shopping in the supermarkets are most likely middle class
as they were mainly working for private companies or government and had relatively small
households (Table 1, Paper IV). Therefore, they are able to purchase more expensive protein
sources than dried fish whose quality is uncertain and not often available in the supermarkets.
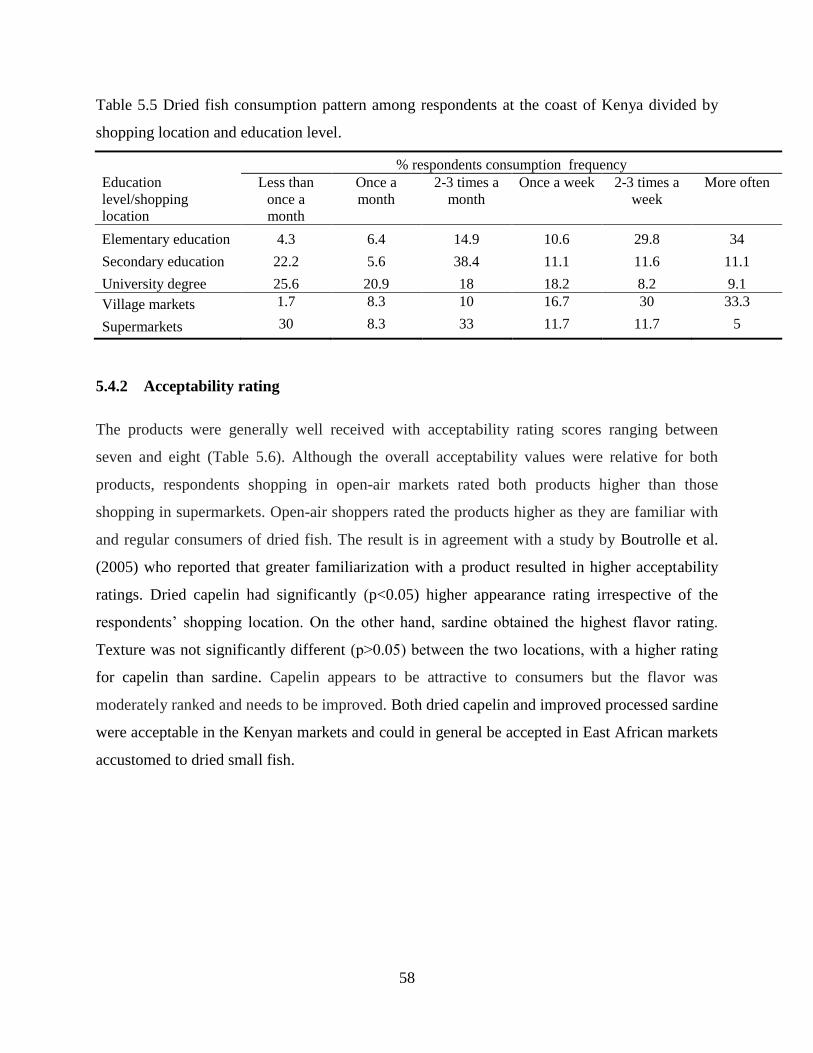
58
Table 5.5 Dried fish consumption pattern among respondents at the coast of Kenya divided by
shopping location and education level.
% respondents consumption frequency
Education
level/shopping
location
Less than
once a
month
Once a
month
2-3 times a
month
Once a week 2-3 times a
week
More often
Elementary education 4.3 6.4 14.9 10.6 29.8 34
Secondary education 22.2 5.6 38.4 11.1 11.6 11.1
University degree 25.6 20.9 18 18.2 8.2 9.1
Village markets 1.7 8.3 10 16.7 30 33.3
Supermarkets 30 8.3 33 11.7 11.7 5
5.4.2 Acceptability rating
The products were generally well received with acceptability rating scores ranging between
seven and eight (Table 5.6). Although the overall acceptability values were relative for both
products, respondents shopping in open-air markets rated both products higher than those
shopping in supermarkets. Open-air shoppers rated the products higher as they are familiar with
and regular consumers of dried fish. The result is in agreement with a study by Boutrolle et al.
(2005) who reported that greater familiarization with a product resulted in higher acceptability
ratings. Dried capelin had significantly (p<0.05) higher appearance rating irrespective of the
respondents’ shopping location. On the other hand, sardine obtained the highest flavor rating.
Texture was not significantly different (p˃0.05) between the two locations, with a higher rating
for capelin than sardine. Capelin appears to be attractive to consumers but the flavor was
moderately ranked and needs to be improved. Both dried capelin and improved processed sardine
were acceptable in the Kenyan markets and could in general be accepted in East African markets
accustomed to dried small fish.
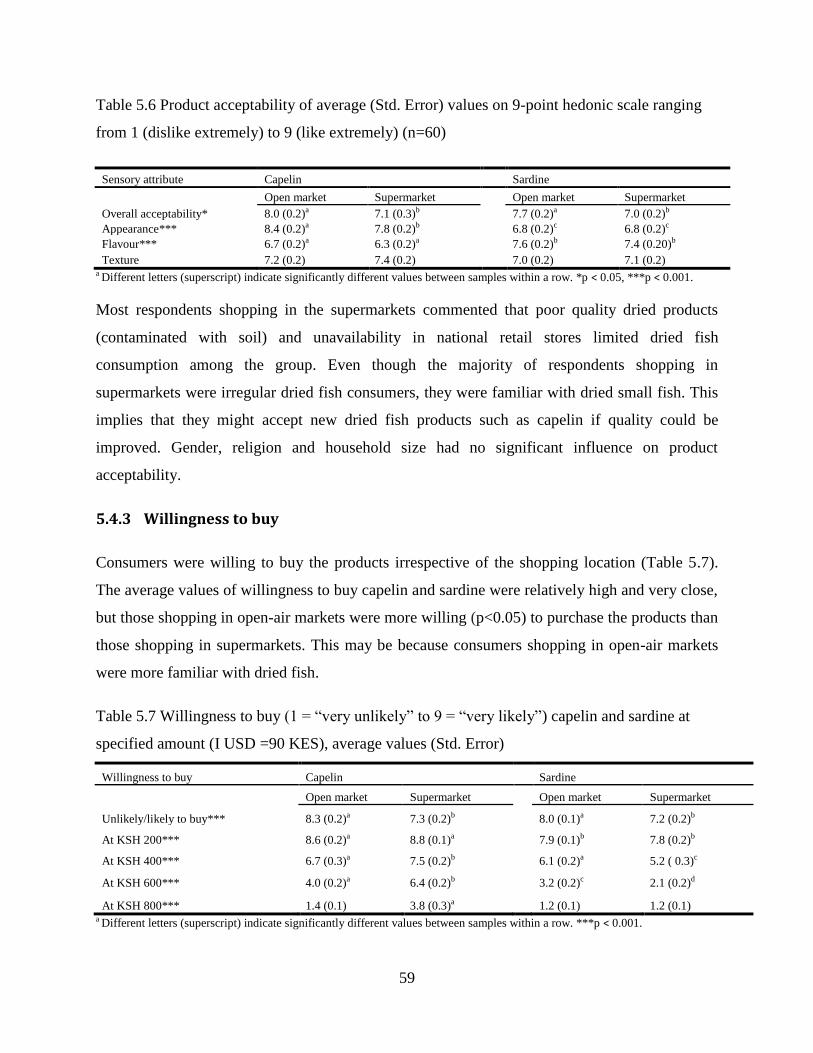
59
Table 5.6 Product acceptability of average (Std. Error) values on 9-point hedonic scale ranging
from 1 (dislike extremely) to 9 (like extremely) (n=60)
Sensory attribute Capelin Sardine
Open market Supermarket
Open market Supermarket
Overall acceptability* 8.0 (0.2)a 7.1 (0.3)b
7.7 (0.2)a 7.0 (0.2)b
Appearance*** 8.4 (0.2)a 7.8 (0.2)b
6.8 (0.2)c 6.8 (0.2)c
Flavour*** 6.7 (0.2)a 6.3 (0.2)a
7.6 (0.2)b 7.4 (0.20)b
Texture 7.2 (0.2) 7.4 (0.2) 7.0 (0.2) 7.1 (0.2) a Different letters (superscript) indicate significantly different values between samples within a row. *p < 0.05, ***p < 0.001.
Most respondents shopping in the supermarkets commented that poor quality dried products
(contaminated with soil) and unavailability in national retail stores limited dried fish
consumption among the group. Even though the majority of respondents shopping in
supermarkets were irregular dried fish consumers, they were familiar with dried small fish. This
implies that they might accept new dried fish products such as capelin if quality could be
improved. Gender, religion and household size had no significant influence on product
acceptability.
5.4.3 Willingness to buy
Consumers were willing to buy the products irrespective of the shopping location (Table 5.7).
The average values of willingness to buy capelin and sardine were relatively high and very close,
but those shopping in open-air markets were more willing (p<0.05) to purchase the products than
those shopping in supermarkets. This may be because consumers shopping in open-air markets
were more familiar with dried fish.
Table 5.7 Willingness to buy (1 = “very unlikely” to 9 = “very likely”) capelin and sardine at
specified amount (I USD =90 KES), average values (Std. Error)
Willingness to buy Capelin Sardine
Open market Supermarket
Open market Supermarket
Unlikely/likely to buy*** 8.3 (0.2)a 7.3 (0.2)b
8.0 (0.1)a 7.2 (0.2)b
At KSH 200*** 8.6 (0.2)a 8.8 (0.1)a
7.9 (0.1)b 7.8 (0.2)b
At KSH 400*** 6.7 (0.3)a 7.5 (0.2)b
6.1 (0.2)a 5.2 ( 0.3)c
At KSH 600*** 4.0 (0.2)a 6.4 (0.2)b
3.2 (0.2)c 2.1 (0.2)d
At KSH 800*** 1.4 (0.1) 3.8 (0.3)a 1.2 (0.1) 1.2 (0.1) a Different letters (superscript) indicate significantly different values between samples within a row. ***p < 0.001.
60
On the specific amount of money the respondents were willing to pay for 500 g of the product,
open-air markets and supermarkets shoppers had high ratings for both products at KSH 200, but
significantly higher rating was obtained for capelin than sardine (Table 5.7). Consumers were not
willing to pay more than the reference price of KSH 400 for improved dried sardine, but
supermarket shoppers were willing to pay up to KSH 600 for dried capelin (Table 5.7). The
unwillingness of consumers to pay more than the reference price for sardine could be that they
were not able to see the difference of improved dried sardine from traditionally dried. Sosa and
others (2008) reported food product choice and acceptability to be based on sensory properties.
Sardine was dried in enclosed drier that depended on weather conditions and may have only
reduced contaminations from the environment (such as soil) but not lipid oxidation that affects
color development during drying resulting in unattractive products. Also the reference price used
in the study was based on the supermarket price of similar product that are believed to be
improved and more expensive than traditionally dried sardine sold at about KSH 300 in open-air
markets.
61
5.4.4 Summary
Education level influenced consumption of dried fish, with more regular consumption
among low income classes who had limited education.
Dried capelin and improved dried sardine received relatively high acceptability ratings.
The products differed in definite attributes with capelin obtaining high ratings for
appearance and texture, while sardine obtained the highest flavor ratings.
Middle income consumers were willing to pay up to KSH 600 for 500 g of capelin, while
consumers class was both not willing to pay more than KSH 400 for improved dried
sardine.
There is market potential for dried capelin and improved processed sardine in the Kenyan
markets accustomed to small dried fish.
Overall quality, flavor and appearance need to be stressed in market promotion to
enhance consumption and attract new consumers especially among the middle income
class.
62
6 Conclusions and future prospects
The overall aim of the work was to find ways to improve the quality and safety of dried sardine,
and determine acceptability of new products such as dried capelin in markets accustomed to
dried small fish.
Dried sardine and capelin with water activity low enough to inhibit harmful microorganisms
(<0.7), assure stability during distribution and storage can be produced with blanching and
indoor drying. The quality products produced under controlled indoor conditions demonstrate the
need for developing practical controlled drier for commercial drying of small fish in Kenya and
elsewhere. Fresh water dagaa from Lake Victoria marketed mainly in dried form is an important
fishery in east African region with annual landing of more than 500,000 tons in recent years that
could supply raw materials for making valuable dried fish products.
Blanching in brine as it is done in traditional drying for ensuring safety affects quality adversely
mostly through lipid hydrolysis and oxidation. But it cannot be excluded from the process as the
infrastructure for cold chain from fishermen to consumers is lacking with unavailability of ice
and potable water. Brining fish for up to two hours at room temperature and in none-potable
water to attain appropriate salt concentration is not realistic compared to blanching in brine for 2-
3 minutes. Changes in processing might greatly compromise safety but more research is needed
to optimize blanching.
Male capelin currently mainly reduced to fish meal and oil can if harvested when fat content is
appropriate be used as a raw material for producing dried products. High fat content slows down
drying and increases drying time, but at the same time it offers some protection against
conformational changes in fish proteins during blanching, drying and smoking. Blanching may
not be suitable for commercial capelin drying due to conformational changes and the drying
should be conducted at low temperature to maintain protein quality and sensory properties. The
effects on tropical fish protein might be different and further studies on the effect of blanching in
brine before drying of tropical fish and product acceptance is recommended.
Hydrolysis was fastest in less fatty (7- 7.5% lipid content) capelin but oxidation was fastest in
fatty (9- 10% lipid content) capelin. When oxygen in the atmosphere was excluded by vacuum
63
packaging dried and smoked fatty capelin became stable during storage with less lipid
degradation (lipid hydrolysis and oxidation), odor and amount of microbes. A stable dried
nutritious product of improved quality can be produced from unblanched fish dried under
controlled conditions. Dried fish was more stable while retaining the essential PUFAs during
ambient storage when vacuum packaged. All capelin batches used in the study (7- 10% lipid
content) could produce a stable safe dried product if vacuum packaged.
Dried and smoked capelin and sardine are rich in essential PUFAs. Cold smoking may be
superior to hot smoking when producing capelin for chilled distribution and storage. Hot
smoking resulted in greater lipid degradation and dehydration during processing influencing both
nutritional value and processing yield. Stability during storage was however greater in hot
smoked than cold smoked fish. Lipids in smoked capelin were more stable than in smoked
sardine.
The consumers seem to be willing to buy improved dried sardine and indoor dried capelin as
both products were well received. Products differed in definite attributes that resulted in high
acceptability rating for capelin especially among the consumers shopping in supermarkets.
Middle income classes were willing to pay up to KSH 600 for 500 g of dried capelin and sardine
at up to KSH 400, while low income classes who consume dried fish on regular basis were
willing to buy 500 g of both products at up to KSH 400 which was used as the reference price.
The unwillingness of consumers to pay more than the reference price for sardine could be that
they were not able to see the difference of improved and traditionally dried sardine. Also the
reference price used in the study was based on the supermarket price of similar product that are
believed to be improved and more expensive than traditionally dried sardine sold at about KSH
300 in open-air markets. This indicates that consumers, especially among the middle income
classes, might well accept new dried fish products if the overall quality could be guaranteed.
Even though there is a market potential for dried capelin and improved processed sardine, the
exact price for the products was not established. A follow-up study covering a large area is
recommended to assess business feasibility prior to commercialization.
In general dried and smoked small fish was found to be nutritious and could contribute to the
reduction of malnutrition prevailing in most developing countries where it’s consumed, if quality
64
and consumption is enhanced. The studies were carried out on capelin of medium lipid content
and one sardine batch. It would be more interesting if the capelin batches studied were in the
category of fatty, semi-fatty and lean as the lipid content of capelin varies from about 4% to 20%
depending on the season.
7 Industrial application
Indoor drying of unblanched fish and controlled smoking, results in the production of nutritious
fish products that are consistent in quality and stable during storage. Indoor drying system will
eliminate the current dependency on weather conditions during drying as practiced in most
developing countries, but the raw materials used must be of good quality highlighting the need to
improve post-catch handling in the sardine fishery.
Together with storage temperature, vacuum packaging of dried and smoked capelin, will
overcome the problem of when to catch capelin intended for human consumption since its lipid
content varies over the catching period (spawning migration in winter) January to March in
Iceland. Vacuum packaging assures stability during storage, even though all the batches in the
study were of medium lipid content (7-10 %), implying that capelin landed over that catching
period can be dried and smoked for human consumption if vacuum packaging is applied.
Although dried and smoked fish quality is related to processing method, it should also be
emphasized to processors, distributors and retailers to take advantage of existing opportunity in
the use of vacuum packaging technology to maintain quality and extend shelf life to overcome
the degradation and marketing challenges of dried and smoked small fish in developing
countries. Dried and smoked small pelagic fish are primarily sold in open-air markets and
consumed by the low income classes. Vacuum packaging will improve the product presentation
and accessibility to national retail stores as well as the retention of nutritional value (PUFAs),
increasing consumption of dried and smoked small fish, and also attract new consumers
especially among the middle income classes. Marketing of the products in national stores will
also raise the value of the fishery thereby creating more employment and higher income along
the value chain.
65
8 References
Aberoumand, A. (20100). Occurrence of clostridium botulinum in Fish and Fish products in
retail trade. World Journal Fish and Marine Science, 2(3), 246–250.
Abolagba, O. J., & Nuntah, J. N. (2011). Survey on cured fish processing , packaging ,
distribution and marketing in Edo and Delta states. International Research Journal of
Biotechnology, 2(5), 103–113.
African Development Bank. (2011). Kenya Country Strategy Paper 2014-2018. Nairobi, Kenya.
Ahmed, E. O., Adm, H. T., & Mohammed, K. E. (2013). Investigating the Quality Changes of
Hot Smoked Clarias lazera at Refrigerated Temperature ( 5 ± 1 ° C ). Journal of Agriculture
and Food Science, 1(3), 27–32.
Akande, G. R., & Asuquo-King, M. . (2001). Control of insect infestation in smoked West
African Sardine. In 14th Annual Conference of the Fisheries Society of Nigeria (FISON),
Ibadan, Nigeria (pp. 115–118).
Akintola, S. L., Brown, A., Bakare, A., Osowo, O. D., & Omolola, B. (2013). Effects of Hot
Smoking and Sun Drying Processes on Nutritional Composition of Giant Tiger Shrimp
(Penaeus monodon, Fabricius, 1798). Polish Journal of Food and Nutrition Sciences, 63(4),
227–237. doi:10.2478/v10222-012-0093-1
AOAC. (1998). “Official method Ce 1b-89.” In Official methods and recommended practises of
the American oil chemists’ society. Firestone, D. Champaign, IL, American Oil Chemists’
Society.
AOAC. (2000). Fat (total, saturated, and unsaturated) in foods: Method 996 06. In E. Davi (Ed.),
Official methods of analysis of AOAC international (17th ed.). Gaithersburg, MD: AOAC
International.
Arason, S. (2003). The drying of fish and utilization of Geothermal Energy - The Icelandic
experience. Reykjavik, Iceland: Icelandic Fisheries Laboratory and The University of
Iceland.
Bala, B. K., & Mondol, M. R. A. (2001). Experimental investigation on solar drying of fish using
solar tunnel dryer. Drying Technology, 19, 427–436.
Baylan, M., Mazi, G., Ozcan, D., Ozcan, Bahri, N., Akar, M., & Conskun, A. (2015). Changes of
Electrophoretic Protein Profiles of Smoked and Marinated Rainbow Trout (Oncorhynchus
mykiss) During Refrigerated Storage. Journal of Agricultural Sciences, 21, 262–269.
Bellagha, S., Amami, E., Farhat, A., & Kechaou, N. (2002). Drying kinetics and characteristic
drying curve of lightly salted Sardine (Sardinella aurita). Drying Technology, 20(7), 1527–
1538. doi:10.1081/DRT-120005866
66
Bellagha, S., Sahli, A., Farhat, A., Kechaou, N., & Glenza, A. (2007). Studies on salting and
drying of sardine (Sardinella aurita): Experimental kinetics and modeling. Journal of Food
Engineering, 78(3), 947–952. doi:10.1016/j.jfoodeng.2005.12.008
Beltrin, A., Peláez, C., & Moral, A. (1989). Keeping quality of vacuum-packed smoked sardine
fillets: Microbiological aspects. European Food Research and Technology, 188(3), 232–
236. doi:10.1007/BF02112881
Bernardez, M., Pastoriza, L., Sampedro, G., Herrera, J. J. R., & Cabo, M. L. (2005). Modified
method for the analysis of free fatty acids in fish. Journal of Agricultural and Food
Chemistry, 53, 1903–1906.
Beveridge, T., Toma, S. J., & Nakai, S. (1974). Determination of SH- and SS-groups in some
food proteins using Ellman’s reagent. Journal of Food Science, 39, 49–51.
Bilgin, Ş., Ünlüsayın, M., İzci, L., & Günlü, A. (2008). The Determination of the Shelf Life and
Some Nutritional Components of Gilthead Seabream ( Sparus aurata L ., 1758 ) after Cold
and Hot Smoking. Turk. J. Vet. Anim. Science, 32(1), 49–56.
Bligh, E. G., & Dyer, W. S. (1959). A rapid method of total lipid extraction and purification.
Canadian Journal of Biochemistry and Physiology, 37, 911–917.
Boutrolle, I., Arranz, D., Rogeaux, M., & Delarue, J. (2005). Comparing central location test and
home use test results: Application of a new criterion. Food Quality and Preference, 16(8),
704–713. doi:10.1016/j.foodqual.2005.03.015
Boutrolle, I., Delarue, J., Arranz, D., Rogeaux, M., & Köster, E. P. (2007). Central location test
vs. home use test: Contrasting results depending on product type. Food Quality and
Preference, 18(3), 490–499. doi:10.1016/j.foodqual.2006.06.003
Bradford, M. (1976). A rapid and sensitive method for the quantitation of microgram quantities
of protein utilizing the principle of protein–dye binding. Analytical Biochemistry, 72, 248–
254.
Bragadóttir, M., Pálmadóttir, H., & Kristbergsson, K. (2002). Seasonal changes in chemical
composition and quality parameters of capelin (Mallotus villosus). Journal of Aquatic Food
Product Technology, 11(3/4), 87–103.
Burri, L., Hoem, N., Banni, S., & Berge, K. (2012). Marine omega-3 phospholipids: metabolism
and biological activities. International Journal of Molecular Sciences, 13(11), 15401–19.
doi:10.3390/ijms131115401
Cardinal, M., Knockaert, C., Torrissen, O., Sigurgisladottir, S., Mørkøre, T., Thomassen, M., &
Luc Vallet, J. (2001). Relation of smoking parameters to the yield, colour and sensory
quality of smoked Atlantic salmon (Salmo salar). Food Research International, 34(6), 537–
550. doi:10.1016/S0963-9969(01)00069-2
67
Carscadden, J. E., Gjøsæter, H., & Vilhjálmsson, H. (2013). Recruitment in the Barents Sea,
Icelandic, and eastern Newfoundland/Labrador capelin (Mallotus villosus) stocks. Progress
in Oceanography, 114, 84–96. doi:10.1016/j.pocean.2013.05.006
Chaijan, M. (2009). Effects of different saturated aldehydes on the changes in sardine (Sardinella
gibbosa) myoglobin stability. Asian Journal of Food and Agro-Industry, 2(01), 28–38.
Chaijan, M., Benjakul, S., Visessanguan, W., & Faustman, C. (2006). Changes of lipids in
sardine (Sardinella gibbosa) muscle during iced storage. Food Chemistry, 99(1), 83–91.
doi:10.1016/j.foodchem.2005.07.022
Chotimarkorn, C., Silalai, N., & Chaitanawisuit, N. (2010). Changes and Deterioration of Lipid
in Farmed Spotted Babylon Snail (Babylonia areolat a) Muscle during Iced Storage. Food
Science and Technology International, 15(5), 427–433. doi:10.1177/1082013209350270
Chukwu, O., & Shaba, I. M. (2009). Effects of Drying Methods on Proximate Compositions of
Catfish ( Clarias gariepinus ). World Journal of Agriculture Sciences, 5(1), 114–116.
Cyprian, O., Lauzon, H. L., Jóhannsson, R., Sveinsdóttir, K., Arason, S., & Martinsdóttir, E.
(2013). Shelf life of air and modified atmosphere-packaged fresh tilapia (Oreochromis
niloticus) fillets stored under chilled and superchilled conditions. Food Science & Nutrition,
1(2), 130–40. doi:10.1002/fsn3.18
Cyprian, O., Nguyen, V. M., Sveinsdottir, K., Jonsson, A., Thorkelsson, G., & Arason, S. (2015).
Influence of lipid content and blanching on capelin (Mallotus villosus) drying rate and lipid
oxidation under low temperature drying. Food Process Engineering, In press, 1–10.
doi:10.1111/jfpe.12215
Cyprian, O., Nguyen, V. M., Sveinsdottir, K., Jonsson, A., Tomasson, T., Thorkelsson, G., &
Arason, S. (2015). Influence of smoking and packaging methods on lipid stability and
microbial quality of Capelin (Mallotus villosus) and Sardine (Sardinella gibossa). Food
Science & Nutrition, In press, 1–11. doi:10.1002/fsn3.233
Cyprian, O. O., Sveinsdóttir, K., Magnússon, H., & Martinsdóttir, E. (2008). Application of
Quality Index Method (QIM) Scheme and Effects of Short-Time Temperature Abuse in
Shelf Life Study of Fresh Water Arctic Char ( Salvelinus alpinus ). Journal of Aquatic Food
Product Technology, 17(3), 303–321. doi:10.1080/10498850802195038
Darvishi, H., Azadbakht, M., Rezaeiasl, A., & Farhang, A. (2013). Drying characteristics of
sardine fish dried with microwave heating. Journal of the Saudi Society of Agricultural
Sciences, 12(2), 121–127. doi:10.1016/j.jssas.2012.09.002
Dewi, R. S., Huda, N., & Ahmad, R. (2011). changes in physicochemical properties,
Micostructure and Sensory Characteristics of Shark Dendeng Using Different Drying
methods. American Journal of Food Technology, 6(2), 149–157.
68
Doe, P. E. (2002). Fish drying. In H. A. Bremner (Ed.), Safety and quality issues in fish
processing. Cambridge England: Woodhead publishing limited. Retrieved from
http://www.enq.ufsc.br/disci/eqa5217/material_didatico/WP1540-18.pdf
Driscoll, R. H., & Madamba, P. S. (1994). Modeling the browning kinetics of garlic. Food
Australia, 46, 66–71.
Duan, Z., Zhang, M., Hu, Q., & Sun, J. (2005). Characteristics of Microwave Drying of Bighead
Carp. Drying Technology, 23(3), 637–643. doi:10.1081/DRT-200054156
Dyer, W. J., & Dingle, J. R. (1961). Fish as Food. (B. Borgstrom, Ed.) (Volume 1.). New York:
Academic Press Inc.
Erickson, M. (2002). Lipid oxidation of muscle foods. In C. C. Akoh & D. B. Min (Eds.), Food
lipids: Chemistry, nutrition and biotechnology (pp. 383–429). New York, NY: Marcel
Dekker, Inc.
Erkan, N. (2012). The Effect of Thyme and Garlic Oil on the Preservation of Vacuum-Packaged
Hot Smoked Rainbow Trout (Oncorhynchus mykiss). Food and Bioprocess Technology,
5(4), 1246–1254. doi:10.1007/s11947-010-0412-7
Erkan, N., Ulusoy, Ş., & Tosun, Ş. Y. (2011). Effect of combined application of plant extract and
vacuum packaged treatment on the quality of hot smoked rainbow trout. Journal Für
Verbraucherschutz Und Lebensmittelsicherheit, 6(4), 419–426. doi:10.1007/s00003-011-
0665-8
Etemadian, Y., Shabanpour, B., Mahoonak, A. S., & Shabani, A. (2012). Combination effect of
phosphate and vacuum packaging on quality parameters of Rutilus frisii kutum fillets in ice.
Food Research International, 45(1), 9–16. doi:10.1016/j.foodres.2011.09.026
FAO. (2003). A study of the trade in smoked-dried fish from West Africa to the United
Kingdom. Rome, Italy: Food and Agriculture Organisation Fisheries Circular No. 981.
FAO. (2007). Fishery country profile: Republic of Kenya. FID/CP/KEN/FAO, Rome.
FAO. (2010). The state of world fisheries and aquaculture. Food and Agriculture Organization
of the United Nations, 2010, 218. Retrieved from
http://scholar.google.com/scholar?hl=en&btnG=Search&q=intitle:THE+STATE+OF+WOR
LD+FISHERIES+AND+AQUACULTURE#0
Fennema, O. R. (1977). Water and protein hydration. In J. R. Whitaker & S. R. Tannenbaum
(Eds.), Food proteins (pp. 50–90). Westport, CT: AVI Publishing Co. Inc..
Finot, P. A. (1997). Effects of Processing and Storage on the Nutritional Value of Food Proteins.
In S. Damodaran & A. Paraf (Eds.), Food Proteins and their Applications (pp. 551–557).
New York, NY: Marcel Dekker, Inc.
69
Food and Agriculture Organization. (1992). Inland Fisheries Planning Development and
management in Eastern/Central Southern Africa.
Frankel, E. N. (2005). Lipid oxidation (2nd ed.). Dundee, UK: The Oil Press.
Froese, R., & Pauly, D. (2006). Sardinella gibossa. in FishBase, May 2015.
Ghelichpour, M., & Shabanpour, B. (2011). The investigation of proximate composition and
protein solubility in processed mullet fillets. International Food Research Journal, 18(4),
1343–1347.
Gitonga, N. (2005). Status of major marine fish stock. In The promotion of sustainable and
equitable fisheries access agreements (pp. 13–16). June 20 -21, White Sands Hotel Dar es
Salaam, Tanzania.
Goulas, A. E., & Kontominas, M. G. (2005). Effect of salting and smoking-method on the
keeping quality of chub mackerel (Scomber japonicus): biochemical and sensory attributes.
Food Chemistry, 93(3), 511–520. doi:10.1016/j.foodchem.2004.09.040
Government of Kenya. (2011). Annual Report,Nyanza Province. Ministry of Fisheries
Development.
Gram, L., Ravn, L., Rasch, M., Bruhn, J. B., Christensen, A. B., & Givskov, M. (2002). Food
spoilage-interactions between food spoilage bacteria. International Journal of Food
Microbiology, 78(1-2), 79–97. doi:10.1016/S0168-1605(02)00233-7
Green, J., Draper, A., & Dowler, E. (2003). Short cuts to safety: risk and “rules of thumb” in
accounts of food choice. Health, Risk and Society, 5(1), 33–52.
Grummer, J., & Schoenfuss, T. C. (2011). Determining salt concentrations for equivalent water
activity in reduced-sodium cheese by use of a model system. . Journal of Dairy Science, 94,
4360–4365. doi:doi:10.3168/jds.2011-4359
Grunert, K. G., Juhl, H. J., Esbjerg, L., Jensen, B. B., Bech-Larsen, T., Brunsø, K., & Madsen, C.
Ø. (2009). Comparing methods for measuring consumer willingness to pay for a basic and
an improved ready made soup product. Food Quality and Preference, 20(8), 607–619.
doi:10.1016/j.foodqual.2009.07.006
Guillen, M. D., & Errecalde, M. C. (2002). Volatile components of raw and smoked black bream
(Brama raii) and rainbow trout (Oncorhynchus mykiss) studied by means of solid phase
microextraction and gas chromatography/mass spectrometry. Journal of the Science of Food
and Agriculture, 82, 945–952.
Hansen, L. T., Gillb, T., & Huss, H. H. (1995). Effects of salt and storage temperature on
chemical , microbiological and sensory changes in cold-smoked salmon. Food Research
International, 28(2), 123–130.
70
Henderson, R. J., Sargent, J. R., & Hopkins, C. C. E. (1984). Changes in the content and fatty
acid composition of lipid in an isolated population of the capelin Mallotus villosus during
sexual maturation and spawning. Marine Biology, 78(3). doi:10.1007/BF00393011
Hough, G., Wakeling, I., Mucci, A., Chambers IV, E., Gallardo, I. M., & Alves, L. R. (2006).
Number of consumers necessary for sensory acceptability tests. Food Quality and
Preference, 17(6), 522–526. doi:10.1016/j.foodqual.2005.07.002
Howell, N., Herman, H., & Li-Chan, E. (2001). Elucidation of protein-lipid interactions in
lysozyme – Corn oil system by fourier transform raman spectroscopy. Journal of
Agriculture and Food Chemistry, 49, 1529–1533.
Hsu, K. C., Hwang, J. S., Yu, C. C., & Jao, C. L. (2007). Changes in conformation and in
sulfhydryl groups of actomyosin of tilapia (Orechromis niloticus) on hydrostatic pressure
treatment. Food Chemistry, 103, 560–564.
Huda, N., Dewi, R. ., & Ahmad, R. (2010). Traditional smoked catfish, efects on amino acid
profile.pdf. Journal of Fisheries and Aquaculture Science, 5(2), 106–112.
Huss, H. H. (1995). Quality and quality changes in fresh fish. FAO Fisheries Technical Paper -
T348.
Hwang, C.-C., Lin, C.-M., Kung, H.-F., Huang, Y.-L., Hwang, D.-F., Su, Y.-C., & Tsai, Y.-H.
(2012). Effect of salt concentrations and drying methods on the quality and formation of
histamine in dried milkfish (Chanos chanos). Food Chemistry, 135(2), 839–44.
doi:10.1016/j.foodchem.2012.05.035
ICES. (2009). Report of the Working Group on Widely Distributed Stocks (WGWIDE) 2–8
September 2009. Copenhagen, ICES CM 2009/ACOM:12.
Ikutegbe, V., & Sikoki, F. (2014). Microbiological and biochemical spoilage of smoke-dried
fishes sold in West African open markets. Food Chemistry, 161, 332–336.
doi:10.1016/j.foodchem.2014.04.032
IOC. (2012). Regional Fish Trade in Eastern and Southern Africa. Products and Markets. A Fish
Traders Guide. Indian Ocean Commission, SmartFish working Paper No 013, pp54.
Ipsos-Synovate. (2013). Kenya coast survey: Development, Marginalisation, Security and
Participation. Nairobi, Kenya: USAID/Kenya Transition Initiative (KTI)-COast programme.
ISO. (1993a). Determination of moisture and other volatile matter content (6496). Geneva,
Switzerland: The international Organization for Standards.
ISO, 8586–1. (1993b). Sensory analysis-general guidance for the selection, training and
monitoring of assessors. Geneva, Switzerland: The International Organisation for
Standardization.
71
Jain, D. (2006). Determination of Convective Heat and Mass Transfer Coefficients for Solar
Drying of Fish. Biosystems Engineering, 94(3), 429–435.
doi:10.1016/j.biosystemseng.2006.04.006
Jain, D., & Pathare, P. B. (2007). Study the drying kinetics of open-sun drying of fish. Journal of
Food Engineering, 78(4), 1315–1319. doi:10.1016/j.jfoodeng.2005.12.044
Joffraud, J., Cardinal, M., Cornet, J., Chasles, J., Léon, S., Gigout, F., & Leroi, F. (2006). Effect
of bacterial interactions on the spoilage of cold-smoked salmon. International Journal of
Food Microbiology, 112(1), 51–61.
Karlsdottir, M. G., Sveinsdottir, K., Kristinsson, H. G., Villot, D., Craft, B. D., & Arason, S.
(2014). Effect of thermal treatment and frozen storage on lipid decomposition of light and
dark muscles of saithe (Pollachius virens). Food Chemistry, 164, 476–484.
doi:10.1016/j.foodchem.2014.05.068
Kelleher, S. D., & Hultin, H. O. (1991). Lithium chloride as a preferred extractant of fish protein.
Journal of Food Science, 56, 315–317.
Kenya Bereau of Standards. (2015). Fish and fishery products (regulation No. KEBS/TC 017).
Retrieved from http://kebs.org/index.php?opt=standards&view=Food and Agriculture
Kenya National Bereau of Statistics. (2015). Government statistics Kenya. Kenya National
Bereau of Statistics. Retrieved from http://www.knbs.or.ke/
Kilcast, D., & Subramaniam, P. (Eds.). (2000). The stability and shelf life of food. Cambridge
England: Woodhead publishing limited.
Kilic, A. (2009). Low temperature and high velocity (LTHV) application in drying:
Characteristics and effects on the fish quality. Journal of Food Engineering, 91(1), 173–
182. doi:10.1016/j.jfoodeng.2008.08.023
Kinnucan, H., Nelson, R., & Hiariey, J. U. . (1993). Preferences for fish and seafood: An evoked
set analysis. Marine Resource Economics, 8, 273–291.
Kwambai, K. (2011). Steam availability and development plans at Olkaria. In Kenya Geothermal
Conference. Nairobi, Kenya.
Lake Victoria Basin Commission. (2011). A Study on Aquatic Biodiversity in the Lake Victoria
Basin. ACTS Press, African Centre for Technology Studies, Lake Victoria Bassin
Commision, Nairobi Kenya.
Langat, A. K., & Rey, B. (1999). Kenya’s efforts to secure sanitary standards of fishery products.
Dossier Bulletin, 12(2-3), 11–13.
Lemon, D. W. (1975). An improved TBA test for rancidity. New Series Circular.
72
Leroi, F., Joffraud, J., & Chevalier, F. (2000). Effect of salt and smoke on the microbiological
quality of cold-smoked salmon during storage at 5 degrees C as estimated by the factorial
design method. Journal of Food Protection, 63(4), 502–508.
Lewicki, P. . (2006). Design of hot air drying for better foods. Trends in Food Science and
Technology, 17, 153–163.
Lopez-Amaya, C., & Marangoni, A. (2000). Phospholipases. In F. Na. Haard & K. B. Simpson
(Eds.), Seafood Enzymes (pp. 91–119). New York: Marcel Dekker, Inc.
Lund, B., & Peck, M. (1991). Clostridium botulinum. In B. Lund, T. Baird-Parker, & G. Gould
(Eds.), The microbiological safety and quality of foods (pp. 19312–19319). Aspen:
Gaithersburg (MD):
Magnússon, H., Sveinsdóttir, K., Lauzon, H., Thorkelsdóttir, Á., & Martinsdóttir, E. (2006).
Keeping quality of desalted cod fillets in consumer packs. Journal of Food Science, 71, 70–
76.
Malleret-King, D., King, A., Mangubhai, S., Tunje, J., Muturi, J., Mueni, E., & On’ganda, H.
(2009). Understanding fisheries associated livelihoods and constraints to their development
in Kenya and Tanzania. FMSP Project R8196.
Marc, C., Kaaker, R., & Mboofung, C. M. . (1997). Effect of Salting and Smoking method on the
stability of Lipid and Microbialogical Quality. Journal of Food Quality, 22, 517–528.
Meneshi, S., Harwood, R., & Grant, M. E. (1976). Native collagen is not a substrate for collagen
glucosyl trasferase of platelets. Nature (London), 246(5587), 670–672.
Mhongole, O., & Mhina, M. (2012). Value addition - Hot smoked Lake Victoria Sardine (
Rastrineobola argentea ) for human consumption. In IIFET 2012 Tanzania, Visible
Possibilities: The Economics of Sustainable Fisheries, Aquaculture and Seafood Trade (pp.
1–12). Daressalaam, Tanzania.
Mohan, M., Ramachandran, D., & Sankar, T. (2006). Functional properties of Rohu (Labeo
rohita) proteins during iced storage. Food Research International Int, 39, 847–54.
Mørkøre, T., Netteberg, C., Johnson, L., & Pickova, J. (2007). Impact of dietary oil source on
product quality of farmed Atlantic cod, Gadus morhua. Aquaculture, 267, 236–247.
Munguti, J. M., Kim, J.-D., & Ogello, E. O. (2014). An Overview of Kenyan Aquaculture:
Current Status, Challenges, and Opportunities for Future Development. Fisheries and
Aquatic Sciences, 17(1), 1–11. doi:10.5657/FAS.2014.0001
Murat, O., & Onur, D. (2000). Kinetics of color changes of hazelnuts during roasting. Journal of
Food Engineering, 44, 31–38.
73
Murueta, J. H., Toro, M. D. L. Á., & Carreño, G. F. (2007). Concentrates of fish protein from
bycatch species produced by various drying processes. Food Chemistry, 100, 705–711.
doi:10.1016/j.foodchem.2005.10.029
Nguyen, M. V., Jonsson, A., Thorarinsdottir, K., Sigurjon Arason, & Thorkelsson, G. (2011).
Effects of Different Temperatures on Storage Quality of Heavily Salted Cod ( Gadus
morhua). International Journal of Food Engineering, 7(1). doi:10.2202/1556-3758.2109
Nguyen, M. Van, Thorarinsdottir, A. K., Thorkelsson, G., Gudmundsdottir, A., & Arason, S.
(2012). Influences of potassium ferrocyanide on lipid oxidation of salted cod ( Gadus
morhua ) during processing , storage and rehydration. Food Chemistry, 131(4), 1322–1331.
doi:10.1016/j.foodchem.2011.09.126
Nguyen, M. Van, Thorarinsdottir, K. A., Gudmundsdottir, A., Thorkelsson, G., & Arason, S.
(2011). The effects of salt concentration on conformational changes in cod ( Gadus morhua
) proteins during brine salting. Food Chemistry, 125(3), 1013–1019.
doi:10.1016/j.foodchem.2010.09.109
Obiero, K. O., Opiyo, M. a, Munguti, J. M., Orina, P. S., Kyule, D., Yongo, E., … Charo-karisa,
H. (2014). Consumer preference and marketing of farmed Nile Tilapia (Oreochromis
niloticus) and African Catfish (Clarias gariepinus) in Kenya : Case Study of Kirinyaga and
Vihiga Counties. International Journal of Fisheries and Aquactic Studies, 1(5), 67–76.
Odoli, C., Oduor-Odote, P., Onyango, S., & Ohowa, B. (2013). Evaluation of fish handling
techniques employed by artisanal fishers on quality Lethrinids and Siganids fish genera at
landing time using sensory and microbialogical methods. African Journal of Food,
Agriculture, Nutrition Amd Development, 13(5), 8167–8186.
Oduor-Odote, P., & Obiero, M. (2009). Lipid oxidation and organoleptic response during shelf
storage of of some smoked marine fish in Kenya. African Journal of Food, Agriculture,
Nutrition and Development, 9(3), 885–900.
Oduor-Odote, P., Obiero, M., & Odoli, C. (2010). Organoleptic effect of using different plant
materials on smoking of marine and freshwater catfish. African Journal of Food,
Agriculture, …, 10(6), 2658–2677. Retrieved from
http://www.ajol.info/index.php/ajfand/article/view/58054
Oduor-Odote, P., Shitanda, D., Obiero, M., & Kituu, G. (2010). Drying characteristics and some
quality attributes of Rastrineobola argentia (Omena) and Stolephorus delicatulus
(Kimarawali). African Journal of Food, Agriculture, Nutrition and Development, 10(8),
2998–3014.
Ofulla O, A., Onyuka, J., Wagai, S., Anyona, D., Dida, G., & Gichuki, J. (2011). Comparison of
Different Techniques for Processing and Preserving fish Rastrineobola. World Academy of
Science, Engineering and Technology, 60, 1643–1647.
74
Okera, W. (1969). An Analysis of the Features of Sardinella gibbosa (Bleeker) with Special
Reference to the Problem of Age Determination. Dar es Salaam: University college.
Omodara, M. A., & Olaniyan, A. M. (2012). Effects of Pre-Treatments and Drying Temperatures
on Drying Rate and Quality of African Catfish ( Clarias gariepinus ). Journal of Biology,
Agriculture and Healthcare, 2(4), 1–11.
Oyero, J. O., Sadiku, S. O. E., & Eyo, A. A. (2012). The effect of various smoking methods on
the quality of differently salted Oreochromis niloticus. International Journal of Advanced
Biological Research, 2(4), 717–723.
Ozen, B. O., Eren, M., Pala, A., Ozmen, I., & Soyer, A. (2011). Effect of plant extracts on lipid
oxidation during frozenstorage of minced fish muscle. International Journal of Food
Science and Technology, 46, 724–731.
Park, S. Y., Lee, N.-Y., Kim, S.-H., Cho, J.-I., Lee, H.-J., & Ha, S.-D. (2014). Effect of
ultraviolet radiation on the reduction of major food spoilage molds and sensory quality of
the surface of dried filefish (Stephanolepis cirrhifer) fillets. Food Research International,
62, 1108–1112. doi:10.1016/j.foodres.2014.05.060
Parmentier, M., Mahmoud, A. S., Linder, M. C., & Fanni, J. (2007). Polar lipids: n- 3 PUFA
carriers for membranes and brain: nutritional interest and emerging processes. Oleagineux,
Corps Gras, Lipides, 14, 224–229.
Poulter, R. G., Ledward, D. A., Godber, S., Hall, G., & Rowlands, B. (1985). Heat stability of
fish muscle proteins. Journal of Food Technology, 20, 203–217.
Raman, M., & Mathew, S. (2014). Quality Changes During Frozen Storage and Cooking of
Milk. Journal of International Academic Research for Multidisciplinary, 2(4), 452–468.
Rawdkuen, S., Jongjareonrak, A., Phatcharat, S., & Benjakul, S. (2010). Assessment of protein
changes in farmed giant catfish (Pangasianodon gigas) muscles during refrigerated storage.
International Journal of Food Science and Technology, 45, 985–994. doi:10.1111/j.1365-
2621.2010.02217.x
Ren, J., Zhao, M., Shi, J., Wang, J., Jiang, Y., Cui, C., … Xue, J. . (2008). Optimization of
antioxidant peptide production from grass carp sarcoplasmic protein using response surface
methodology. Food Science and Technology, 41, 1624–1632.
Reza, S., Bapary, A. B. U. J., & Islam, N. (2009). Optimization of marine fish drying using solar
tunnel dryer. Journal of Food Processing and Preservation, 33(2009), 47–59.
Rorvik, L. M. (2000). Listeria monocytogenes in the smoked salmon industry. International
Journal of Food Microbiology, 62, 183–190.
75
Rustad, T., & Nesse, N. (1983). Heat treatment and drying of capelin mince.pdf. Journal of Food
Science, 48(4), 1320–1322.
Santha, N. C., & Decker, E. A. (1994). Rapid, sensitive, iron-based spectrophotometric methods
for determination of peroxide values of food lipids. Association of Official Analytical
Chemists International, 77, 421–424.
Schuurhuizen, R., Van-Tilburg, V., & Kambewa, E. (2006). Fish in Kenya: The Nile-perch
chain. In R. Ruben, M. Slingerland, & H. Nijhoff (Eds.), Agro-food Chains and Networks
for Development (pp. 155–164). Netherlands.
Shah, A. A. K. M., Tokunaga, C., Kurihara, H., & Takahashi, K. (2009). Changes in lipids and
their contribution to the taste of migaki-nishin (dried herring fillet) during drying. Food
Chemistry, 115(3), 1011–1018. doi:10.1016/j.foodchem.2009.01.023
Shahidi, F., Han, X.-Q., & Synowiecki, J. (1995). Production and characteristics of protein
hydrolysates from capelin (Mallotus villosus). Food Chemistry, 53(3), 285–293.
doi:10.1016/0308-8146(95)93934-J
Shanmugam, V., & Natarajan, E. (2006). Experimental investigation of forced convection and
desiccant integrated solar dryer. Renewable Energy, 31(8), 1239–1251.
doi:10.1016/j.renene.2005.05.019
Sharma, R., Zakora, M., & Qvist, K. (2002). Characteristics of oil-water emulsions stabilised by
an industrial α-lactalbumin concentrate, cross-linked before and after emulsification, by a
microbial transglutaminase. Food Chemistry, 79(493-500).
Sivertsvik, M., Jeksrud, W. K., & Rosnes, J. T. (2002). A review of modified atmosphere
packaging of fish and fishery products - Significance of microbial growth, activities and
safety. International Journal of Food Science and Technology, 37(2), 107–127.
doi:10.1046/j.1365-2621.2002.00548.x
Skipnes, D., Plancken, V. der I., Loey, V. A., & Hendrick, E. M. (2008). Kinetics of heat
denaturation of proteins from farmed Atlantic cod (Gadus morhua). Journal of Food
Engineering, 85(1), 51–58. doi:10.1016/j.jfoodeng.2007.06.030
Sosa, M., Martinez, C., Marquez, F., & Hough, G. (2008). Location and scale influence on
sensory acceptability measurements among low-income consumers. Journal of Sensory
Studies, 23(5), 707–719. doi:10.1111/j.1745-459X.2008.00181.x
Standal, I. B., Axelson, D. E., & Aursand, M. (2010). 13C NMR as a tool for authentication of
different gadoid fish species with emphasis on phospholipid profiles. Food Chemistry,
121(2), 608–615. doi:10.1016/j.foodchem.2009.12.074
76
Stapelfeldt, A. K., Nielsen, R. B., & Skibsted, H. L. (1997). Effect of Heat Treatment, Water
Activity andStorage Temperature on the Oxidative Stability ofWhole Milk Powder.
International Dairy Journal, 7, 331–339.
Statistics Iceland. (2015). Fisheries Catch and value of catch. April 5, 2015. Retrieved from
http://www.statice.is/Statistics/Fisheries-and-agriculture/Catch-and-value-of-catch
(Acessed April 5, 2015)
Stewart, J. C. M. (1980). Colorimetric determination of phospholipids with ammonium
ferrothiocyanate. Analytical Biochemistry, 104(1), 10–14.
Stoknes, I. S., Walde, P. M., & Synnes, M. (2005). Proteolytic activity in cod (Gadus morhua)
muscle during salt curing. Food Research International, 38(6), 693–699.
Stołyhwo, A., Kołodziejska, I., & Sikorski, Z. E. (2006). Long chain polyunsaturated fatty acids
in smoked Atlantic mackerel and Baltic sprats. Food Chemistry, 94(4), 589–595.
doi:10.1016/j.foodchem.2004.11.050
Stołyhwo, A., & Sikorski, Z. E. (2005). Polycyclic aromatic hydrocarbons in smoked fish – a
critical review. Food Chemistry, 91(2), 303–311. doi:10.1016/j.foodchem.2004.06.012
Stone, H., & Sidel, J. L. (1985). Sensory Evaluation Practices. Florida. Orlanda, FL: Academic
Press Inc.
Thannhauser, T. W., Konishi, Y., & Scheraga, H. A. (1984). Sensitive quantitative analysis of
disulfide bonds in polypeptides and proteins. Analytical Biochemistry, 138(1), 181–188.
Underland, I., Hall, G., & Lingnert, H. (1999). Lipid oxidation in fillets of herring (Clupea
harengus) during ice storage. Journal of Agricultural Food Chemistry, 47(2), 524–532.
Vilhjálmsson, H. (2002). Capelin (Mallotus villosus) in the Iceland–East Greenland–Jan Mayen
ecosystem. ICES Journal of Marine Science, 59(5), 870–883. doi:10.1006/jmsc.2002.1233
Viljanen, K. (2005). Protein oxidation and protein-lipid interactions in different food models in
the presence of berry phenolics. October. PhD Thesis, Faculty of Agriculture and Forestry
of the University of Helsinki.
Wakwabi EO. (1981). Sardine Fishery in Kenya. In Aquatic Resources of Kenya (pp. 13–19).
Mombasa, Kenya.
Wang, W., Nema, S., & Teagarden, D. (2010). Protein aggregation – pathway and influencing
factors. International Journal of Pharmacy, 390, 89–99.
Warui, W. (2014). Optimal management policy for the Kenyan marine artisanal fishery. Masters
thesis; Environment and Natural Resource department, University of Iceland.
77
Wu, T., & Mao, L. (2008). Influences of hot air drying and microwave drying on nutritional and
odorous properties of grass carp (Ctenopharyngodon idellus ) fillets. Food Chemistry, 110,
647–653. doi:10.1016/j.foodchem.2008.02.058
Zamora, R., Alaiz, M., & Hidalgo, F. (1997). Modification of histidine residues by 4,5- epoxy-3-
alkenals. Biochemistry, 36, 15765–15771.
Zuazaga, C., Steinacker, A., & Castillo, del J. (1984). The Role of Sulfhydryl and Disulfide
Groups of Membrane Proteins in Electrical Conduction and chemical trasmission. Puerto
Rico Health Sciences Journal, 3(3), 125–139.

78
9 Appendices

1
PAPER I
Influence of blanching treatment and drying methods on the drying characteristics and
quality changes in dried sardine (Sardinella gibbosa) during storage
Cyprian, O. O., Nguyen, M. V., Sveinsdottir, K., Tomasson, T., Thorkelsson, G., Arason, S.
Drying Technology
Under review
I
2
Influence of blanching treatment and drying methods on the drying characteristics and
quality changes in dried sardine (Sardinella gibbosa) during storage
Cyprian OOa,e*
, Nguyen MV c, Sveinsdottir K
b, Tomasson T
d, Thorkelsson G
a,b, Arason S
a,b
aFaculty of Food Science and Nutrition, University of Iceland, Eiríksgata 29, 101
Reykjavík, Iceland
bMatisohf. /Icelandic Food and Biotech R&D Vinlandsleid 12, 113, Reykjavik, Iceland
cFaculty of Food Technology, NhaTrang University, 02 Nguyen DinhChieu, NhaTrang, Vietnam
dUnited Nations University Fisheries Training Programme, Skulagata 4, 121 Reykjavik, Iceland
eKenya Marine & Fisheries Research Institute, P.O Box 81651, Mombasa, Kenya
Corresponding author. Tel. +3548627565; Fax +3544225001
E-mail address: [email protected]
3
Abstract
The aim was to examine the drying characteristics of blanched and unblanched sardine
during indoor and open sun drying conditions, and the changes in quality of products during
storage. High drying rates were obtained in samples at the start of drying, with the highest rate in
blanched sardine during open sun drying. Blanching slowed down free fatty acids progression
during products storage but it adversely affected colour, lipid composition through oxidation, and
sensory properties. Although sardine dried faster under open sun than indoor conditions, it dried
for a longer time under indoor drying conditions to attain a stable moisture ratio that was lower
than in open sun dried samples. Indoor drying produced a quality stable product with less lipid
oxidation and the desired moisture content, lipid composition and sensory properties. Therefore,
a stable dried product of improved quality can be produced from unblanched sardine dried under
controlled conditions.
Key words: Sardine, dried, blanched, drying rate, quality
1 Introduction
Fish and other marine species give rise to products of great economic importance all over
the world. Fresh fish is highly perishable and drying, smoking and salting have traditionally been
used for preservation 1. In many developing countries, dried fish is an important source of low
cost and stable dietary protein 1,2
. In East Africa, dried sardines are among the most widespread
fishery products with a comparatively long shelf life, sold in small portions to meet the needs of
the low income groups 3. Sardinella gibbosa (locally known as ‘sim sim’) dominate the catches
of sardine species landed along the Kenyan coastline (Wakwabi E, unpublished).
Traditionally, sardines are open sun dried on the ground for about 2-3 days depending on
weather conditions. Fish dried in open sun are of variable and more often low quality with
limited shelf life 1. Contaminations from soil, insects and birds droppings during drying also pose
a problem. Poor product quality is a barrier to high end markets restricting dried sardine
marketing to local community areas. For this reason, drying racks which are raised ventilated
platforms in open air have been introduced 3. Nevertheless, rack drying depends on weather
4
conditions and therefore makes the results uncertain. Similar challenges were reported to have
prompted research in the use of integrated solar dryers incorporating desiccants, blowers and
thermal systems to continue drying during darkness hours 4. Initial investments and running costs
increase the price, but the product is stable during storage and safe for consumption.
Considering the rising of middle income groups in East Africa as well in many
developing countries 5 where such products are consumed, premium dried fish products could be
marketed in high end markets. The use of geothermal energy in Iceland has allowed affordable
year round indoor fish drying while maintaining consistence in product quality 6
. Kenya is the
top geothermal energy producer in Africa 7 but development in geothermal utilization is
nonetheless limited. To add value and ensure food safety in the sardine fishery, the use of
modern drying technologies such as systems utilizing geothermal energy are inevitable. There is
a need to conduct drying trial in such system and evaluate product quality alongside open sun
dried fish for advising prospective investors in the industry.
Sardine in particular Sardinella gibbosa is commonly partially boiled (blanched in brine)
prior to drying to inhibit enzymatic and microbial activities 8. The effect of fish blanching before
drying on the drying characteristics and quality of product is poorly studied. The most important
chemical reaction that occur during fish drying and storage of dried products is lipid oxidation
that results in nutrient degradation and changes in sensory properties 3,9
. Marine fish lipids are
rich in n-3 long chain polyunsaturated fatty acids 10
which are of excellent nutritional value.
However, they are prone to oxidation that adversely affects nutritional quality, wholesomeness
and sensory value. The present study was designed to investigate the effect of blanching
treatment and drying methods on the drying characteristics, lipid composition and oxidation, and
sensory quality of sardine during drying and storage.
2 Materials and methods
2.1 Raw material, processing and sampling
Sardine caught in the Western Indian Ocean by artisanal fishermen from Mombasa,
Kenya on 21st March, 2013 was landed approximately 8 hours post-catch and graded by size
5
(20–25 g). The graded fish (100 kg) was placed in flake ice and transported to the Kenya Marine
and Fisheries Research Institute laboratory within 3 hours. The fish was immediately frozen
upon arrival in blocks weighing 25 kg and kept frozen at -25 °C. Two frozen blocks were
transported by air freight to Iceland and the other two kept in Kenya for later studies.
The frozen fish was thawed overnight in open air at 20±2 °C. Upon thawing, fish was
divided into two equal portions. One portion was blanched in brine (BL) and the other brined
without blanching (unblanched, Co). The blanched portion was put in a perforated metallic pan
and immersed in boiling brine (103±0.5 °C) with pre-determined concentration of 5% fine NaCl-
salt solution for two minutes to attain about 2% salt content in the fish muscle. The blanched fish
was then spread on meshed trays to cool and remove excess surface water. The unblanched
portion was immersed in similar brine solution (5% fine NaCl-salt) for 2 hour at 2 °C to attain
about 2% salt content in the fish muscle. The unblanched fish was then spread on meshed trays
to remove excess surface water as in blanched. Ten individual fish from each portion were
tagged and weighed individually. Drying trials were done under indoor (I) and open sun (T)
drying conditions. The fish was arranged in a single layer on plastic meshed trays before drying.
The indoor drying was conducted in Vestfirska Hardfisksalan fish drying company in
Reykjavik, Iceland. The dryer used consisted of hot water flow heat exchanger with a centrifugal
fan, connected directly to the drying chamber. The heat exchanger and drying chamber were
equiped with a regulator that controlled the drying temperature (19-25 °C) and relative humidity
(76-49%) respectively. Air velocity in the drying chamber was kept constant at about 3.6 m/s.
Open sun drying was conducted on open air drying racks in Mombasa, Kenya. During open sun
drying, fish was covered with plastic sheets at night as commonly practiced for protection
against rodents and rain. Once dried, fish was transported to the laboratory and each portion air
packaged equally in 10 polyethylene bags and stored at room temperature (24±3 °C). Sampling
was done approximately once a month for 5 months. At each sampling point, 2 bags per portion
were picked randomly for analyses.

6
2.2 Analyses
Temperature and humidity
Temperature was measured and recorded using temperature data loggers (iButton
DS1922L, CA, USA) with an accuracy of ±0.5 C. While relative humidity values were
measured and recorded using humidity data loggers (digital infrared humidity meter) with
reading accuracy of ±0.01%. The loggers (n=3) were placed at different points during the
experiments and the readings automatically recorded every 15 minutes.
Drying kinetics
Equilibrium moisture content was determined at two temperatures 25 °C and 33 °C, and
relative humidity levels of 55% and 49%, obtained at the end of (unblanched and blanched)
sardine drying under indoor and open sun conditions respectively. Vemuganti equation applied
in calculating equilibrium moisture content (EMC) in agriculture products was used Eq. [1] 11
Which
A1 = - (6.65596 F + 20.146 N)
B1 = 1.987 (T+2.395 P + 0.8176 N)
C1 = - (0.46997 F + 0.22625 N)
Where Me is the equilibrium moisture content; RH is the relative humidity; T is the temperature
(°C); F is the fat %; N is nitrogen % and P is the protein %.
The moisture content of drying sample at any time was transformed to the moisture ratio
(MR) using Eq. [2] 11, 12
Where Mt is the moisture content at any time of drying (kg water/kg dry basis); M0 is the initial
moisture content (kg water/kg db) and Me is the equilibrium moisture content (kg water/kg db).
7
The drying performance is generally estimated using the drying rate (DR), which is
proportional to the difference in moisture content between the material to be dried and the
equilibrium moisture content. Mathematically, it can be expressed using Eq. [3] 13
Where DR is the drying rate at any time of drying (Kg water/Kg db. hour; dM is the change in
moisture content (Kg water/Kg db); dt is the change in time (Hour); Mt+∆t is the moisture content
at t = t + ∆t, and Mt is moisture content at t = t.
During sample drying, diffusion is generally accepted as the main mechanism for the
transportation of moisture from the internal layers to the surface layer to be evaporated. The
effective moisture diffusivity can be determined using Eq. [4] 13, 14
Where Deff is the effective moisture diffusivity (m2/s); L is the sample thickness (m); t is the
drying time (s).
Colour measurement
The colour intensity of dried sardine was measured using Minolta CR-300 chromameter
(Minolta Camera Co., Osaka, Japan) in Lab* system (CIE, 1976) with CIE IlluminantC. The
appliance recorded the L*-value (lightness), a
*-value (redness) and b
*-value (yellowness) on
CIELAB colour scale. Three positions on fish along the lateral line area were measured. The
average L*and b
*-values of five fish measurements (n=15) were used.
Chemical composition
Total lipid were extracted from 25 g samples (80±1% water) with
methanol/chloroform/0.88 % KCl (aq) (at 1/1/0.5, v/v/v) according to the 15
method. The lipid
content was determined gravimetrically and the results were expressed as % wet muscle basis.
Protein was determined by Kjeldahl method. The organic matter was digested by sulphuric acid
in the presence of a catalyst. The reaction product was rendered alkaline, and the liberated
ammonia was distilled and titrated with hydrochloric acids 16
. The salt content (NaCl) was

8
determined based on 17
and expressed as % muscle weight. Initial moisture content (M0) in fish
was calculated as the loss in weight during minced sample drying at 105 °C for 4 h 18
. Results
were expressed as Kg water/Kg db. Weight loss measurements taken during drying were used in
calculating moisture content of samples at any given time based on the initial weight and
moisture content.
Lipid oxidation
Lipid oxidation was measured as lipid hydroperoxides (PV) and thiobarbituric acid-
reactive substances (TBARS) on dried samples during storage. PV were determined using the
ferric thiocyanate method described by 19
with modifications according to 10
, except that 3±0.5 g
of sample was used instead of 5 g, and after extraction and centrifuging, 200 μL of the
chloroform layer was collected and mixed with 800 μL of chloroform: methanol solution. The
results were expressed as μmol lipid hydroperoxides/kg muscle weight.
TBARS were measured as described by 20
with modifications. A 3±0.5 g muscle sample
was homogenized with 10 ml of trichloroacetic acid (TCA) solution (7.5% TCA, 0.1% propyl
gallate and 0.1% EDTA mixture) using an Ultra-Turrax homogenizer at 8000 rpm for 10 s. The
homogenate was then centrifuged at 5100 rpm for 20 min at 4 oC (TJ-25 centrifuge, Beckmann
Coulter, USA). A 100 μL of supernatant was collected and mixed with 900 μL of 0.02 M
thiobarbituric acid solution in 1.5 mL Eppendorfs and heated in a water bath for 40 min at 95 C.
The samples were cooled down on ice after which, 200 μL were placed in duplicate into a 96-
well micro plate reader for absorbance reading at 530 nm (Sunrise Micro plate Reader, Tecan
GmbH, A-5082 Grödig, Austria). The results were expressed as μmol of malomaldehyde
diethylacetal/kg muscle weight.
Free fatty acid and fatty acid composition
Free fatty acid (FFA) content was determined on 3 mL of the lipid extract based on a
complex formation with cupric acetate-pyrimidine 21
, followed by absorbance reading of the
upper layer at 710 nm. The FFA concentration was calculated as μM quantities of oleic acid,
based on a standard curve spanning a 2-22 μmol range. Results were expressed as g FFA/100 g
lipid.

9
The fatty acid composition was determined following derivatisation of extracted total
lipid to fatty acid methyl esters (FAME) by gas chromatography (Varian 3900 GC, Varian, Inc.,
Walnut Creek, CA, USA) equipped with a fused silica capillary column (HP-88, 100 m x 0.25
mm x 0.20 µm film), split injector and flame ionisation detector (FID) based on 22
method. The
result of each fatty acid was expressed as g fatty acid/100 g lipid.
Sensory evaluation with Generic Descriptive Analysis
Ten sensory panel members were trained in three sessions during a preliminary study.
The panel was trained to recognize sensory characteristics of the dried fish and describe the
intensity of each attribute. An unstructured scale from 0 to 100% 23
was used with vocabulary
which defined sensory attribute for dried sardine as described in Table 1. Sample evaluations
were conducted according to international standards 24
. From each fish one piece, about 5 cm
long and 3 cm wide, was prepared by removing the head and tail. The pieces were placed in
plastic boxes coded randomly with three digit numbers that did not indicate treatment or storage
time before being served to the panel. Each panelist evaluated duplicates of samples in a random
order in two sessions. Data recording was done manually on a 10 cm line provided on a paper.
2.3 Statistical analysis
Statistical analysis was done using by Microsoft Excel 2010 and NCSS 2000 (NCSS,
Kaysville, UT). Analysis of variance (ANOVA) was carried out using Duncan’s multiple-
comparison test for stepwise comparison at the 95% significance level. Multivariate comparison
of different sensory attributes was performed with Principal Component Analysis (PCA) using
Panelcheck V 1.4.0 (Nofima, Tromsø, Norway).
3 Results and discussion
3.1 Temperature and relative humidity profile
Significantly higher temperature was recorded during open sun (27-35 °C) than indoor
(18-25 °C) drying (Figure 1). Whereas temperature varied based on weather conditions and time
of day in open sun drying, it increased as drying progressed in indoor drying. Relative humidity
10
varied between 72% and 50% during open sun drying and declined from 76% to 49% during
indoor drying. Relative humidity was inversely related to temperature in both drying experiments
as can be expected 3. When the warm-dry air moves over fish while drying, heat is transferred to
the fish and water on the surface layer evaporates. This creates moisture gradient between the air
and fish muscle as the temperature of fish increases causing moisture to diffuse from the inner
layers to the surface layer. In indoor drying, low temperature and high humidity at the beginning
of drying was used to prevent formation of hard surface layer (crust) due to imbalance in
diffusion resulting from higher external diffusion than internal diffusion. However as drying
progressed, the temperature was increased with a corresponding decrease in relative humidity to
continue the drying process as the fish were becoming drier. The low temperature (18-25 °C)
used during indoor drying has been shown to reduce nutrient degradation by minimizing lipid
oxidation and protein denaturation 25,26
. Unlike indoor drying, ambient temperature in the open
sun drying was lowest during hours of darkness (when samples were kept overnight) and highest
during the day. As discussed later this might have contributed to low quality of the open sun
dried products.
3.2 Drying rate and moisture ratio
Drying method and blanching, both affected drying rate and consequently the moisture
content (Figure 2). Drying rate was significantly (p < 0.05) higher during open sun drying than
indoor drying in the early stages of drying when moisture content was relatively high. This was
attributed to higher moisture evaporation and diffusivity owing to low humidity levels and high
temperatures exhibited at the start of drying under open sun conditions. Drying is controlled by
temperature, level of relative humidity and air velocity 1
. However, under the same drying trial,
blanched sardine obtained a high drying rate that was not significantly (p˃0.05) different from
unblanched counterpart at the start of dying. This could be because sardine used was small and
thin, implying the distance for internal diffusion was shorter resulting in the obtained
insignificant different between groups. On the other hand, higher drying rate in blanched than
unblanched may be attributed to denaturation and possibly hydrolysis of myofibrillar proteins
thereby affecting muscle water holding capacity. Although this finding is in agreement with an
earlier study on blanched and unblanched capelin during cold air drying, the difference in drying
rate between capelin groups was statistically significant 25
. Apart from size difference, the effect
11
of blanching on proteins between species may have differed as capelin is a temperate species
unlike sardine caught from tropical waters. Tropical fish species contain thermal stable proteins
than temperate species 26
because the tissue proteins increase in stability with increase in their
habitat temperature 27
. Also, low moisture content in the blanched groups at the start of drying
((2.8 Kg water/Kg db versus 3.1 Kg water/Kg db) could have contributed since drying rate has
been reported to depend not only on temperature, relative humidity and air speed but also the
moisture content 1. As expected the drying rate decreased gradually with reducing moisture
content but at different rates depending on the drying conditions. Water binding in the products
increases with drying and in the later drying stages water diffuses from the interior to reach the
surface 25
.
An increase in drying rate was observed during open sun drying when moisture content
was between 0.8 and 0.9, and between 0.5 and 0.7 Kg water/Kg db. The occurrences were
obtained at the beginning of each day (at 25 and 46 hours in Figure 1) after keeping samples
overnight (darkness hours). This might be due to internal diffusion in the night that allowed
water to exit to the surface (with no external diffusion), resulting to an increasing rate in the
drying process at the beginning of the following day. In general, the drying rate curves were
similar with no constant rate period and had only a falling rate period except at the beginning of
each day after keeping samples overnight under open sun drying conditions.
It took about 60 and 52 hours to dry sardine to stable moisture content under indoor and
open sun drying conditions respectively (data not shown). Generally, the moisture ratio (MR)
reduced with drying time (Figure 3). MR reduced at different rates depending on the drying
method. Whereas a systematic reduction in MR happened during indoor drying, it apparently
remained constant when samples were kept overnight (during darkness) during open sun drying.
This phenomenon as earlier explained could be related to arrest of the external diffusion during
hours of darkness (overnight storage) thereby upholding the moisture ratio. This indicates open
sun drying conditions could have resulted in a shorter drying time than the reported 52 hours had
it not been the overnight sample storage dictated by conditions. Dried sardine had moisture ratio
of about 0.1 at the end of drying under both trials, indicating the moisture loss was not
significantly different (p ˃ 0.05) between the groups.

12
3.3 Effective moisture diffusivity
The effective moisture diffusivity (Deff) values were not significantly (p ˃ 0.05) different
and ranged between 1.1×10⁻⁹
and 1.5×10⁻⁹
m2/s (Table 2). Deff was slightly higher in samples
during open sun drying (Bl-T and Co-T) than indoor drying (Bl-I and Co-I). This is in agreement
with drying rates result where, higher rates occurred during open sun drying. Blanching was
found to have insignificantly (p ˃ 0.05) influenced the drying rate and also Deff probably due to
the size of sardine as the fish used was small and thin. The Deff values reported in this study are
within the general range for food materials 10-11
to 10-9
m2/s
28.
3.4 Colour changes
Both blanching and drying methods had considerable impact on colour. After drying
lightness was not significantly (p>0.05) different between the groups although blanched sardine
had lower lightness (L*-value) than that of other groups (Figure 4 A). Whereas, yellowness (b
*-
value) was significantly (p < 0.05) higher in blanched than in unblanched groups (Figure 4 B).
During storage, lightness declined whereas, yellowness increased in all groups and was
statistically significant (p < 0.05) in blanched sardine that recorded higher increments towards
the end of storage. In dehydrated foods colour is among the most important quality attribute
regarding consumers purchase decision and also an effective quality indicator 25,29
. In dried fish,
yellowness is undesirable as it is related to lipid oxidation and long storage 29
. Shelf life of
blanched sardine is then limited.
3.5 Chemical composition
Lipid content of raw sardine was 3.0±0.08%. Generally, lipid content decreased after
blanching and brining but significantly (p < 0.05) after blanching to 2.4±0.13%, but was
2.9±0.20% after brining. The corresponding water content was 3.08 Kg water/Kg db
(75.5±0.50% wet basis (wb)) which did not differ from brined samples but reduced to 2.82 Kg
water/Kg db (73.8±0.62%, wb) after blanching. The results indicate there was lipid and water
loss during blanching and brining before drying onset. It can be understood that blanched sardine
lost lipid through exudation during blanching and/or with the drip water while cooling to remove
excess surface water. At the end of the drying process under both indoor and open sun
13
conditions, lipid content did not differ significantly (p > 0.05) between the groups, with values
ranging between 0.29 and 0.39 Kg water/Kg db (9.0±0.74% to 10.3±50% wb). This may be
explained by the extent of dryness in the fish, as blanched groups were drier at the end of drying
as reflected in the groups’ moisture ratio (Figure 3). The protein content in raw sardine was
13.52±0.94% while salt content was 0.65±0.04%. After blanching and brining in NaCl solution,
blanched and unblanched samples had protein content (14.33±0.62% and 13.53±0.55%,
respectively) and salt content (2.12±0.06% and 2.05±0.05%, repectively) that were not
significantly (p > 0.05) different.
3.6 Lipid oxidation
Lipid oxidation of the dried sardine was studied by measuring primary (PV) and
secondary (TBARS) oxidation products (Figure 5 A & B). Drying methods had a greater impact
on the PV than blanching. Significantly (p < 0.05) higher PV values were recorded in open sun
dried sardine compared to indoor dried sardine in both blanched and unblanched samples (170
vs. 100 µmolMDA/kg and 131 vs. 90 µmolMDA/kg, respectively). The PV values were also
higher in blanched than in unblanched dried sardine, with significant (p < 0.05) difference in
open sun dried sardine. Blanching and open sun drying increased the rate of lipid oxidation due
to higher temperature during blanching and open drying. High temperature speeds up the rate of
lipid oxidation. 30
Reported high temperature to have accelerated lipid oxidation during drying of
grass carp fillets.
During storage, PV increased during early storage but significantly (p < 0.05) during the
second month in open sun dried blanched (Bl-T) and third month of storage in other groups
(Figure 5 A). Later towards the end of storage, the PV decreased but at different times in the
groups except in indoor dried unblanched fish (Co-I) which showed increased PV values
throughout the storage. Open sun dried fish had higher rate of hydroperoxide (PV) accumulation
attaining peak values 292 µmolMDA/kg in blanched and 267 µmolMDA/kg in unblanched
samples earlier than their counterparts, implying that open sun dried sardine is more vulnerable
to lipid oxidation processes than indoor dried. Reduced PV content measured as the storage time
progressed is in agreement with 3 conclusion that rapid build-up of hydroperoxides occurs during
the initial oxidation process, however with extended storage time, the rate of hydroperoxides
14
cleavage and reactions exceed the rate of formation. This implies that at the end of the study,
indoor dried unblanched fish had not reached the level where hydroperoxides cleavage and
reactions exceeded formation.
After drying, TBARS were significantly (p < 0.05) different between the groups with
higher values in open sun dried fish (Figure 5 B). During storage, slow TBARS accumulation
was observed in all groups except open sun dried blanched fish (Bl-T) that showed an increase in
TBARS from the beginning of storage attaining significantly (p < 0.05) higher values in the third
and fourth month, and a decline at the end of storage period. The slow TBARS accumulation
recorded in other groups implied delayed formation especially in indoor dried fish that had lower
values. The faster accumulation in Bl-T and subsequent decrease at the end of storage time is an
indication of rapid decomposition of hydroperoxides into secondary oxidation products and
afterwards decomposition of the secondary products during the advancement of oxidation 31
.
Generally open sun drying and blanching treatment significantly (p < 0.05) accelerated lipid
oxidation during drying and storage.
3.7 Free fatty acids and fatty acid composition
After drying, the free fatty acid (FFA) content was different between the groups, but a
significantly (p < 0.05) higher FFA content was observed in unblanched sample compared to that
of blanched (Figure 6). This result indicates that higher hydrolysis of glycerol-fatty acid esters
occurred during drying of unblanched fish with the liberation of free fatty acids. Hydrolysis of
glycerol-fatty acid esters is known to be caused mainly by enzymatic activities 31
, which might
have been inhibited by blaching process 8. During storage, the FFA content increased
moderately in unblanched groups but remained apparently stable in the blanched groups. Unlike
other quality indicators, FFA results demonstrate the importance of blanching treatment in terms
of enzymatic activity inhibition.
The major fatty acids groups in sardine were saturated fatty acids (SFA), followed by
polyunsaturated fatty acids (PUFA) and monounsaturated fatty acids (MUFA) (Table 3).
Amongst the SFA, palmitic acid (C16:0) was predominant, with oleic acid (C18:1n9) and DHA
dominate in MUFA and PUFA respectively. During drying and storage, unsaturated fatty acids
declined, and there was a corresponding increase in SFA.
15
Fatty acid composition was influenced by drying methods, blanching treatment and
storage time. Significant (p < 0.05) difference was observed between indoor and open sun dried
sardine with respect to storage time. Open sun dried and blanched sardine exhibited faster
decline in unsaturated FA than indoor and the unblanched dried groups. The decline in
unsaturated FA upon drying and during storage was most rapid in the fatty acids with double
bonds suggesting the impact of oxidation was higher in PUFA. The PUFA had declined in value
by 19% and 31% in indoor dried unblanched and blanched sardine, 37% and 44% in open sun
dried unblanched and blanched sardine, at the end of storage from the 26.85 g PUFA/100 g lipid
in raw fish. DHA that constituted a high proportion of PUFA exhibited the biggest decline,
meaning that it oxidized more readily than other PUFA. Other PUFA including EPA had similar
trends but less pronounced. The higher decline in PUFA reported in blanched and open sun dried
fish is of concern given that PUFA, especially EPA and DHA, are beneficial to the health of
consumers 10
.
3.8 Sensory Evaluation
Figure 7 shows how sample groups of dried sardine were described by the sensory
attributes with storage time. Sample grouping were evident on each side of the PC1-axis, with
samples located on the left side of scores plot in early storage and on right side in later storage
time indicating they were easily distinguished. The sensory attributes of dried fish (flavour and
odour, and texture: dry and sticky) detected at the beginning of storage on the left side of
loadings plot along the 1st principal component (PC1) characterised newly dried fish. The
sensory attributes colour muscle, flavour and odour rancidity were more predominant after
extended storage.
Samples varied mainly with regard to differences in flavour, odour and colour attributes
along the PC1 explaining 66% of the variation between them. The main difference occurred with
the storage time as well as blanching treatment, as the sample groups are located to the left side
at the beginning of storage dominated by unblanched groups but on the right side after extended
storage dominated by blanched groups. This indicates that unblanched groups were more
characterized by the desired attributes and appeared to keep the characteristics longer. Dried
sardine varied also with regard to differences in texture mainly sticky attribute along the 2nd
16
principal component (PC2), explaining 14% of the variation between the samples. Rancid odour
and flavour did not significantly contribute to the differences in the sample groups during
storage. This can be explained by slow accumulation of TBARS in the study. TBARS have been
reported to have a profound impact on food sensory properties 32,33
.
4 Conclusions
Blanching had influence on sardine drying rate and also slowed down free fatty acids
progression during drying and products storage. However, it adversely affected the products
quality mainly lipid composition (oxidation), colour and sensory properties. In ideal situation,
blanching of sardine before drying is done for longer time than the blanching described in this
paper and more research is needed to optimize the process for quality reasons. Although a
relatively higher drying rate was obtained during open sun drying, indoor drying produced a
quality stable product with desired moisture content, lipid composition and sensory properties.
This has reinforced the need for development of a controlled drying system that utilizes the
affordable available energy sources such as solar and geothermal energy for commercial sardine
drying.
17
Acknowledgment
The authors gratefully acknowledge the United Nations University- Fisheries Training
Programme (Iceland) for financial support. The Director Vestfirska Hardfisksalan and Matis
(Icelandic Food and Biotech R&D) chemical laboratory staff are acknowledged.
Reference
1. Bellagha, S.; Sahli, A.; Farhat, A.; Kechaou. N.; Glenza, A. Studies on salting and drying
of sardine (Sardinella aurita): Experimental kinetics and modeling. Journal of Food
Engineering 2007, 78(3), 947–52.
2. Akintola, SL.; Brown, A.; Bakare, A.; Osowo, OD.; Omolola, B. Effects of Hot Smoking
and Sun Drying Processes on Nutritional Composition of Giant Tiger Shrimp (Penaeus
monodon, Fabricius, 1798). Polish Journal of Food and Nutrition Science. 2013, 63(4),
227–37.
3. Oduor-Odote, P.; Shitanda, D.; Obiero, M.; Kituu, G. Drying characteristics and some
quality attributes of Rastrineobola argentia (Omena) and Stolephorus delicatulus
(Kimarawali). African Journal of Food, Agriculture, Nutrition and Development 2010,
10(8), 2998–3014.
4. Shanmugam, V.; Natarajan, E. Experimental investigation of forced convection and
desiccant integrated solar dryer. Renewable Energy 2006, 31(8), 1239–1251.
5. African Development Bank. Kenya Country Strategy Paper 2014-2018. Nairobi, Kenya
2011. p. 1–22.
6. Arason, S. The drying of fish and utilization of Geothermal Energy - The Icelandic
experience. Reykjavik, Iceland: Icelandic Fisheries Laboratory and The University of
Iceland 2003.
7. Kwambai, K. Steam availability and development plans at Olkaria. Kenya Geothermal
Conference. Nairobi, Kenya 2011.
8. Omodara, MA.; Olaniyan, AM. Effects of Pre-Treatments and Drying Temperatures on
Drying Rate and Quality of African Catfish ( Clarias gariepinus ). Journal of Biology,
Agriculture and Healthcare 2012, 2(4), 1–11.
9. Doe, PE. Fish drying. In: Bremner HA, editor. Safety and quality issues in fish processing.
Woodhead publishing limited; Cambridge England; 2002.
18
10. Karlsdottir, MG.; Sveinsdottir, K.; Kristinsson, HG.; Villot, D.; Craft, BD.; Arason, S.
Effect of thermal treatment and frozen storage on lipid decomposition of light and dark
muscles of saithe (Pollachius virens). Food Chemistry 2014, 164, 476–484.
11. Shekofteh, M.; Shekofteh, H.; Hojati, MR. Estimation Equilibrium Moisture Content in
Agriculture Product Using Neural Network Method. International Research Journal of
Applied and Basic Sciences 2012, 3(11), 2215–2225.
12. Shi, QL.; Xue, CH.; Zhao, Y.; Li, ZJ.; Wang, XY. Drying characteristics of horse
mackerel (Trachurus japonicus) dried in a heat pump dehumidifier. Journal of Food
Engineering 2008, 84(1), 12–20.
13. Kilic, A. Low temperature and high velocity (LTHV) application in drying:
Characteristics and effects on the fish quality. Journal of Food Engineering 2009, 91(1),
173–82.
14. Al-Harahsheh, M.; Al-Muhtaseb, A.; Magee, TR. Microwave drying kinetics of tomato
pomace: effect of osmotic dehydration. Chemical Engineering Process 2009, 48, 524–531.
15. Bligh, EG.; Dyer, WS. A rapid method of total lipid extraction and purification. Canadian
Journal of Biochemistry and Physiology 1959, 37, 911–7.
16. ISO. Food safety management systems - Requirements for any organization in the food
chain, Standard Nr 22000, Geneva; 2005.
17. AOAC. Fat (total, saturated, and unsaturated) in foods: Method 996 06. In: Davi E, editor.
Official methods of analysis of AOAC international. 17th ed. Gaithersburg, MD: AOAC
International; 2000.
18. ISO. Determination of moisture and other volatile matter content (6496). Geneva,
Switzerland: The international Organization for Standards; 1993.
19. Santha, NC.; Decker, EA. Rapid, sensitive, iron-based spectrophotometric methods for
determination of peroxide values of food lipids. Association of Official Analytical
Chemists International 1994, 77, 421–424.
20. Lemon, DW. An improved TBA test for rancidity. New series circular. Halifax, Nova
Scotia: Fisheries and Marine Services Canada 1975
21. Bernardez, M.; Pastoriza, L.; Sampedro, G.; Herrera, JJR.; Cabo, ML. Modified method
for the analysis of free fatty acids in fish. Journal of Agricultural and Food Chemistry
2005, 53, 1903–1906.
22. AOAC. “Official method Ce 1b-89.” Official methods and recommended practises of the
American oil chemists’ society. Firestone, D. Champaign, IL, American Oil Chemists’
Society; 1998.
19
23. Stone, H.; Sidel, JL. Sensory Evaluation Practices. Florida. Orlanda, FL: Academic Press
Inc. 1985.
24. ISO 8586–1. Sensory analysis-general guidance for the selection, training and monitoring
of assessors. Geneva, Switzerland: The International Organisation for Standardization;
1993.
25. Cyprian, O.; Nguyen, VM.; Sveinsdottir, K.; Jonsson, A.; Thorkelsson, G.; Arason, S.
Influence of lipid content and blanching on capelin (Mallotus villosus) drying rate and
lipid oxidation under low temperature drying. Food Process Engineering 2015, In press:
doi:10.1111/jfpe.12215.
26. Poulter, RG.; Ledward, DA.; Godber, S.; Hall, G.; Rowlands, B. Heat stability of fish
muscle proteins. Journal of Food Technology 1985, 20, 203–217.
27. Meneshi, S.; Harwood, R.; Grant, ME. Native collagen is not a substrate for collagen
glucosyl trasferase of platelets. Nature (London) 1976, 246(5587), 670–672.
28. Darvishi, H.; Azadbakht, M.; Rezaeiasl, A.; Farhang, A. Drying characteristics of sardine
fish dried with microwave heating. Journal of the Saudi Society of Agricultural Sciences
2013, 12(2), 121–127.
29. Driscoll, RH, Madamba PS. Modeling the browning kinetics of garlic. Food Australia
1994, 46, 66–71.
30. Wu, T.; Mao, L. Influences of hot air drying and microwave drying on nutritional and
odorous properties of grass carp (Ctenopharyngodon idellus ) fillets. Food Chemistry
2008, 110, 647–653.
31. Chotimarkorn, C.; Silalai, N.; Chaitanawisuit, N. Changes and Deterioration of Lipid in
Farmed Spotted Babylon Snail (Babylonia areolat a) Muscle during Iced Storage. Food
Science and Technology International 2010, 15(5), 427–433.
32. Cyprian, O.; Nguyen, VM.; Sveinsdottir, K.; Jonsson, A.; Tomasson, T.; Thorkelsson, G.;
Arason, S. Influence of smoking and packaging methods on lipid stability and microbial
quality of Capelin (Mallotus villosus) and Sardine (Sardinella gibossa). Food Science &
Nutrition 2015, In press, doi:10.1002/fsn3.233
33. Stapelfeldt, AK.; Nielsen, RB.; Skibsted, HL. Effect of Heat Treatment, Water Activity
andStorage Temperature on the Oxidative Stability ofWhole Milk Powder. International
Dairy Journal 1997, 7, 331–339.
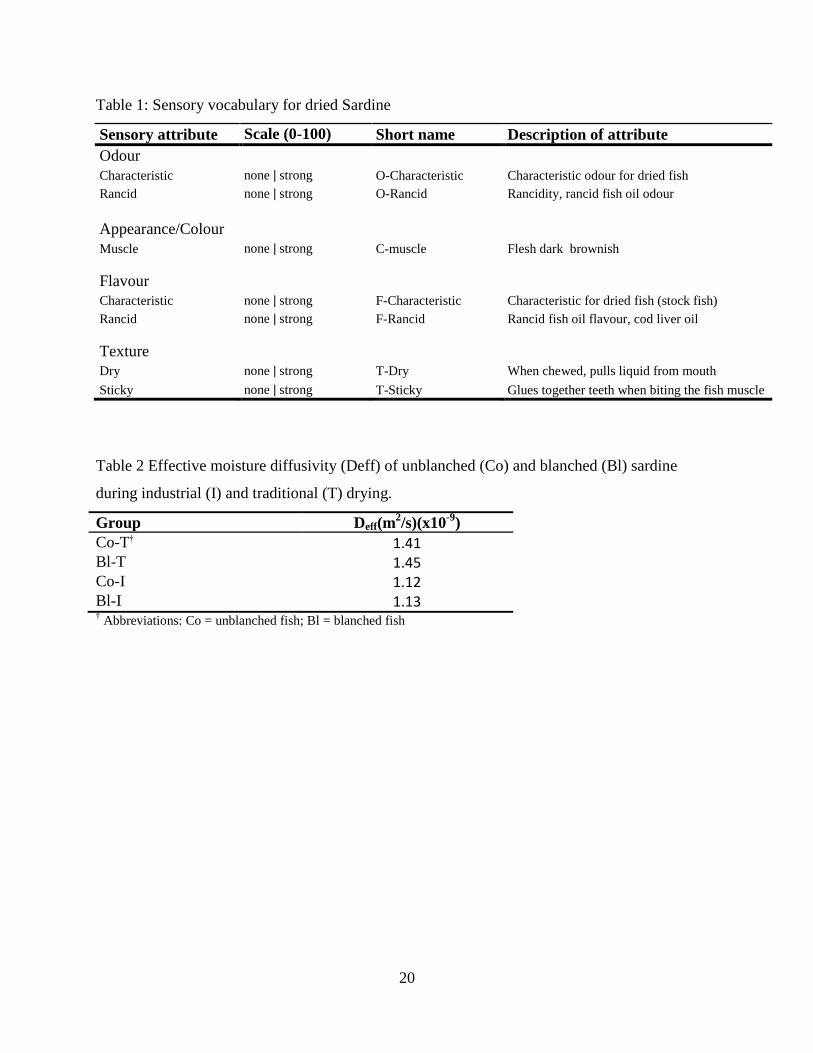
20
Table 1: Sensory vocabulary for dried Sardine
Sensory attribute Scale (0-100) Short name Description of attribute
Odour
Characteristic none ǀ strong O-Characteristic Characteristic odour for dried fish
Rancid none ǀ strong O-Rancid Rancidity, rancid fish oil odour
Appearance/Colour
Muscle none ǀ strong C-muscle Flesh dark brownish
Flavour
Characteristic none ǀ strong F-Characteristic Characteristic for dried fish (stock fish)
Rancid none ǀ strong F-Rancid Rancid fish oil flavour, cod liver oil
Texture
Dry none ǀ strong T-Dry When chewed, pulls liquid from mouth
Sticky none ǀ strong T-Sticky Glues together teeth when biting the fish muscle
Table 2 Effective moisture diffusivity (Deff) of unblanched (Co) and blanched (Bl) sardine
during industrial (I) and traditional (T) drying.
Group Deff(m2/s)(x10
-9)
Co-T† 1.41 Bl-T 1.45 Co-I 1.12 Bl-I 1.13 † Abbreviations: Co = unblanched fish; Bl = blanched fish
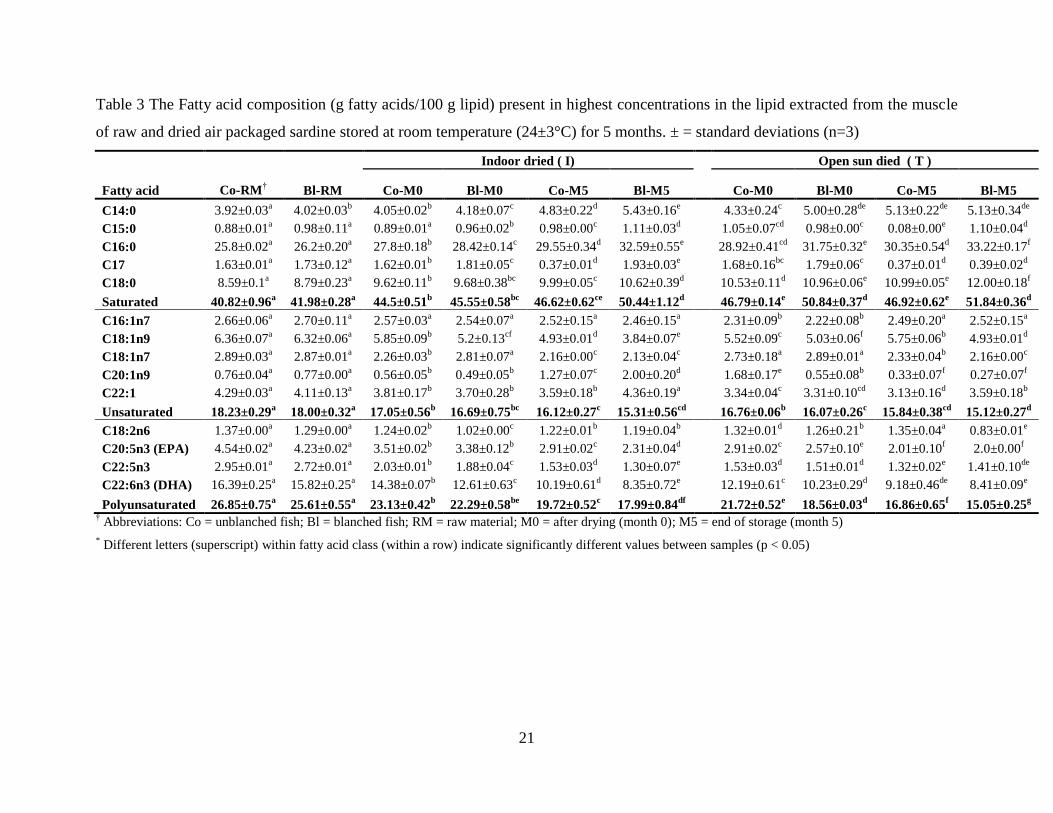
21
Table 3 The Fatty acid composition (g fatty acids/100 g lipid) present in highest concentrations in the lipid extracted from the muscle
of raw and dried air packaged sardine stored at room temperature (24±3°C) for 5 months. ± = standard deviations (n=3)
Fatty acid Co-RM† Bl-RM
Indoor dried ( I)
Open sun died ( T )
Co-M0 Bl-M0 Co-M5 Bl-M5 Co-M0 Bl-M0 Co-M5 Bl-M5
C14:0 3.92±0.03a 4.02±0.03
b 4.05±0.02
b 4.18±0.07
c 4.83±0.22
d 5.43±0.16
e
4.33±0.24c 5.00±0.28
de 5.13±0.22
de 5.13±0.34
de
C15:0 0.88±0.01a 0.98±0.11
a 0.89±0.01
a 0.96±0.02
b 0.98±0.00
c 1.11±0.03
d
1.05±0.07cd
0.98±0.00c 0.08±0.00
e 1.10±0.04
d
C16:0 25.8±0.02a 26.2±0.20
a 27.8±0.18
b 28.42±0.14
c 29.55±0.34
d 32.59±0.55
e
28.92±0.41cd
31.75±0.32e 30.35±0.54
d 33.22±0.17
f
C17 1.63±0.01a 1.73±0.12
a 1.62±0.01
b 1.81±0.05
c 0.37±0.01
d 1.93±0.03
e
1.68±0.16bc
1.79±0.06c 0.37±0.01
d 0.39±0.02
d
C18:0 8.59±0.1a 8.79±0.23
a 9.62±0.11
b 9.68±0.38
bc 9.99±0.05
c 10.62±0.39
d
10.53±0.11d 10.96±0.06
e 10.99±0.05
e 12.00±0.18
f
Saturated 40.82±0.96a 41.98±0.28
a 44.5±0.51
b 45.55±0.58
bc 46.62±0.62
ce 50.44±1.12
d 46.79±0.14
e 50.84±0.37
d 46.92±0.62
e 51.84±0.36
d
C16:1n7 2.66±0.06a 2.70±0.11
a 2.57±0.03
a 2.54±0.07
a 2.52±0.15
a 2.46±0.15
a
2.31±0.09b 2.22±0.08
b 2.49±0.20
a 2.52±0.15
a
C18:1n9 6.36±0.07a 6.32±0.06
a 5.85±0.09
b 5.2±0.13
cf 4.93±0.01
d 3.84±0.07
e
5.52±0.09c 5.03±0.06
f 5.75±0.06
b 4.93±0.01
d
C18:1n7 2.89±0.03a 2.87±0.01
a 2.26±0.03
b 2.81±0.07
a 2.16±0.00
c 2.13±0.04
c
2.73±0.18a 2.89±0.01
a 2.33±0.04
b 2.16±0.00
c
C20:1n9 0.76±0.04a 0.77±0.00
a 0.56±0.05
b 0.49±0.05
b 1.27±0.07
c 2.00±0.20
d
1.68±0.17e 0.55±0.08
b 0.33±0.07
f 0.27±0.07
f
C22:1 4.29±0.03a 4.11±0.13
a 3.81±0.17
b 3.70±0.28
b 3.59±0.18
b 4.36±0.19
a
3.34±0.04c 3.31±0.10
cd 3.13±0.16
d 3.59±0.18
b
Unsaturated 18.23±0.29a 18.00±0.32
a 17.05±0.56
b 16.69±0.75
bc 16.12±0.27
c 15.31±0.56
cd 16.76±0.06
b 16.07±0.26
c 15.84±0.38
cd 15.12±0.27
d
C18:2n6 1.37±0.00a 1.29±0.00
a 1.24±0.02
b 1.02±0.00
c 1.22±0.01
b 1.19±0.04
b
1.32±0.01d 1.26±0.21
b 1.35±0.04
a 0.83±0.01
e
C20:5n3 (EPA) 4.54±0.02a 4.23±0.02
a 3.51±0.02
b 3.38±0.12
b 2.91±0.02
c 2.31±0.04
d
2.91±0.02c 2.57±0.10
e 2.01±0.10
f 2.0±0.00
f
C22:5n3 2.95±0.01a 2.72±0.01
a 2.03±0.01
b 1.88±0.04
c 1.53±0.03
d 1.30±0.07
e
1.53±0.03d 1.51±0.01
d 1.32±0.02
e 1.41±0.10
de
C22:6n3 (DHA) 16.39±0.25a 15.82±0.25
a 14.38±0.07
b 12.61±0.63
c 10.19±0.61
d 8.35±0.72
e
12.19±0.61c 10.23±0.29
d 9.18±0.46
de 8.41±0.09
e
Polyunsaturated 26.85±0.75a 25.61±0.55
a 23.13±0.42
b 22.29±0.58
be 19.72±0.52
c 17.99±0.84
df 21.72±0.52
e 18.56±0.03
d 16.86±0.65
f 15.05±0.25
g
† Abbreviations: Co = unblanched fish; Bl = blanched fish; RM = raw material; M0 = after drying (month 0); M5 = end of storage (month 5)
* Different letters (superscript) within fatty acid class (within a row) indicate significantly different values between samples (p < 0.05)
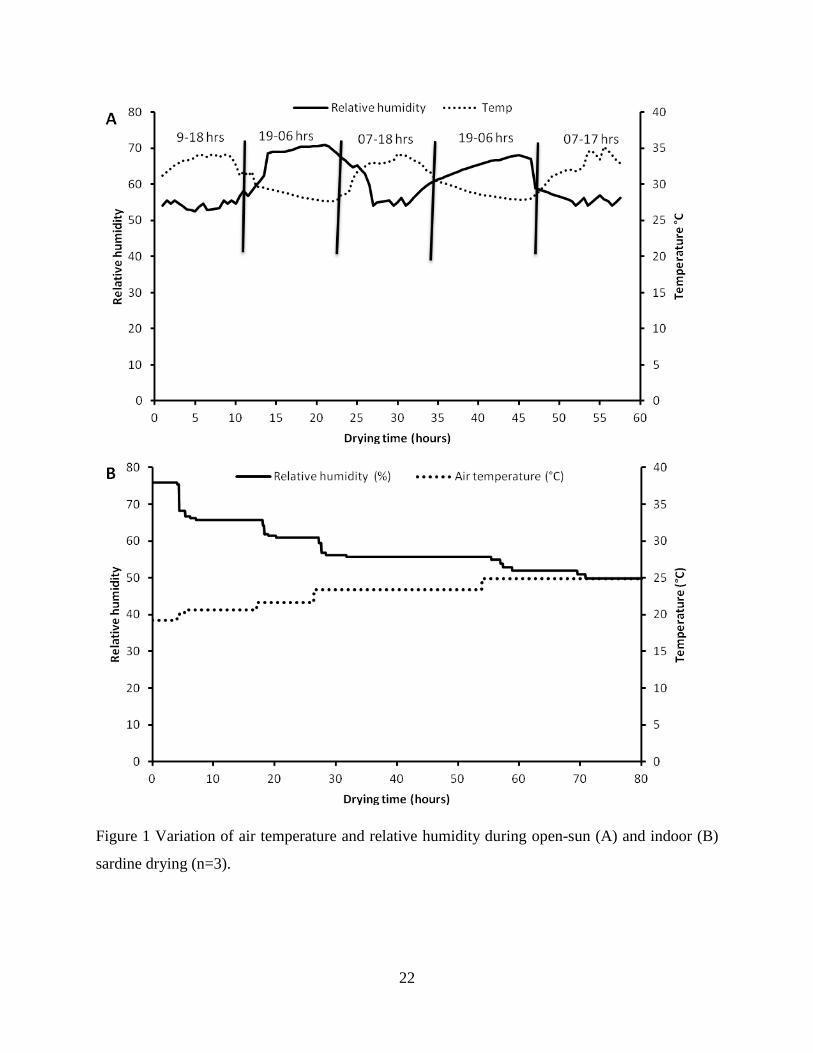
22
Figure 1 Variation of air temperature and relative humidity during open-sun (A) and indoor (B)
sardine drying (n=3).
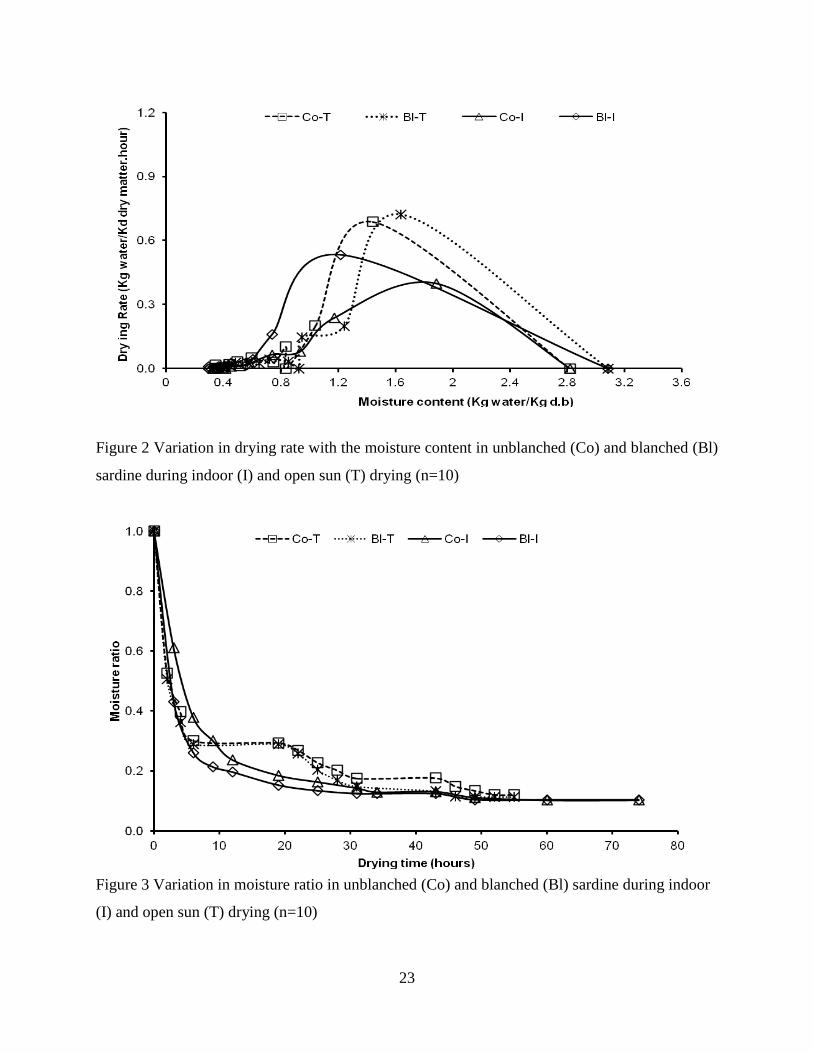
23
Figure 2 Variation in drying rate with the moisture content in unblanched (Co) and blanched (Bl)
sardine during indoor (I) and open sun (T) drying (n=10)
Figure 3 Variation in moisture ratio in unblanched (Co) and blanched (Bl) sardine during indoor
(I) and open sun (T) drying (n=10)
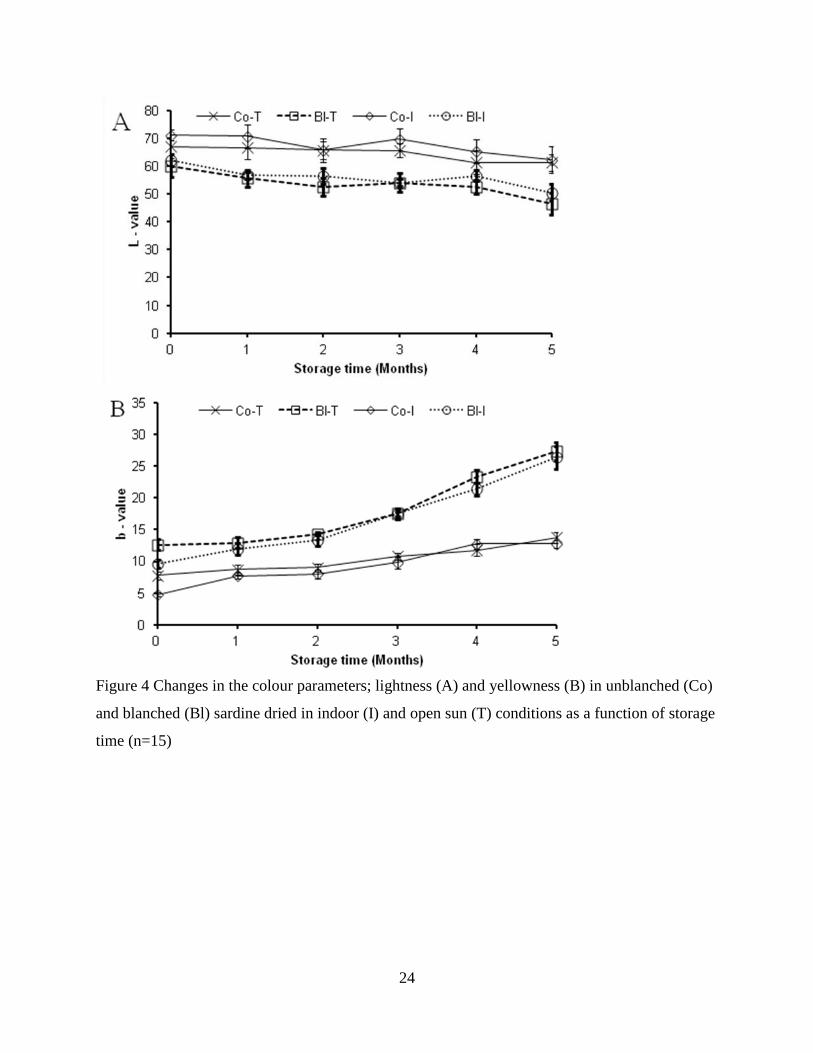
24
Figure 4 Changes in the colour parameters; lightness (A) and yellowness (B) in unblanched (Co)
and blanched (Bl) sardine dried in indoor (I) and open sun (T) conditions as a function of storage
time (n=15)

25
Figure 5 Lipid hydroperoxides (PV) formation (A) and Thiobarbituric acid reactive substances
(TBARS) formation (B) in unblanched (Co) and blanched (Bl) sardine dried under indoor (I) and
open sun (T) conditions as a function of storage time (n=3)
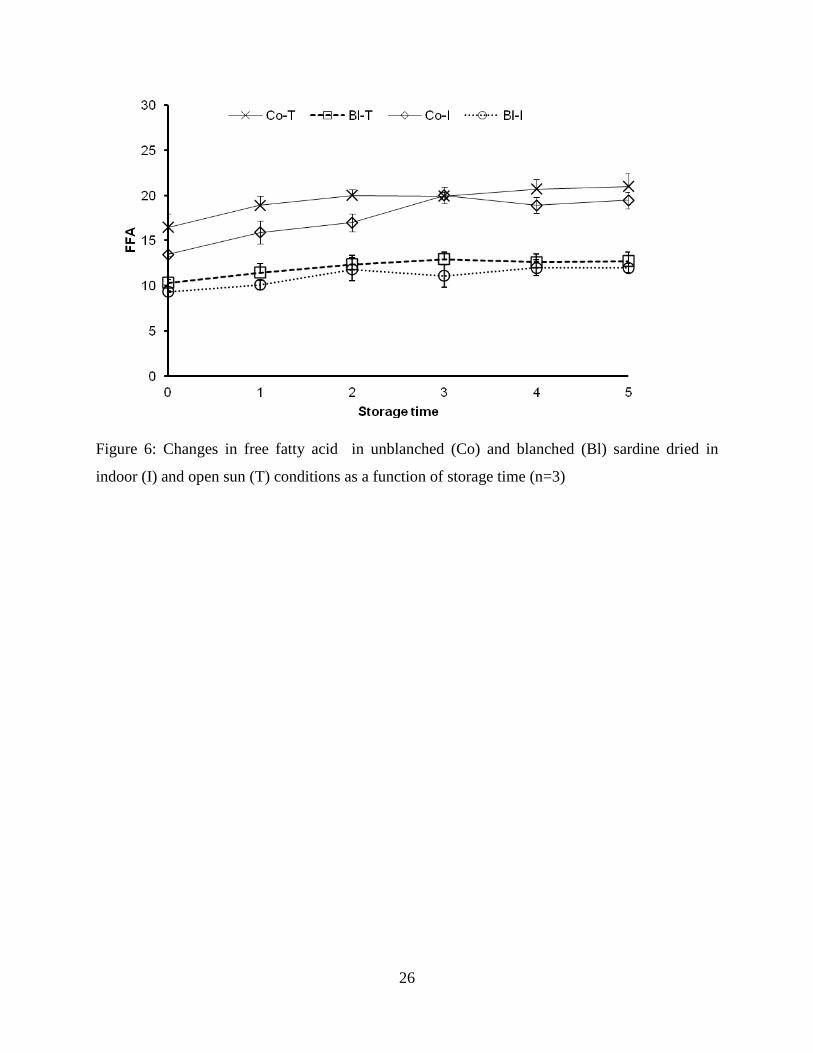
26
Figure 6: Changes in free fatty acid in unblanched (Co) and blanched (Bl) sardine dried in
indoor (I) and open sun (T) conditions as a function of storage time (n=3)

27
Figure 7 PCA: (A) Scores and (B) correlation loadings describing sensory quality of the dried
sardine as evaluated by a trained sensory panel. PC 1 (66.4%) vs. PC 2 (13.6%). M = month of
storage; Co = unblanched group; Bl = blanched group; I = indoor dried; T = open sun dried; O =
odour; F = flavour; T = texture; C = colour
A
B

PAPER II
Influence of lipid content and blanching on capelin (Mallotus villosus) drying rate and lipid
oxidation under low temperature drying
Cyprian, O., Nguyen, M. V., Sveinsdottir, K., Johnsson, A., Thorkelsson, G., Arason, S.
Journal of Food Process Engineering ** (2015) **, doi:10.1111/jfpe.12215
Reprinted with permission from Wiley Periodicals, Inc.
II
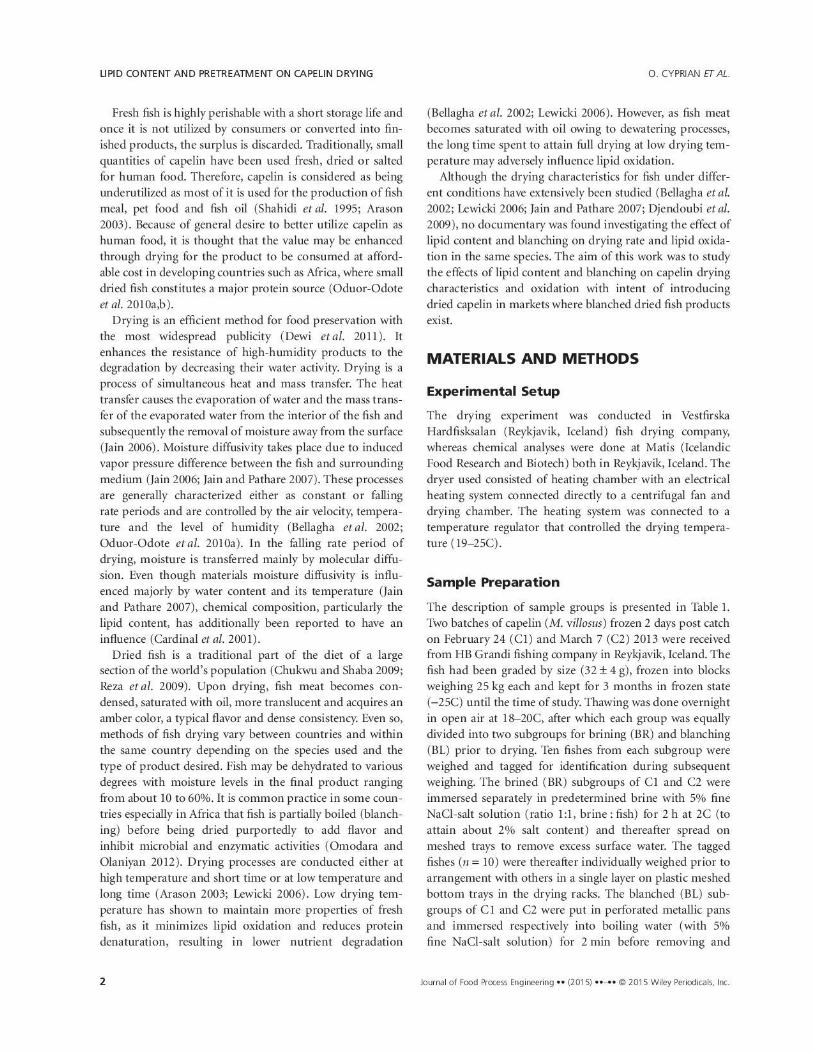
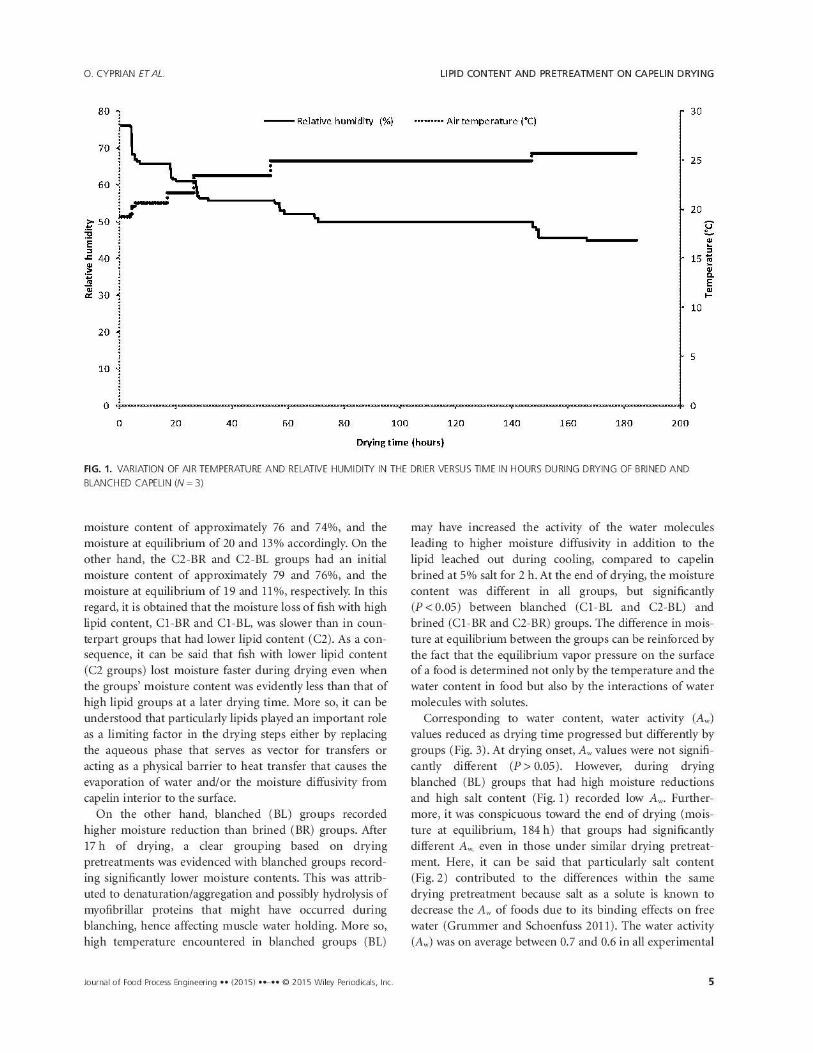
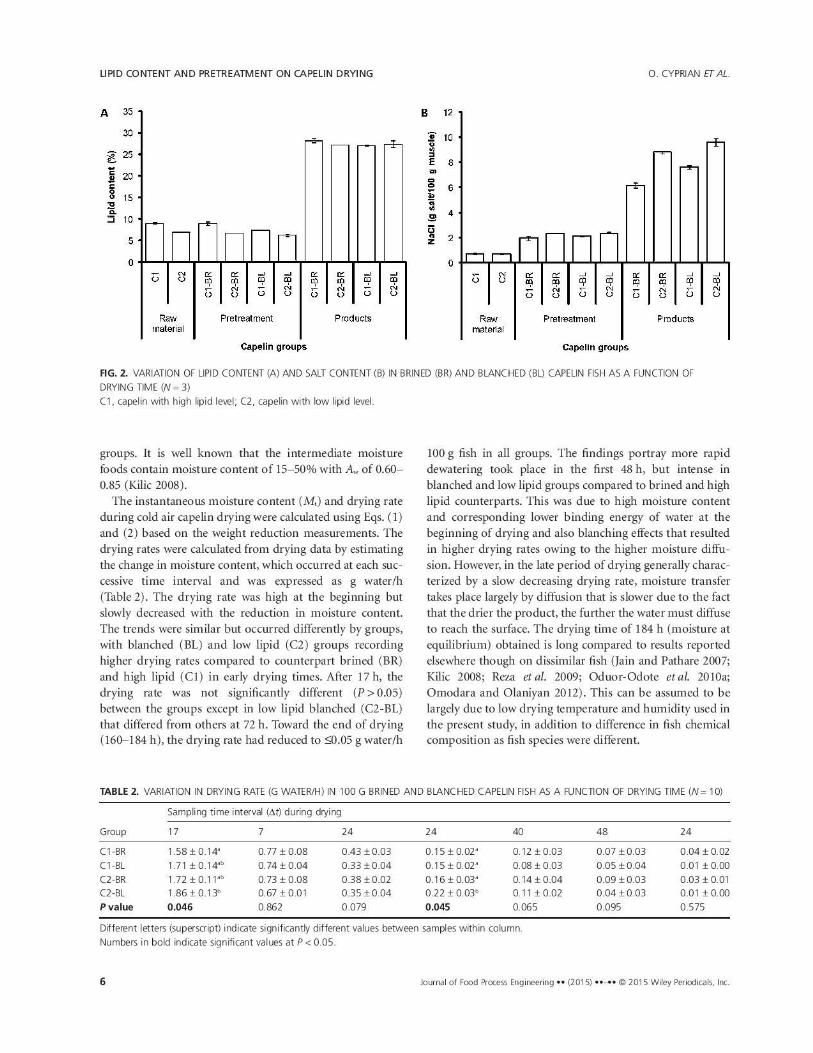

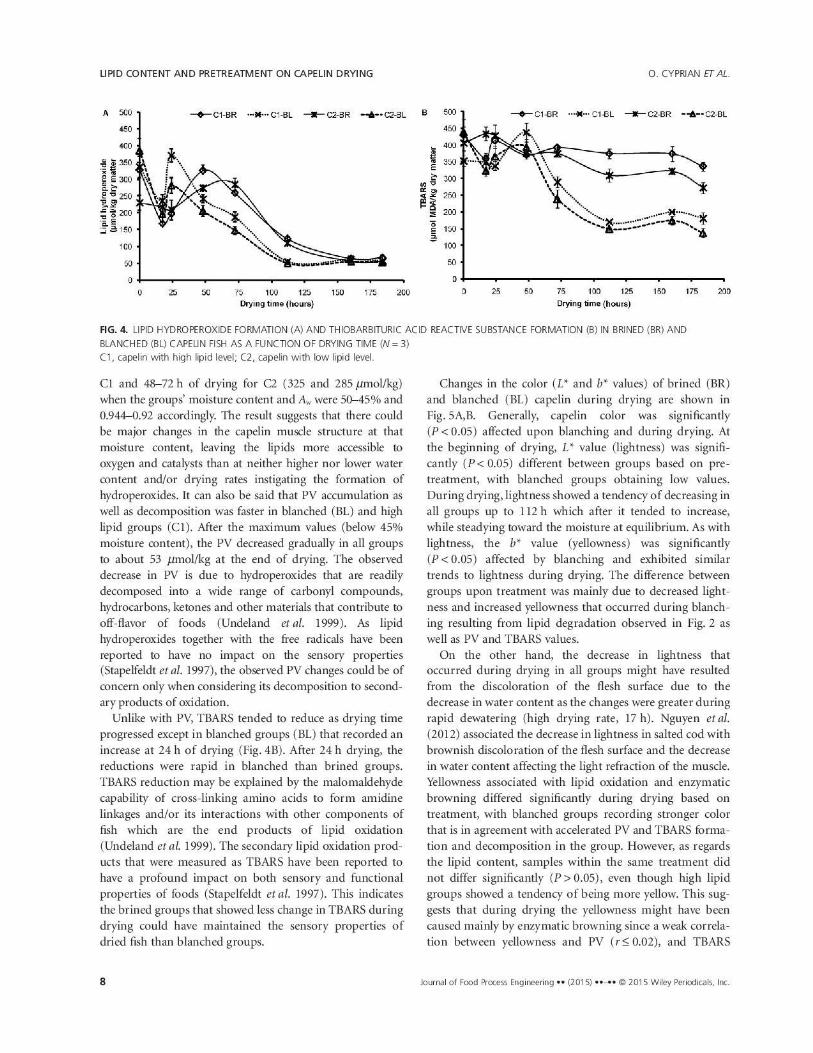
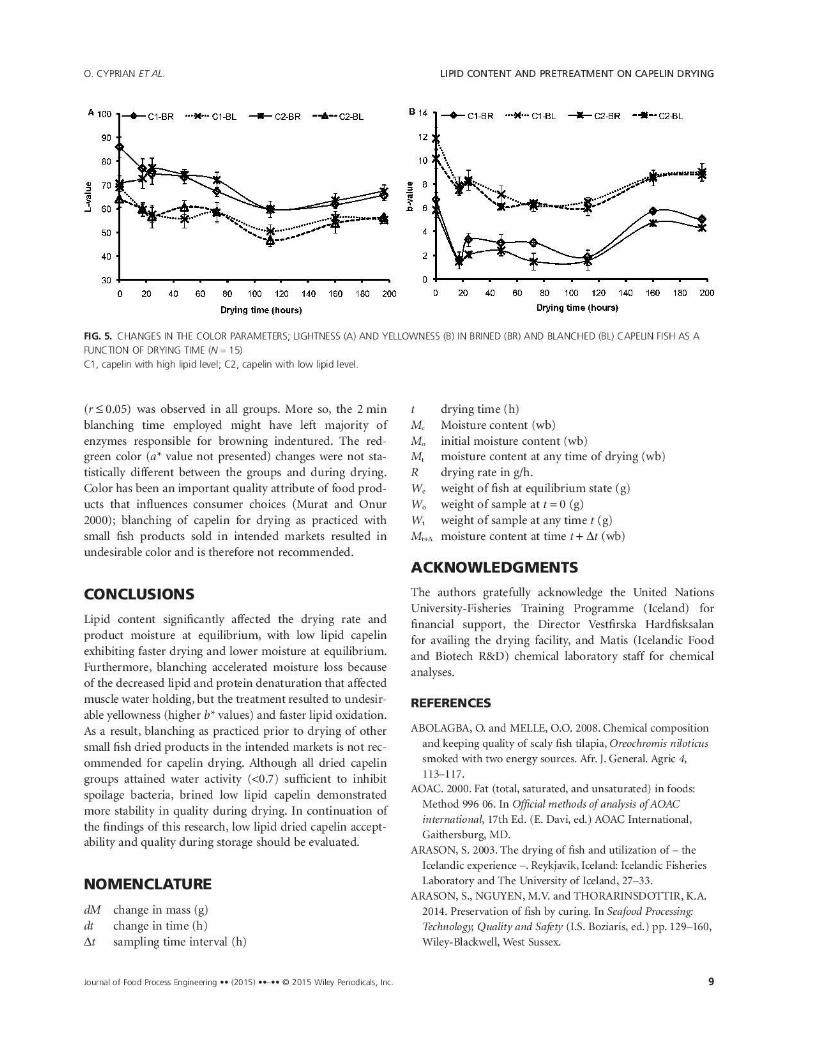

1
PAPER III
Conformational changes in Capelin (Mallotus villosus) proteins during smoking and drying
Cyprian, O. O., Nguyen, M. V., Sveinsdottir, K., Tomasson, T., Thorkelsson, G., Arason, S.
Food Chemistry
Under review
III
2
Conformational changes in Capelin (Mallotus villosus) proteins during smoking and drying
Odoli Ogombe Cypriana,e,*
, Minh Van Nguyenb, Tumi Tomasson
c, Gudjon Thorkelsson
a,d,
Sigurjon Arasona,d
aUniversity of Iceland, Department of Food Science, Vinlandsleid 12, IS-113 Reykjavik, Iceland
bFaculty of Food Technology, Nha Trang University, 02 Nguyen Dinh Chieu, Nha Trang,
Vietnam
cUnited Nations University Fisheries Training Programme, Skulagata 4, IS-121 Reykjavik,
Iceland
dMatis ohf. /Icelandic Food and Biotech R&D, Vinlandsleid 12, IS-113 Reykjavik, Iceland
eKenya Marine & Fisheries Research Institute, P.O Box 81651, 80100 Mombasa, Kenya
Corresponding author. Tel. +3548627565; Fax +3544225001
E-mail address: [email protected]
3
Abstract
Effects of lipid content and blanching in brine and brining on conformational changes in capelin
proteins during drying and smoking were studied. Changes in salt soluble proteins (SSP),
sulfhydryl groups (SH) content and disulfide bonds (S-S) were monitored in soluble protein
fractions. Salt and water content was also measured. Significant (p<0.05) changes in protein
conformation occurred during blanching and early drying when water content and dehydration
rates were relatively high. SSP and total SH content were reduced while available SH and
disulfide content increased. These changes can be explained by protein denaturation and
aggregation due to high temperature and dehydration. Protein denaturation resulted in reduced
protein solubility thereby compromising nutritional value due to loss of thermolabile compounds
and yield during hot smoking. Protein aggregates that were highest in blanched dried fish might
have reduced dried fish eating quality. Higher lipid content had a protective effect on protein
changes.
Key words: Capelin, heating, drying, protein conformation
4
1 Introduction
Drying and smoking are widely used to preserve fish in developing countries (Akintola,
Brown, Bakare, Osowo, & Omolola, 2013; Darvishi, Azadbakht, Rezaeiasl, & Farhang, 2013;
Bellagha, Sahli, Farhat, Kechaou, & Glenza, 2007). Small fish species are mostly consumed
dried (Oduor-odote, Shitanda, Obiero, & Kituu, 2010; Darvishi et al., 2013). Dried fish is also
used in the production of weaning foods for children (IOC, 2012). In some countries fish is
partially boiled in brine before drying. Blanching of fish results in the denaturation of proteins
and speeds up the drying process (Cyprian et al., 2015a), but it also influences flavor and inhibits
microbial and enzymatic activity (Omodara & Olaniyan, 2012).
Capelin (Mallotus villosus) a small arctic fish, supports one of the most important pelagic
fisheries in Iceland with annual catches exceeding half a million tons in recent years (Statistics
Iceland, 2015). About 80% of the catch is reduced to fish meal and fish oil (Statistics Iceland,
2015). The proportion of capelin used for human consumption could be increased by drying and
smoking, and marketing in countries where such fish products are traditionally consumed
(Cyprian et al., 2015a; Cyprian et al., 2015b).
Fish constitutes an important source of high quality and nutritious protein. Fish proteins
have also been identified as a rich source of bioactive peptides that differ in size, composition
and sequence of amino acids, whose quality depend on stability (Ren et al., 2008). Fish proteins
are less stable than those derived from mammals (Baylan et al., 2015; Poulter Ledward, Godber,
Hall, & Rowlands, 1985) and processing methods can affect their denaturation and aggregation,
particularly if it involves heating (Ghelichpour & Shabanpour, 2011). Fish protein denaturing
temperature mainly depends on the species, but also on water content as protein stability
increases at low water content (Rustad & Nesse, 1983). Tropical fish species contain proteins
that are thermally more stable than proteins of temperate species (Poulter et al., 1985) (Meneshi
Harwood, & Grant, 1976). Murueta, Toro, & Carreño (2007) reported about 90% of tropical fish
proteins to be denatured at temperatures between 60-65°C.
Protein denaturation and aggregation is associated with conformational changes and the
formation of disulfide bonds. These include changes in the reactive groups, mainly loss of
hydrophilic surface, exposure of hydrophobic areas and sulfhydryl groups that are buried or

5
blocked in native proteins (Nguyen, Thorarinsdottir, Gudmundsdottir, Thorkelsson, & Arason,
2011; Baylan et al., 2015; Raman & Mathew, 2014). Secondary and tertiary structures of
proteins can be lost during heating due to the split in hydrogen bonds, resulting in unfolding of
native conformation (Baylan et al., 2015; Raman & Mathew, 2014). The conformation of
proteins plays an important role in defining their functional properties (Ghelichpour &
Shabanpour, 2011). Therefore, changes in protein conformation can lead to the loss of some of
their physical and chemical properties (Skipnes, Plancken, Loey, & Hendrick, 2008; Rustad &
Nesse, 1983), affecting nutritional value (for instance loss of amino acids) and water holding
capacity that results in a change in texture of the product (Raman & Mathew, 2014).
The effect of partial boiling (blanching) and lipid content on proteins during drying and
smoking is poorly understood. Moreover, dried and smoked small pelagic species traded in
developing countries are unlike capelin, commonly warm water species. The effect of blanching,
drying and smoking on the fish eating quality specifically texture, nutritional value and yield that
are affected by changes in proteins might be greater in capelin than warm water species. The
objective of this study was to evaluate the effects of brining and blanching in brine on changes in
the capelin proteins during drying and smoking and how the changes are affected by variation in
lipid content. Conformational changes in proteins were evaluated through measuring of salt
soluble proteins (SSP), sulfhydryl (SH) groups and disulfide bonds (S-S) during drying and
smoking. Knowledge of the influence of blanching in brine and brining and lipid content on
changes protein would be useful in determining appropriate pre-treatment and lipid level for
preserving thermolabile compounds while maintaining yield and eating quality during smoking
and eating quality of dried fish.
2 Materials and methods
2.1 Raw material, processing and sampling
Two batches of 32± 4g capelin (Mallotus villosus) were obtained from HB Grandi fishing
company, Reykjavik, Iceland. Fish were caught on 13th
February and 7th
March, 2013 and kept in
chilled seawater for two days prior to grading and freezing in 25 kg blocks. The blocks were kept
frozen for three months at -25°C until the time of study. At that time, fish were thawed overnight
in open air at 18-20°C, after which each batch was divided into four equal portions. Two of the
6
portions were pre-treated either by brining or blanching in brine before drying. The other two
portions were both brined and either cold or hot smoked. Portions for brining were immersed
separately in 5% NaCl-salt solution for 2 hours at 2°C to attain about 2% salt content in the fish
muscle and thereafter arranged in a single layer on meshed trays to drip dry. The trays were then
stacked on drying and smoking racks. Portions to be blanched were put in perforated metallic
pans and immersed in boiling 5% fine NaCl-salt solution for 2 minutes before removing and
spreading on meshed trays to cool and drip dry.
Drying was done in a tunnel drier under controlled temperature (22±2°C), relative
humidity (40±5%) and air speed (3±0.5 m/s) at Vestfirska Hardfisksalan fish drying company in
Reykjavik, Iceland. Sixteen capelin pieces (8 pooled together, in 2 bags) per group were taken
each time during drying (0, 17, 24, 48, 72, 112, 160 & 184 hours). Smoking was done in a
conventional smoking kiln equipped with an automatic control for temperature, humidity and
density of wood smoke. Sixteen capelin pieces (8 pooled together, in 2 bags) per group were
taken at refreshing time after the second cycle (55-60 minutes) in the first and second stages, and
at the end of the third stage during hot smoking (0, 1, 2, 3, 4 & 4.5 hours) as describe by Cyprian
et al. (2015b). During cold smoking, samples were taken at refreshing time after the second,
fourth and sixth cycles, and at the end of smoking (0, 1, 2, 3 & 4 hours). Samples were packed in
polyethylene bags, frozen and stored at -80 °C until analysed.
2.2 Water, salt and lipid content
Water content of raw materials and products was determined as the difference in weight of
minced samples before and after drying for 4 hours at 103±1 °C (ISO, 1993a). The results were
expressed as g water/100 g mince. The salt content (NaCl) in the samples was determined based
on AOAC (2000) and expressed as g salt/100 g mince. Lipid was extracted from 25 g of mince
(80±1% water) with methanol/chloroform/0.88% KCl (aq) (at 1/1/0.5, v/v/v) according to the
Bligh & Dyer (1959) method. The lipid content was determined gravimetrically and the results
were expressed as g lipid per 100 g mince.
2.3 Extraction of salt soluble proteins (SSP)
7
Salt soluble proteins (SSP) were extracted by the method of Kelleher & Hultin (1991) with
a modification of a buffer. Capelin was minced in a Braun Mixer (Type 4262, Germany) for 2 to
3 minutes and 10 g of the mince added to 190 ml of salt solutions (1 M NaCl and 0.02 M
Na2CO3, pH 7.0). The mixture was homogenized in an Ultra-Turrax homogenizer (Ika
Labortechnik, T25 basic, Staufen, Germany) at 6000 rpm for 1 minute. The homogenate was
kept on ice for 1 hour and centrifuged at 0–5 °C for 15 minutes at 10,000 rpm using an Avanti
Centrifuge J-20 XPI (Beckmann Coulter, Fullerton, California, USA). Protein solubility was
evaluated by quantifying the amount of solubilized protein in the supernatant. The Bradford
(1976) method, adapted to micro-assays using bovine serum albumin as a standard was used. The
diluted supernatant and the Bradford reactive were placed in a 96-well micro-plate and
absorbance measured at 595 nm in a Sunrise Micro plate Reader (Tecan GmbH, A-5082 Grödig,
Austria).
2.4 Disulfide bond content of protein
The disulfide bond content was assayed using 2-nitro-5-thiosulfobenzoate (NTSB),
according to the method of Thannhauser, Konishi, & Scheraga (1984). The supernatants from
NaCl protein extractions were diluted to protein concentration of 0.1 mg/ml. Three ml of freshly
prepared NTSB assay solution, pH 9.5 (adjusted with 0.1M HCl or 0.1M NaOH) were added to
0.25 ml protein solution (0.1 mg/ml) in a 4.5 ml cuvette. The mixture was incubated in a dark
place at room temperature for 25 minutes before reading the absorbance at 412 nm (UV- 1800
spectrophotometer, Shimadzu, Kyoto, Japan). The disulfide content was calculated using a molar
extinction coefficient of 13,900 M-1
cm-1
and results expressed as µmol SS/g protein.
2.5 Sulfhydryl group content of protein
The sulfhydryl groups contents were determined using 5,5’-dithiobis-(2-Nitrobenzoic acid)
(DTNB), according to the method of Beveridge, Toma, & Nakai (1974). The supernatant from
NaCl protein extractions were diluted to the concentration of 0.1 mg/ml that were used in
analyzing total sulfhydryl (SH) groups and available sulfhydryl groups. For the total SH content,
0.5 ml of the protein solution were added to 2.5 ml of Tris–SDS buffer pH 8.0 (0.1 M Tris, 3
mM EDTA, 3 % sodium dodecyl sulphate (SDS), 0.1 M glycine and 8 M urea). To the mixture,
0.1 ml of Ellman´s reagent (2 mM 5,50-dithio-bis-(2-nitrobenzoic acid)) were added and mixed
8
before incubating in a dark place at room temperature for 30 min. After incubation, the solutions
absorbance was measured at 412 nm (UV- 1800 spectrophotometer, Shimadzu, Kyoto, Japan).
Total SH content was calculated using a molar extinction coefficient of 13,900 M-1
cm-1
. The
available SH content was determined as with total SH content except that 0.5 ml of protein
solution was added to 2.5 ml of Tris buffer pH 8.0 (0.1 M Tris, 3 mM EDTA, 0.1 M glycine and
8 M urea). The SH content was expressed as µmol SH/g protein.
2.6 Data analysis
Results are expressed as means ± standard deviation. Statistical differences between
treatments were analyzed using one way analysis of variance (ANOVA) with Duncan’s Post-
hoc test using statistical program NCSS 2000 (NCSS, Utah, USA). Pearson correlation analysis
was performed on means of the variable values. P values of <0.05 were considered significant.
3 Results and discussion
3.1 Lipid, water and salt content
Capelin caught in mid February (13th
) had a lipid content of 9.1% and declined to 7% in
early March (7th
) hereafter being referred to as fatty and less fatty batches. The corresponding
water content increased from 76.8% to 78.2% (Table 1). Generally, there is an inverse
relationship between lipid and water contents in fish. Blanching in brine significantly reduced the
lipid content (Table 1). This might be due to exudation of lipid during blanching and drip drying
(Cyprian et al., 2015a). As with the lipid, water content was significantly reduced after
blanching, a phenomenon attributed to reduced water holding capacity due to denaturation and
possible hydrolysis of myofibrillar proteins that might have occurred during blanching. Salt
content of raw capelin was not significantly (p > 0.05) different between batches with values of
0.72 and 0.68 g salt/100 g mince in fatty (C1) and less fatty (C2) capelin respectively (Table 1).
After brining and blanching in brine, salt content increased significantly (p < 0.05), but higher
increase was observed in less fatty and blanched brined capelin. This could be due to differences
in raw material water and salt content. Less fatty capelin had higher water content suggesting
that muscle fluid had less solutes concentration resulting in more diffusion of salt ions than in
fatty capelin under similar brine concentration (5% NaCl). Higher salt content in less fatty
9
capelin after brining and blanching in brine could also imply that lipids act as a barrier to salt
uptake since the uptake was slower in fatty capelin.
Drying trials were carried out using both brined and blanched brined capelin, whereas,
only brined capelin was used in smoking. After both drying and smoking, lipid and salt content
increased while water content was reduced (Table 1). Lipid and salt content increased more in
dried than in smoked capelin, a fact ascribed to the dehydration level as smoked capelin retained
more water than dried capelin. There were also differences between fatty and less fatty capelin
within the same processing method. Less fatty capelin became drier than fatty capelin and
blanched brined capelin became drier than brined capelin. Hot smoked capelin lost more water
than cold smoked capelin. It’s worth noting that when dried, brined and blanched brined capelin
had similar lipid content (not significant p ˃ 0.05), but differed in water and salt contents.
Similar lipid content might be explained by the dehydration level and loss of lipid during
blanching and drip drying. The relative amount of lipid increased as the fish became drier.
Blanched brined capelin lost more water ending up with similar lipid content as brined capelin.
Salt content differed significantly (p < 0.05) between the treatments. The drier capelin became
the higher the salt content.
3.2 Changes in protein solubility (salt soluble proteins)
Lipid content, pre-treatment and smoking methods affected protein solubility in capelin but
the occurrence differed (Figure 1 A, B). Protein solubility measured as salt soluble protein (SSP)
was reduced in all groups as drying progressed and was lowest in blanched brined less fatty
capelin (Figure 1 A). SSP were significantly (p < 0.05) reduced by blanching in brine, while
SSP of brined capelin were not significantly (p > 0.05) different from the raw material. The
decrease in SSP after blanching in brine and during drying is thought to be due to conformational
changes in the proteins. Denaturation and hydrolysis of myofibrillar proteins result in increased
hydrophobicity. This might have occurred during heat processing thereby reducing the content of
thermolabile compounds in blanched brined capelin (Ghelichpour and Shabanpour, 2011; Finot,
1997). Even though blanched brined capelin contained more salt than brined capelin (Table 1),
salt content was not significantly (p > 0.05) different between groups. Therefore influence of salt
on capelin protein solubility was not detected mainly due to low salt content after treatments (<
10
2.5%), as SSP in brined capelin were not significantly different from the raw materials. Similar
results were obtained prior to smoking where only brined capelin batches were used (Figure 1
B).
Drying may have altered protein-water interactions, exposing protein molecules to an
environment that is less polar than water. When water content is reduced, the distance between
protein chains diminishes thereby increasing the formation of cross-linkages between them
(Rustad and Nesse, 1983). These cross-linkages can result in a tighter network of proteins
perturbing their structure and integrity leading to the formation of intrinsic protein particles or
aggregates (Wang, Nema, & Teagarden, 2010; Fennema, 1977) reducing solubility. Reduced
protein solubility may also be linked to the lipid oxidative and degradative products such
malonaldehyde that form complex interactions through cross-linking with protein components
mainly peptides and acid amines (Underland et al., 1999) resulting in protein denaturation and
deterioration. According to Cyprian et al. (2015a) secondary lipid oxidation products such as
malonaldehyde were higher at the start of drying but decreased with time. The authors associated
the decrease in secondary lipid oxidation products to their interactions with protein components
giving rise to tertiary lipid oxidation products.
Hot smoking was divided into three stages of 2 hours preliminary smoking at 30°C,
followed by 2 hours smoking at 40°C and 30 minutes smoking at 75°C (Cyprian et al., 2015b).
Cold smoking was conducted for 4 hours at 24°C. Protein solubility was less influenced by
brining and was apparently lower in less fatty than fatty capelin (Figure 1 B). Protein solubility
remained stable during smoking in both treatments except for slight increase during the first two
hours of smoking and significantly lower values obtained in the batches towards the end of hot
smoking. The slight increase in SSP during the first two hours of smoking might be due to
protein hydrolysis (caused by enzymatic activity) into components of less molecular weight
(Stoknes et al., 2005). In general, the results indicate that during early smoking when the
temperature in both cold and hot smoking was equal to or less than 30°C, slight protein
denaturation occurred and the difference in protein solubility could mainly be accounted for by
differences in lipid content. Lipids seem to have a protective effect on protein as protein
solubility was highest in fatty capelin. This may be due to the low heat transfer coefficient of
lipids, leading to protection of the proteins during drying and smoking. Dyer and Dingle (1961)

11
reported lower protein extractability in smoked lean fish (< 1% fat) than fatty fish (3-10% fat).
Lipid acted as a barrier to salt uptake in the current study with fatty fish obtaining lower salt
content than less fatty fish. Blanching in brine accelerated fish salt uptake when compared to
brining. Salt is known to have a major effect on fish protein solubility and water holding capacity
(Nguyen, Thorarinsdottir, et al., 2011) and could have contributed to low protein solubility
especially as drying progressed in blanched brined capelin.
Protein solubility decreased in both batches towards the end of hot smoking, in particular
during the last 30 minutes when temperature was increased from 40°C to 70°C (Figure 1 B).
Murueta et al. (2007) reported about 90% of fish proteins to be denatured between 60-65°C. In
the current study, protein denaturation appeared to have started at 40°C but the rate of
denaturation increased significantly at 75°C. Protein denaturing temperature in fish is mainly
influenced by protein type but also the species. Proteins of tropical fish species are more
thermally stable than proteins in temperate species (Poulter et al., 1985) and generally the
stability of tissue proteins increases with increasing habitat temperature (Meneshi et al., 1976).
Capelin is a high latitude species which may explain why protein denaturation occurred from a
temperature of 40°C in the present study. Protein solubility was stable during cold smoking
implying the changes in solubility observed during hot smoking were primarily influenced by
temperature rather than salt content which was less than 5% in all groups. A significant positive
correlation was obtained between SSP and water content (Table 2) during drying and smoking
emphasizing that protein solubility decreased with decreasing water content, with stronger
correlation during drying (r = 0.71) than smoking (r = 0.61). SSP had the strongest correlation
with temperature during smoking (r = -0.82) indicating that protein denaturation during smoking
was primarily influenced by temperature.
3.3 Changes in sulfhydryl (SH) and disulfide bond content
Total sulfhydryl (SH) content of the soluble proteins generally decreased during drying
and smoking, except during cold smoking where it remained relatively stable (Figure 2 A, B).
The decrease in total SH content during drying and hot smoking was understood to be due to the
exposure of sulfhydryl groups buried in native proteins making them vulnerable to oxidation
(Nguyen et al., 2011; Rawdkuen, Jongjareonrak, Phatcharat, & Benjakul, 2010; Zuazaga,
12
Steinacker, & Castillo, 1984), even though masking of sulfhydryl groups by protein particles or
aggregates due to dehydration could have also contributed. Total SH content of brined capelin
was higher than in blanched brined capelin, a tendency maintained throughout the drying process
(Figure 2 A). Brined capelin showed a brief increase in total SH content at the start of drying.
After about 24 hours of drying, the total SH content decreased as was the case in blanched brined
capelin from the onset of drying, with both groups obtaining fairly stable total SH contents
towards the end of drying (Figure 2 A).
During drying, brined fatty capelin obtained the highest total SH content than the other
groups while blanched less fatty capelin had the lowest total SH. The higher total SH content in
brined fatty capelin was contrary to disulfide bond content obtained in the group when compared
to blanched less fatty fish (Figure 4 A). Blanching exposes sulfhydryl groups buried in native
proteins to reactive oxygen or secondary oxidative by-products, whereas lipid offers protection
against denaturation caused by exposure of sulfhydryl groups to reactive oxygen or by-products
of lipid oxidation. Blanching then triggers oxidation of sulfhydryl groups with the formation of
hydrogen and hydrophobic bonds (disulfide interchanges) (Baylan et al., 2015; Raman &
Mathew, 2014; Hsu, Hwang, Yu, & Jao, 2007). The slight increase in total SH content in brined
capelin might have been caused by modifications of chemical groups, especially SH due to initial
alteration of protein-water interactions. During the early stages of drying surface water
evaporated but later on further drying water loss took place by diffusion from the interior to the
surface of the fish (Cyprian et al., 2015a) resulting in protein dehydration.
Smoke contains phenolic compounds that have antioxidant properties (Guillen &
Errecalde, 2002), implying that changes in sulfhydryl content during hot smoking (Figure 5.6)
may have been caused by aggregation of proteins rather than oxidation factors. After hot and
cold smoking, capelin showed reduced content in lipid oxidation indicators (Cyprian et al.,
2015b). It can therefore be postulated that masking of sulfhydryl groups by intrinsic protein
aggregates could have decreased the total sulfhydryl content during hot smoking, since it was
relatively stable in the capelin proteins during cold smoking. Significant positive correlation was
obtained between SH and water content during drying and smoking, and also with temperature
during smoking (Table 2). This supports the explanation that sulfhydryl groups might have been
masked by intrinsic protein aggregates. The influence of lipid was not pronounced as the groups
13
differing in lipid content within the same drying pre-treatment or smoking method had similar
total SH content.
The available SH content increased after blanching, during early drying of brined capelin
and during smoking, but rose most after blanching and towards the end of hot smoking (Figure 3
A, B). Blanched brined capelin that had higher available SH content than brined at onset of
drying, showed a tendency of decreasing values during early drying inversely relating to with
total SH content (Table 2, r = -0.40). Available SH content was generally higher in blanched
brined than brined capelin. Proteins were denatured during blanching exposing the sulfhydryl
groups that are buried or blocked in native proteins thereby increasing the proportion of available
SH in the total SH content. The increase in available SH content in brined capelin during early
drying may be related to proteins hydrolysis caused by enzyme activity and or the groups
increased salt content in the fish muscle resulting in protein swelling (salting-in effect), exposing
SH groups (Nguyen et al., 2011; Baylan et al., 2015). It may also be due to changes in the
reactive groups, mainly loss of hydrophilic surface and exposure of hydrophobic areas (Raman &
Mathew, 2014). Available SH content in blanched brined capelin decreased during early drying,
stabilizing towards end of drying in all groups. The decrease in available SH was related to the
masking of sulfhydryl groups by protein aggregates that were formed because of the tight
proteins network due to dehydration. Changes in available SH were in agreement with the
changes in disulfide bond content obtaining a significant correlation (Table 2, r = 0.80).
During smoking, available SH increased significantly (p < 0.05) during hot smoking when
temperature was higher than 40 °C. High temperature during smoking resulted in protein
denaturation, exposing SH groups that were buried in native proteins. However, due to the
antioxidant properties of the smoke (Guillen & Errecalde, 2002), the reactive SH groups were
less oxidized and therefore underwent minimal disulfide interchanges as revealed by disulfide
content changes that were not significantly (p > 0.05) different during smoking (Figure 4 B &
Table 2, r = 0.32). Generally available SH content was negatively correlated with water content
(Table 2) and only correlated strongly with disulfide content during drying. Disulfide bond
content of blanched brined capelin was significantly higher (p < 0.05) after treatment and
throughout the drying process than for any other group (Figure 4 A). Brining alone appeared not
to affect disulphide interchanges as only slight increase was observed during early drying, after

14
which disulphide content remained stable with minor variations in groups under both treatments.
The results are in agreement with total SH content in that higher disulphide content was obtained
in blanched brined capelin, that had lower total SH content and vice versa in brined capelin. This
is because sulfhydryl groups get oxidized when they are exposed to reactive oxygen or secondary
oxidative by-products and subsequently undergo disulfide interchanges (Baylan et al., 2015;
Raman & Mathew, 2014; Hsu, Hwang, Yu & Jao, 2007), resulting in reduced total SH content
and increased disulphide content. The results suggest that proteins aggregate after blanching,
resulting in increased disulfide bonds and reduced total SH content. During later stages of drying
disulfide bond content was stable and corresponded with the stability in SH groups. Lipids did
not significantly affect the available SH and disulfide content during capelin drying and smoking
even though fatty capelin had tended to have higher SH content and lower available SH content
than less fatty capelin.
4 Conclusions
The results demonstrate that brining and blanching in brine, the drying process, smoking
methods and also the lipid content affect the conformational changes in capelin proteins. SSP
and total SH content were reduced while available SH and disulfide content increased during
drying and smoking. Protein conformational changes occurred mainly during early drying when
water content and dehydration rate were relatively high and became stable later when water
content was lower. Blanching of capelin before drying reduced protein solubility and SH content
that resulted in high protein aggregation during drying which could have affected the eating
quality of the product mainly texture (i.e. sticky texture on biting) and reduced nutritional value
due to loss of thermolabile compounds for instance amino acids. Conformational changes that
occurred during hot smoking were ascribed to protein denaturation, that in addition to loss of
nutritional value, reduced muscle water holding capacity thereby affecting the yield which is of
importance to processors. As expected less changes in protein structure were observed during
cold smoking.
Lipid content seems to have a protective effect on capelin proteins during drying and
smoking as there were less changes (SSP and SH groups) in fatty capelin. Blanching and drying
in general had more influence on protein conformational changes than brining and smoking.

15
Blanching is not suitable for commercial capelin drying, and drying should be conducted under
low temperature conditions to maintain protein quality and products textural properties. We
recommend a study to be conducted to assess the effect of fish blanching on texture and product
acceptability for tropical fish that are blanched prior to drying.
Acknowledgment
The authors greatly acknowledge the United Nations University- Fisheries Training
Programme (Iceland) and AVS (Added Value of Seafood) Fund of the Ministry of Fisheries and
Agriculture, Iceland (Project No. FR 074-14) for financial support. The authors are thankful to
HB Grandi fishing company, Reykjavik, Iceland for capelin contribution. The Director of
Vestfirska Hardfisksalan and Vigfus Asbjornsson of Matis Hornarfordur are thanked for the
drying and smoking facilities respectively.
5 References
Akintola, S. L., Brown, A., Bakare, A., Osowo, O. D., & Omolola, B. (2013). Effects of Hot
Smoking and Sun Drying Processes on Nutritional Composition of Giant Tiger Shrimp
(Penaeus monodon, Fabricius, 1798). Polish Journal of Food and Nutrition Sciences, 63(4),
227–237. doi:10.2478/v10222-012-0093-1
AOAC. (2000). Fat (total, saturated, and unsaturated) in foods: Method 996 06. In E. Davi (Ed.),
Official methods of analysis of AOAC international (17th ed.). Gaithersburg, MD: AOAC
International.
Baylan, M., Mazi, G., Ozcan, D., Ozcan, Bahri, N., Akar, M., & Conskun, A. (2015). Changes of
Electrophoretic Protein Profiles of Smoked and Marinated Rainbow Trout (Oncorhynchus
mykiss) During Refrigerated Storage. Journal of Agricultural Sciences, 21, 262–269.
Bellagha, S., Sahli, A., Farhat, A., Kechaou, N., & Glenza, A. (2007). Studies on salting and
drying of sardine (Sardinella aurita): Experimental kinetics and modeling. Journal of Food
Engineering, 78(3), 947–952. doi:10.1016/j.jfoodeng.2005.12.008
Beveridge, T., Toma, S. J., & Nakai, S. (1974). Determination of SH- and SS-groups in some
food proteins using Ellman’s reagent. Journal of Food Science, 39, 49–51.
Bligh, E. G., & Dyer, W. S. (1959). A rapid method of total lipid extraction and purification.
Canadian Journal of Biochemistry and Physiology, 37, 911–917.
16
Bradford, M. (1976). A rapid and sensitive method for the quantitation of microgram quantities
of protein utilizing the principle of protein–dye binding. Analytical Biochemistry, 72, 248–
254.
Cyprian, O., Nguyen, V. M., Sveinsdottir, K., Jonsson, A., Thorkelsson, G., & Arason, S.
(2015a). Influence of lipid content and blanching on capelin (Mallotus villosus) drying rate
and lipid oxidation under low temperature drying. Food Process Engineering, In press, 1–
10. doi:10.1111/jfpe.12215
Cyprian, O., Nguyen, V. M., Sveinsdottir, K., Jonsson, A., Tomasson, T., Thorkelsson, G., &
Arason, S. (2015b). Influence of smoking and packaging methods on lipid stability and
microbial quality of Capelin (Mallotus villosus) and Sardine (Sardinella gibossa). Food
Science & Nutrition, In press, 1–11. doi:10.1002/fsn3.233
Darvishi, H., Azadbakht, M., Rezaeiasl, A., & Farhang, A. (2013). Drying characteristics of
sardine fish dried with microwave heating. Journal of the Saudi Society of Agricultural
Sciences, 12(2), 121–127. doi:10.1016/j.jssas.2012.09.002
Dyer, W. J., & Dingle, J. R. (1961). Fish as Food. (B. Borgstrom, Ed.) (Volume 1.). New York:
Academic Press Inc.
Fennema, O. R. (1977). Water and protein hydration. In J. R. Whitaker & S. R. Tannenbaum
(Eds.), Food proteins (pp. 50–90). Westport, CT: AVI Publishing Co. Inc..
Finot, P. A. (1997). Effects of Processing and Storage on the Nutritional Value of Food Proteins.
In S. Damodaran & A. Paraf (Eds.), Food Proteins and their Applications (pp. 551–557).
New York, NY: Marcel Dekker, Inc.
Ghelichpour, M., & Shabanpour, B. (2011). The investigation of proximate composition and
protein solubility in processed mullet fillets. International Food Research Journal, 18(4),
1343–1347.
Guillen, M. D., & Errecalde, M. C. (2002). Volatile components of raw and smoked black bream
(Brama raii) and rainbow trout (Oncorhynchus mykiss) studied by means of solid phase
microextraction and gas chromatography/mass spectrometry. Journal of the Science of Food
and Agriculture, 82, 945–952.
Hsu, K. C., Hwang, J. S., Yu, C. C., & Jao, C. L. (2007). Changes in conformation and in
sulfhydryl groups of actomyosin of tilapia (Orechromis niloticus) on hydrostatic pressure
treatment. Food Chemistry, 103, 560–564.
IOC. (2012). Regional Fish Trade in Eastern and Southern Africa. Products and Markets. A Fish
Traders Guide. Indian Ocean Commission, SmartFish working Paper No 013, pp54.
ISO. (1993). Determination of moisture and other volatile matter content (6496). Geneva,
Switzerland: The international Organization for Standards.
17
Kelleher, S. D., & Hultin, H. O. (1991). Lithium chloride as a preferred extractant of fish protein.
Journal of Food Science, 56, 315–317.
Meneshi, S., Harwood, R., & Grant, M. E. (1976). Native collagen is not a substrate for collagen
glucosyl trasferase of platelets. Nature (London), 246(5587), 670–672.
Murueta, J. H., Toro, M. D. L. Á., & Carreño, G. F. (2007). Concentrates of fish protein from
bycatch species produced by various drying processes. Food Chemistry, 100, 705–711.
doi:10.1016/j.foodchem.2005.10.029
Nguyen, M. Van, Thorarinsdottir, K. A., Gudmundsdottir, A., Thorkelsson, G., & Arason, S.
(2011). The effects of salt concentration on conformational changes in cod ( Gadus morhua)
proteins during brine salting. Food Chemistry, 125(3), 1013–1019.
doi:10.1016/j.foodchem.2010.09.109
Oduor-Odote, P., Shitanda, D., Obiero, M., & Kituu, G. (2010). Drying characteristics and some
quality attributes of Rastrineobola argentia (Omena) and Stolephorus delicatulus
(Kimarawali). African Journal of Food, Agriculture, Nutrition and Development, 10(8),
2998–3014.
Omodara, M. A., & Olaniyan, A. M. (2012). Effects of Pre-Treatments and Drying Temperatures
on Drying Rate and Quality of African Catfish ( Clarias gariepinus ). Journal of Biology,
Agriculture and Healthcare, 2(4), 1–11.
Poulter, R. G., Ledward, D. A., Godber, S., Hall, G., & Rowlands, B. (1985). Heat stability of
fish muscle proteins. Journal of Food Technology, 20, 203–217.
Raman, M., & Mathew, S. (2014). Quality Changes During Frozen Storage and Cooking of
Milk. Journal of International Academic Research for Multidisciplinary, 2(4), 452–468.
Rawdkuen, S., Jongjareonrak, A., Phatcharat, S., & Benjakul, S. (2010). Assessment of protein
changes in farmed giant catfish (Pangasianodon gigas) muscles during refrigerated storage.
International Journal of Food Science and Technology, 45, 985–994. doi:10.1111/j.1365-
2621.2010.02217.x
Ren, J., Zhao, M., Shi, J., Wang, J., Jiang, Y., Cui, C., … Xue, J. . (2008). Optimization of
antioxidant peptide production from grass carp sarcoplasmic protein using response surface
methodology. Food Science and Technology, 41, 1624–1632.
Rustad, T., & Nesse, N. (1983). Heat treatment and drying of capelin mince.pdf. Journal of Food
Science, 48(4), 1320–1322.
Skipnes, D., Plancken, V. der I., Loey, V. A., & Hendrick, E. M. (2008). Kinetics of heat
denaturation of proteins from farmed Atlantic cod (Gadus morhua). Journal of Food
Engineering, 85(1), 51–58. doi:10.1016/j.jfoodeng.2007.06.030
18
Statistics Iceland. (2015). Fisheries Catch and value of catch. April 5, 2015. Retrieved from
http://www.statice.is/Statistics/Fisheries-and-agriculture/Catch-and-value-of-catch
(Acessed April 5, 2015)
Stoknes, I. S., Walde, P. M., & Synnes, M. (2005). Proteolytic activity in cod (Gadus morhua)
muscle during salt curing. Food Research International, 38(6), 693–699.
Thannhauser, T. W., Konishi, Y., & Scheraga, H. A. (1984). Sensitive quantitative analysis of
disulfide bonds in polypeptides and proteins. Analytical Biochemistry, 138(1), 181–188.
Underland, I., Hall, G., & Lingnert, H. (1999). Lipid oxidation in fillets of herring (Clupea
harengus) during ice storage. Journal of Agricultural Food Chemistry, 47(2), 524–532.
Wang, W., Nema, S., & Teagarden, D. (2010). Protein aggregation – pathway and influencing
factors. International Journal of Pharmacy, 390, 89–99.
Zuazaga, C., Steinacker, A., & Castillo, del J. (1984). The Role of Sulfhydryl and Disulfide
Groups of Membrane Proteins in Electrical Conduction and chemical trasmission. Puerto
Rico Health Sciences Journal, 3(3), 125–139.
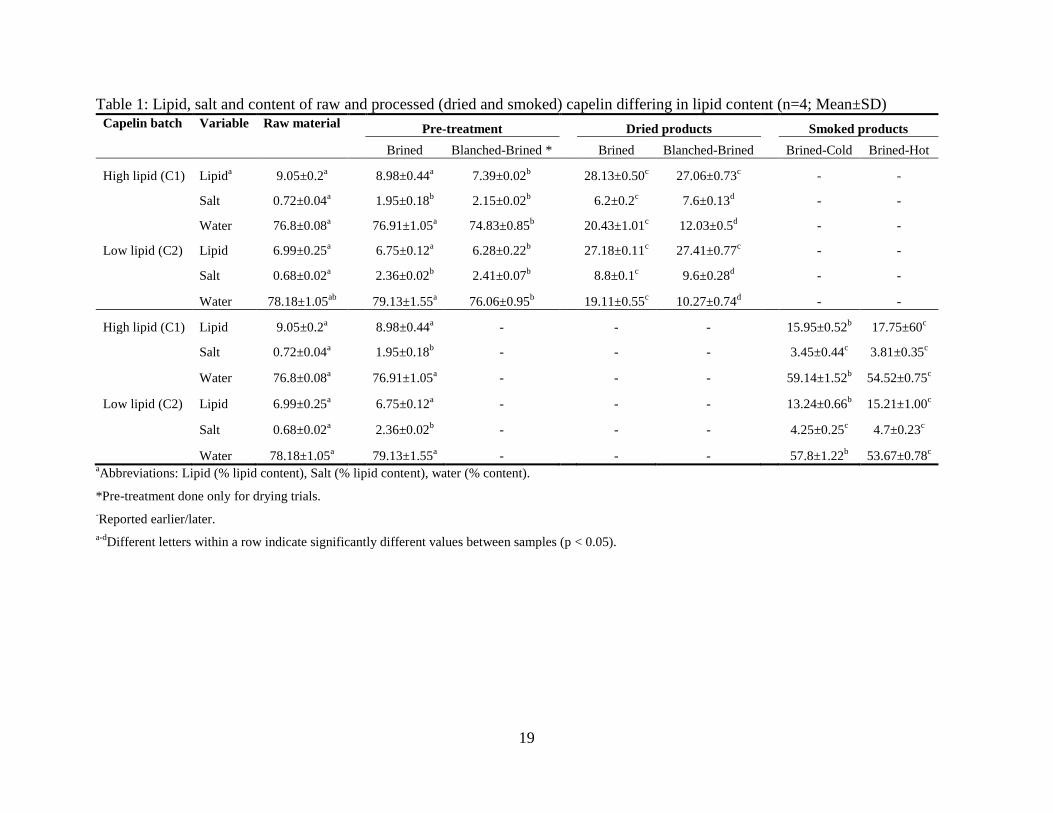
19
Table 1: Lipid, salt and content of raw and processed (dried and smoked) capelin differing in lipid content (n=4; Mean±SD)
Capelin batch Variable Raw material
Pre-treatment
Dried products
Smoked products
Brined Blanched-Brined * Brined Blanched-Brined Brined-Cold Brined-Hot
High lipid (C1) Lipida 9.05±0.2
a
8.98±0.44a 7.39±0.02
b
28.13±0.50c 27.06±0.73
c
- -
Salt 0.72±0.04a
1.95±0.18b 2.15±0.02
b
6.2±0.2c 7.6±0.13
d
- -
Water 76.8±0.08a
76.91±1.05a 74.83±0.85
b
20.43±1.01c 12.03±0.5
d
- -
Low lipid (C2) Lipid 6.99±0.25a
6.75±0.12a 6.28±0.22
b
27.18±0.11c 27.41±0.77
c
- -
Salt 0.68±0.02a
2.36±0.02b 2.41±0.07
b
8.8±0.1c 9.6±0.28
d
- -
Water 78.18±1.05ab
79.13±1.55a 76.06±0.95
b
19.11±0.55c 10.27±0.74
d
- -
High lipid (C1) Lipid 9.05±0.2a
8.98±0.44a -
- -
15.95±0.52b 17.75±60
c
Salt 0.72±0.04a
1.95±0.18b -
- -
3.45±0.44c 3.81±0.35
c
Water 76.8±0.08a
76.91±1.05a -
- -
59.14±1.52b 54.52±0.75
c
Low lipid (C2) Lipid 6.99±0.25a
6.75±0.12a -
- -
13.24±0.66b 15.21±1.00
c
Salt 0.68±0.02a
2.36±0.02b -
- -
4.25±0.25c 4.7±0.23
c
Water 78.18±1.05a
79.13±1.55a -
- -
57.8±1.22b 53.67±0.78
c
aAbbreviations: Lipid (% lipid content), Salt (% lipid content), water (% content).
*Pre-treatment done only for drying trials.
-Reported earlier/later.
a-dDifferent letters within a row indicate significantly different values between samples (p < 0.05).
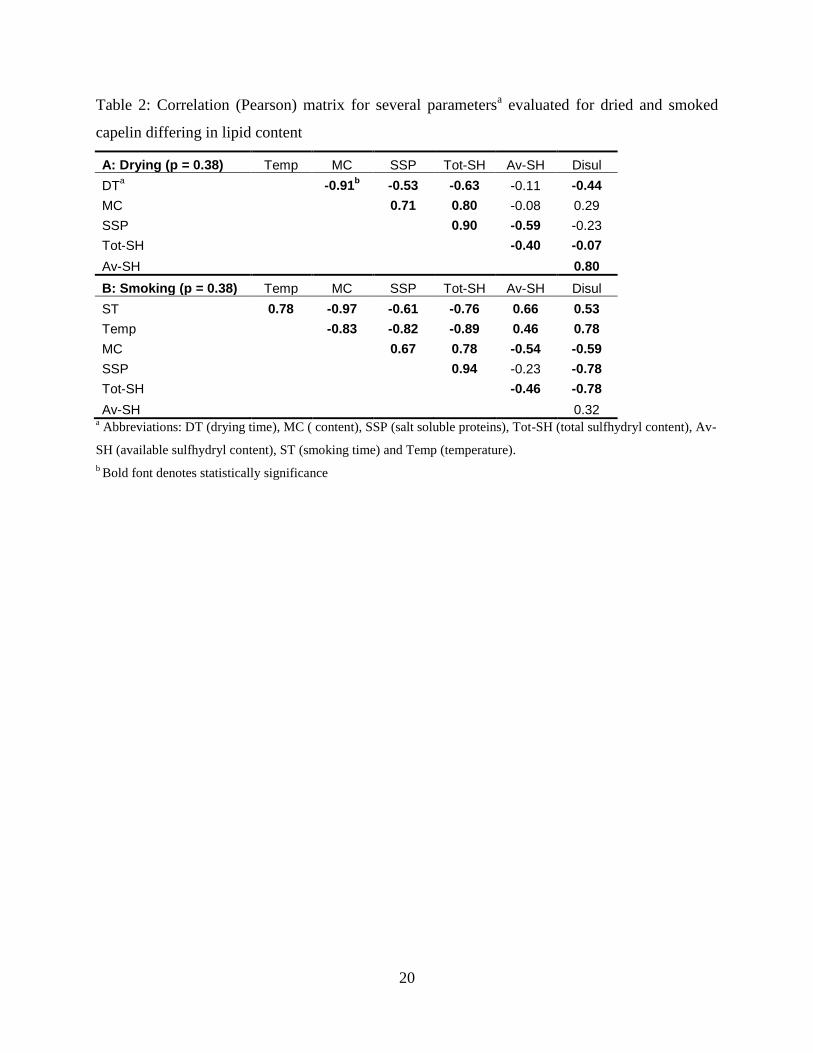
20
Table 2: Correlation (Pearson) matrix for several parametersa evaluated for dried and smoked
capelin differing in lipid content
A: Drying (p = 0.38) Temp MC SSP Tot-SH Av-SH Disul
DTa
-0.91
b -0.53 -0.63 -0.11 -0.44
MC
0.71 0.80 -0.08 0.29
SSP
0.90 -0.59 -0.23
Tot-SH
-0.40 -0.07
Av-SH
0.80
B: Smoking (p = 0.38) Temp MC SSP Tot-SH Av-SH Disul
ST 0.78 -0.97 -0.61 -0.76 0.66 0.53
Temp
-0.83 -0.82 -0.89 0.46 0.78
MC
0.67 0.78 -0.54 -0.59
SSP
0.94 -0.23 -0.78
Tot-SH
-0.46 -0.78
Av-SH 0.32 a Abbreviations: DT (drying time), MC ( content), SSP (salt soluble proteins), Tot-SH (total sulfhydryl content), Av-
SH (available sulfhydryl content), ST (smoking time) and Temp (temperature).
b Bold font denotes statistically significance
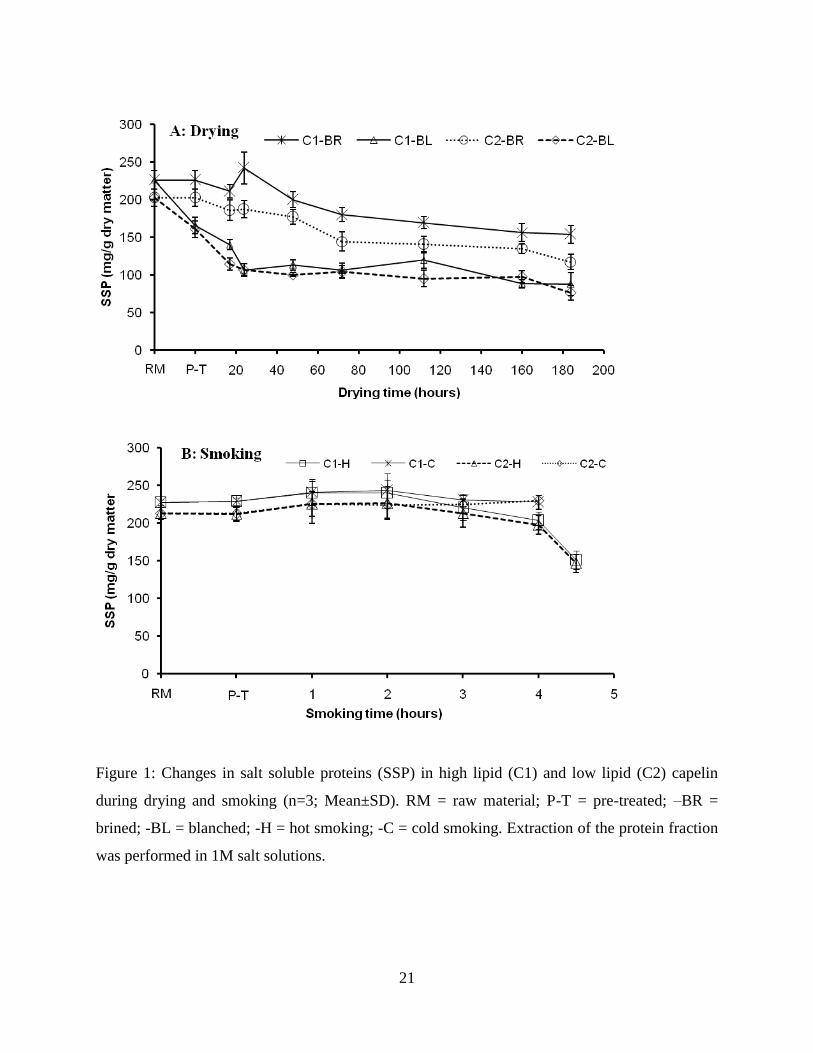
21
Figure 1: Changes in salt soluble proteins (SSP) in high lipid (C1) and low lipid (C2) capelin
during drying and smoking (n=3; Mean±SD). RM = raw material; P-T = pre-treated; –BR =
brined; -BL = blanched; -H = hot smoking; -C = cold smoking. Extraction of the protein fraction
was performed in 1M salt solutions.
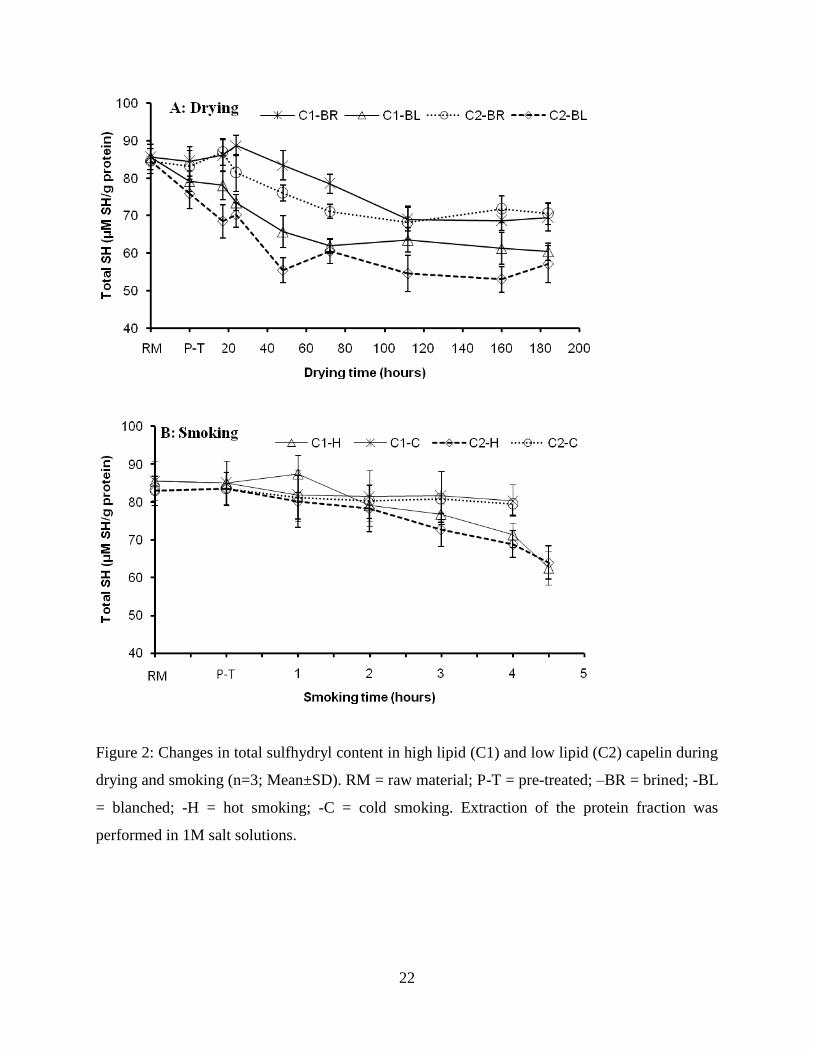
22
Figure 2: Changes in total sulfhydryl content in high lipid (C1) and low lipid (C2) capelin during
drying and smoking (n=3; Mean±SD). RM = raw material; P-T = pre-treated; –BR = brined; -BL
= blanched; -H = hot smoking; -C = cold smoking. Extraction of the protein fraction was
performed in 1M salt solutions.
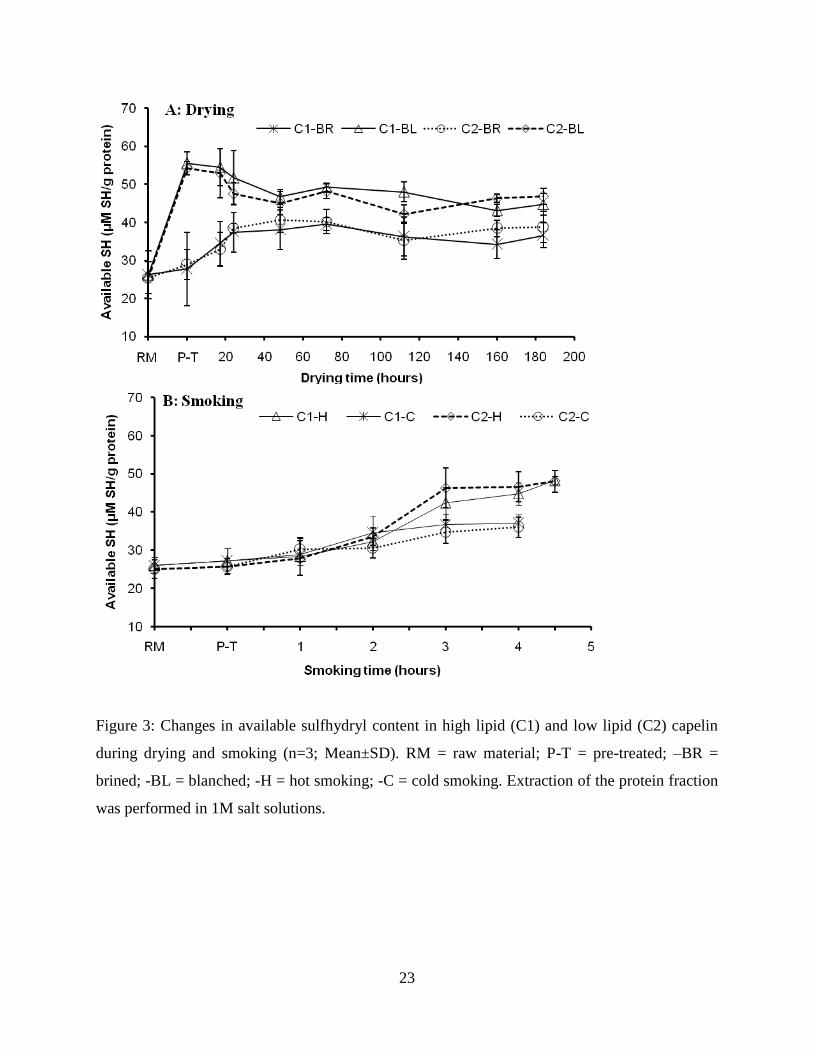
23
Figure 3: Changes in available sulfhydryl content in high lipid (C1) and low lipid (C2) capelin
during drying and smoking (n=3; Mean±SD). RM = raw material; P-T = pre-treated; –BR =
brined; -BL = blanched; -H = hot smoking; -C = cold smoking. Extraction of the protein fraction
was performed in 1M salt solutions.
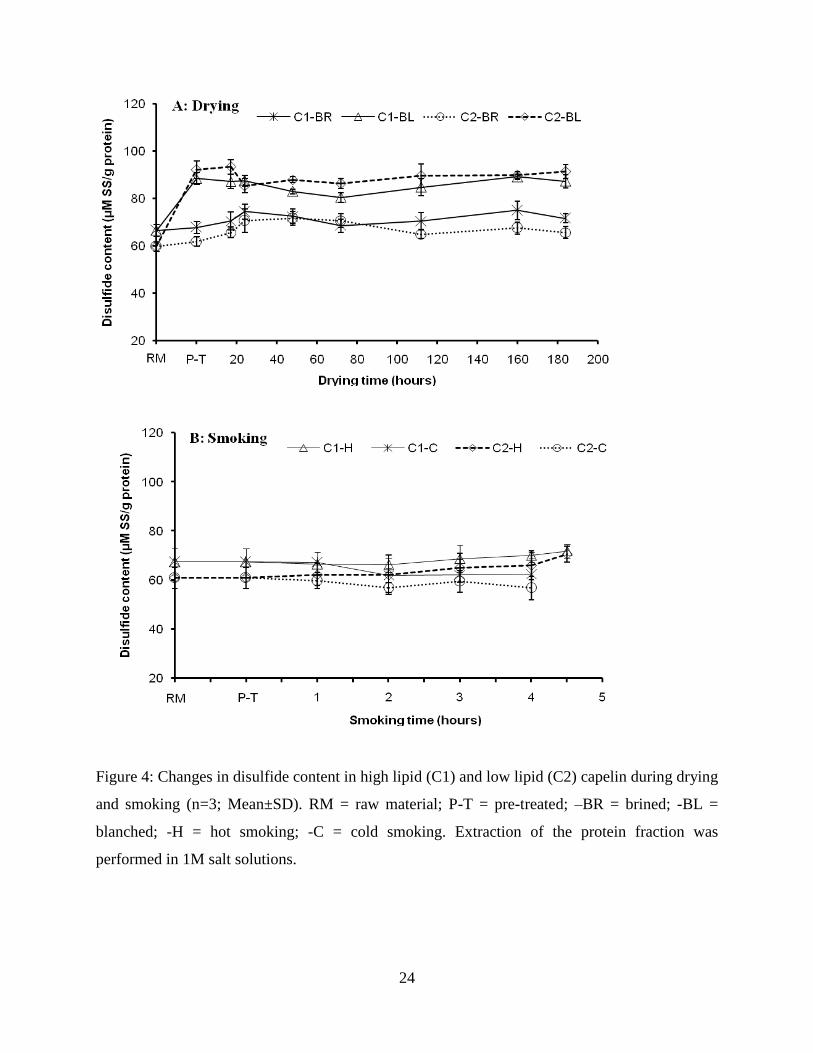
24
Figure 4: Changes in disulfide content in high lipid (C1) and low lipid (C2) capelin during drying
and smoking (n=3; Mean±SD). RM = raw material; P-T = pre-treated; –BR = brined; -BL =
blanched; -H = hot smoking; -C = cold smoking. Extraction of the protein fraction was
performed in 1M salt solutions.
PAPER IV
Influence of smoking and packaging methods on lipid stability and microbial quality of
Capelin (Mallotus villosus) and Sardine (Sardinella gibossa)
Cyprian, O. O., Nguyen, M. V., Sveinsdottir, K., Johnsson, A., Tomasson, T., Thorkelsson, G.,
Arason, S.
Food Science & Nutrition 2015; 3(5): 404-414, doi:10.1002/fsn3.233
Reprinted with permission from Wiley Periodicals, Inc.
IV
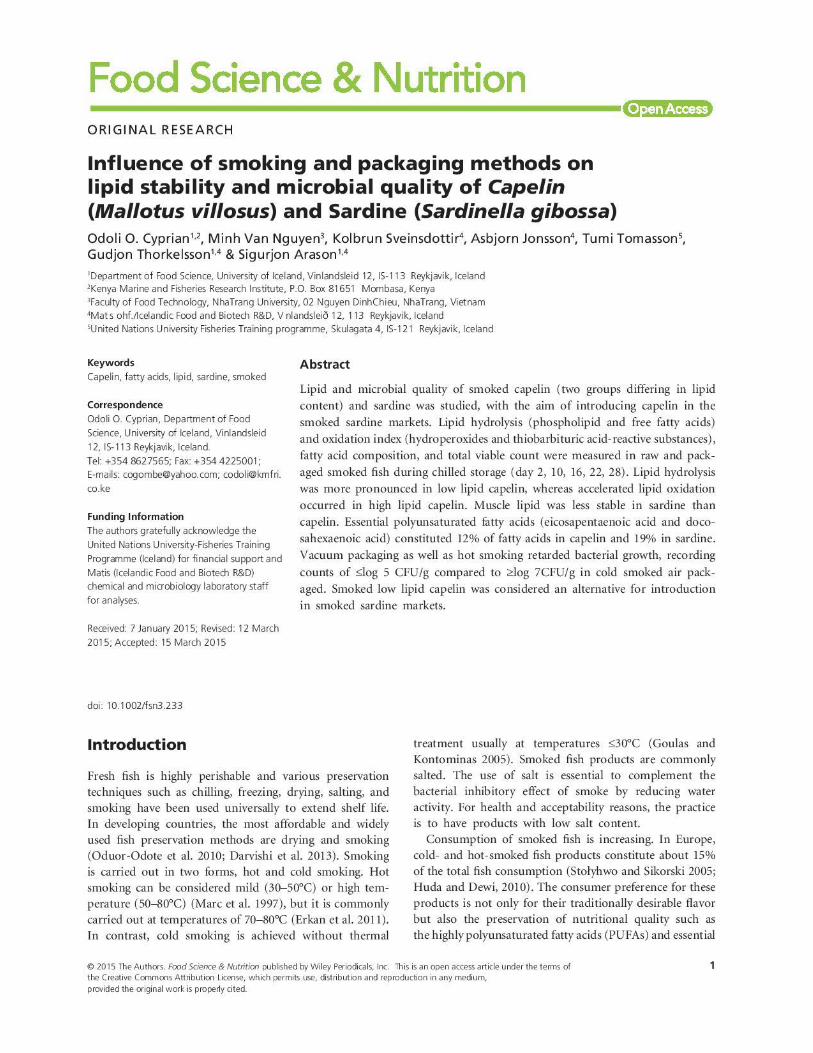
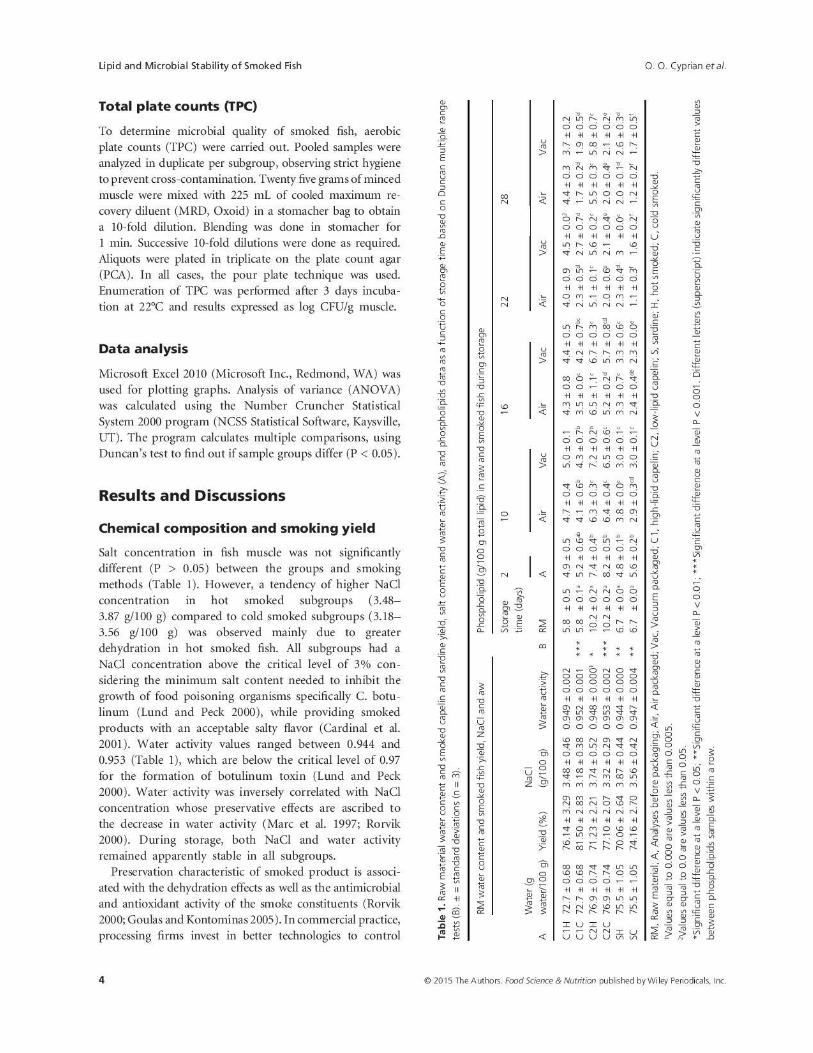
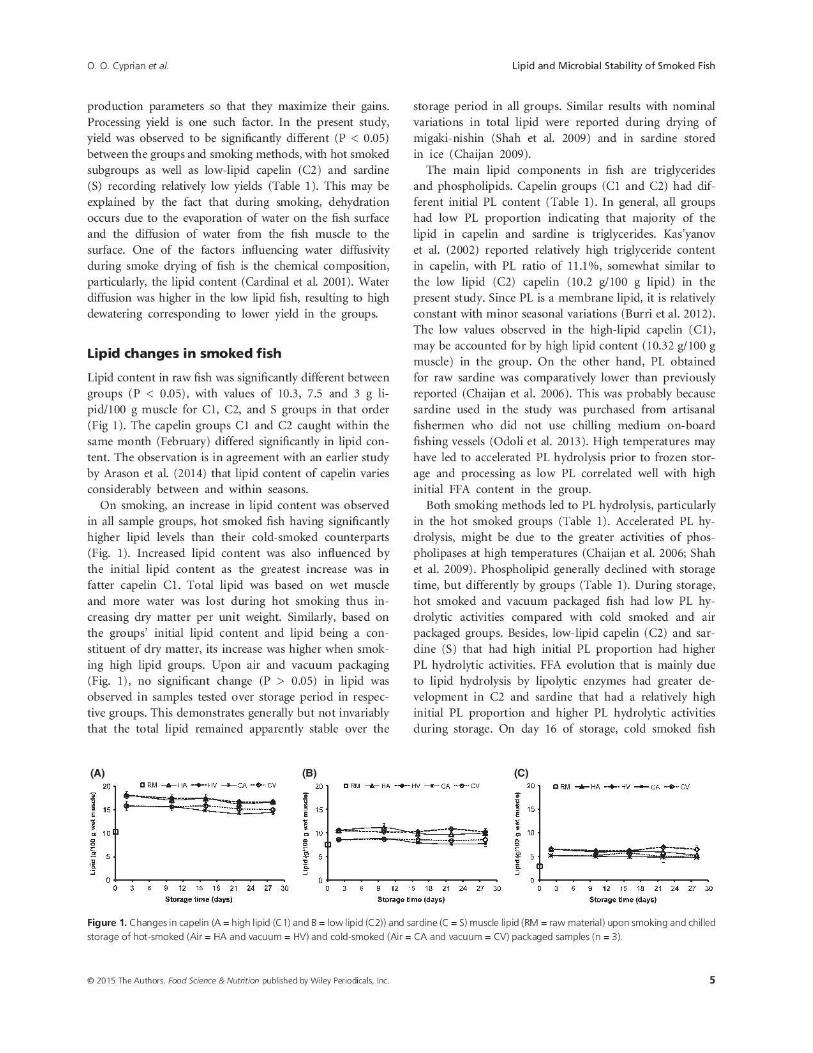
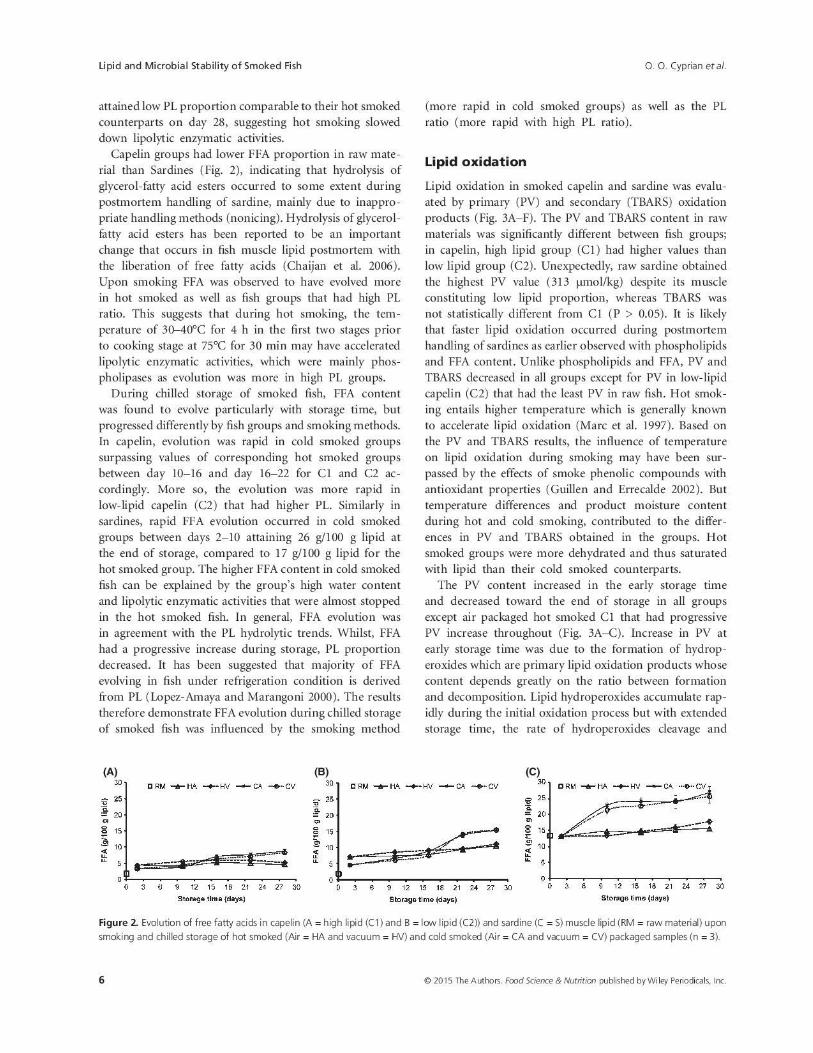
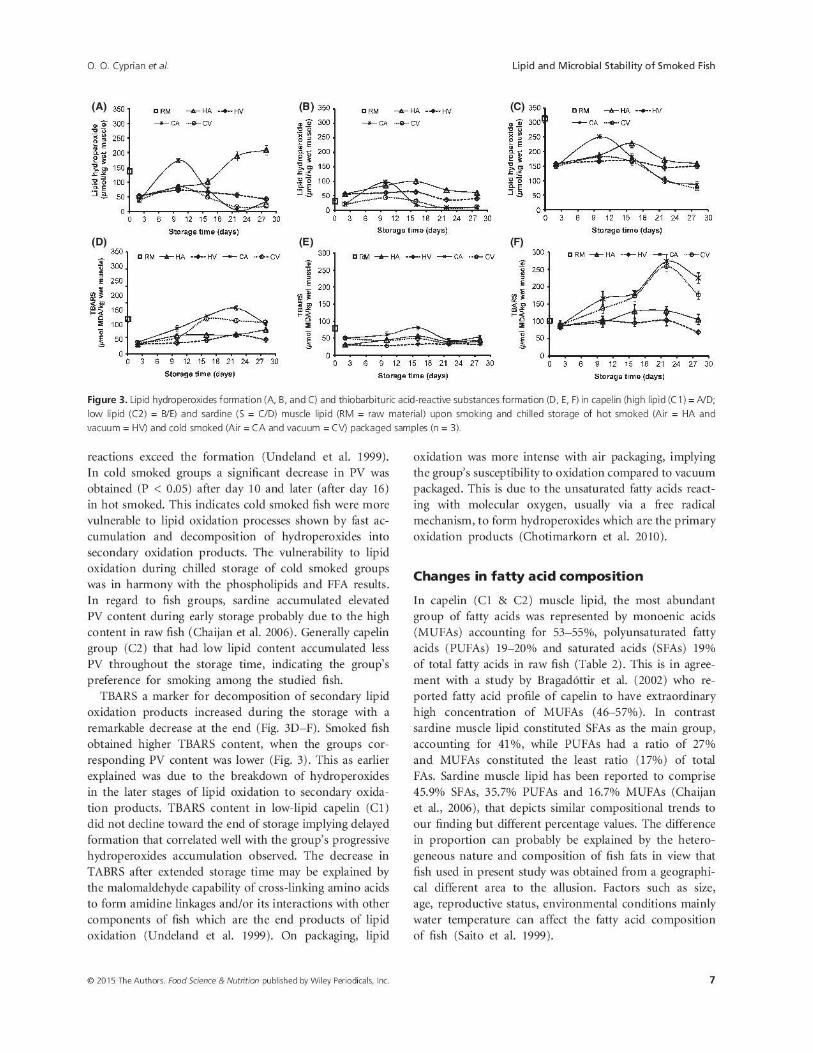
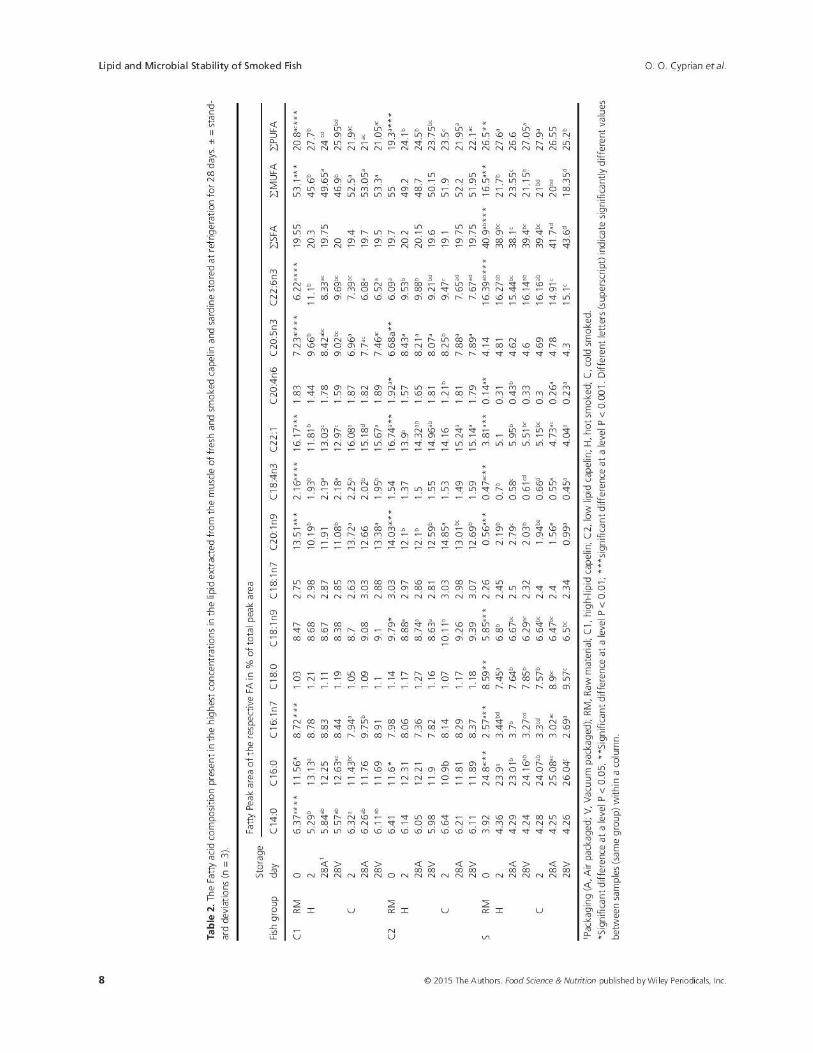

1
2
1
PAPER V
Influence of lipid content and packaging methods on the quality of dried capelin (Mallotus
villosus) during storage
Cyprian, O. O., Sveinsdottir, K., Nguyen, M. V., Tomasson, T., Thorkelsson, G., Arason, S.
Journal of Food Science and Technology
Under review
V

2
Influence of lipid content and packaging methods on the quality of dried capelin (Mallotus
villosus) during storage
Cyprian OOa,e*
, Sveinsdottir Kb, Nguyen MV
c, Tomasson T
d, Thorkelsson G
a,b, Arason S
a,b
aUniversity of Iceland, Department of Food Science and Nutrition, Vinlandsleid 14, IS-113
Reykjavik, Iceland
bMatisohf. /Icelandic Food and Biotech R&D, Vinlandsleid 12, IS-113 Reykjavik, Iceland
cFaculty of Food Technology, NhaTrang University, NhaTrang, Vietnam
dUnited Nations University Fisheries Training Programme, Skulagata 4, IS-121 Reykjavik,
Iceland
eKenya Marine & Fisheries Research Institute, Mombasa, Kenya
Corresponding author. Tel. +3548627565; Fax +3544225001
E-mail address: [email protected]
3
ABSTRACT Open-sun dried small fish is an important source of protein for low income people
in many developing countries. Capelin annual catch exceeds half a million tons in Iceland, with
only a small quantity (<20%) of female with roe used for human food. There is a potential to use
dried male capelin as a new product for human consumption. Three batches of dried male capelin
(Mallotus villosus) differing in lipid content packed in open and sealed polyethylene and vacuum
bags were studied during 5 months of storage at 22 °C to establish the effects of lipid content and
packaging methods on dried capelin stability. Lipid composition, lipid hydrolysis and oxidation,
sensory attributes and microbial activity were evaluated. Batches differed in composition and
stability, with low lipid capelin constituting higher proportion of polyunsaturated fatty acids than
high lipid capelin. Lipid oxidation was influenced by lipid content and packaging mode, as
accelerated oxidation occurred in high lipid and open packed capelin. Lipid hydrolysis was less
influenced by packaging and was greater in low lipid capelin. High lipid capelin in open bags
scored highest for rancid odor. All batches were micro-biologically stable with colony-forming
unit counts increasing less than log 1 during storage. The influence of lipid content on hydrolysis
and oxidation as well as sensory properties during storage at room temperature was
demonstrated. A stable and safe product at room temperature could be produced by the raw
materials and drying method used, if products are vacuum packed.
Key words: Dried capelin, lipid content, packaging, stability
4
1 Introduction
Capelin (Mallotus villosus) is a small pelagic schooling fish that is economically and
ecologically important in the northern hemisphere (ICES 2009). Large populations occur in the
Atlantic and Pacific Oceans but important commercial fisheries have developed in the Atlantic
Ocean (Carscadden et al. 2013). In Iceland, it is caught during spawning migration in winter,
from December to March. Lipid content in capelin depends on maturity and season, and varies
from about 4% to 20% body weight (Bragadóttir et al. 2002). There are even variations in lipid
content of capelin caught within the same month of the year (Cyprian et al. 2015a).
Capelin catch in Iceland exceeds half a million tons in recent years (Statistics Iceland 2015). A
small quantity of it specifically female capelin with roe is used for human food, with about 80%
used for fishmeal and oil production (Statistics Iceland 2015). So there is a potential to increase
the use of capelin for human consumption. In Eastern Africa particularly Kenya, Tanzania and
Uganda the consumption of dried small pelagic species is widespread (IOC 2012; Oduor-odote et
al. 2010). The increased consumption of small dried pelagic species has been ascribed to the
increase in human population, decline in catches of table fish and improved processing (IOC
2012). Consumer preferences for the products are not only because of the taste and flavor, but
also because of low price and good stability during storage (IOC 2012). This provides a possible
avenue for utilizing capelin for human consumption by marketing dried capelin in East Africa
and elsewhere. Blue whiting (Micromesistius poutassou) is already dried for markets in Nigeria.
Storage is an important part in the distribution and marketing of processed food. Storage life is
determined by processing method, product composition, packaging and storage conditions. Air
drying is advantageous over other preservation methods because it is affordable and efficient
(Jain 2006; Bellagha et al. 2002). Quality deteriorations such as lipid hydrolysis that influence
the formation of oxidation products occur during storage of dried fish (Doe 2002). Air dried
products are also easily contaminated by microbes mainly air borne molds as they are often
processed and sold unpackaged in an open-air environment (Park et al. 2014). Earlier studies
have concentrated on the influence of drying conditions on quality than the influence of storage
conditions because dried fish are considered safe during storage (Cyprian et al., 2015b; Hwang et
al. 2012; Dewi et al. 2011; Oduor-odote et al. 2010; Kilic 2009; Wu and Mao 2008).
5
Packaging is an important part of the food industry. Food packaging has a preservation function
and delivers safe, wholesome and attractive foods to the market (Kilcast and Subramaniam
2000). The methods of packaging can influence the preservation of quality of dried fish. Open air
packaging is generally used for dried small pelagic species (mostly lean fish) in the intended
markets and can expose dried capelin saturated with oil to oxygen. Vacuum packaging eliminates
the air and is known to improve the shelf life and overall quality of muscle foods (Etemadian et
al. 2012). The present study was aimed at assessing lipid deterioration and microbial quality
during storage of dried capelin. The effects of lipid variation and packaging methods on lipid
hydrolysis and oxidation, and microbial quality were analyzed. Samples were stored at 22±2 °C
in order to simulate warm climate as expected in the distribution and marketing of this kind of
product.
2 Materials and methods
2.1 Raw material, processing and sampling
Three batches of frozen male capelin (Mallotus villosus) caught on 1st (C1), 13
th (C2) and 28
th
(C3) February, 2013 in the North Atlantic were obtained from HB Grandi fishing company,
Reykjavik, Iceland. The fish had been stored in chilled seawater (0 °C) for two days post-catch
before freezing at -25 °C in blocks weighing 25 kg each and kept frozen for 3 months until the
study time. Batches differed significantly (p < 0.05) in lipid content with values of 10%
(10.32±0.65), 9% (8.83±0.46%) and 7.5% (7.54±0.48%) for C1, C2 and C3, respectively. Before
drying, the frozen fish was thawed overnight at 18-20 °C. Ten fish from each group were tagged
for weighing during drying to determine when the samples attained hygroscopic equilibrium
moisture. Fish were arranged separately by groups in a single layer on plastic meshed trays and
dried in a tunnel drier under controlled temperature, relative humidity and air speed (Cyprian, et
al., 2015b).
After drying the fish (DC1, DC2 and DC3) was taken to Matis laboratory and each group divided
into three equal portions which were further divided into 30 equal size samples, of these 10 were
put into open polyethylene bags, 10 in sealed polyethylene bags and 10 were vacuum packaged
in 10 high-barrier film bags (40PA/70LDPE, 250 mm × 400 mm × 0.120 mm, Plastprent
Iceland). Packed fish were stored at room temperature (22±2 °C) and sampled every 30 days for
6
five months when two bags were picked randomly for analyses from each packaging treatment
for each batch, 18 bags in all.
2.2 Chemicals
Chemicals used in this study were of analytical grade purchased from Sigma-Aldrich (Steinheim,
Germany), Sigma-Aldrich (St. Louis, MO, USA) and Fluka (Buchs, Switzerland).
2.3 Water content and water activity
Water content of raw and dried capelin was determined as the difference in weight of minced
fish before and after drying at 103±1 °C for 4 h (ISO, 1993a). Results were expressed as g
water/100 g mince. Water activity (aw) was measured using an Aqua Lab instrument (Novasina
AW-Center, AWC503 RS-C, Axiar AG, Switzerland) as described by Cyprian and others
(2015b).
2.4 Total lipid
Lipid was extracted from 25 g of minced fish (with 80±1% water content) with
methanol/chloroform/0.88% KCl (aq) (at 1/1/0.5, v/v/v) according to the Bligh and Dyer (1959)
method. The lipid content was determined gravimetrically and the results were expressed as g
lipid per 100 g mince.
2.5 Fatty acid composition
The fatty acid composition of the total lipid extracts was determined by gas chromatography of
fatty acid methyl esters (FAME). Methylation of fatty acids was carried out according to AOAC
(2000). The lipid extract was vaporized to constant weight at 55 °C under nitrogen. About 70 mg
of the pure lipid extract was dissolved in 1.5 mL 0.5N NaOH (in methanol) and incubated at 100
°C for 7 minutes. After cooling, 2 mL BCl3, 12% in methanol were added and incubated again at
100 °C for 30 minutes. The sample was cooled and 1 mL of standard solution (1 mg/mL 23:0
methyl ester in isooctane) and 5 mL saturated NaCl solution were added and mixed. After phase
separation, the isooctane layer was transferred into a test tube containing 1mm bed of anhydrous
Na2SO4. This was repeated with 1 mL of clean isooctane. The combined isooctane layers,
containing the FAMEs were then transferred to GC vials (2x750 µL). The FEMEs were
7
separated by GC (Varian 3900 GC, Varian, Inc., Walnut Creek, CA, USA) equipped with a fused
silica capillary column (HP-88, 100 m x 0.25 mm x 0.20 µm film), split injector and flame
ionization detector fitted with Galaxie Chromatography Data System (Version 1.9.3.2 software).
The result of each fatty acid was expressed as g fatty acid per 100 g lipid.
2.6 Phospholipid and free fatty acid
Phospholipid (PL) content was determined on the lipid extract by a colorimetric method, based
on a complex formation of phospholipid and ammonium ferrothiocyanate (Stewart 1980), before
reading the resultant solutions absorbance at 488 nm (UV-1800 spectrophotometer, Shimadzu,
Kyoto, Japan). The reported PL was based on a standard curve prepared with phosphatidyl-
choline in chloroform (5-50μg/ml) and results expressed as g phosphatidyl-choline
equivalent/100 g lipid. Free fatty acid (FFA) content was determined on 3 mL of the lipid extract
based on a complex formation with cupric acetate-pyrimidine (Bernardez et al. 2005), followed
by absorbance reading of the upper layer at 710 nm. The FFA concentration was calculated as
μM quantities of oleic acid, based on a standard curve spanning a 2-22 μmol range. Results were
expressed as g FFA/100 g lipid.
2.7 Lipid oxidation
Lipid hydroperoxides (PV) were determined using the ferric thiocyanate method described by
Santha and Decker (1994) with modifications according to Karlsdottir and others (2014) and
Cyprian and others (2015b). The results were expressed as μmol lipid hydroperoxides per kg
mince. Thiobarbituric acid-reactive substances (TBARS) were measured as described by Lemon
(1975) with modifications according to Cyprian and others (2015a) and Cyprian and others
(2015b). The results were expressed as μmol of malomaldehyde diethylacetal/kg mince.
Fluorescent compounds were determined with a Perkin-Elmer LS 50B fluorescent spectrometer
(Perkin–Elmer, Massachusetts, USA). The absorbance of the organic phase resulting from the
lipid extraction described earlier (Bligh and Dyer 1959) was measured at 393/463 and 327/415
nm excitation/emission maxima according to previous studies (Nguyen et al. 2012; Karlsdottir et
al. 2014). The fluorescence shift (OFR) was calculated as the ratio between the two relative
8
fluorescence intensity (RF) values at excitation/emission maxima 393/463 nm and 327/415 nm,
i.e. OFR = RF393/463nm/ RF327/415nm.
2.8 Microbial analyses
To determine microbial quality of dried capelin, aerobic plate count (TPC), molds and yeast
counts were carried out according to general microbiological principles. Samples were analyzed
in duplicate per package. Twenty five grams of minced fish were mixed with 225 ml of cooled
Maximum Recovery Diluent (MRD, Oxoid) in a stomacher bag to obtain a 10-fold dilution.
Blending was done in stomacher for one minute. Successive 10-fold dilutions were done as
required. TPC were determined by plating aliquots on plate count agar (PCA) using pour plate
technique. Enumeration of TPC was performed after 3 days incubation under aerobic conditions
at 30.0 ± 1.0 °C. Molds and yeast were determined from the aliquots by spread plating onto
Dichloran Rose-Bengal Chloramphenicol agar (DRCB-Agar) in Petri dishes. Molds and yeast
were counted separately after 5 days incubation at 22± 1 °C. The results were expressed as log
CFU/g minced sample.
2.9 Sensory evaluation with Generic Descriptive Analysis (GDA)
A sensory panel of 10 members participated in the GDA of the dried capelin. All participants
were trained according to international standards (ISO, 1993b) including detection and
recognition of tastes and odors, and in the use of scales. The members of the panel were familiar
with the GDA method and experienced in sensory evaluation. The panel used an unstructured
scale from 0 to 100 (Stone and Sidel 1985) to evaluate rancid odor and stock-fish odor. About 5
cm portions were cut from individual capelin after removing the head and tail. The samples were
placed in aluminum boxes coded with 3-digit numbers that did not indicate sample group nor
storage time or packaging method. Each panelist evaluated duplicates of samples in a random
order in two sessions. A computerized system (FIZZ, Version 2.0, 1994–2000, Biosystemes,
France) was used for data recording.
2.10 Data analysis
Data analyses were done using Microsoft Excel 2010 (Microsoft Inc. Redmond, Wash., U.S.A.).
One way analysis of variance (ANOVA), Duncan’s test (Post-hoc) and Pearson correlation
9
analysis were performed on means of the variable values in the statistical program NCSS 2000
(NCSS, Utah, USA). Multivariate comparison of different variables and samples was performed
using Principal Component Analysis (PCA) on mean level corrected variable values using full
cross-validation in the Unscrambler ® statistical program (Version 8.0 CAMO, Trondheim,
Norway).
3 Results and discussion
3.1 Lipid, water content and water activity
Lipid content of raw fish decreased from early to late February and was significantly (p < 0.05)
different between the batches with values of 10%, 9.0% and 7.5% in C1, C2 and C3,
respectively. The corresponding water content increased and was 73%, 75% and 77%. This is in
agreement with the variation in lipid content of capelin that is highest in late fall and gradually
decreases during migration in early winter to spawning in March/April (Bragadóttir et al. 2002)
and with the general inverse relationship between water and lipid content in fish (Cyprian et al.
2015a; Henderson et al. 1984).
The difference in lipid content of dried batches was also significant (p < 0.05) with values of
31%, 28% and 25%, and corresponding water content of 23%, 19% and 18% in DC1, DC2 and
DC3, respectively and water activity 0.758, 0.683 and 0.676. High lipid content reduced drying
rate with the less fatty capelin ending drier than the fattest capelin. The lipid is thought to play a
role in limiting the drying process (Cyprian et al. 2015b) by replacing the aqueous phase that
serves as vector for transfers or acting as a physical barrier to heat transfer. Dried capelin batches
had a moisture content < 25% and water activity < 0.80 that is enough to inhibit the growth of
harmful bacteria and assure product safety (Kilic 2009). During storage, lipid and water content
in dried packed capelin did not change significantly (p > 0.05) in any of the groups (data not
shown).
3.2 Fatty acids (FA) composition
Monoenic (MUFAs) fatty acids constituted 57-60% of the total lipid in dried capelin, followed
by saturated (SFAs) 20-21% and polyunsaturated (PUFAs) 19-22% of the total lipid (Table 1).
10
Raw and smoked capelin muscle lipid has been reported to have a high concentration of MUFAs
(46-57%) (Cyprian et al. 2015a) and Bragadóttir et al. (2002). The predominant acids among the
MUFAs were long-chain C22:1 (n-11 and n-9) and eicosenoic acid (C20:1n9). Proportions of
PUFAs were significantly (p < 0.05) higher in DC3 and DC2 compared to DC1. This may be
explained by relatively high phospholipid content in DC3 and DC2 (Cyprian et al. 2015a;
Parmentier et al. 2007). Eicosapentaenoic acid (EPA) and docosahexaenoic acid (DHA)
constituted about 13% of the total lipid.
Packaging methods influenced changes in the proportion of fatty acid groups in dried capelin
during storage (Figure 1). Proportion of PUFAs became lower in all batches during storage with
a corresponding increase in both SFAs and MUFAs. This is because PUFAs are highly
susceptible to oxidation (Karlsdottir et al. 2014; Nguyen et al. 2012). Oxidation of PUFAs
appeared to be reduced more by vacuum packaging of fattest capelin (DC1) than in less fat
capelin (DC3 and DC2). This as discussed in section 3.3 could be explained by differences in
phospholipids proportion (Shah et al. 2009).
3.3 Lipid hydrolysis
Proportion of phospholipids (PL) expressed as g phosphatidyl-choline equivalent/100 g lipid was
significantly (p < 0.05) lower with increased lipid content of dried capelin being 25%, 15% and
8% of total lipid in DC3, DC2 and DC1, respectively (Figure 2 A, B, C). The main lipid
components in fish are triacylglycerols and PL. Diet of the fish affects the proportion of PL by
either increasing or decreasing triacylglycerols (Standal et al. 2010; Burri et al. 2012), leading to
increase or decrease in total lipids (Mørkøre et al. 2007). Phospholipids are membrane lipids
with relatively constant absolute content, explaining why the proportion of PL is higher in less
fatty than fatty capelin.
PL hydrolysis in dried capelin was rapid in all batches during early storage and most rapid in
DC3 with the highest proportion of PL (Figure 2 A, B, C). The relatively higher PL content at
the beginning of storage declining as storage progressed may explain the reduced rate of
hydrolysis with time. Rapid PL hydrolysis in DC3 may be attributed to the occurrence of
substrate specific enzymes such as phospholipases that catalyze cleavage of hydrophilic
phospho-diester bonds but not of lipophillic triacylglycerols. Also, a higher proportion of the
11
highly susceptible PUFAs especially n-3 PUFAs in PL than triacylglycerols (Parmentier et al.
2007) can explain the difference in rate of hydrolysis between batches of dried capelin, why
rapid hydrolytic activities occurred with high PL content (DC3 ˃ DC2 ˃ DC1). Packaging
methods (open, sealed and vacuum) did not have significant effects on PL hydrolysis (Figure 2
A, B, C), supporting the explanation that PL hydrolytic processes were largely driven by
enzymatic activities (Chaijan et al. 2006; Shah et al. 2009).
Free fatty acids (FFA) content was the highest in dried capelin with the lowest fat content and
the highest proportion of PL (Figure 2D, E, F). FFA increased in all groups and most rapidly
during early storage and with significantly (p < 0.05) higher values for DC3 than the other
groups. FFA content increased while PL content declined (significant correlation r = -0.54)
indicating that FFA evolution was mainly due to PL degradation. Hydrolysis of glycerol-fatty
acid esters occurs in fish muscle lipid with the liberation of free fatty acids (Chaijan et al. 2006;
Lopez-Amaya and Marangoni, 2000). The development trends of FFA in different groups can be
explained by the corresponding PL hydrolysis. Packaging methods did not affect the FFA
formation which is in agreement with the PL hydrolytic results (Figure 2 D, E, F). Generally, the
results indicate that lipid hydrolysis was mainly influenced by PL content with DC3
demonstrating a greater hydrolysis and suggesting that DC1 was more stable than less fatty
capelin (i.e. DC2 and DC3 group).
3.4 Lipid oxidation
Lipid content and packaging methods significantly (p < 0.05) affected the hydroperoxides
formation, where PV developed fastest in fattier capelin and open bags (Figure 3 A, B, C). The
difference between groups and packaging method depends on fat content and access to oxygen
necessary for lipid oxidation. Peroxide value increased during storage in open and sealed bags
except towards the end of storage when it decreased in the fattier DC1 and DC2 open bags
(Figure 3 A, B). The increase was due to the formation of hydroperoxides which are primary
lipid oxidation products. Hydroperoxides accumulate during the initial oxidation process but
decrease later, as the rate of cleavage and reactions exceed their formation (Cyprian et al. 2015a;
Underland et al. 1999). Therefore, the progressive increase in PV during storage in open and
sealed bags and a decline observed in DC1 and DC2 open bags towards the end of storage
12
indicate the vulnerability of dried capelin to lipid oxidation, but more so in DC1 and DC2 open
bags. Similar results were obtained with color changes (L* and b* values on CIELAB color
scale) (data not shown), associated with lipid oxidation products (Cyprian et al. 2015b). Peroxide
value of vacuum packed capelin was stable during storage (Figure 3 C). It is known that vacuum
packaging can delay lipid oxidation by limiting access to oxygen thereby preserving the quality
of muscle foods (Etemadian et al. 2012).
Thiobarbituric acid-reactive substances (TBARS) were the highest in groups with higher lipid
content, and showed a tendency of decreasing with storage time except in DC1 and DC2 open
bags increasing again towards the end of storage (Figure 3 D, E, F). The decrease in TBARS
during storage may be explained by the low decomposition of hydroperoxides into secondary
products of lipid oxidation (TBARS) as PV progressively increased. The results indicate a
negative correlation between PV and TBARS (r = -0.27). The interactions of protein components
(peptides and acid amines) with malonaldehyde to give tertiary lipid oxidation products might
have contributed to decrease in TBARS (Underland et al. 1999). Increase in TBARS in DC1 and
DC2 open bags towards the end of storage may be attributed to faster decomposition of existing
hydroperoxides into TBARS since the corresponding PV were decreasing. Packaging methods
had some impacts on TBARS decomposition with vacuum packed capelin being more stable
than open and sealed bags. The results are in conformity with PV data in explaining the
importance of limiting access to oxygen to minimize lipid oxidation.
At the beginning of storage fluorescence shift ratio (OFR) were not significantly (p > 0.05)
different between the batches, with OFR values of 1.05, 1.29 and 1.16 in DC1, DC2 and DC3,
respectively. Increase in OFR values during storage were dependent on the lipid content and
packaging methods (data not shown). The increase was higher in fattier dried capelin (DC1 and
DC2) in both open (9.9 and 5.0) and sealed (5.3 and 3.6) bags until towards the end of storage
when the fattiest fish (DC1) scored much higher (9.9) than in the other groups. Increases in OFR
values occurred in parallel to decreases in TBARS (even though no significant ((p ˃ 0.05))
inverse correlation r = -0.10 was obtained). OFR, tertiary products of lipid oxidation are derived
from complex interactions of protein components with secondary lipid oxidation products such
as malonaldehyde (Underland et al. 1999). Contrarily, when OFR in open bags DC1 increased
towards the end of storage, the corresponding TBARS content increased whereas PV decreased.
13
This may be due to interactions of hydroperoxides with protein components that has also been
reported to form fluorescence compounds (Nguyen et al. 2012). Packaging methods had a
considerable influence on OFR development with samples in open bags obtaining higher values
than sealed and vacuum packed.
3.5 Sensory evaluation with generic descriptive analysis (GDA)
The generic descriptive analysis (GDA) attributes used in this study to describe dried fish
degradation were rancid odor and stock-fish odor (a characteristic of dried fish). The rancid odor
increased whereas stock-fish odor decreased during storage (Table 2 A, B). Both lipid content
and packaging methods affected rancid odor (Table 2 A). A stronger rancid odor (p < 0.05) was
obtained in high fat DC3 as well as open packed samples. These results are in agreement with
lipid oxidation indicators discussed earlier, showing positive correlations (r = 0.67, 0.05, 0.13
with PV, TBARS & OFR, respectively). Rancid odor was below 20 on the scale of 0-100, a limit
that has been used to indicate the samples are becoming rancid (Magnusson et al. 2006). The
stock-fish odor was slightly reduced as storage time progressed, with higher reduction in fattier
and open packed capelin (Table 2 B). The changes were however, not significantly different (p ˃
0.05) by groups during storage. This can be explained by slow accumulation of TBARS with
storage since TBARS have a profound impact on food sensory properties (Stapelfeldt et al.
1997). Stock-fish odor was inversely correlated to PV and TBARS (r = -0.22 and -0.21,
respectively).
3.6 Microbial quality
At the beginning of storage, total plate count (TPC) was not significantly (p > 0.05) different
between the groups with values of log 5.48, 5.24, 5.38 colony-forming units in DC1, DC2 and
DC3, respectively. Slow microbial growth was obtained during storage of dried capelin with
TPC increments of less than log 1 colony-forming units by the end of storage. This may be
explained by the low moisture content (< 25%) and water activity (< 0.80) in dried capelin
batches, slowing down the growth of spoilage bacteria (Kilic 2009). Lipid content appeared to
have no effect on TPC development. The lowest TPC was found in vacuum packed capelin a fact
attributed to the air elimination retarding aerobic microorganisms’ growth. Yeast and molds were
generally not detected in the dried capelin except after extended storage in DC1 and DC2 open

14
bags. This may in addition to the low moisture content be explained by the drying conditions and
packaging methods used. Indoor drying, sealing and vacuum packaging minimized
contamination by microbes mainly air borne yeast and molds (Park et al. 2014). The results
indicate that dried capelin was microbiologically stable during storage.
3.7 Multivariate data analysis
Principal component analysis (PCA) was carried out to gain an overview of the similarities and
differences between the variables (Figure 4). Not all variables were analyzed at all sampling
points, therefore microbial and fatty acid composition data analyzed at the beginning, middle and
the end of storage were not included in the model. The samples varied mainly in phospholipid,
total lipid, water content and rancidity along the first principal component (PC-1), explaining
49% of the variations in the samples, mainly due to the difference in sample groups (i.e. lipid
content). Low lipid (DC3) samples were located to the left of the scores plot along PC-1
described by phospholipid and stock-fish odor variables whereas high lipid (DC1) samples were
located on the right side described mainly by the total lipid, water content and rancid odor. The
variables describing DC3 were negatively correlated to those that described DC1 capelin. DC2
capelin that had moderate lipid content were centrally located implying they were marginally
described by the variables that described both DC3 and DC1.
Samples also varied with regard FFA, PV and TBARS along the second principal component
(PC-2) accounting for 26% of the total variation, mainly due to the difference in packaging
methods storage time. As seen in Figure 4, samples are located on the lower side of PC-2 during
early storage described mainly by TBARS but also total lipid and on the upper side later during
storage described mainly by FFA, PV, and fluoresce. TBARS were negatively correlated with
the variables that described samples during later storage. The influence of packaging methods
was not clearly portrayed in the model.
4 Conclusions
The study proved that a stable and safe product at room temperature with moisture content less
than 25% and water activity of less than 0.80 could be produced by the raw material and drying
method used. But the capelin used must be chosen carefully due to its seasonal variation in lipid
15
content. The influence of lipid content on hydrolysis and oxidation as well as sensory properties
during storage at room temperature could be demonstrated even though all the batches in the
study were of medium lipid content (7.5- 10%). Lipid hydrolysis analyzed by proportion of PL
and FFA was fastest in the lowest lipid capelin which can be explained by higher proportion of
PUFAs notably the long chain fatty acids EPA and DHA.
The state of lipid oxidation changed during storage. Primary hydroperoxides (PV) increased first
and then decreased during later storage. Secondary oxidation products (TBARs) were higher
with increased lipid content and tended to decrease during storage except in higher lipid groups
with access to oxygen towards the end of the 5 months at 22 °C. OFR values measuring tertiary
oxidation products were highest at the end of storage and highest in the fattiest product in open
bags. These conclusions were confirmed by the principal component analysis where the
variation in the data (49%) was explained by low lipid with high phospholipid content, and
stockfish odor, and highest lipid capelin with total lipids, water content and rancid odor.
Oxidation products explained 26% of the variation with early storage, TBARS and total lipids on
one side and PV, FFA, OFR and long term storage on the other side. The dried high lipid capelin
was more stable during storage if oxygen in the atmosphere was excluded by vacuum packaging
with less PV, odor and amount of microbes. The spoilage of lipids was both due to oxidation
(PUFAs and oxygen) and hydrolysis. It is recommended to test consumer acceptability of indoor
dried and vacuum packed high lipid capelin for markets accustomed to dried small fish.
Acknowledgements
The United Nations University- Fisheries Training Programme (Iceland) and AVS (Added Value
of Seafood) Fund of the Ministry of Fisheries and Agriculture, Iceland (Project No. FR 074-14)
provided financial support. The authors are thankful to Adalheidur Olafsdottir for guidance in
sample preparation, all the sensory panelists at MATÍS, and Magnea Karlsdottir for chemical
purchases. HB Grandi fishing company, Reykjavik, Iceland contributed the capelin and
Vestfirska Hardfisksalan provided drying facilities.
16
References
AOAC (2000) Fat in foods. In: Official methods of analysis of AOAC international 17th
ed (E.
Davi Ed.), Gaithersburg
Bellagha S, Sahli A, Farhat A, Kechaou N, Glenza A (2007) Studies on salting and drying of
sardine (Sardinella aurita): Experimental kinetics and modeling. J Food Eng 78(3): 947–952
Bernardez M, Pastoriza L, Sampedro G, Herrera JJR, Cabo ML (2005). Modified method for the analysis
of free fatty acids in fish. J Agricl and Food Chem 53:1903–1906.
Bligh EG, Dyer WS (1959). A rapid method of total lipid extraction and purification. Canadian J
Biochem and Physio 37:911–917.
Bragadóttir M, Pálmadóttir H, Kristbergsson K (2002). Seasonal changes in chemical composition and
quality parameters of capelin (Mallotus villosus). J Aquatic Food Prod Tech, 11(3/4):87–103.
Burri L, Hoem N, Banni S, Berge K (2012). Marine omega-3 phospholipids: metabolism and biological
activities. Int J Molec Sci 13(11). doi:10.3390/ijms131115401
Carscadden JE, Gjøsæter H, Vilhjálmsson H (2013). Recruitment in the Barents Sea, Icelandic, and
eastern Newfoundland/Labrador capelin (Mallotus villosus) stocks. Progress in Oceanography 114:84–96.
doi:10.1016/j.pocean.2013.05.006
Chaijan M, Benjakul S, Visessanguan W, Faustman C (2006). Changes of lipids in sardine (Sardinella
gibbosa) muscle during iced storage. Food Chem 99(1):83–91. doi:10.1016/j.foodchem.2005.07.022
Cyprian O, Nguyen VM, Sveinsdottir K, Jonsson A, Tomasson T, Thorkelsson G, Arason S (2015a).
Influence of smoking and packaging methods on lipid stability and microbial quality of Capelin (Mallotus
villosus) and Sardine (Sardinella gibossa). Food Sci & Nutri, In press, doi:10.1002/fsn3.233
Cyprian O, Nguyen VM, Sveinsdottir K, Jonsson A, Thorkelsson G, Arason S (2015b). Influence of lipid
content and blanching on capelin (Mallotus villosus) drying rate and lipid oxidation under low
temperature drying. Food Proc Eng, In press, doi:10.1111/jfpe.12215
Dewi R S, Huda N, Ahmad R (2011). changes in physicochemical properties, Micostructure and Sensory
Characteristics of Shark Dendeng Using Different Drying methods. American J Food Techn, 6(2), 149–
157.
Doe PE (2002). Fish drying. In H. A. Bremner (Ed.), Safety and quality issues in fish processing.
Cambridge England: Woodhead publishing limited. Retrieved from
http://www.enq.ufsc.br/disci/eqa5217/material_didatico/WP1540-18.pdf
Etemadian Y, Shabanpour B, Mahoonak AS, Shabani A (2012). Combination effect of phosphate and
vacuum packaging on quality parameters of Rutilus frisii kutum fillets in ice. Food Res Int 45(1):9–16.
doi:10.1016/j.foodres.2011.09.026
Henderson R J, Sargent J R, Hopkins CCE (1984). Changes in the content and fatty acid composition of
lipid in an isolated population of the capelin Mallotus villosus during sexual maturation and spawning.
Marine Biol 78(3). doi:10.1007/BF00393011
17
Hwang CC, Lin CM, Kung HF, Huang YL, Hwang DF, Su YC, Tsai YH (2012). Effect of salt
concentrations and drying methods on the quality and formation of histamine in dried milkfish (Chanos
chanos). Food Chem 135(2):839–844. doi:10.1016/j.foodchem.2012.05.035
ICES (2009). Report of the Working Group on Widely Distributed Stocks (WGWIDE) 2–8 September
2009. Copenhagen, ICES CM 2009/ACOM:12.
IOC (2012). Regional Fish Trade in Eastern and Southern Africa. Products and Markets. A Fish Traders
Guide. Indian Ocean Commission, SmartFish working Paper No 013, pp54.
ISO (1993a). Determination of moisture and other volatile matter content (6496). Geneva, Switzerland:
The international Organization for Standards.
ISO, 8586–1. (1993b). Sensory analysis-general guidance for the selection, training and monitoring of
assessors. Geneva, Switzerland: The International Organisation for Standardization.
Jain D (2006). Determination of Convective Heat and Mass Transfer Coefficients for Solar Drying of
Fish. Biosystems Engin 94(3):429–435. doi:10.1016/j.biosystemseng.2006.04.006
Karlsdottir MG, Sveinsdottir K, Kristinsson HG, Villot D, Craft BD, Arason S (2014). Effect of thermal
treatment and frozen storage on lipid decomposition of light and dark muscles of saithe (Pollachius
virens). Food Chem 164:476–484. doi:10.1016/j.foodchem.2014.05.068
Kilcast D, Subramaniam P (Eds.) (2000). The stability and shelf life of food. Cambridge England:
Woodhead publishing limited.
Kilic A (2009). Low temperature and high velocity (LTHV) application in drying: Characteristics and
effects on the fish quality. J Food Engin 91(1):173–182. doi:10.1016/j.jfoodeng.2008.08.023
Lemon DW (1975). An improved TBA test for rancidity. New Series Circular.
Lopez-Amaya C, Marangoni A (2000). Phospholipases. In F. Na. Haard & K. B. Simpson (Eds.), Seafood
Enzymes (pp. 91–119). New York: Marcel Dekker, Inc.
Magnússon H, Sveinsdóttir K, Lauzon H, Thorkelsdóttir Á, Martinsdóttir E (2006). Keeping quality of
desalted cod fillets in consumer packs. J Food Sci 71:70–76.
Mørkøre T, Netteberg C, Johnson L, Pickova J (2007). Impact of dietary oil source on product quality of
farmed Atlantic cod, Gadus morhua. Aquaculture 267:236–247.
Nguyen MV, Thorarinsdottir AK, Thorkelsson G, Gudmundsdottir A, Arason S (2012). Influences of
potassium ferrocyanide on lipid oxidation of salted cod ( Gadus morhua ) during processing , storage and
rehydration. Food Chem 131(4):1322–1331. doi:10.1016/j.foodchem.2011.09.126
Oduor-odote P, Shitanda D, Obiero M, Kituu G (2010). Drying characteristics and some quality attributes
of Rastrineobola argentia (Omena) and Stolephorus delicatulus (Kimarawali). Afric J of Food, Agric,
Nutri and Dev 10(8):2998–3014.
Park SY, Lee NY, Kim SH, Cho JI, Lee HJ, Ha SD (2014). Effect of ultraviolet radiation on the reduction
of major food spoilage molds and sensory quality of the surface of dried filefish (Stephanolepis cirrhifer)
fillets. Food Res Int 62:1108–1112. doi:10.1016/j.foodres.2014.05.060
18
Parmentier M, Mahmoud AS, Linder MC, Fanni J (2007). Polar lipids: n- 3 PUFA carriers for membranes
and brain: nutritional interest and emerging processes. Oleagineux, Corps Gras, Lipides 14:224–229.
Santha NC, Decker EA (1994). Rapid, sensitive, iron-based spectrophotometric methods for
determination of peroxide values of food lipids. Assoc Official Analyt Chem Int 77:421–424.
Shah AA, Tokunaga C, Kurihara H, Takahashi K (2009). Changes in lipids and their contribution to the
taste of migaki-nishin (dried herring fillet) during drying. Food Chem 115(3):1011–1018.
doi:10.1016/j.foodchem.2009.01.023
Standal IB, Axelson DE, Aursand M (2010). 13C NMR as a tool for authentication of different gadoid
fish species with emphasis on phospholipid profiles. Food Chem 121(2):608–615.
doi:10.1016/j.foodchem.2009.12.074
Stapelfeldt AK, Nielsen RB, Skibsted HL (1997). Effect of Heat Treatment, Water Activity andStorage
Temperature on the Oxidative Stability ofWhole Milk Powder. Int Dairy J 7:331–339.
Statistics Iceland (2015). Fisheries Catch and value of catch. April 5, 2015. Retrieved from
http://www.statice.is/Statistics/Fisheries-and-agriculture/Catch-and-value-of-catch (Acessed April 5,
2015)
Stewart JCM (1980). Colorimetric determination of phospholipids with ammonium ferrothiocyanate.
Analyt Biochem 104(1):10–14.
Stone H, Sidel JL (1985). Sensory Evaluation Practices. Florida. Orlanda, FL: Academic Press Inc.
Underland I, Hall G, Lingnert H (1999). Lipid oxidation in fillets of herring (Clupea harengus) during ice
storage. J Agric Food Chem 47(2):524–532.
Wu T, Mao L (2008). Influences of hot air drying and microwave drying on nutritional and odorous
properties of grass carp (Ctenopharyngodon idellus ) fillets. Food Chem 110:647–653.
doi:10.1016/j.foodchem.2008.02.058
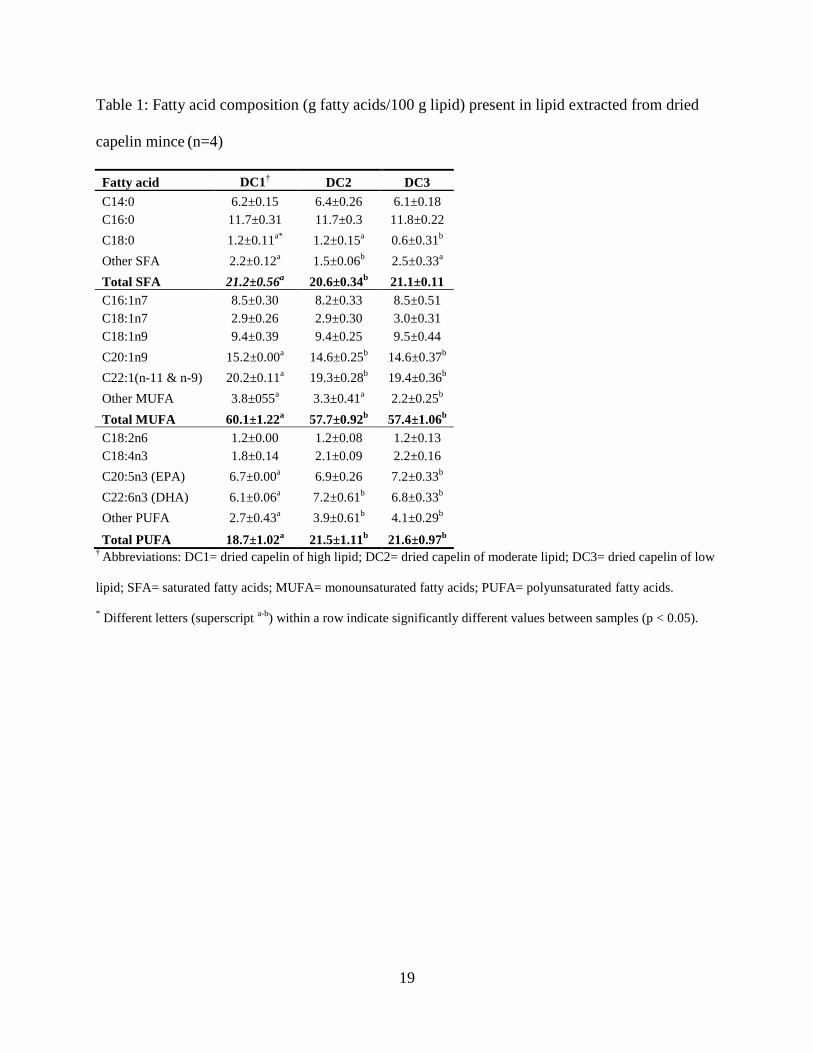
19
Table 1: Fatty acid composition (g fatty acids/100 g lipid) present in lipid extracted from dried
capelin mince (n=4)
Fatty acid DC1† DC2 DC3
C14:0 6.2±0.15 6.4±0.26 6.1±0.18
C16:0 11.7±0.31 11.7±0.3 11.8±0.22
C18:0 1.2±0.11a*
1.2±0.15a 0.6±0.31
b
Other SFA 2.2±0.12a 1.5±0.06
b 2.5±0.33
a
Total SFA 21.2±0.56a 20.6±0.34
b 21.1±0.11
C16:1n7 8.5±0.30 8.2±0.33 8.5±0.51
C18:1n7 2.9±0.26 2.9±0.30 3.0±0.31
C18:1n9 9.4±0.39 9.4±0.25 9.5±0.44
C20:1n9 15.2±0.00a 14.6±0.25
b 14.6±0.37
b
C22:1(n-11 & n-9) 20.2±0.11a 19.3±0.28
b 19.4±0.36
b
Other MUFA 3.8±055a 3.3±0.41
a 2.2±0.25
b
Total MUFA 60.1±1.22a 57.7±0.92
b 57.4±1.06
b
C18:2n6 1.2±0.00 1.2±0.08 1.2±0.13
C18:4n3 1.8±0.14 2.1±0.09 2.2±0.16
C20:5n3 (EPA) 6.7±0.00a 6.9±0.26 7.2±0.33
b
C22:6n3 (DHA) 6.1±0.06a 7.2±0.61
b 6.8±0.33
b
Other PUFA 2.7±0.43a 3.9±0.61
b 4.1±0.29
b
Total PUFA 18.7±1.02a 21.5±1.11
b 21.6±0.97
b
† Abbreviations: DC1= dried capelin of high lipid; DC2= dried capelin of moderate lipid; DC3= dried capelin of low
lipid; SFA= saturated fatty acids; MUFA= monounsaturated fatty acids; PUFA= polyunsaturated fatty acids.
* Different letters (superscript
a-b) within a row indicate significantly different values between samples (p < 0.05).

20
Table 2:Mean sensory scores (scale 0-100) of rancid odor (A) and stock-fish odor (B) of dried capelin (n=2)
Group Packaging
(bags)
A Storage time (months) B Storage time (months)
0 1 2 3 4 5
0 1 2 3 4 5
DC1† Open *** 4.5
a 8.4
b 10.9
b 15.3
c 14.8
c 16.5
c 45.7 44.6 47.5 48 46 45
Sealed *** 4.5a 6.6
a 7.5
a 7.4
a 10.3
b 13.6
c 45.7 45.2 47.4 41.9 40.5 42.7
Vacuum ** 4.5a 4.9
ab 4.6
a 6
c 5.7
bc 7.3
c * 45.7
a 45.2
a 43.2 36.7
b 38.1 37.1
DC2 Open *** 3.6a 5.8
b 3.4
a 5.4
b 9.1
c 10.8
c 50 48.7 45.7 45.9 45.9 48.1
Sealed ** 3.6a 4.7
a 4.5
a 4.6
a 7.2
b 7.3
b * 50
a 48.9
a 47.7 49.7
a 42.3
b 47.5
Vacuum ** 3.6a 3.8
a 2.8
a 3
a 3.6
a 6.5
b ** 50
a 42.2
b 51.3
a 48.2
ac 44.9
bc 38.8
b
DC3 Open ** 3.2a 4.1
a 6.2
b 5.5
b 6.8
b 6.3
b ** 57.8
a 46.6 45.6 49.7
a 45.8
b 46.6
Sealed 3.2 4 5.1 4.4 4.4 4.3 57.8 49.1 48.2 46.6 48.6 46.9
Vacuum ** 3.2a 3.2
b 3.5
b 3.3
b 2.8
b 5.9
c * 57.8
a 53.3 49.5
b 51.1 52.6 51.6
†Abbreviations: DC1= dried capelin of high lipid; DC2= dried capelin of moderate lipid; DC3= dried capelin of low lipid.
* p < 0.05; ** p < 0.01; *** p < 0.001 (significant difference in a sensory attribute with storage time, different letters (superscript a-c
) within a row under the
same sensory attribute indicate significant different values)
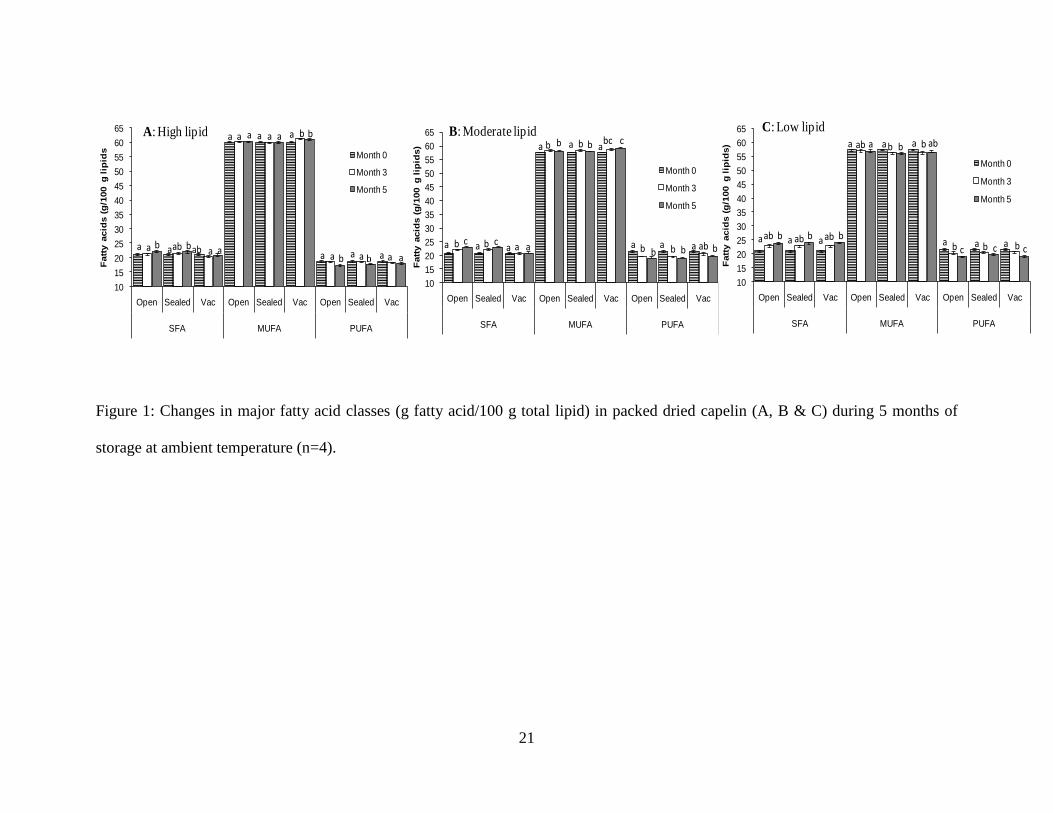
21
10
15
20
25
30
35
40
45
50
55
60
65
Open Sealed Vac Open Sealed Vac Open Sealed Vac
SFA MUFA PUFA
Fatt
y a
cid
s (
g/1
00 g
lip
ids)
Month 0
Month 3
Month 5
a b c a b ca a a
a b b a b b abc c
a b ba b b a ab b
B: Moderate lipid
10
15
20
25
30
35
40
45
50
55
60
65
Open Sealed Vac Open Sealed Vac Open Sealed Vac
SFA MUFA PUFA
Fatt
y a
cid
s (
g/1
00 g
lip
ids)
Month 0
Month 3
Month 5
aab b a ab b a ab b
a ab a ab b a b ab
a b ca b c a b c
C: Low lipid
10
15
20
25
30
35
40
45
50
55
60
65
Open Sealed Vac Open Sealed Vac Open Sealed Vac
SFA MUFA PUFA
Fatt
y a
cid
s (
g/1
00 g
lip
ids
Month 0
Month 3
Month 5
a ab bab a a
a a a a a a bb
a a b aa aa ab a
aA: High lipid
a
Figure 1: Changes in major fatty acid classes (g fatty acid/100 g total lipid) in packed dried capelin (A, B & C) during 5 months of
storage at ambient temperature (n=4).
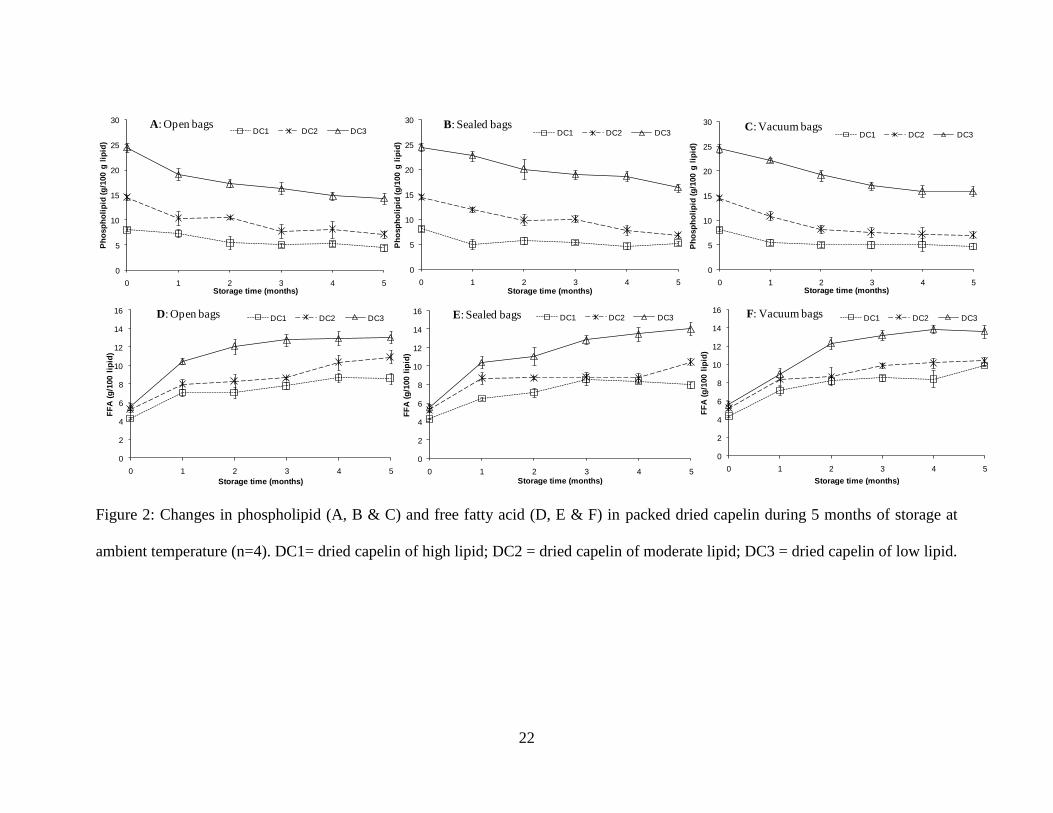
22
0
5
10
15
20
25
30
0 1 2 3 4 5
Ph
osp
ho
lip
id (g
/100 g
lip
id)
Storage time (months)
DC1 DC2 DC3B: Sealed bags
0
5
10
15
20
25
30
0 1 2 3 4 5
Ph
osp
ho
lip
id (g
/100 g
lip
id)
Storage time (months)
DC1 DC2 DC3A: Open bags
0
5
10
15
20
25
30
0 1 2 3 4 5
Ph
osp
ho
lip
id (g
/100 g
lip
id)
Storage time (months)
DC1 DC2 DC3C: Vacuum bags
0
2
4
6
8
10
12
14
16
0 1 2 3 4 5
FF
A (
g/1
00 l
ipid
)
Storage time (months)
DC1 DC2 DC3E: Sealed bags
0
2
4
6
8
10
12
14
16
0 1 2 3 4 5
FF
A (
g/1
00 l
ipid
)
Storage time (months)
DC1 DC2 DC3D: Open bags
0
2
4
6
8
10
12
14
16
0 1 2 3 4 5
FF
A (
g/1
00 l
ipid
)
Storage time (months)
DC1 DC2 DC3F: Vacuum bags
Figure 2: Changes in phospholipid (A, B & C) and free fatty acid (D, E & F) in packed dried capelin during 5 months of storage at
ambient temperature (n=4). DC1= dried capelin of high lipid; DC2 = dried capelin of moderate lipid; DC3 = dried capelin of low lipid.
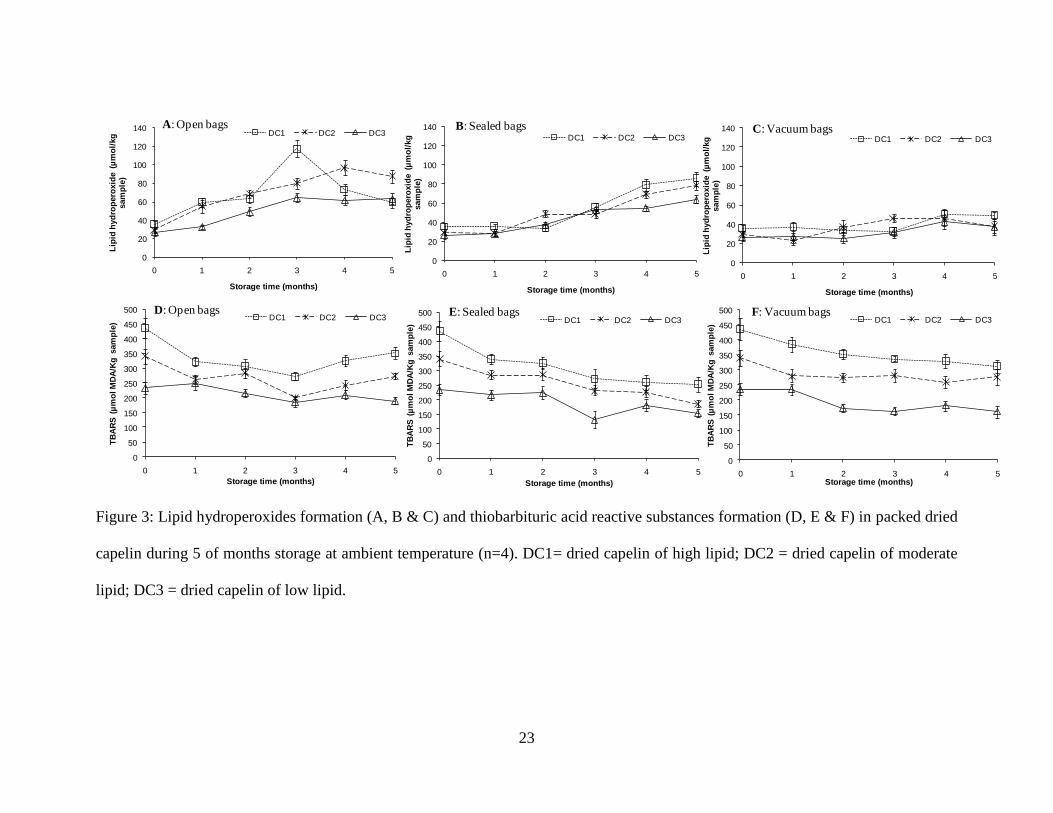
23
0
20
40
60
80
100
120
140
0 1 2 3 4 5
Lip
id h
yd
rop
ero
xid
e (
µm
ol/
kg
sam
ple
)
Storage time (months)
DC1 DC2 DC3
B: Sealed bags
0
20
40
60
80
100
120
140
0 1 2 3 4 5
Lip
id h
yd
rop
ero
xid
e (
µm
ol/
kg
sam
ple
)
Storage time (months)
DC1 DC2 DC3A: Open bags
0
20
40
60
80
100
120
140
0 1 2 3 4 5
Lip
id h
yd
rop
ero
xid
e (
µm
ol/
kg
sam
ple
)
Storage time (months)
DC1 DC2 DC3C: Vacuum bags
0
50
100
150
200
250
300
350
400
450
500
0 1 2 3 4 5
TB
AR
S (
µm
ol M
DA
/Kg
sam
ple
)
Storage time (months)
DC1 DC2 DC3E: Sealed bags
0
50
100
150
200
250
300
350
400
450
500
0 1 2 3 4 5
TB
AR
S (
µm
ol M
DA
/Kg
sam
ple
)
Storage time (months)
DC1 DC2 DC3D: Open bags
0
50
100
150
200
250
300
350
400
450
500
0 1 2 3 4 5
TB
AR
S (
µm
ol M
DA
/Kg
sam
ple
)
Storage time (months)
DC1 DC2 DC3F: Vacuum bags
Figure 3: Lipid hydroperoxides formation (A, B & C) and thiobarbituric acid reactive substances formation (D, E & F) in packed dried
capelin during 5 of months storage at ambient temperature (n=4). DC1= dried capelin of high lipid; DC2 = dried capelin of moderate
lipid; DC3 = dried capelin of low lipid.
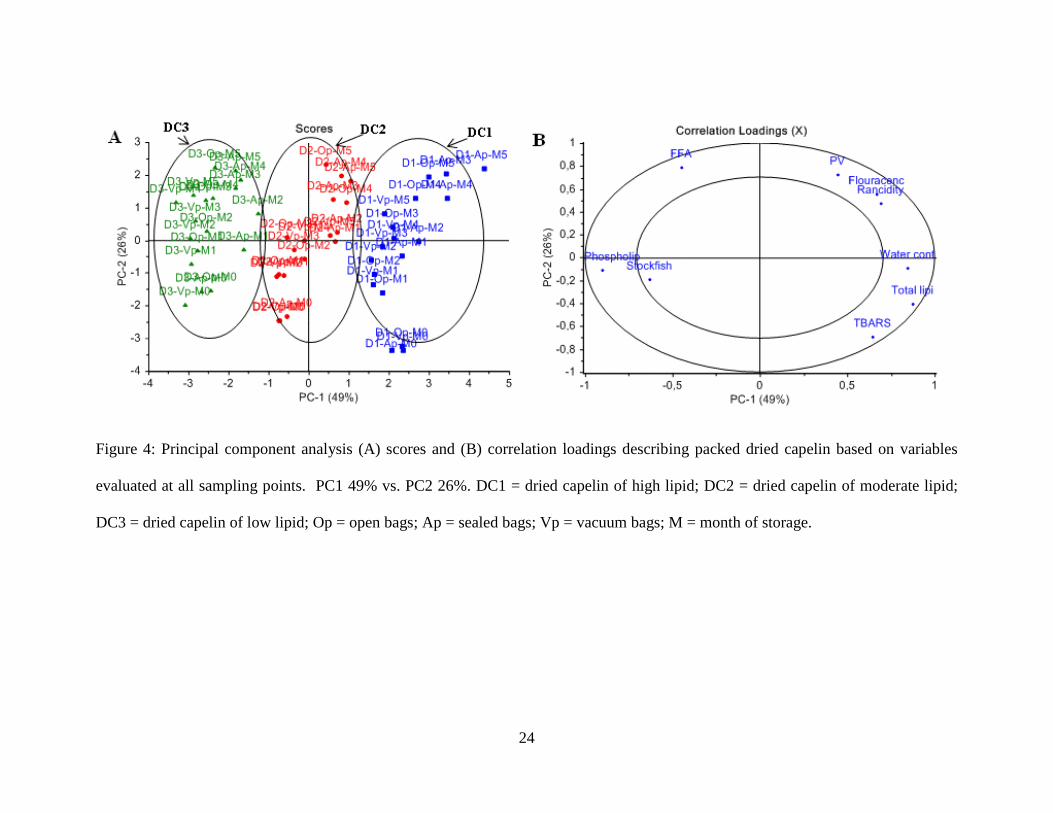
24
Figure 4: Principal component analysis (A) scores and (B) correlation loadings describing packed dried capelin based on variables
evaluated at all sampling points. PC1 49% vs. PC2 26%. DC1 = dried capelin of high lipid; DC2 = dried capelin of moderate lipid;
DC3 = dried capelin of low lipid; Op = open bags; Ap = sealed bags; Vp = vacuum bags; M = month of storage.
1
PAPER VI
Marketing potential of improved dried sardine (Sardinella gibossa) and capelin (Mallotus
villosus) in markets accustomed to traditional dried fish
Cyprian, O. O., Sveinsdottir, K., Johnsson, A., Tomasson, T., Thorkelsson, G., Arason, S.
Journal of Sensory Studies
Under review
VI
2
Marketing potential of improved dried sardine (Sardinella gibossa) and capelin (Mallotus
villosus) in markets accustomed to traditional dried fish
Running title: Marketing potential of improved dried fish
Odoli Cyprian1,4*
, Kolbrun Sveinsdottir2, Asbjorn Jonsson
2, Tumi Tomasson
3, Gudjon
Thorkelsson1,2
, Sigurjon Arason1,2
1Faculty of Food Science and Nutrition, University of Iceland, Eiríksgata 29, 101
Reykjavík, Iceland
2Matisohf. /Icelandic Food and Biotech R&D Vinlandsleid 12, Reykjavik, Iceland
3United Nations University Fisheries Training programme, Skulagata 4, IS-121 Reykjavik,
Iceland
4Kenya Marine & Fisheries Research Institute, P.O Box 81651, Mombasa, Kenya
Corresponding author. Tel. +3548627565; Fax +3544225001
E-mail address: [email protected]
3
ABSTARCT
Traditional dried small fish are an important source of protein for low income people in
many developing countries. The aim of this study was to determine the marketing potential of
improved dried sardine and capelin as new products in markets accustomed to traditional dried
fish. One hundred and twenty participants were recruited among shoppers at supermarkets and
open-air markets in Kenya. Each participant received 500 g of each product to be prepared and
consumed at home, before evaluating acceptability and willingness to buy. The products
obtained high acceptability ratings. Middle income classes were willing to pay up to KSH 600
for 500 g of capelin but KSH 400 for sardine, while low income classes were willing to pay up to
KSH 400 the reference price for both products. There is market potential for new dried small fish
products that are of improved quality among consumers accustomed to traditionally dried fish.
PRACTICAL APPLICATIONS
Small pelagic fish species are among the important fisheries in the world with sustained
catch stocks; nonetheless, small quantities are used fresh, dried or salted for human food. In this
paper the marketing potential of improved dried small fish species such as capelin, as new
products in the markets accustomed to traditional dried fish is assessed. The study shows that
there is market potential for new dried small fish products that are of improved quality among
consumers accustomed to traditional dried fish, and that the middle income classes are willing to
pay more for improved quality. Consumption of improved dried small species may contribute to
reduction of malnutrition that is prevailing in many developing countries, and as well increase
the utilization of less valued species such as capelin for human food.
Key words: Marketing, capelin, sardine, acceptability, willingness to buy
1 INTRODUCTION
In Eastern Africa, particularly Kenya, Uganda and Tanzania, there is a high demand for
dried fish, mainly small pelagic species (IOC, 2012). Originally the main market for small
pelagic fish was the animal feeds industry. However, due to an increase in human population,
4
reduced availability of high value fish species in local markets and improved fish drying
methods, over 80% of small pelagic fish now goes to human consumption (IOC, 2012).
Consumer preference for dried small pelagic fish is not only because of the flavor, but also the
reasonable price, availability and stability during storage (Peter Oduor-Odote et al., 2010). Dried
small pelagic fish are traditionally sold in open-air markets in small portions to meet the needs of
the low income class (FAO 2007; Oduor-Odote et al. 2010).
The growth of the middle class in East Africa (African Development Bank, 2011) and
reduced availability of high value species (IOC, 2012) has resulted in a demand for premium
dried small pelagic fish. Small pelagic fish dried on improved traditional racks that are raised
ventilated platforms in open-air, are widely available in open-air markets (Peter Oduor-Odote et
al., 2010). But their quality varies extremely due to dependence on weather conditions and often
does not meet the local food regulation standards (Kenya Bureau of Standards 2015; Langat and
Rey 1999). Quality uncertainty notwithstanding, small quantities of packed fresh water dagaa
(Rastrineobola argentea) from Lake Victoria dried on racks have gained access to national retail
stores, largely supermarkets, although a much higher proportion is still sold unpackaged in open-
air markets.
There is awareness of the nutritional and health benefits associated with fish
consumption, especially the omega-3 polyunsaturated fatty acids (Bilgin et al. 2008; Stołyhwo et
al. 2006). Dried small fish are highly nutritious (Jain & Pathare, 2007) and improving the
quality, and marketing in national retail stores is likely to increase consumption among the
middle class. This will raise the value of the fishery thereby creating more employment and
higher income along the value chain, especially among women who play an important role in the
processing and marketing of this fishery (Schuurhuizen, Van-Tilburg, & Kambewa, 2006).
Fresh water dagaa (Rastrineobola argentea) landed from the Kenyan part of Lake
Victoria was 92,000 MT in 2013 comprising about 54% of total catch of fish in Kenya (Lake
Victoria Basin Commission, 2015; Munguti et al., 2014). Sardine landings was reported at 881
tons in 2013 corresponding to about 10% of the 9,000 tons of artisanal marine fish landed in
Kenya (Warui, 2014). This is probably an underestimate. Low valued fish are often
underreported in Kenya (Malleret-King et al., 2009; Gitonga, 2005) and sardine is caught using
5
light attraction at night and landed early in the morning before enumerators start work. The total
small fish landings in Kenya cannot meet the existing demand (IOC, 2012). Most developing
countries import low value fish while they export more valuable species landed from their
waters. In 2012 Kenya exported a total of 10,165 metric tons of fish and fish products valued at
KES 4,000 million (approximately 40 million USD) (State department of Fisheries Kenya 2012).
Over the same period 2,622 metric tons of fish mainly frozen mackerels (62.3%) and sardines
(13.7%) were imported largely from Japan, Pakistan and Korea.
Capelin landing in Iceland has exceeded half a million tons in recent years (Statistics
Iceland, 2015). A small portion of it particularly female is used for human food, with about 80%
reduced to fishmeal and oil (Statistics Iceland, 2015). Female capelin is exported to Japan and
Europe as whole fresh/frozen product or roe while male capelin and females without roe is
reduced to fish meal and oil (Statistics Iceland 2015; Shahidi et al. 1995). Therefore, there is a
potential to introduce dried male capelin as a new product into markets accustomed to small
dried fish especially in developing countries.
The choice and acceptability of a food product is mainly based on sensory properties. If a
product has low sensory acceptability, no brand or nutritional and/or health benefit promise will
manage to get it accepted by consumers (Sosa et al. 2008; Hough et al. 2006). But if a product
has high sensory acceptability, there are additional issues that have to be resolved to ensure
overall acceptability for instance packaging, price, convenience and cultural habits. In the East
African markets, fish price is a major determinant of consumer purchasing decisions (IOC,
2012). Before deciding on the introduction of a new product into the market it is necessary to
obtain information about sensory acceptability and possible pricing of the product (Grunert et al.
2009; Sosa et al. 2008). Such information can also aid in deciding on the launching strategy.
Home use and standardized situation tests are universally used in consumer research
(Boutrolle et al. 2007; Sosa et al. 2008). Home use tests are more reliable as they are conducted
in a setting where the product being tested is normally consumed (Boutrolle et al. 2007;
Boutrolle et al. 2005). Larger amounts of products tend to be consumed in home use test and
consumers are free to choose when to prepare and consume the product (Boutrolle and others
6
2007, 2005). Since dried small fish are mainly cooked and consumed in the homes as part of the
main course of a meal, home use test was found to be ideal for the current study.
In Kenya, the majority of low income consumers shop for food in open-air markets
whereas middle income groups especially in towns and cities do most of their shopping in
supermarkets. Therefore Mombasa city and Kwale county in Kenya were selected for the study.
Mombasa is cosmopolitan in nature and hosts the main supermarkets along the Kenyan coast,
with the majority of its population belonging to middle income class (Ipsos-Synovate 2013;
Kenya National Bureau of Statistics 2015). The main sardine landing beaches along the Kenyan
coast are in Kwale county where consumption of dried sardine is widespread. Majority of the
population in Kwale belong to the low income class (Ipsos-Synovate 2013; Kenya National
Bureau of Statistics 2015).
The objective of this study was to determine the marketing potential of dried sardine of
improved quality and indoor dried capelin among low and middle income consumers presumed
to be represented by respondents shopping in open-air markets and supermarkets respectively.
The information is necessary to evaluate the feasibility of improving drying methods and
packaging of sardine, and the introduction of new dried fish products such as capelin to the
markets accustomed to traditionally dried small fish.
2 MATERIALS AND METHODS
2.1 Samples
Sardine were dried on raised rack drier in Mombasa, Kenya and packed in sealed
polyethylene bags weighing 500 g each before the study (water content 24%, fat 9%). Capelin
were dried under controlled drying conditions (O. Cyprian, Nguyen, Sveinsdottir, Jonsson,
Thorkelsson, et al., 2015) in Iceland and transported by air freight to Mombasa Kenya. Capelin
(water content 19.5%, fat 27%) was packaged in the same way as sardine in polyethylene bags
weighing 500 g. Processing and packaging complied with local food regulations (Kenya Bureau
of Standards 2015; Langat and Rey 1999).
7
2.2 Subjects/respondents
The study was carried out in Mombasa city and Kwale county that are located in the
southern part of the Kenyan coast.
Participants were recruited among shoppers in three supermarkets in Mombasa and three
open-air markets in Kwale county over a four week period. Participants were adults willing to
take part in the study. Participants contact details were obtained. In the open-air markets a local
person from each area was hired during the period of study to collect completed questionnaires.
Participants in supermarkets returned completed questionnaire at the supermarkets and those
who returned completed questionnaires could win a prize which was announced on the radio. A
total of 120 consumers participated; 60 supermarket shoppers and 60 open-air market shoppers.
A home use test was used in this survey. Participants were given a pack of the first
product (500 g) with the instructions that they were free to prepare the product as they habitually
do when it suited them best together with family and/or friends and complete the questionnaire
within one week. Completed questionnaires were returned by participants from supermarkets on
a specified date at the supermarket, and were collected during the first visit a week later for
participants from open-air markets. Once the completed questionnaires were collected, the
respondents received the second product (500 g) to be consumed within one week’s time.
Product presentation order was balanced while issuing out products with a half the number of
participants receiving the sardine first and the other half got the capelin first.
2.3 Questionnaire
Respondents rated their liking of the product appearance, flavour and texture using a 9-
point hedonic scale ranging from 1 (dislike extremely) to 9 (like extremely). Respondents were
also asked about their general willingness to buy and willingness to buy 500 g of the products at
Kenya shillings (KES) 200, 400, 600 and 800 on a 9-point scale from 1 (very unlikely) and 9
(very likely). The participants were informed that the price of dried sardine in the market was
around KES 400 (reference price). Socio-economic demographic questions (gender, religion,
education level, occupation, household size and who consumes dried fish in the household) was
also included in the questionnaire since they have been found to relate to the preferred type of
8
food and reason for purchase( Green et al. 2003; Obiero et al. 2014). The questionnaires were
translated into Swahili and briefly explained to participants when they received the first sample.
The whole process, across the study areas lasted four weeks.
2.4 Data analysis
Data was analyzed using the Statistical Package for the Social Sciences (IBM - SPSS Inc.
version 20.0). Descriptive analyses were done by use of means, standard error, percentages and
frequency distribution of responses. The influence of product presentation order, product liking
rating and willingness to buy based on the product type and shopping location were tested with
ANOVA (score = product x subject/consumers) followed Duncan’s means separation test (Post-
hoc) for differences between groups. P values of < 0.05 were considered significant.
3 RESULTS AND DISCUSSION
3.1 Socio-economic profile of fish consumers
A hundred and twenty completed questionnaires were collected (60 supermarket shoppers
and 60 open-air market shoppers) which is considered to be an adequate number for a consumer
test (Hough et al. 2006). The socio-demographic characteristics of the two groups differed
(supermarkets and open-air markets) except for gender that was relatively similar in both groups
(Table 1). Although more than half of the participants were women, the proportion was less than
expected as females are the primary shoppers of households in most parts of Africa (Obiero et al.
2014; Schuurhuizen et al. 2006). Women were less willing than men to participate in the study,
possibly because of a high rate of illiteracy among the women. Majority of respondents shopping
in open-air markets were Muslims unlike the supermarkets which were dominated by Christians.
This was expected given that the population of Kwale county is largely Muslims while a higher
proportion of the population in Mombasa is Christians. Religion is thought to have an influence
on respondents’ habits and could affect product acceptability. A majority of Muslims believe in
observing a certain ritual of slaughtering procedures for animals, negatively influencing some
believers from accepting dried fish produced by non Muslims.
Majority of the respondents shopping in open-air markets (72%) had only elementary
education or high school education level (28%) (Table 1). Majority of respondents shopping in
9
supermarkets had completed high school (63%), followed by those with a university degree
(30%) and elementary education (7%). Most of the respondents shopping in open-air markets
were working as fishermen (27%), businessmen (27%) and farmers (25%) with 47% of these
shoppers having a household size of 7-9 people. The respondents shopping in supermarkets were
mainly working for private companies (48%) and government (30%) with 46% of them having a
household size of 4-6 people.
Respondents shopping in open-air markets consumed dried fish more frequently (33%,
more than or equal to four times a week) than those shopping in supermarkets (5%, four times a
week or more often) (Table 2). This indicates that shoppers in open-air markets consume dried
fish on a regular basis. Consumption of dried fish was negatively influenced by education, with
high consumption frequency among less educated consumers (Table 2). Educated consumers are
generally more aware of the health and other benefits associated with fish consumption. In a
study on preferences for fish and seafood using an ‘evoked set’ analysis education was found to
positively influence preference for fish (Kinnucan et al., 1993). Health benefits are however
questionable when it comes to low quality products that may be contaminated. Kenyan
consumers consider dried small pelagic fish to be an inferior quality product sold mainly in rural
areas (Peter Oduor-Odote et al., 2010), where a majority of the population are poor with limited
education. A majority of respondents shopping in the supermarkets are most likely middle class
as they were mainly working for private companies or government and had relatively small
households. Therefore, they are able to purchase more expensive protein sources than dried fish
whose quality is uncertain and not often available in the supermarkets.
Dried fish is largely sold in open-air markets, with 95% and 58% of respondents
shopping in the open-air markets and supermarkets respectively purchasing dried fish in open-air
markets (Table 1). Forty two percent of supermarket shoppers and 5% open-air markets shoppers
purchased dried fish from supermarkets. The low proportion of consumers purchasing dried fish
from supermarkets is mainly attributed to restricted sales of dried fish to low price open-air
markets and people with low income in Kenya (Peter Oduor-Odote et al., 2010) with only small
quantities reaching national retail stores/supermarkets.
10
3.2 Product acceptability
The products were generally well received with acceptability rating scores ranging
between seven and eight (Table 3). Although the overall acceptability values were relative for
both products, respondents shopping in open-air markets rated both products higher than those
shopping in supermarkets. Open-air shoppers rated the products higher as are familiar and
regular consumers of dried fish. The result is in agreement with a study by Boutrolle et al. (2005)
who reported that greater familiarization with a product resulted in higher acceptability ratings.
Dried capelin had significantly (p<0.05) higher appearance rating irrespective of the
respondents’ shopping location. On the other hand, sardine obtained the higher flavor rating.
Liking of texture was not significantly different (p˃0.05) between the two locations, with a
higher rating for capelin at both locations. Capelin appears to be attractive to consumers but the
flavor was moderately ranked and needs to be improved. Both dried capelin and improved
processed sardine were acceptable in the Kenyan markets. This implies that new dried fish
products of superior quality can in general be accepted in Kenya and East African markets
accustomed to dried small fish.
The socio-demographic did not appear to influence product acceptability except for level
of education (Table 4). Education primarily determines the consumers occupation and in this
case the income (Obiero et al., 2014; Green et al., 2003; Kinnucan et al., 1993). Most
respondents shopping in the supermarkets commented that poor quality dried products
(contaminated with soil) and unavailability in national retail stores limited dried fish
consumption among the group. Even though the majority of respondents shopping in
supermarkets were irregular dried fish consumers, they rated products highly implying that they
might accept new dried fish products such as capelin if quality could be improved. Gender,
religion and household size had no significant influence on product acceptability.
3.3 Respondents’ willingness to buy
The results shows consumers were willing to buy the products irrespective of the
shopping location (Table 5). The average values of willingness to buy capelin and sardine were
relatively high and very close, with a significant difference (p<0.05) only obtained based on
respondents shopping location. Those shopping in open-air markets were more willing (p<0.05)
11
to purchase the products than those shopping in supermarkets. This may be because consumers
shopping in open-air markets were more familiar with dried fish.
On the specific amount of money the respondents were willing to pay for 500 g of the
product, open-air markets and supermarkets shoppers had high rating for both products at KSH
200, but significantly higher rating was obtained for capelin than sardine (Table 5). Consumers
were not willing to pay more than the reference price of KSH 400 for improved dried sardine,
but supermarket shoppers were willing to pay up to KSH 600 for dried capelin (Table 5). The
unwillingness of consumers to pay more than the reference price for sardine could be that they
were not able to see the difference of improved dried sardine from traditionally dried. Sosa and
others (2008) reported food product choice and acceptability to be based on the sensory
properties. Sardine was dried in enclosed drier that depended on weather conditions and may
have only reduced contaminations from the environment (such as soil) but not lipid oxidation
that affects color development during drying resulting in unattractive products. Also the
reference price used in the study was based on the supermarket price of a product similar to the
improved sardine used in this study and therefore more expensive than traditional dried sardine
sold at about KSH 300 in open-air markets.
These results indicate that a high market potential exists for dried small fish among the
low income class but can be enhanced among the middle income consumers if quality is
improved, especially appearance, as willingness to buy capelin at a higher price than sardine
appeared to be based on the appearance (Table 3).
4 CONCLUSIONS
Dried capelin and improved dried sardine received relatively high acceptability ratings.
However the products differed in definite attributes with capelin obtaining significantly higher
ratings for appearance, while sardine obtained significantly higher flavor ratings. Consumers
shopping in supermarkets considered to represent middle income groups were willing to pay up
to KSH 600 for 500 g of capelin. Consumers shopping in open-air markets who consume dried
fish on regular basis were willing to buy 500 g of dried capelin and sardine at up to KSH 400.
The consumers of traditional dried small fish as well as new consumers especially in the middle
income class might accept new dried fish products if overall quality could be guaranteed. A
12
follow-up study covering a large geographical area is recommended to assess business
feasibility.
ACKNOWLEDGMENT
The authors greatly acknowledge the United Nations University- Fisheries Training
Programme (Iceland), Kenya coastal development project (KCDP) and AVS (Added Value of
Seafood) Fund of the Ministry of Fisheries and Agriculture, Iceland (Project No. FR 074-14) for
financial support. The authors are thankful to Síldarvinnslan Neskaupstað fishing company,
Reykjavik, Iceland for capelin contribution. Mr. Raymond Ruwa is thanked for translating the
questionnaire to Swahili and leading the consumer surveys.
REFERENCES
AFRICAN DEVELOPMENT BANK. 2011. Kenya Country Strategy Paper 2014-2018. Nairobi,
Kenya.
BILGIN, Ş., ÜNLÜSAYIN, M., İZCI, L. and GÜNLÜ, A. 2008. The Determination of the Shelf
Life and Some Nutritional Components of Gilthead Seabream ( Sparus aurata L ., 1758 ) after
Cold and Hot Smoking. Turk. J. Vet. Anim. Science, 32(1), 49–56
BOUTROLLE, I., ARRANZ, D., ROGEAUX, M. and DELARUE, J. 2005. Comparing central
location test and home use test results: Application of a new criterion. Food Quality and
Preference, 16(8), 704–713. doi:10.1016/j.foodqual.2005.03.015
BOUTROLLE, I., DELARUE, J., ARRANZ, D., ROGEAUX, M. and KÖSTER, E. P. 2007.
Central location test vs. home use test: Contrasting results depending on product type. Food
Quality and Preference, 18(3), 490–499. doi:10.1016/j.foodqual.2006.06.003
CYPRIAN, O., NGUYEN, V.M., SVEINSDOTTIR, K., JONSSON, A., THORKELSSON, G.
and ARASON, S. 2015. Influence of lipid content and blanching on capelin (Mallotus villosus)
drying rate and lipid oxidation under low temperature drying. Food Process Engineering, In
press, doi:10.1111/jfpe.12215
FAO. 2007. Fishery country profile: Republic of Kenya. FID/CP/KEN/FAO, Rome, Italy.
FAO. 2010. The state of world fisheries and aquaculture. Food and Agriculture Organization of
the United Nations, Rome Italy
13
GITONGA, N. 2005. Status of major marine fish stock. In The promotion of sustainable and
equitable fisheries access agreements (pp. 13–16). June 20 -21, White Sands Hotel Dar es
Salaam, Tanzania
GREEN, J., DRAPER, A. and DOWLER, E. 2003. Short cuts to safety: risk and “rules of
thumb” in accounts of food choice. Health, Risk and Society, 5(1), 33–52
GRUNERT, K.G., JUHL, H.J., ESBJERG, L., JENSEN, B.B., BECH-LARSEN, T., BRUNSØ,
K. and MADSEN, C. Ø. 2009. Comparing methods for measuring consumer willingness to pay
for a basic and an improved ready made soup product. Food Quality and Preference, 20(8), 607–
619. doi:10.1016/j.foodqual.2009.07.006
HOUGH, G., WAKELING, I., MUCCI, A., CHAMBERS, E., GALLARDO, I. M. and ALVES,
L.R. 2006. Number of consumers necessary for sensory acceptability tests. Food Quality and
Preference, 17(6), 522–526. doi:10.1016/j.foodqual.2005.07.002
IOC. 2012. Regional Fish Trade in Eastern and Southern Africa. Products and Markets. A Fish
Traders Guide. Indian Ocean Commission, SmartFish working Paper No 013, pp54
IPSOS-SYNOVATE. 2013. Kenya coast survey: Development, Marginalisation, Security and
Participation. Nairobi, Kenya: USAID/Kenya Transition Initiative (KTI)-COast programme
JAIN, D. and PATHARE, P. B. 2007. Study the drying kinetics of open-sun drying of fish.
Journal of Food Engineering, 78(4), 1315–1319. doi:10.1016/j.jfoodeng.2005.12.044
KENYA BEREAU OF STANDARDS. 2015. Fish and fishery products (regulation No.
KEBS/TC 017). Retrieved from http://kebs.org/index.php?opt=standards&view=Food and
Agriculture
KENYA NATIONAL BEREAU OF STATISTICS. 2015. Government statistics Kenya. Kenya
National Bereau of Statistics. Retrieved from http://www.knbs.or.ke/
KINNUCAN, H., NELSON, R. and HIARIEY, J.U. 1993. Preferences for fish and seafood: An
evoked set analysis. Marine Resource Economics, 8, 273–291
LAKE VICTORIA BASIN COMMISSION. 2015. Lake Victoria fish landing data. Lake
Victoria Basin Commision, Jinja Uganda
LANGAT, A.K. and REY, B. 1999. Kenya’s efforts to secure sanitary standards of fishery
products. Dossier Bulletin, 12(2-3), 11–13
14
MALLERET-KING, D., KING, A., MANGUBHAI, S., TUNJE, J., MUTURI, J., MUENI, E.
and ON’GANDA, H. 2009. Understanding fisheries associated livelihoods and constraints to
their development in Kenya and Tanzania. FMSP Project R8196
MUNGUTI, J.M., KIM, J.D. and OGELLO, E.O. 2014. An Overview of Kenyan Aquaculture:
Current Status, Challenges, and Opportunities for Future Development. Fisheries and Aquatic
Sciences, 17(1), 1–11
OBIERO, K.O., OPIYO, M.A, MUNGUTI, J. M., ORINA, P.S., KYULE, D., YONGO, E. and
CHARO-KARISA, H. 2014. Consumer preference and marketing of farmed Nile Tilapia
(Oreochromis niloticus) and African Catfish (Clarias gariepinus) in Kenya : Case Study of
Kirinyaga and Vihiga Counties. International Journal of Fisheries and Aquactic Studies, 1(5),
67–76
ODUOR-ODOTE, P., SHITANDA, D., OBIERO, M. and KITUU, G. 2010. Drying
characteristics and some quality attributes of Rastrineobola argentia (Omena) and Stolephorus
delicatulus (Kimarawali). African Journal of Food, Agriculture, Nutrition and Development,
10(8), 2998–3014
SCHUURHUIZEN, R., VAN-TILBURG, V. and KAMBEWA, E. (2006). Fish in Kenya: The
Nile-perch chain. In R. Ruben, M. Slingerland, & H. Nijhoff (Eds.), AGRO-FOOD CHAINS
AND NETWORKS FOR DEVELOPMENT (pp. 155–164). Netherlands
SHAHIDI, F., HAN, X.Q. and SYNOWIECKI, J. 1995. Production and characteristics of protein
hydrolysates from capelin (Mallotus villosus). Food Chemistry, 53(3), 285–293.
doi:10.1016/0308-8146(95)93934-J
SOSA, M., MARTINEZ, C., MARQUEZ, F. and HOUGH, G. 2008. Location and scale
influence on sensory acceptability measurements among low-income consumers. Journal of
Sensory Studies, 23(5), 707–719. doi:10.1111/j.1745-459X.2008.00181.x
STATISTICS ICELAND. 2015. Fisheries Catch and value of catch. April 5, 2015. Retrieved
from http://www.statice.is/Statistics/Fisheries-and-agriculture/Catch-and-value-of-catch
(Acessed April 5, 2015)
STOŁYHWO, A., KOŁODZIEJSKA, I. and SIKORSKI, Z. E. 2006. Long chain
polyunsaturated fatty acids in smoked Atlantic mackerel and Baltic sprats. Food Chemistry,
94(4), 589–595. doi:10.1016/j.foodchem.2004.11.050
WARUI, W. 2014. Optimal management policy for the Kenyan marine artisanal fishery. Masters
thesis; Environment and Natural Resource department, University of Iceland
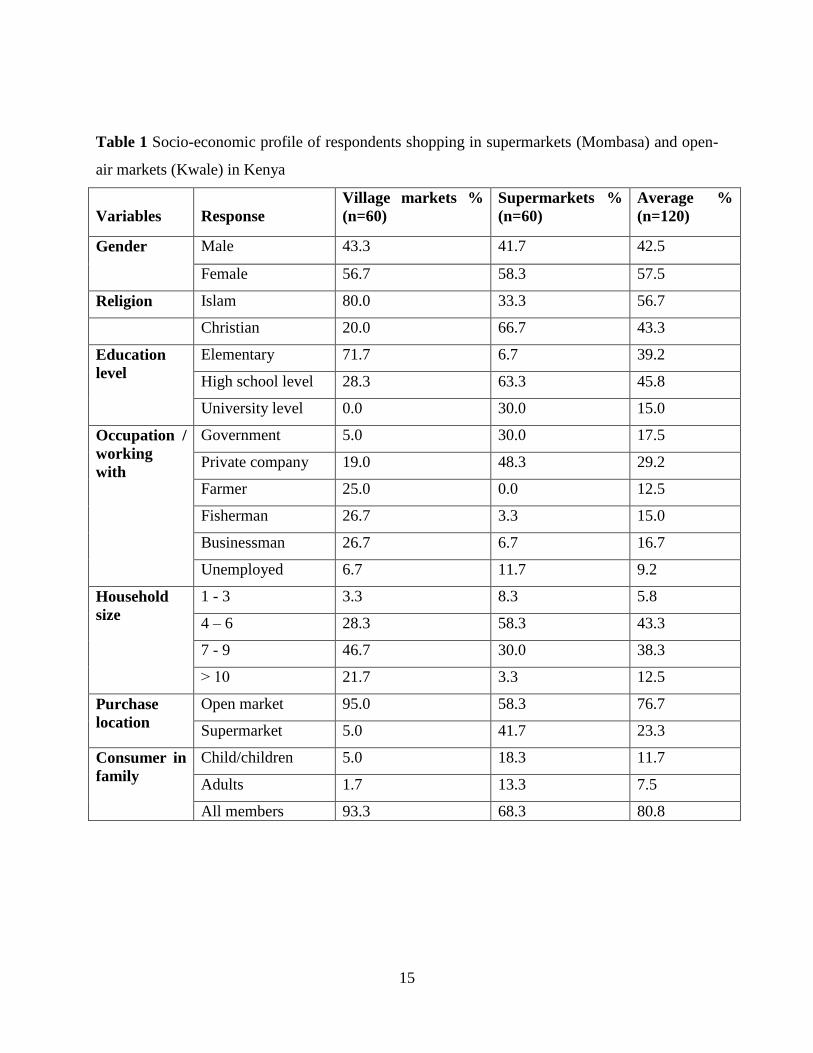
15
Table 1 Socio-economic profile of respondents shopping in supermarkets (Mombasa) and open-
air markets (Kwale) in Kenya
Variables
Response
Village markets %
(n=60)
Supermarkets %
(n=60)
Average %
(n=120)
Gender Male 43.3 41.7 42.5
Female 56.7 58.3 57.5
Religion Islam 80.0 33.3 56.7
Christian 20.0 66.7 43.3
Education
level
Elementary 71.7 6.7 39.2
High school level 28.3 63.3 45.8
University level 0.0 30.0 15.0
Occupation /
working
with
Government 5.0 30.0 17.5
Private company 19.0 48.3 29.2
Farmer 25.0 0.0 12.5
Fisherman 26.7 3.3 15.0
Businessman 26.7 6.7 16.7
Unemployed 6.7 11.7 9.2
Household
size
1 - 3 3.3 8.3 5.8
4 – 6 28.3 58.3 43.3
7 - 9 46.7 30.0 38.3
˃ 10 21.7 3.3 12.5
Purchase
location
Open market 95.0 58.3 76.7
Supermarket 5.0 41.7 23.3
Consumer in
family
Child/children 5.0 18.3 11.7
Adults 1.7 13.3 7.5
All members 93.3 68.3 80.8
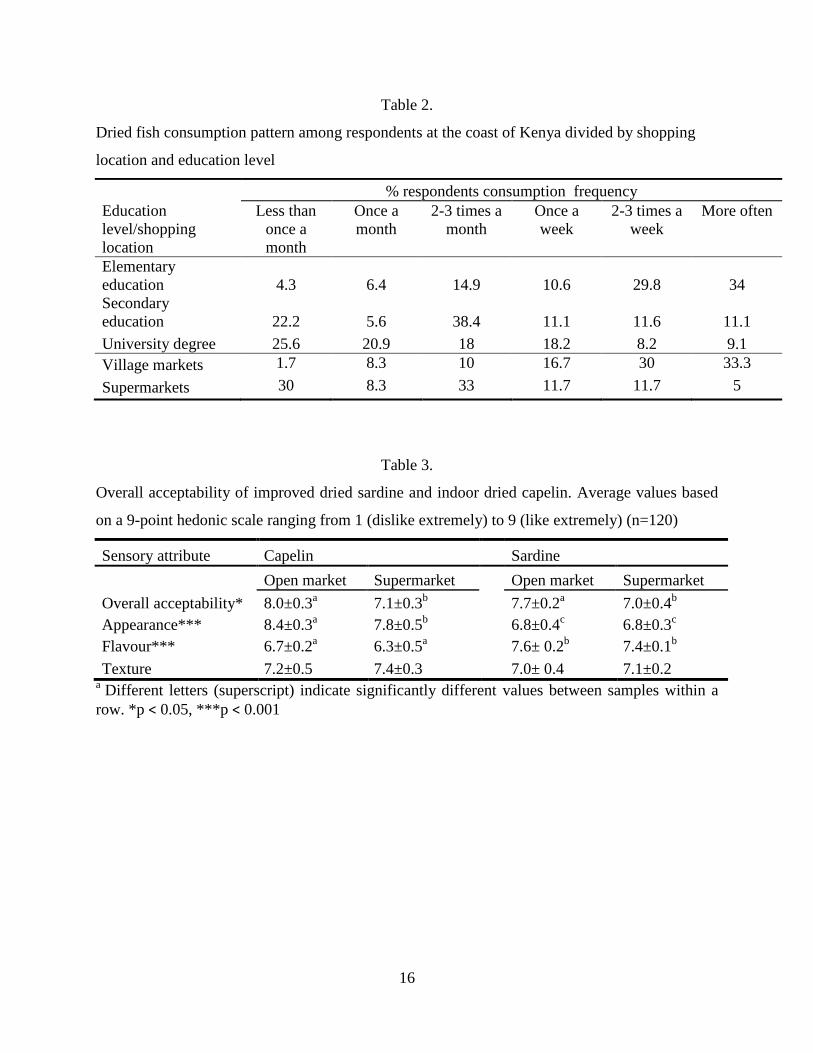
16
Table 2.
Dried fish consumption pattern among respondents at the coast of Kenya divided by shopping
location and education level
% respondents consumption frequency
Education
level/shopping
location
Less than
once a
month
Once a
month
2-3 times a
month
Once a
week
2-3 times a
week
More often
Elementary
education 4.3 6.4 14.9 10.6 29.8 34
Secondary
education 22.2 5.6 38.4 11.1 11.6 11.1
University degree 25.6 20.9 18 18.2 8.2 9.1
Village markets 1.7 8.3 10 16.7 30 33.3
Supermarkets 30 8.3 33 11.7 11.7 5
Table 3.
Overall acceptability of improved dried sardine and indoor dried capelin. Average values based
on a 9-point hedonic scale ranging from 1 (dislike extremely) to 9 (like extremely) (n=120)
Sensory attribute Capelin Sardine
Open market Supermarket
Open market Supermarket
Overall acceptability* 8.0±0.3a 7.1±0.3
b
7.7±0.2a 7.0±0.4
b
Appearance*** 8.4±0.3a 7.8±0.5
b
6.8±0.4c 6.8±0.3
c
Flavour*** 6.7±0.2a 6.3±0.5
a
7.6± 0.2b 7.4±0.1
b
Texture 7.2±0.5 7.4±0.3 7.0± 0.4 7.1±0.2 a
Different letters (superscript) indicate significantly different values between samples within a
row. *p < 0.05, ***p < 0.001
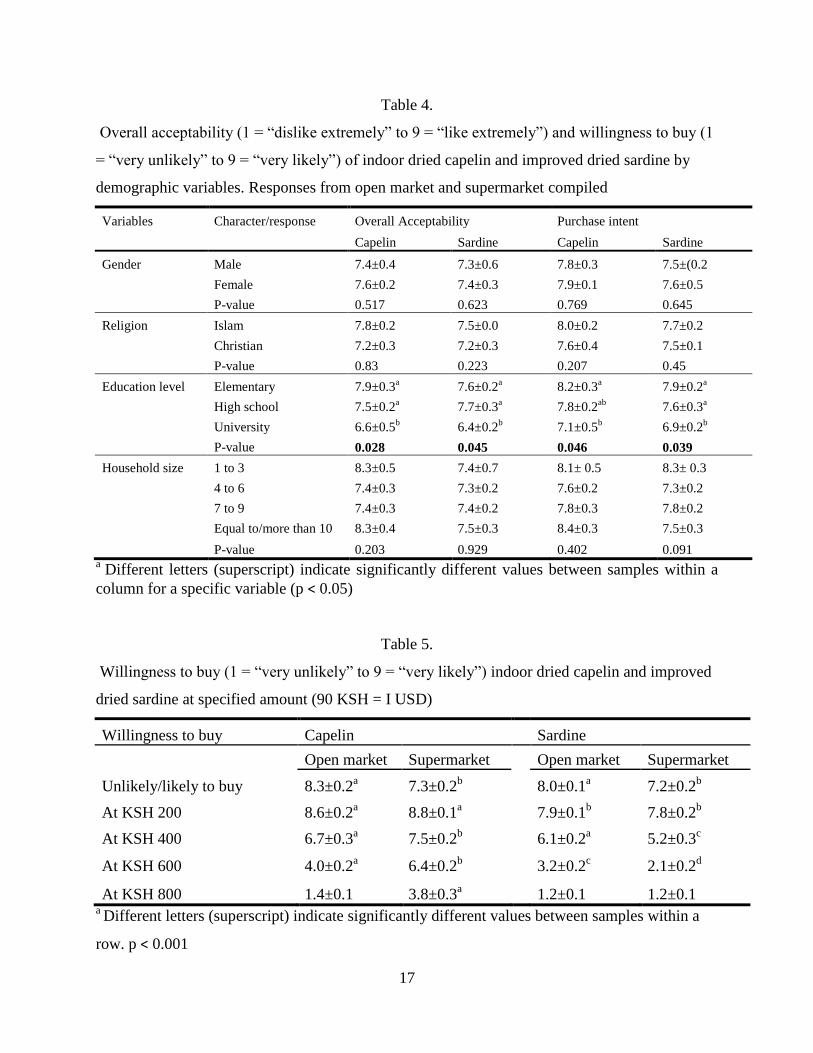
17
Table 4.
Overall acceptability (1 = “dislike extremely” to 9 = “like extremely”) and willingness to buy (1
= “very unlikely” to 9 = “very likely”) of indoor dried capelin and improved dried sardine by
demographic variables. Responses from open market and supermarket compiled
Variables Character/response Overall Acceptability Purchase intent
Capelin Sardine Capelin Sardine
Gender Male 7.4±0.4 7.3±0.6 7.8±0.3 7.5±(0.2
Female 7.6±0.2 7.4±0.3 7.9±0.1 7.6±0.5
P-value 0.517 0.623 0.769 0.645
Religion Islam 7.8±0.2 7.5±0.0 8.0±0.2 7.7±0.2
Christian 7.2±0.3 7.2±0.3 7.6±0.4 7.5±0.1
P-value 0.83 0.223 0.207 0.45
Education level Elementary 7.9±0.3a 7.6±0.2
a 8.2±0.3
a 7.9±0.2
a
High school 7.5±0.2a 7.7±0.3
a 7.8±0.2
ab 7.6±0.3
a
University 6.6±0.5b 6.4±0.2
b 7.1±0.5
b 6.9±0.2
b
P-value 0.028 0.045 0.046 0.039
Household size 1 to 3 8.3±0.5 7.4±0.7 8.1± 0.5 8.3± 0.3
4 to 6 7.4±0.3 7.3±0.2 7.6±0.2 7.3±0.2
7 to 9 7.4±0.3 7.4±0.2 7.8±0.3 7.8±0.2
Equal to/more than 10 8.3±0.4 7.5±0.3 8.4±0.3 7.5±0.3
P-value 0.203 0.929 0.402 0.091 a
Different letters (superscript) indicate significantly different values between samples within a
column for a specific variable (p < 0.05)
Table 5.
Willingness to buy (1 = “very unlikely” to 9 = “very likely”) indoor dried capelin and improved
dried sardine at specified amount (90 KSH = I USD)
Willingness to buy Capelin Sardine
Open market Supermarket
Open market Supermarket
Unlikely/likely to buy 8.3±0.2a 7.3±0.2
b
8.0±0.1a 7.2±0.2
b
At KSH 200 8.6±0.2a 8.8±0.1
a
7.9±0.1b 7.8±0.2
b
At KSH 400 6.7±0.3a 7.5±0.2
b
6.1±0.2a 5.2±0.3
c
At KSH 600 4.0±0.2a 6.4±0.2
b
3.2±0.2c 2.1±0.2
d
At KSH 800 1.4±0.1 3.8±0.3a 1.2±0.1 1.2±0.1
a Different letters (superscript) indicate significantly different values between samples within a
row. p < 0.001