a dissertation doctor of philosophy
TRANSCRIPT
STARCH ACETATE AS A FILM FORMING EXCIPIENT
IN CONTROLLED DRUG DELIVERY
by
íHAMMAD TAWHIDUL HAQUE NUTAN, B.Pharm. (Honors), M.Pharm.
A DISSERTATION
IN
PHARMACEUTICAL SCIENCES
Submitted to the Graduate Faculty of Texas Tech University Health Sciences Center
in Partial Fulfillment of the Requirements for the Degree of
DOCTOR OF PHILOSOPHY
Advisory Committee
Mansoor A. Khan (Chairperson) Fakhml Ahsan Necip Guven
Quentin R. Smith Bi-Botti Celestin Youan
Accepted
Dean of the Graauate School of Biomedical Sciences Texas Tech University Health Sciences Center
August, 2004
ACKNOWLEDGEMENTS
AIl praise belongs to AUah, the Almighty who let me complete the highest level
of academic studies. It was His mercy that maintained everything favorable for my
research.
Dr. Mansoor A. Khan, my graduate advisor is the person who had the greatest
influence on my research. It was a wonderfxxl experience to work under his supervision.
His intellect guided me to overcome all barriers in research. His indefatigable patíence
made me believe that everything is easy.
I am thankful to my committee members. Dr. Quentin Smith, being the chair of
the department, confirmed the perfect environment for research. My research project
could not be completed unless he had allowed me to work in his lab at a cmcial situation.
Drs. Fakhrul Ahsan and Celestin Youan always encouraged my work. I am grateful to
them for giving new ideas for research. Dr. Necip Guven is highly acknowledged for
providing the facilities for X-ray diffraction and scaiming electron microscopic studies.
I would also like to thank Drs. Siddiqui, Srivenugopal, and Abbmscato for their
contributions to my research. I would also like to express my gratitude to all the
professors whose valuable class lectxires helped me understanding the details of the
courses in pharmaceutical area.
The foUowing graduate students and lab personnel are acknowledged for their
tímely help: Ehab, Dr. Soliman, Dr. Zaghloul, Siva, Sami, Rakhi, Alamdar, Anitha,
Nusrat, Fatíma, Beena and Manjinder.
11
I am thankful to Dr. William Wilber of Noveon, Inc, BrecksviIIe, OH, for helping
me to determine the molecular weights of starch and starch acetate and glass transition
temperature of starch acetate powder and Mr. Kazuo Ogawa of Yonago National College
of Technology, Japan, for his valuable advice in starch acetate synthesis.
My special thanks go to Dr. Mohammad A. Rashid, Dean of Faculty of Pharmacy,
University of Dhaka, Bangladesh. I had the first taste of my academic research under his
supervision during my master's study.
I am always grateful to my parents Fatema Haque and Md. Enamul Haque who
brought me up to this stage of my life. They would be the proudest persons in the world
to know about my graduation. I am extremely indebted to my wife Manna Salowa, who
sacrificed four years of her life staying away from mc I cannot repay my little son
Amob, who missed his father for such a long time at the very beginning of his life. I am
also grateful to my younger brother Nayan for his moral support during my study.
Finally, I respectfuUy remember my ancestors for their invaluable role in my success.
ni
TABLE OF CQNTENTS
ACKNOWLEDGEMENTS ii
ABSTRACT xiii
LIST OF TABLES xvi
LIST OF FIGURES xvin
CHAPTER
I. INTRODUCTION I
Starch Family I
Microscopic Stmcture of Starch 6
Starch Esters 8
Starch Acetate 10
Novel Dmg Delivery Systems 11
Benefíts of ControUed Dmg Delivery Systems 13
Modifíed Release Dmg Delivery Systems 13
Extended Release Dosage Forms 14
Delayed Release Dosage Forms 14
Targeted Release Dosage Forms 14
Types of ControUed Release Dosage Forms 15
Matrix Devices 15
lon-Exchange Systems 16
Hydrodynamically Balanced Systems 17
IV
Gastrointestinal Therapeutic Systems 17
Microencapsulation 18
Coprecipitates 19
Multi-Particulate Dmg Delivery Systems 19
Advantages of Multi-Particulate Systems 19
Manufacturing of Multi-Particulate Systems 20
Dmg Release from Muhi-Particulate Systems 22
Fluidized Bed Coatíng 24
Polymers Used in Fluidized Bed Coating 27
Film Coating 28
Mechanism of Film Formatíon 29
Factor Affecting fílm formatíon 29
Formulation Variables 31
SolidContent 31
Coating Levels 31
Solubility of the Components 32
Characteristics of Substrate 32
Friability of the Core 33
Plasticization 33
Process Variables 34
Drying Temperature 34
Fluidized Air Volume 34
Spray Rate 35
Atomizing Pressure 35
Curing Conditions 36
Glass Transition Temperature and the Role of Plasticizer 36
Optímization Techniques in Product Formulation 39
Experimental Designs 40
First-Order Designs 41
Mixture Designs 41
Simplex Lattice 41
Extreme Vertices 42
Fractional Factorial Designs 42
Plackett-Burman Screening Designs 43
Koshal Design 44
Latin Square Design 44
Hadamard Matrix 44
Orthogonal Arrays 45
Second-Order Designs 46
Factorial Designs 46
Box-Behnken Design 47
Central Composite Design 49
Face Centered 49
Orthogonal 50
VI
Rotatable 50
Methods of Qptimization 50
Simple Inspection 51
Evolutionary Operations 51
Lagrangian Method 51
Grid Search Method 52
Computer Optimization 52
OtherMethods 53
Artificial Intelligence 53
Artificial Neural Network 54
ANN Models and Leaming Algorithm 58
Application of ANN in Pharmaceutical Technology 62
Characterization Techniques Used 63
Scanning Electron Microscopy 64
X-ray Powder Diffractometry 65
Fourier Transform Infrared Spectroscopy (FTIR) 67
Differential Scanning Calorimetry 69
Mechanical Testing of Films 69
Surface Roughness Study 72
Model Dmg Used in the Study 74
Dyphylline as a Model Dmg 74
Physical Properties of Dyphylline 74
Vll
Pharmacological Properties of Dyphylline 76
Pharmacokinetícs of Dyphylline 78
Commercial Preparatíons of Dyphylline 79
II. PURPQSE OF STUDY 81
Hypothesis 81
Objectives 81
III. MATERIALS AND METHODS 83
Synthesis of Starch Acetate 83
Pregelatinizatíon of Com Starch 83
Acetylation of Pregelatinized Com Starch 87
Characterization of Synthesized Starch Acetate 89
Measixrement of Degree of Substitution 90
Saponification-Titration Method 90
Fourier Transform Infrared Spectroscopy 91
X-ray Powder Diffractíon Study 91
Particle Size Analysis 92
Determination of Molecular Mass 92
Differentíal Scanning Calorimetry 93
Characterization of Starch Acetate in Solution 93
Rheological Studies 93
Measurement of Surface Tension 94
Preparation of Free Films 94
VIll
Characterization of Free Films 96
Mechanical Properties 96
Thermal Analysis 96
Scaiming Electron Microscopy 97
Diffusion Study 97
Compatibility Studies between the Dmg and Dmg Loading Excipients 100
Dmg Loading and Seal Coating 100
Content Analysis 102
UV Spectrophotometric Analysis 104
Controlled Release Coating 104
Dissolution Studies 106
Plackett-Burman Screening Design 106
Design for Qptimization 107
Response Surface Methodology 107
Artificial Neural Network 110
Optímization 110
Characterization of the Optimized Formulation 112
Surface Roughness Study 112
Effect of Gastric Acidity on the Optimized Formulation 112
Effect of Amylase on the Optimized Formulation 113
In F/voStudy 113
CoUectíon of Plasma Samples 113
IX
Extraction Procedure 114
Analysis of Plasma Samples 115
IV. RESULTS AND DISCUSSION 116
Synthesis of Starch Acetate 116
Characterization of the Synthesized Starch Acetate 119
Degree of Substitution 119
InfraredStudy 119
X-Ray Diffractíon Study 121
Particle Size Analysis 121
Molecular Mass 125
Differential Scanning Calorimetry 127
Further Characterization of Starch Acetate 127
Characterization of Starch Acetate in Solution 129
Rheological Studies 129
Surface Tension 132
Characterization of Free Films 132
Film Appearance and Homogeneity 132
Mechanical Properties 134
Thermal Analysis 137
SEMAnalysis 137
Difftision Study 140
Compatibility Studies between the Dmg and the Excipients 140
Thermal Analysis 140
FTIRAnalysis 145
Content Analysis 148
Plackett-Burman Screening Design 148
Polynomial Equations 149
ANOVA 156
ContourPIots 159
Selection of Important Factors 165
Response Surface Methodology 166
Experimental Designs and the Fitted Models 167
Standardized Main Effects (SME) and Reliability of the Models 173
Contour and Response Plots 173
Mechanism of Dmg Release 181
Optimization 185
Artificial Neural Network 188
Training 188
Model Statistics and Factor Response Interaction 188
Optimization 192
Comparative Study of RSM and ANN 196
Characterization of the Optímized Formulation 196
Thermal Analysis 196
X-ray Analysis 198
XI
FTIRAnalysis 198
SEMAnalysis 198
Surface Roughness Study 204
Effect of Acidic Environment on the Qptímized Beads 207
Effect of Amylase on the Optimized Beads 210
In F/voStudy 210
V. CONCLUSIONS AND SUGGESTIONS FOR FURTHER STUDIES 217
Conclusions 217
Suggestions for Further Studies 218
BIBLIOGRAPHY 219
xii
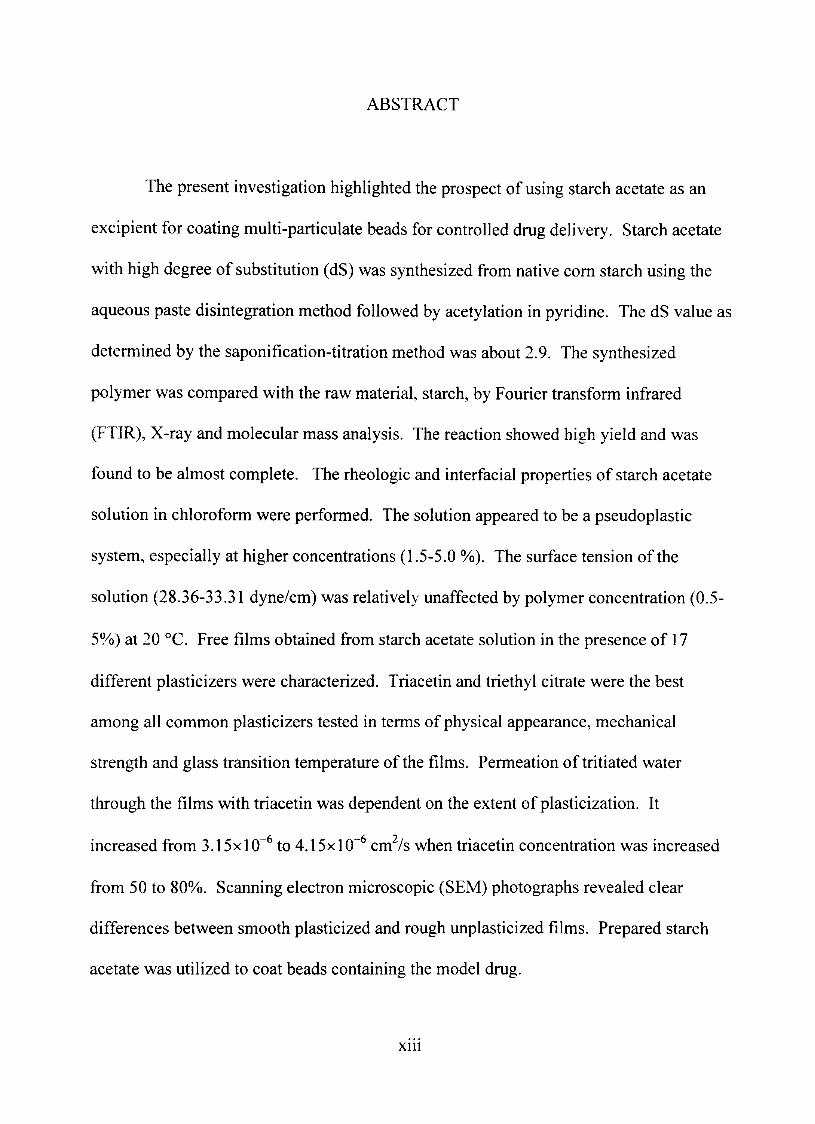
ABSTRACT
The present investigation highlighted the prospect of using starch acetate as an
excipient for coating multi-particulate beads for controUed dmg delivery. Starch acetate
with high degree of substitution (dS) was synthesized from native com starch using the
aqueous paste disintegration method followed by acetylation in pyridine. The dS value as
determined by the saponification-titration method was about 2.9. The synthesized
polymer was compared with the raw material, starch, by Fourier transform infrared
(FTIR), X-ray and molecular mass analysis. The reaction showed bigh yield and was
found to be almost completc The rheologic and interfacial properties of starch acetate
solution in chloroform were performed. The solution appeared to be a pseudoplastic
system, especially at higher concentrations (1.5-5.0 %). The surface tension of the
solution (28.36-33.31 dyne/cm) was relatively unaffected by polymer concentration (0.5-
5%) at 20 °C. Free films obtained from starch acetate solution in the presence of 17
different plasticizers were characterized. Triacetin and triethyl citrate were the best
among all common plasticizers tested in terms of physical appearance, mechanical
strengíh and glass transition temperature of the films. Permeation of tritiated water
through the films with triacetin was dependent on the extent of plasticization. It
increased from 3.15x10"^ to 4.15x10"^ cm^/s when triacetin concentration was increased
from 50 to 80%. Scanning electron microscopic (SEM) photographs revealed clear
differences between smooth plasticized and rough unplasticized films. Prepared starch
acetate was utilized to coat beads containing the model dmg.
xin
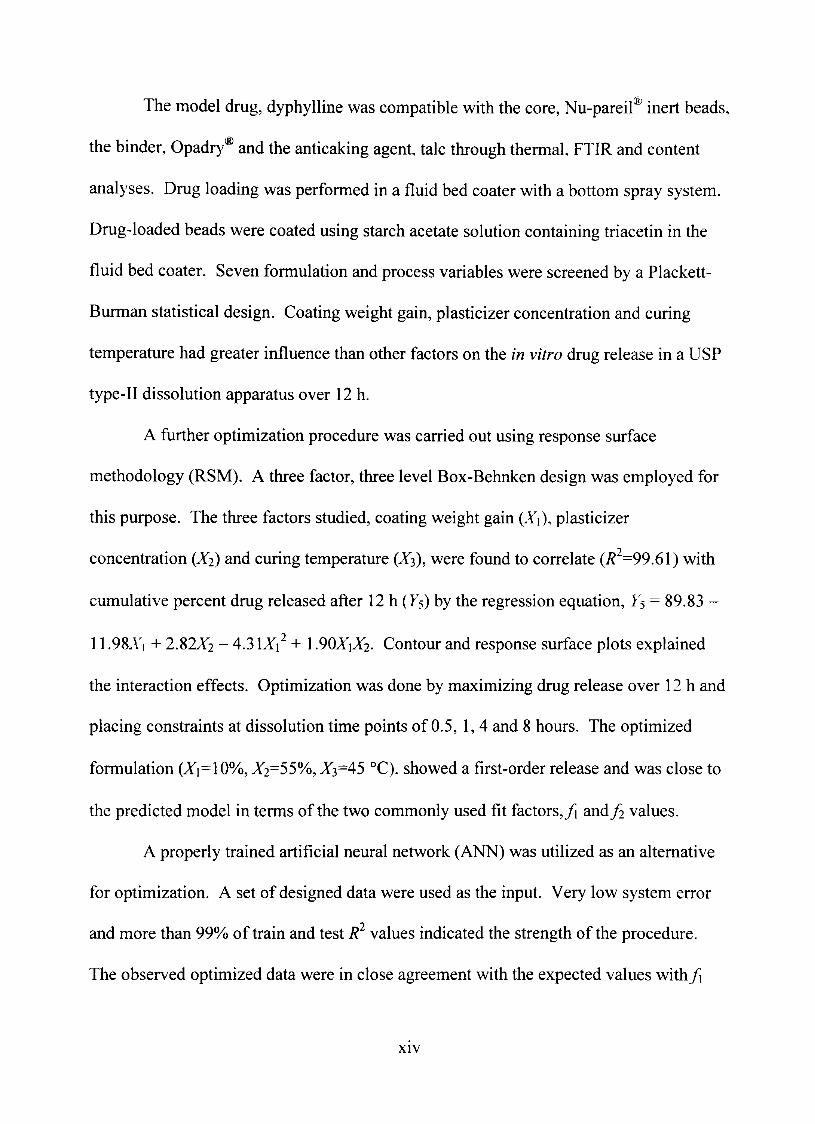
The model dmg, dyphylline was compatible with the core, Nu-pareil'^ inert beads,
the binder, Qpadry® and the anticaking agent, talc through thermal, FTIR and content
analyses. Dmg loading was performed in a fluid bed coater with a bottom spray system.
Dmg-Ioaded beads were coated using starch acetate solution containing triacetin in the
fluid bed coater. Seven formulation and process variables were screened by a Plackett-
Burman statistical design. Coating weight gain, plasticizer concentration and curing
temperature had greater influence than other factors on the in vitro dmg release in a USP
type-II dissolution apparatus over 12 h.
A further optimization procedure was carried out using response surface
methodology (RSM). A three factor, three level Box-Behnken design was employed for
this purposc The three factors studied, coating weight gain (X\). plasticizer
concentration (X2) and curing temperature (X3), were foxmd to correlate (i?^=99.61) with
cumulative percent dmg released after 12 h (Ys) by the regression equation, Y^ = 89.83 -
11.98.Vi + 2.82^2 - 4.3 IX\^ + 1 .90A'IJL2. Contour and response surface plots explained
the interaction effects. Optimization was done by maximizing dmg release over 12 h and
placing constraints at dissolution time points of 0.5, 1, 4 and 8 hours. The optimized
formulation (Xi=10%, 2=55%, ^3=45 °C). showed a first-order release and was close to
the predicted model in terms of the two commonly used fit factors,/i and/2 values.
A properly trained artificial neural network (ANN) was utilized as an altemative
for optimization. A set of designed data were used as the input. Very low system error
and more than 99% of train and test 7? values indicated the strength of the procedure.
The observed optimized data were in close agreement with the expected values wi th /
XIV
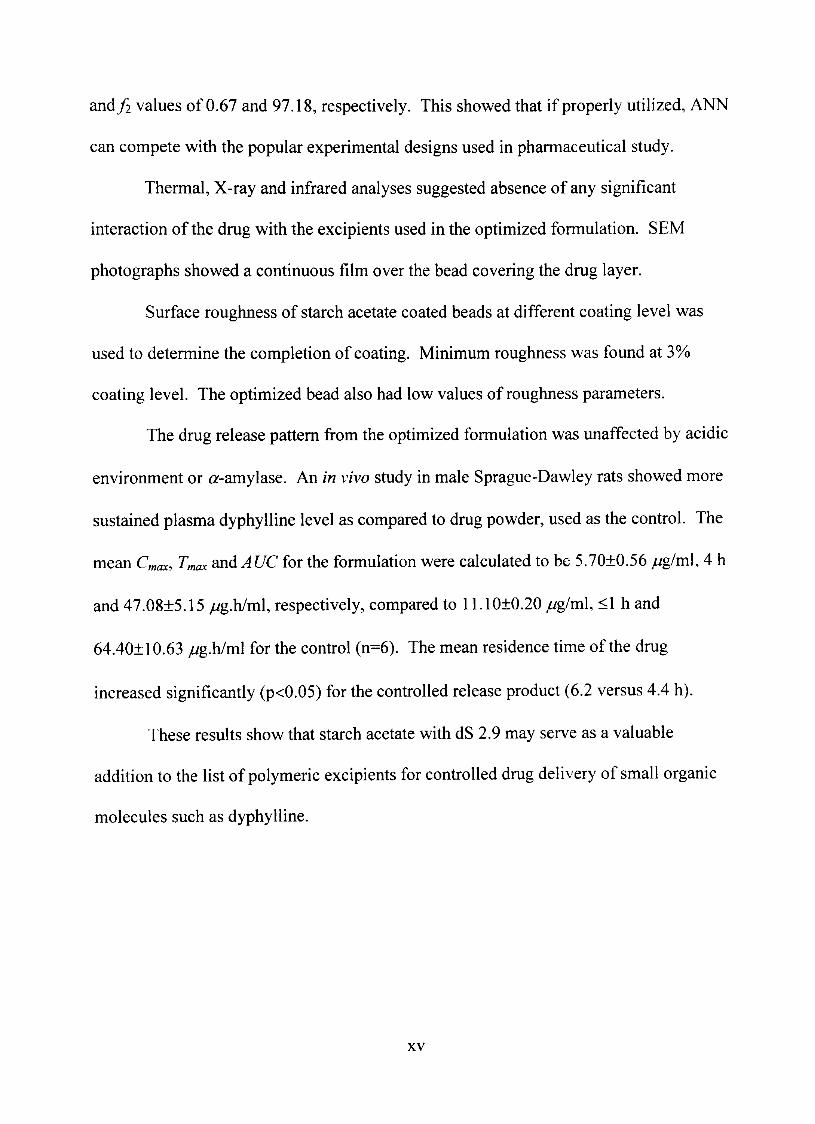
a n d / values of 0.67 and 97.18, respectively. This showed that if properly utilized, ANN
can compete with the popular experimental designs used in pharmaceutical study.
Thermal, X-ray and infrared analyses suggested absence of any significant
interaction of the dmg with the excipients used in the optimized formulation. SEM
photographs showed a continuous film over the bead covering the dmg layer.
Surface roughness of starch acetate coated beads at different coating level was
used to determine the completion of coating. Minimum roughness was found at 3%
coating level. The optimized bead also had low values of roughness parameters.
The dmg release pattem from the optimized formulation was unaffected by acidic
environment or a-amylasc An in vivo study in male Sprague-Dawley rats showed more
sustained plasma dyphylline level as compared to dmg powder, used as the control. The
mean C^ax, Tmax andAUC for the formulation were calculated to be 5.70+0.56 jug/ml 4 h
and 47.08+5.15 /^g.h/ml, respectively, compared to 11.10±0.20 //g/ml, <1 h and
64.40±I0.63 //g.h/ml for the control (n=6). The mean residence time of the dmg
increased significantiy (p<0.05) for the controlled release product (6.2 versus 4.4 h).
These results show that starch acetate with dS 2.9 may serve as a valuable
addhion to the list of polymeric excipients for controlled dmg delivery of small organic
molecules such as dyphylline.
XV
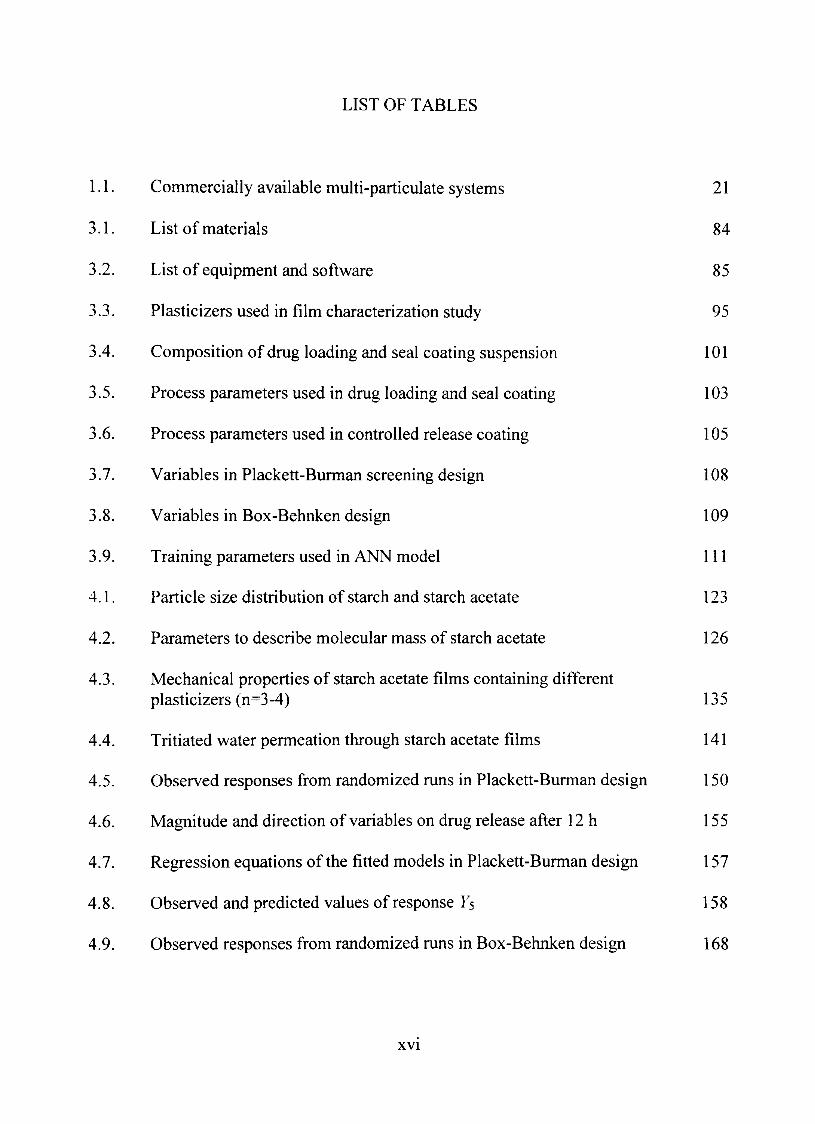
LIST QF TABLES
1.1. Commercially available multi-particulate systems 21
3.1. List of materials 84
3.2. List of equipment and software 85
3.3. Plasticizers used in film characterization study 95
3.4. Composition of dmg loading and seal coating suspension 101
3.5. Process parameters used in dmg loading and seal coating 103
3.6. Process parameters used in controUed release coating 105
3.7. Variables in Plackett-Burman screening design 108
3.8. Variables in Box-Behnken design 109
3.9. Training parameters used in ANN model 111
4.1. Particle size distribution of starch and starch acetate 123
4.2. Parameters to describe molecular mass of starch acetate 126
4.3. Mechanical properties of starch acetate films containing different plasticizers (n=3-4) 135
4.4. Tritiated water permeation through starch acetate films 141
4.5. Observed responses from randomized runs in Plackett-Burman design 150
4.6. Magnitude and direction of variables on dmg release after 12 h 155
4.7. Regression equations of the fitted models in Plackett-Burman design 157
4.8. Observed and predicted values of response F5 158
4.9. Observed responses from randomized mns in Box-Behnken design 168
XVI
4.10. Regression equations of the fitted models in Box-Behnken design 172
4.11. Standardized main effects of the factors on the responses 174
4.12. Dissolution models fitted with R^ values of release profiles 183
4.13. Optimized formulation by RSM: expected and observed dissolution values obtained by RSM and ANN 186
4.14. Master formula for optimized batch of dyphylline coated beads 187
4.15. Model parameters for ANN 189
4.16. Analysis of variance forthe response Fs 190
4.17. Comparative pharmacokinetics of dyphylline powder and controUed release multi-particulate system (n=6) 215
XVII
LIST OF FIGURES
1.1. Stmctural comparison of starch and cellulose 2
1.2. Stmcture of amylopectin and amylose 3
1.3. Starch under microscope 7
1.4. Schematic of a Wurster type fluid bed coater 26
1.5. Dynamics of coating process 3 0
1.6. Schematic of Box-Behnken design 48
1.7. Schematic of an artificial neuron 56
1.8. Supervised ANN network with backpropagation leaming mle 59
1.9. Stress-strain cixrves 71
1.10. Roughness parameters 75
1.11. Stmctures of dyphylline and theophylline 77
3.1. System used for acetylation of starch 88
3.2. NaviCyte® vertical diffusion chamber system 98
4.1. Acetylation of starch with acetic anhydride during the synthesis of starch acetate 118
4.2. Infrared spectra of starch and starch acetate 120
4.3. X-ray diffractograms of starch and starch acetate 122
4.4. Distribution of intensity weight particle size of starch acetate 124
4.5. DSC thermogram of starch acetate 128
4.6. Absolute viscosity of starch acetate solution as a function of polymer concentration 130
XVIII
4.7. Viscosity of starch acetate solution as a function of applied rate of shear 131
4.8. Glass transhion temperature of starch acetate films as a function of TEC and TA concentration 13 8
4.9. SEM photographs of unplasticized and plasticized fílms of starch acetate 139
4.10. DSC thermograms showing compatibility of dyphylline with Opadry^ 142
4.11. DSC thermograms showing compatibility of dyphylline with Nu-pareií"^ 143
4.12. DSC thermograms showing compatibility of dyphylline with dmg loading ingredients 144
4.13. FTIR spectra of dyphylline, Opadry®, Nu-pareil® and mixtures 146
4.14. FTIR spectra of dyphylline, talc and mixtures 147
4.15. Dissolution profiles of dyphylline from beads coated with starch acetate (Plackett-Burman design nms 1-6) 151
4.16. Dissolution profiles of dyphylline from beads coated with starch acetate (Plackett-Burman design nms 7-12) 152
4.17. Pareto chart showing the standardized effects of the factors on dmg release afterl2 153
4.18. Main effect plot showing the direction and extent of the effects of factors on dmg release after 12 h 154
4.19. Contour plot showing effects of coating weight gain and starch acetate concentration on dmg release after 12 h 160
4.20. Contour plot showing effects of coating weight gain and inlet temperature on dmg release after 12 h 161
4.21. Contour plot showing effects of starch acetate concentration and curing temperature on dmg release after 12 h 162
4.22. Contour plot showing effects of plasticizer concentration and curing time on dmg release after 12 h 163
4.23. Contour plot showing effects of plasticizer concentration and atomizing pressure on dmg release after 12 h 164
XIX
4.24. Dissolution profiles of dyphylline from beads coated with starch acetate (Box-Behnken design mns 1 -5) 169
4.25. Dissolution profiles of dyphylline from beads coated with starch acetate (Box-Behnken design mns 6-10) 170
4.26. Dissolution profiles of dyphylline from beads coated with starch acetate (Box-Behnken design mns 11-15) 171
4.27. Contour plot showing the effects of coating weight gain and concentration of plasticizer on response Y5 175
4.28. Contour plot showing the effects of coating weight gain and curing temperature on response Y5 176
4.29. Contour plot showing the effects of concentration of plasticizer and curing temperature on response Ys 177
4.30. Response surface plot of coating weight gain and concentration of plasticizer on response Ys 178
4.31. Response surface plot of coating weight gain and curing temperature on response Ys 179
4.32. Response surface plot of concentration of plasticizer and curing temperature and on response Ys 180
4.33. Interaction plot of factorsXi (A), JÍ2 (B) and Jío (C) on response Fs 182
4.34. Observed versus predicted values of the response Ys of some selected batches in ANN optimization 191
4.35. Response surface plot of coating level (X\) and plasticizer concentration (Xj) on response Ys generated by ANN 193
4.36. Response surface plot of coating level (X\) and curing temperature (X3) on response F5 generated by ANN 194
4.37. Response surface plot of plasticizer concentration (X2) and curing temperature (X3) on response Ys generated by ANN 195
4.38. DSC thermograms of the optimized beads and the ingredients 197
XX
4.39. X-ray diffraction pattems of the optimized formulation and the ingredients 199
4.40. FTIR spectra of the optimized beads and the ingredients 200
4.41. SEM photograph of an uncoated bead 201
4.42. SEM photograph of a coated bead 202
4.43. SEM photograph of the cross section of a coated bead 203
4.44. Surface roughness in relation to the coating weight gain 205
4.45. SEM photographs showing surface roughness of beads as a function of coating weight gain 206
4.46. Surface profile of a representative starch acetate coated bead 208
4.47. Release of dyphylline from coated beads in acidic medium 209
4.48. Release of dyphylline from coated beads in presence of a-amylase 211
4.49. High performance liquid chromatograms of a blank rat plasma sample
(top) and dmg with intemal standard in plasma (bottom) 212
4.50. Plasma concentration of dyphylline from powder and the optimized formulation (mean and standard deviation, n=6) 214
XXI
CHAPTER I
INTRODUCTIQN
Starch Family
Starch is a biopolymer of glucan chain consisting of glucose residues. It is used
by plants to store energy and is digested when the need for energy arises, e.g., when a
seed germinates. It is the principal constituent of underground plant organs such as roots,
tubers or corms and is also present in above-ground fmits. Two large plant groups which
contain high concentrations of starch in their seeds are cereals and legumes. Starches
obtained from the following soiu"ces are used in the food and the pharmaceutical
industries: amaranth, arrowroot, banana, barley, beans, buckwheat, com, cassava, lentils,
millet, oat, peas, potato, rice, rye, sorghum, tapioca, wheat (http://anka.livstek.lth.se).
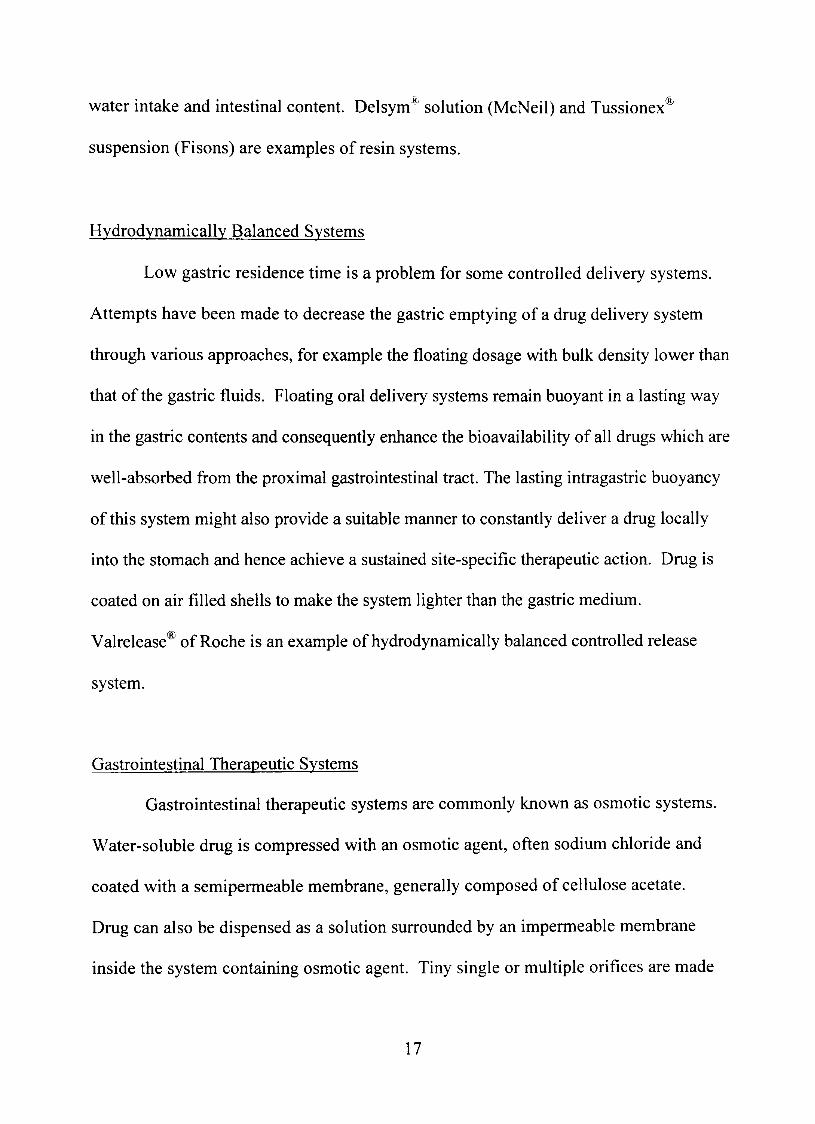
Cellulose, the most abundant polymer on earth, and starch both contain glucose
monomer. However, there are differences in the molecular stmcture between these two
polysaccharides. Starch consists of linear chains of a-D-glucopyranosyl units whereas,
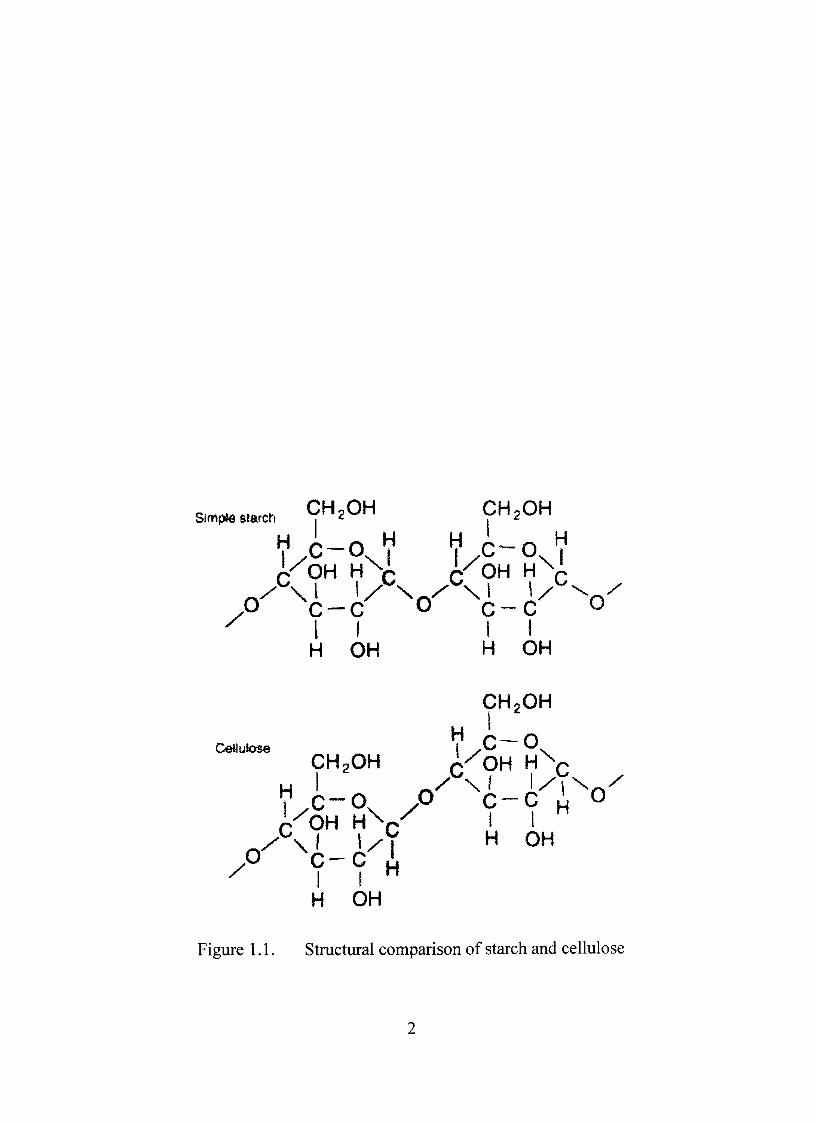
cellulose consists ofyS-D-glucopyranosyl units. Figure 1.1 shows the principal stmctural
difference between starch and cellulose. Starch may be digested by humans and most
animals but cellulose is not digested by most mammals. However, microorganisms
present in certain types of mminants can breakdown cellulose to smaller fragments.
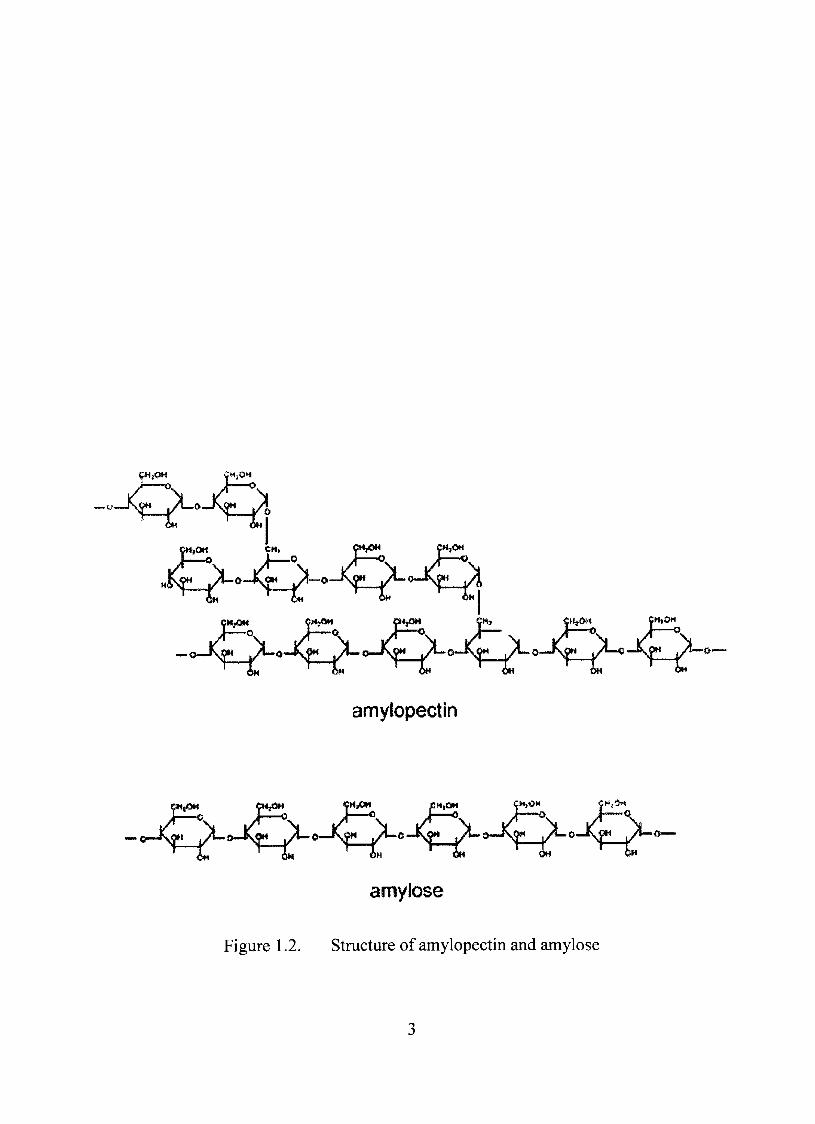
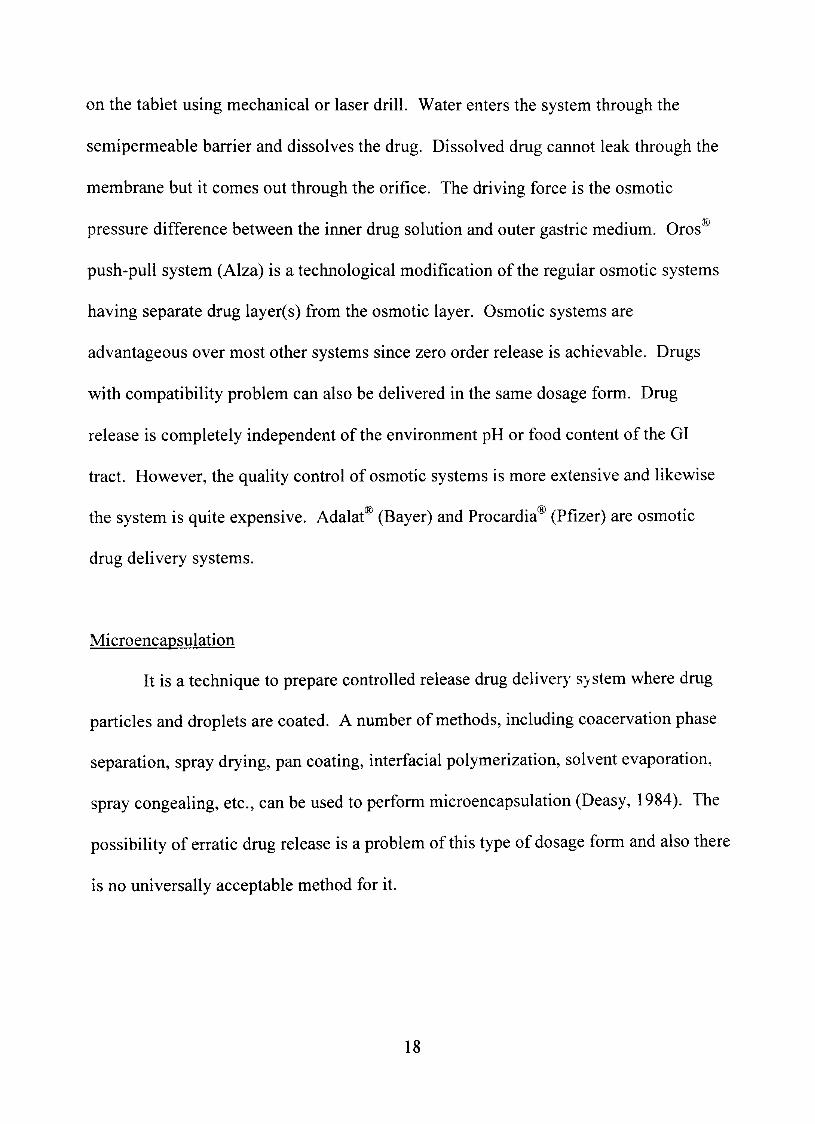
Starch exists in two different configurations (Figure 1.2). Amylose is in the form
of linear chains. It is connected by ÛÍ-1,4 linkage and is soluble in water. On the other
hand, amylopectin is highly branched and has ÛT-I ,4 linkage similar to amylose. The
Simptestarch C^^OH CH2OH
/
V/C~ \V í/C-0 V
o c—c o c™c o II 11 H OH H OH
G lulose
CH2OH
H '
CH2OH c'' OH H V
vx-o^ P c-c ^ o
/O ^ c - c |L H OH
Figure 1.1. Structural comparison of starch and cellulose
CHjOH G3*j«M fMtOM ^H t^^î L | " ' ^
amylopectin
C«aOM yWaOM^ Í H ^ ft îûM C 2 L í!!lîr
amylose
Figure 1.2. Stmcture of amylopectin and amylose
linear molecules are connected with one another by branching through a-l.ô linkages.
Amylopectin is water insoluble. Amylose and amylopectin associate through hydrogen
bonding and arrange themselves radially in layers to form granules. Amylose contributes
to the gelling property of starch whereas amylopectin contributes high viscosity. Both
properties are useful in the preparation of foods and pharmaceuticals. Most starches
consist of both forms and depending on the plant source, the two forms are present at
different ratios (http://www.foodproductdesign.com).
Starches from different sources vary from one another in the following ways, each
of which may affect performance of starch as additives in pharmaceuticals
(http://www.foodproductdesign.com).
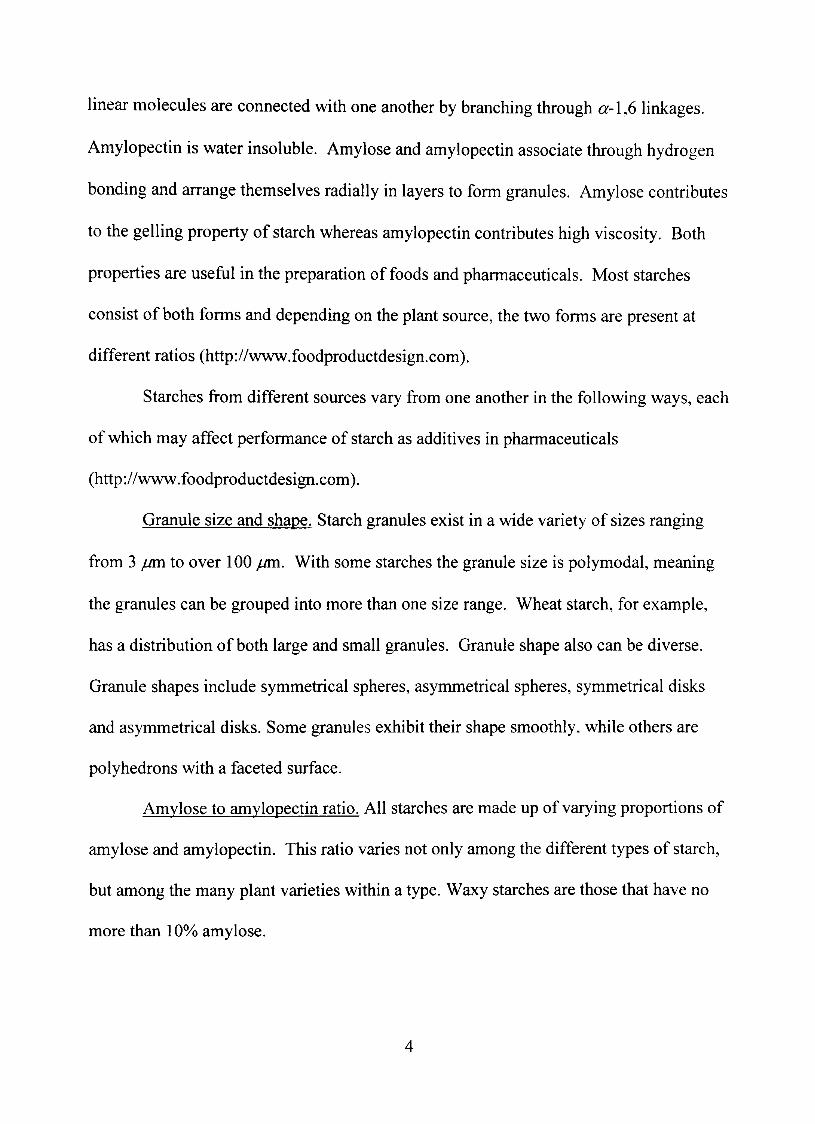
Granule size and shape. Starch granules exist in a wide variety of sizes ranging
from 3 /jm to over 100 /jm. With some starches the granule size is polymodal, meaning
the granules can be grouped into more than one size range. Wheat starch, for example,
has a distribution of both large and small granules. Granule shape also can be diverse.
Granule shapes include symmetrical spheres, asymmetrical spheres, symmetrical disks
and asymmetrical disks. Some granules exhibit their shape smoothly, while others are
polyhedrons with a faceted surfacc
Amylose to amylopectin ratio. All starches are made up of varying proportions of
amylose and amylopectin. This ratio varies not only among the different types of starch,
but among the many plant varieties within a typc Waxy starches are those that have no
more than 10% amylosc
Stmcture of amylose and amylopectin molecules. The length of the amylose
molecules in a starch, known as its degree of polymerization, can vary tremendously.
Even, degree of polymerization of 200 to 2,000 within a starch type in possiblc In
amylopectin, the length and number of branches on the molecule are also variable.
Miscellaneous variations. Variations due to some properties, unique to some
particular types of starches are also available. Generally, most such variations consist of
the presence of non-starch components in the granules.
Features of some coimnonly used starches from different sources are discussed
below (http://www.foodproductdesign.com). Study of them is a prerequisite for proper
selection of starch or its derivatives for use in pharmaceutical research.
Com starch. Four classes of com starch are present. Very high amylase com
starch contains 70% to 75% amylose and high amylose com starch contains 50-55%
amylose. Common or conventional com starch has about 25% amylose, while waxy com
starch is almost totally made up of amylopectin (about 99%). Common com starch has
irregular polyhedron-shaped granules. Their size ranges between 5 and 20 microns.
Waxy com starch also has irregularly shaped granules similar in size distribution to those
of common com. However, the individual faces are not as distinct. High-amylose
starches contain granules with irregular shape but they tend to be smooth. Some of these
are even rod-shaped. High-amylose starches have a narrower size range of 5-15 fim or
even 10-15 /im, depending on the variety.
Potato starch. Potato starch has about 20% amylose. Like those from many
tubers, potato starch granules are large with a smooth round oval shape. Potato starch is
the largest of the starches commonly used for food. Its granule size ranges from 15 to 75
/mi.
Rice starch. Common rice starch has about 20% amylose, whereas, waxy rice
starch has only about 2% amylosc Both varieties have small granule sizes ranging from
3 to 8 jum, These are irregularly shaped polygons with the waxy rice having some
compound granules.
Tapioca starch. Tapioca starch contains 15% to 18% amylose. The granules are
smooth, irregular spheres with sizes ranging from 5 /mi to 25 jum.
Wheat starch. Wheat starch has an amylose to amylopectin ratio of about 25:75.
Its granules are relatively thick at 5 /mi to 15 jum with a smooth, round shape ranging
from 22 /mi to 36 jum in diameter. The size distribution of wheat starch is bimodal. In
this case, these other granules are very small, with diameters of only 2-3 /rni.
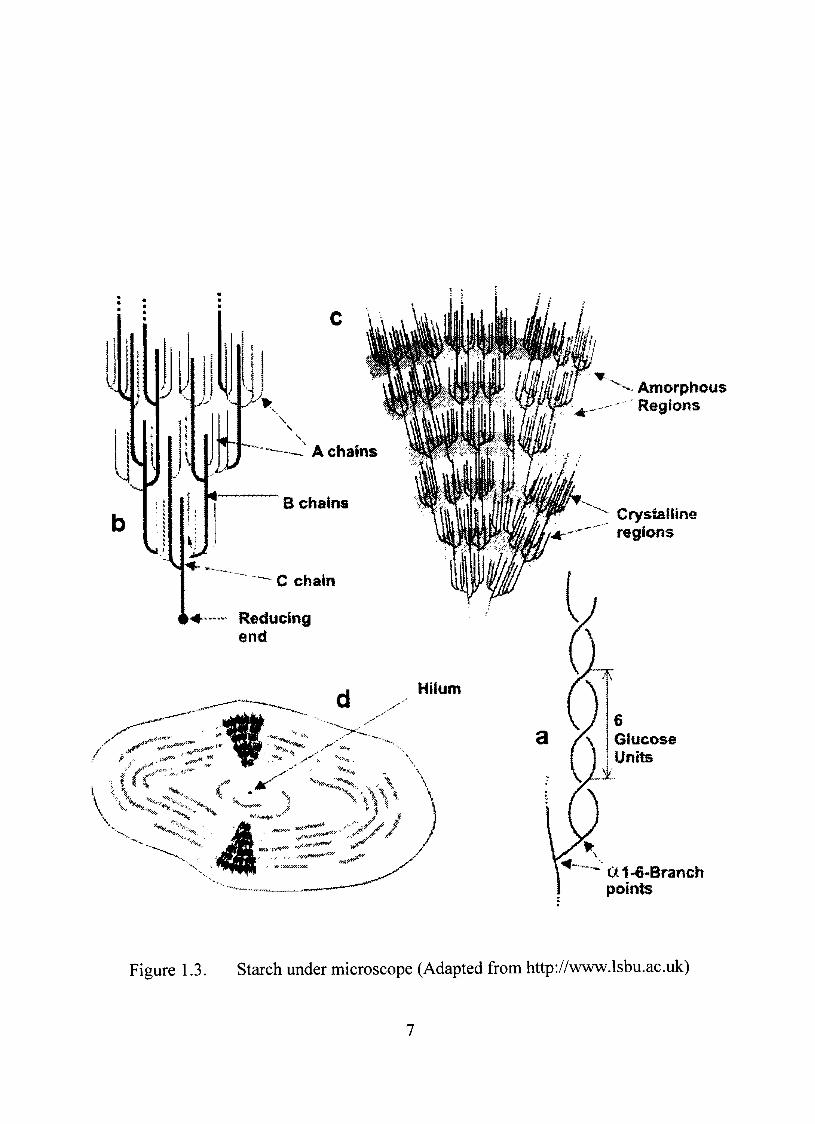
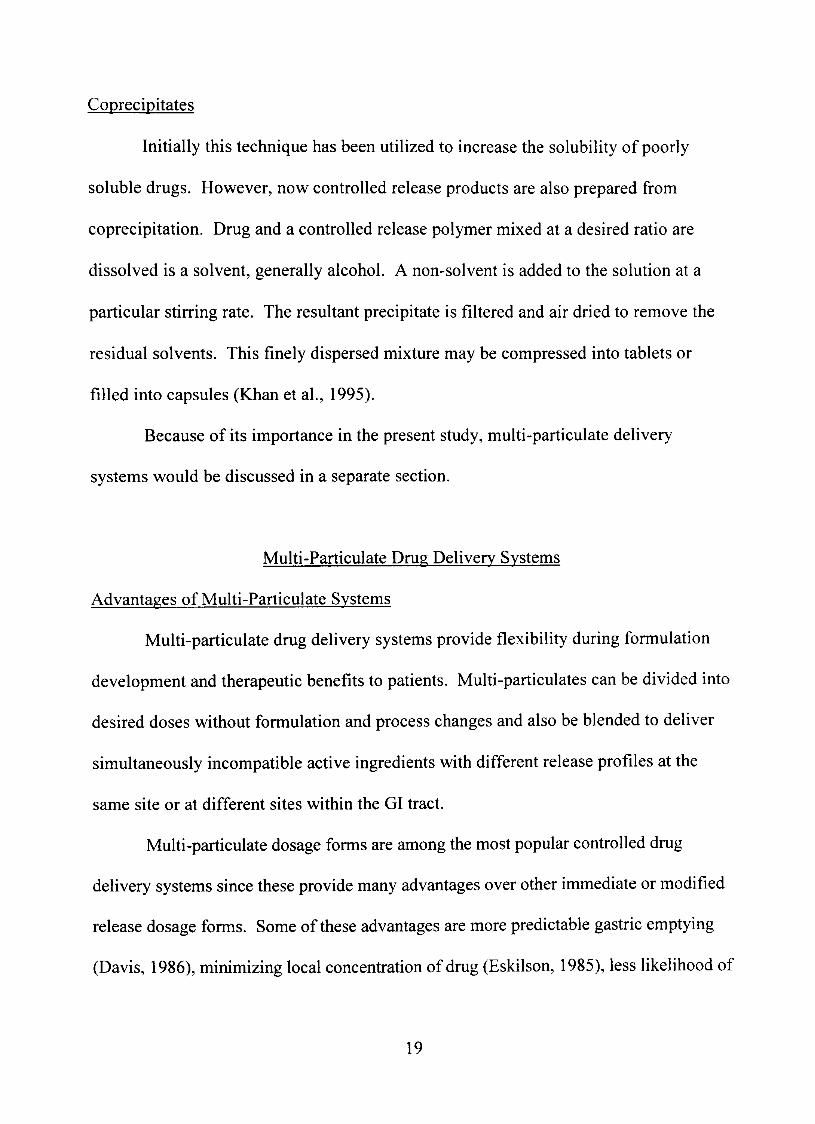
Microscopic Stmcture of Starch
For investigating chemical reactions involving starch it is necessary to understand
its microscopic stmcture. Amylopectin forms the basis of the stmcture of starch
granules. The short branched (2-1,4 chains are able to form helical stmctures which
crystallize (Figure 1.3a). It is known that amylopectin crystallites according to a cluster
model (Peat et al., 1952). Amylose fits into this stmcture in ways, which are still not
clearly understood. One amylopectin molecule spans several clusters and the branches
can be labeled A, B and C. The A chains are the outer chains linked to an inner B chain
(Figure 1.3b). The B chains are linked to other B chains or the C chain. The latter is
Crystaliinû r«glons
A^orphøiis Regions
ai-€-Branch po nt&
Figure 1.3. Starch under microscope (Adapted from http://vww.lsbu.ac.uk)
identified as the only chain vAth a free reducing end. There is only one C chain per
amylopectin molecule. Within these A, B and C chain stmctures there are crystalline and
amorphous domains (Figure 1.3c). The rigidity of the granule stmcture comes from the
extended B chains that bridge the amorphous regions, Under the microscope the granules
are seen to consist of a nucleus or hilum surrounded by layers of amylopectin and
amylose arranged concentrically or excentrically (Figure 1.3d) and the relations between
hilum and layers are the most distinctive features of individual starches
(http://wvw.lsbu.ac.uk).
There are two naturally occurring crystal stmctures of amylopectin, A and B-
types. It is observed that almost all cereal crops (cg., com) are A-type whilst tubers
(e.g., potato) are usually B-typc There is also a C-type, which is intermediate to the
other two types. Pea starch has C-type crystals (http://wvw.Isbu.ac.uk).
Starch Esters
Starch and modified starches have been widely and safely used with approval by
the FDA in the food and pharmaceutical industries (Biliaderis, 1991). In food starch
derivatives are used as thickeners, enhancers of organoleptic properties and texture
modifiers, whereas, in pharmaceutical fields those are mainly used as fillers, binders and
disintegrants. A number of specially modified starches have been used to introduce some
additional properties to the polymer (Makee and Herbst, 1962; Short and Verbanac, 1978;
Tmbiano and Somerville, 1983). Starch has also been modified thermally or by other

physical means to obtain controlled dmg delivery (Hermann and Remon, 1989, 1990;
Nakano et al., 1987; Van Aerde and Remon, 1988).
The major drawback of starch in use as a controlled release agent is its
hydrophilicity. Modifications in starch chemical stmcture were done with different
agents, and the products were studied for their solubility and other physical properties.
Starch components amylose and amylopectin have also been investigated. It was found
that some properties were well correlated with the molecular weights (Mullen and Pacsu,
1942; Wolffetal., 1951).
Esters of starch, amylopectin and amylose have been prepared as acetates,
propionates, butyrates, caproates, palmitates and benzoates. All the esters with a high
degree of substitution are insoluble in water. The solubility of the aliphatic esters
reached a maximum with butyrate. The benzoates have approximately the same
solubility as the butyrates. The acetates are soluble in chloroform, pyridine and acetic
acid. They are insoluble in lower alcohols, ethers, petroleum ether and partially soluble
in benzene, dioxane, ethyl acetate, acetone and 2-nitropropane. The propionates are
insoluble in lower alcohols, ether and petroleum ether but soluble in all other organic
solvents. In many cases the esters were highly swollen in organic liquids even though
totally insoluble in those liquids (Wolff et al., 1951).
Solubility of the starch esters was also dependent on the methods by which those
were prepared (Kmger and Rutenberg, 1967). The aqueous paste dismption technique
yielded more soluble products than either the liquid ammonia or pyridine pretreatment
methods. Products from the last two procedures are not completely soluble in any
solvent, whereas, the esters from the paste disintegration technique were soluble in
chloroform, pyridine and acetic acid and partially soluble in benzene, dioxane, ethyl
acetate, acetone and 2-nitropropane.
Starch Acetate
Starch acetate is a relatively new polymer used as an excipient in controUed
release pharmaceutical dosage forms (Korhonen et al., 2000, 2002; Pohja et al., 2004). h
could be a suitable replacement for cellulose acetate, a well known polymer in the
pharmaceutical industry (Kmger and Rutenberg, 1967). The film forming abilities of
starch acetate have been reported (Tarvainen et al., 2002; Tuovinen et al., 2003).
Recently starch acetate obtained from potato starch has been used to coat tablets
(Tarvainen et al., 2004). However, starch acetate has not been used as a controlled
release film former on other solid dosage forms, including multi-particulate systems. It is
evident that starch acetate has different solubility properties than native starch (Kmger
and Rutenberg, 1967). and the degree of substitution (dS) with acetyl moiety in starch has
great influence on solubility as well as on other mechanical and physicochemical
properties (Korhonen et al., 2000, 2002). The degree of acetylation was also shown to
affect the rate of dmg release substantially and the relation was reciprocal (Korhonen et
a l , 2000). Therefore, starch acetate with high dS value would be a promising coating
agent for controlled dmg delivery from multi-particulate system. However, starch acetate
with high dS is not available commercially. Therefore, it was required to be synthesized
for the present studies. It was obvious from the discussion in the starch section that it
10
was necessary to dismpt starch granules to expose the molecules to the reactant
completely. Therefore, the paste dismption method was utilized to synthesize starch
acetate. Since, viscosity is a major concem during coating process in a fluid bed coater,
com starch was preferred to other starch sources as starch acetate from com starch has
been shown to be less viscous than that from potato or tapioca starch in organic solutions
(Mullen and Pacsu, 1942). Another advantage of com starch is that it is available in
many different grades.
Novel Drug Delivery Svstems
Discovery of drugs, whether natural, synthetic or biotechnologically derived,
has arisen from the quest for cure of diseases. These drugs must fulfill stringent
requirements to become successftil in clinical therapy. The ability of a drug to meet
these requirements is dependent not only on the physicochemical properties of the drug
itself but also on the design of the dosage form in which it would be dispensed. The
success of the dosage form is also dependent on the extent it can combat with patient
psychology. The duty of a pharmaceutical scientist is to figure out the best
environment for the drug in which h would be most effective in terms of clinical and
aesthetic efficacy. In this way pharmaceutical product development is a science as well
as an art. Research in this area is progressing with new dmgs, and novel drug delivery
systems (NDDS) are always emerging to deliver them in a better way than beforc
The number of products based on NDDS has significantly increased recently.
They can improve therapy by increasing the efficacy and duration of dmg activity. Some
11
act by increasing patient compliance through decreased dosing frequency and convenient
routes of administration. Qthers are reported to improve targeting for a specific site to
reduce unwanted side effects. Still, a number of them mimic the circadian rhythm of
particular diseases in order to optimize a dmg's therapeutic power, potentially
differentiating a brand and giving it a competitive edge over less effective dmgs. These
technologies are described elsewhere (Anderson and Kim, 1984; Chien, 1982; Henry.
2000; Kermani and Findlay, 2001; Verma and Garg, 2001).
Dmg delivery technologies form a very rapidly growing segment of the
pharmaceutical industry. The most recent forecast shows that by 2005, dmg delivery-
related sales will grow to 20% of the total pharmaceutical sales (Dmcker, 2001).
Pharmaceutical companies have expressed very significant interest, accompanied by a
concurrent amount of investment in NDDS technologies. The key of this interest is
increased profit with reduced risk. The other major concems are increasing competition
from generic manufacturers and fears of the huge fmancial impact resulting from patent
expiration and the concomitant issues of dmg life-cycle management. Combining a dmg
delivery technology with a patented active substance creates a new formulation of the
original product and, thus can extend patent lifc The development of new dmg delivery
techniques for established active chemicals is also of relatively low risk compared to the
high risk involved in new chemical entity dmg discovery, development, and
commercialization.
In general, the average cost for a new NDDS is $ 15-50 million during an
approximately 7-year development period. In fact, this represents a small fraction of the
12
research and development effort and expense for a new drug discovery program, which
usually ranges from $300 million to $600 million. Currentiy, it has been estimated that
more than 60% of the NDDS technology effort is focused on dmgs already being
marketed (van Weeren and Gibboni, 2003). However. the fiature of dmg delivery
systems is not confmed to currently marketed drug compounds. It could be a much more
successful and profitable proposition to introduce a dmg delivery technology very early
on in the new chemical entity development cycle.
Benefits of ControIIed Drug Delivery Systems
The primary objective of controlled drug delivery systems is to maintain drug
plasma concentration in the therapeutic range for longer time (Li et al., 1987). This
management of plasma dmg levels generates a number of favorable consequences in
drug therapy including reduced undesirable side effects, improved patient compliance
and reduced overall cost of the therapy (Khan et al., 1995; Lordi 1986). For these
reasons in present days the common trend is to design a controUed delivery system of a
dmg when longer treatment therapy is desired.
Modified Release Drug Delivery Systems
In 1995, the United States Pharmacopeia adopted the term "modified release
dosage forms" to describe the dosage forms which release dmgs in a characteristic and/
or at a location to accomplish therapeutic convenience not offered by conventional
13
dosage forms; such as solutions, ointments or promptly dissolving dosage forms.
Broadly there are three different types of modified release drug delivery systems.
Extended Release Dosage Forms
Extended release dosage form should allow at least a two fold reduction in
dosage frequency as compared to the immediate release dosage form. These dosage
forms could be either sustained release or controlled releasc Sustained release dosage
forms provide medication over an extended period of time. ControUed release systems
provide actual therapeutic control, whether spatial, temporal or both. Ideally they
should release drug in a zero order fashion.
Delayed Release Dosage Forms
A dosage form that releases portions of drug at a time or times other than
promptly after administration is known as delayed release dosage form. Enteric coated
dosage form which releases dmg at basic pH is an example of this type of dosage form.
Targeted Release Dosage Forms
A targeted release dosage form releases drug close to the intended physiological
site of action. An example of this category is colon targeted drug delivery systems.
These could be immediate or extended releasc
14
Types of Controlled Release Dosage Forms
Matrix Devíces
In a matrix device the dmg is dispersed homogeneously throughout a polymer
matrix. Depending upon the nature of the polymer used, a matrix system could be
insoluble and inert (with polyvinyl chloride, ethylcellulose, starch acetate), insoluble
and erodible (with acrylates and methacrylates), hydrophilic (with hydroxypropyl
methyl cellulose, polyethylene glycol) or swelling (Carbopol*^). The first type is also
known as matrix diffusional system, where the shape of the whole system remains
intact even after release of the whole amount of the drug. The dissolution medium
enters the system through channels or pores and the dissolved drug leaches out of the
system through the similar path. Erodible polymers do not dissolve in the media but
erode gradually and release the dmg. Hydrophilic polymers are soluble in the media to
some extent.
Dmg release rate mainly depends on the viscosity of the region around the
dosage forms and the viscosity can be modified using different grades of hydrophilic
polymers. Swelling polymers imbibe dissolution media, which dissolve and release
drugs. Dmg release from matrix devices can be modified by changing the drug to
polymer ratio, compression pressure and the type of the polymer used in the matrix.
Matrix systems provide several advantages, including ease of preparation and
capability to use high molecular weight compounds, Also, dose dumping from
accidental leakage is avoided in these systems. These systems also have some
disadvantages. A perfect zero order release is not possible and the insoluble matrix
15
remains intact (in diffusional systems) after the drug release and in case of implant
systems, it must be removed. Some examples of matrix systems available in market are
Procan" SR (Parke-Davis) and Tral Filmtab' (Abbott).
lon-Exchange Systems
lon-exchange systems are based on resins composed of water insoluble cross-
linked polymers. The polymer chain contains salt forming functional groups in
repeating positions. When the systems come in contact with the ion exchange groups in
dissolution media or gut, drug bound to the resin is released by exchanging with
appropriately charged ions e.g., Na^, H^, Cl" or 0H~, of the ion exchange groups. The
free drug then diffuses out of the resin. The dmg-resin complex can be prepared either
by prolonged contact of drug and resin in solution or by repeated exposure of the resin
to the drug in a chromatographic column. A schematic of ion-exchange mechanism can
be shown by the following two steps, where X~ and Y^ are ions in the GI tract.
Resin^-Drug~ + X~ ^ Resin^-X~ + Drug~ (1.1)
Resin~-Drug'' + Y"" ^ Resin~-Y" + Drug^ (1.2)
The area of diffusion, diffusional path length and rigidity of the resin, which is a
function of the amount of cross-linking agent used to prepare the resin, control the rate
of drug diffusion out of the resin. Dmgs highly susceptible to degradation by
enzymatic processes can be incorporated in this type of system. The limitation of this
approach is that the release rate is proportional to the concentration of the ions present
in the area of administration. Dmg release rate can also be altered by variability in diet.
16
water intake and intestinal content. Delsym^^ solution (McNeiI) and Tussionex^^
suspension (Fisons) are examples of resin systems.
Hydrodynamically Balanced Systems
Low gastric residence time is a problem for some controUed delivery systems.
Attempts have been made to decrease the gastric emptying of a dmg delivery system
through various approaches, for example the floating dosage with bulk density lower than
that of the gastric fluids. Floating oral delivery systems remain buoyant in a lasting way
in the gastric contents and consequently enhance the bioavailability of all dmgs which are
well-absorbed from the proximal gastrointestinal tract. The lasting intragastric buoyancy
of this system might also provide a suitable manner to constantly deliver a dmg locally
into the stomach and hence achieve a sustained site-specific therapeutic action. Dmg is
coated on air filled shells to make the system lighter than the gastric medium.
Valrelease® of Roche is an example of hydrodynamically balanced controlled release
system.
Gastrointestinal Therapeutic Svstems
Gastrointestinal therapeutic systems are commonly known as osmotic systems.
Water-soluble dmg is compressed with an osmotic agent, often sodium chloride and
coated with a semipermeable membrane, generally composed of cellulose acetate.
Dmg can also be dispensed as a solution surrounded by an impermeable membrane
inside the system containing osmotic agent. Tiny single or multiple orifíces are made
17
on the tablet using mechanical or laser drill. Water enters the system through the
semipermeable barrier and dissolves the drug. Dissolved dmg carmot leak through the
membrane but it comes out through the orifice. The driving force is the osmotic
pressure difference between the inner dmg solution and outer gastric medium. Oros
push-puU system (Alza) is a technological modification of the regular osmotic systems
having separate dmg layer(s) from the osmotic layer. Osmotic systems are
advantageous over most other systems since zero order release is achievable. Dmgs
with compatibility problem can also be delivered in the same dosage form. Dmg
release is completely independent of the environment pH or food content of the GI
tract. However, the quality control of osmotic systems is more extensive and likewise
the system is quite expensive. Adalat® (Bayer) and Procardia® (Pfizer) are osmotic
drug delivery systems.
Microencapsulation
It is a technique to prepare controlled release drug delivery system where drug
particles and droplets are coated. A number of methods, including coacervation phase
separation, spray drying, pan coating, interfacial polymerization, solvent evaporation,
spray congealing, e tc , can be used to perform microencapsulation (Deasy, 1984). The
possibility of erratic drug release is a problem of this type of dosage form and also there
is no universally acceptable method for it.
18
Coprecipitates
Initially this technique has been utilized to increase the solubility of poorly
soluble drugs. However, now controUed release products are also prepared from
coprecipitation. Drug and a controUed release polymer mixed at a desired ratio are
dissolved is a solvent, generally alcohol. A non-solvent is added to the solution at a
particular stirring rate. The resultant precipitate is filtered and air dried to remove the
residual solvents. This finely dispersed mixture may be compressed into tablets or
filled into capsules (Khan et al., 1995).
Because of its importance in the present study, multi-particulate delivery
systems would be discussed in a separate section.
Multi-Particulate Dmg Delivery Systems
Advantages of Multi-Particulate Systems
Multi-particulate dmg delivery systems provide flexibility during formulation
development and therapeutic benefits to patients. Multi-particulates can be divided into
desired doses without formulation and process changes and also be blended to deliver
simultaneously incompatible active ingredients with different release profiles at the
same site or at different sites within the GI tract.
Multi-particulate dosage forms are among the most popular controlled dmg
delivery systems since these provide many advantages over other immediate or modified
release dosage forms. Some of these advantages are more predictable gastric emptying
(Davis, 1986), minimizing local concentration of dmg (Eskilson, 1985), less likelihood of
19
dose dumping (Sam, 1985), and lower incidence of inter- and intra subject variability
(Butler et al., 1998; Kyroudis et al.. 1989). Muhi-particulate system was selected to be
used in the present study considering the superiority of multi-particulate system over
others. A list of commercially available multi-particulate system is given in Table 1.1.
Manufacturing of Multi-Particulate Systems
Similar to single unit controlled release dosage forms, multi-particulate system
can be of two major types, matrix type and reservoir (membrane-controUed) systems. In
the matrix system, dmg is blended with the controlled release polymer and other
ingredients and beads are prepared using a technique of extmsion and spheronization
(Henrist et al., 1999). This technique involves blending, granulation, extmsion,
spheronization and drying steps. Dmg is blended with excipients and granules are
prepared by wet granulation. These are passed through extmder to obtain strands, which
are then transformed to pellets by the spheronizer and finally dried. Pellet physical
properties depend on the nature of the excipients used and the moisture content of the
system. Some other methods can also be used to prepare matrix type multi-particulate
systems. Spray congealing is one of them (Hincal and Kas, 1994). The dmg is allowed
to melt, disperse or dissolve in hot melts of gums, waxes, fatty acids, etc, and is sprayed
into an air chamber maintained at a temperature below the melting points of the
formulation components and thus spherical congealed pellets are obtained. Balling is
another method of preparing multi-particulates where the instmment, pelletizer form
approximately spherical bodies from a mass of finely divided particles continuously by a
20
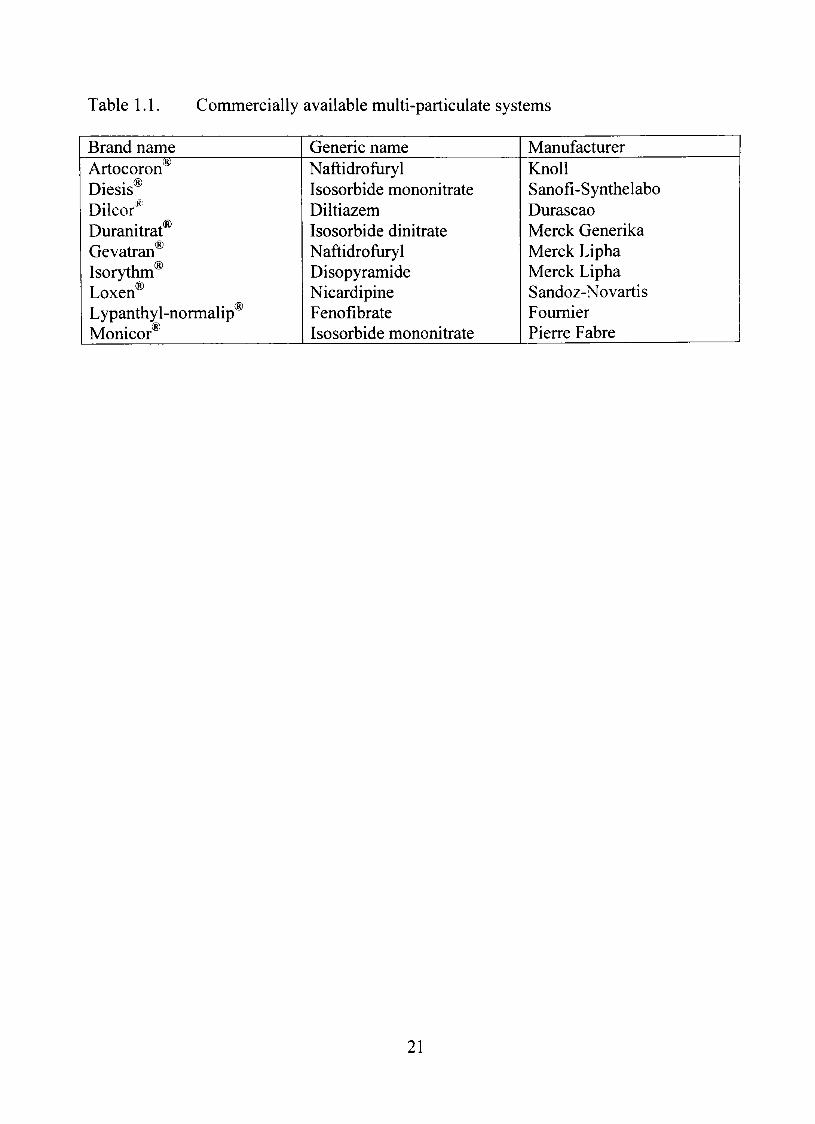
Table 1.1. Commercially available multi-particulate systems
Brand name Artocoron^ Diesis® Dilcor^ Duranitrat® Gevatran Isorythm Loxen® Lypanthyl-normalip® Monicor®
Generic name Naftidroftiryl Isosorbide mononitrate Diltiazem Isosorbide dinitrate Naftidroftiryl Disopyramide Nicardipine Fenofibrate Isosorbide mononitrate
Manufacturer KnoU Sanofi-Synthelabo Durascao Merck Generika Merck Lipha Merck Lipha Sandoz-Novartis Foumier Pierre Fabre
21
rolling or a tumbling action on a flat or curved surface with the addition of a liquid (Lyne
and Johnston, 1981). Rotary fluid-bed granulators can also be used for pelletization.
Multi-particulates can be obtained with rotor process equipment or high shear
mixers. Dropping method can also be used. In this method, a solution or suspension of
the dmg along with other components is prepared. h is then converted to droplets which
are then solidified using several techniques, e.g., chemical reaction where, hard to
dissolve sahs and complexes of the polymers are formed. Suitable electrolyte solutions
are used as congealing baths. Temperature dependent sol-gel transformation can also be
used to solidify the droplets. This is done by dripping the warm polymer solution into
hydrocarbon cooling baths. Freezing method can also be used to congeal the dripped
liquid (Knoch, 1994).
Preparing reservoir type of multi-particulate system is relatively less complicated.
Drugs are loaded on inert beads (generally sucrose/ starch bead) with the help of any
suitable binder. present in the form a dmg loading suspension and then coated with
polymers (Vaithiyalingam et al, 2002) or waxes (Khan et al., 1984) contained in organic
solutions (Shivakumar et al., 2002) or aqueous based systems (Vaithiyalingam and Khan,
2002) to control dmg release. After preparation, the coated beads can be enclosed in
capsule shells or compacted in tablets.
Dmg Release from Multi-Particulate Systems
The mechanism of dmg release from a muhi-particulate bead system depends on
the nature of the complete system. Because of its relevance to the present study, the
22
mechanism of release from coated beads wiU be discussed. A number of possible
mechanisms may be involved in drug release from coated beads when insoluble polymers
are used. These are diffusion through the continuous polymer phase, through plasticizer
channels, through aqueous pores and due to osmotic pressure (Dressman et al., 1994).
The diffusion of a solute molecule within an amorphous polymer phase is an
activated process that involves the cooperative movements of the dmg and the polymer
chain segments around it. Thermal fluctuations of chain segments allow sufficient local
separation of adjacent chains to help the passage of a dmg. Configurational diffusion
may also help dmg permeation. The rate of difftision depends on the size and shape of
the dmg, the force of attraction between the adjacent polymer chains and the stiffness of
the polymer chains. Plasticizers lower the glass transition temperature, increase free
volume and promote polymer segment mobility and in this way they increase the
diffusivity. This mechanism of dmg release generally is observed when films are
prepared from organic solvents, which makes complete films and it will be dominant
when the film is continuous (lacks pores) and flexible, and where the dmg has a high
affmity for the polymer relative to water (Dressman et al., 1994).
Diffusion through plasticizer channels becomes prominent when the plasticizer is
not uniformly distributed and when its content is high. However, this type of dmg
diffiision has not been studied extensively. Multi-particulate system coated with aqueous
dispersions of pseudolatexes wiU most likely show dmg difftision through aqueous
pores. The coating is usually not homogeneous or continuous but punctuated with
pores. Drug release occurs through these pores when the system comes in contact with
23
the media. When the coating is porous, the possibility of drug release by an
osmotically driven force may also occur. The osmotic pressure inside the particulate
may arise from the low molecular weight excipients, e.g., the sugar of Nu-pareil® beads
and the drug hself (Dressman et al., 1994). This type of dmg release has already been
discussed in this chapter before.
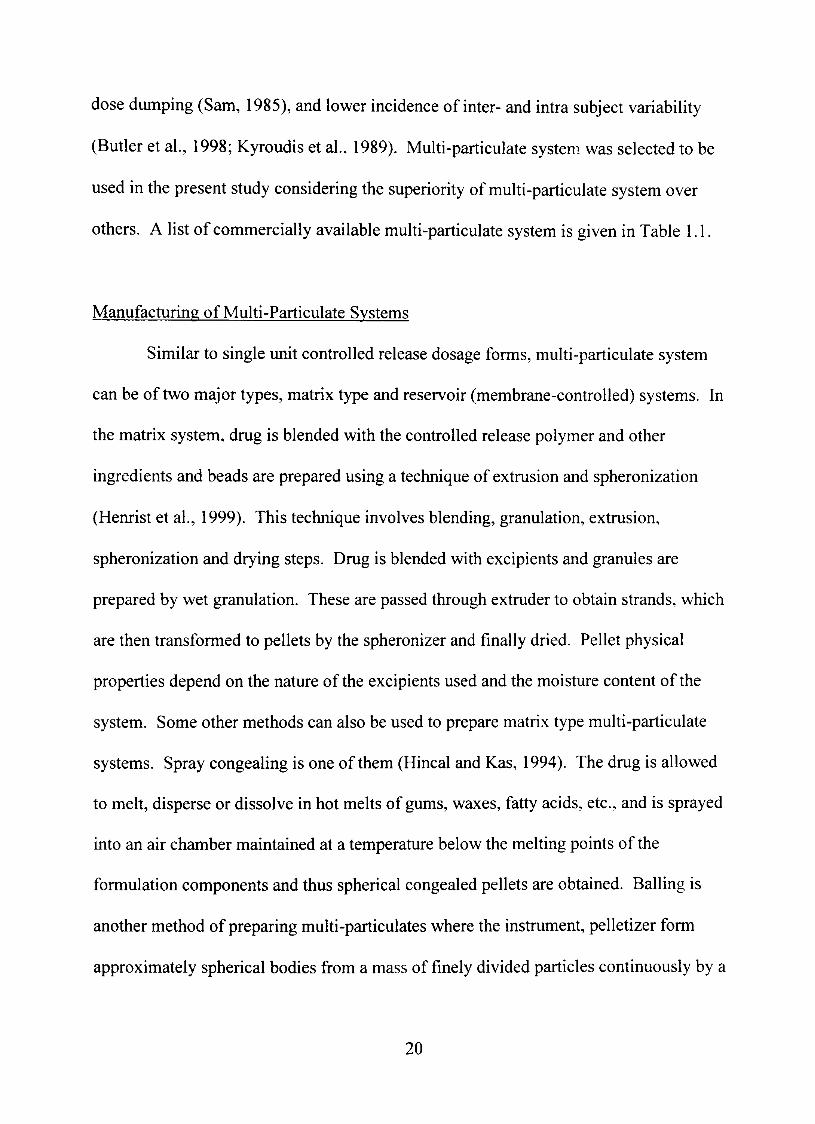
Fluidized Bed Coatíng
Dr. Dale Wurster of the University of Wisconsin introduced fluidized bed coating
in pharmaceutical technology in the USA for the first time in 1959, when he used an air
suspension technique knov^ as the "Wurster system" (Wurster 1949, 1959). In principle,
the coating material was applied from through the perforated bottom of the fluidization
chamber parallel to the air stream onto the cores transported upwards inside a cylinder
fixed in the middle of the chamber. Robinson et al. (1968) modified the process for
coating smaller particles by using top spray method where the coating solution
or dispersion was applied from the top of the chamber above a convecting zone.
Later on in 1964, a special tablet coating equipment was developed and there the
spraying of the coating solution was done at a cone on the base plate of a Glatt*
fluid-bed granulator. The available fluid-bed granulators were adapted to particle
coating and were found to be as effective as Wurster systems (Lehmann et al.,
1978). When more pan-coating systems, such as perforated Accela-Cota and
modified conventional drums with modern spray devices and air supply were
developed for more effective tablet coating, the fluidized bed process, due to its
24
specifíc advantages, was used intensively for coating smaller particles. The
advantages include low agglomeration tendency, high spray rates and excess of
drying air in the systems. However, the high stress during fluidization affected the
surface structure of fílm-coated tablets even if they were of good hardness
(Lehmann and Dreher, 1981).
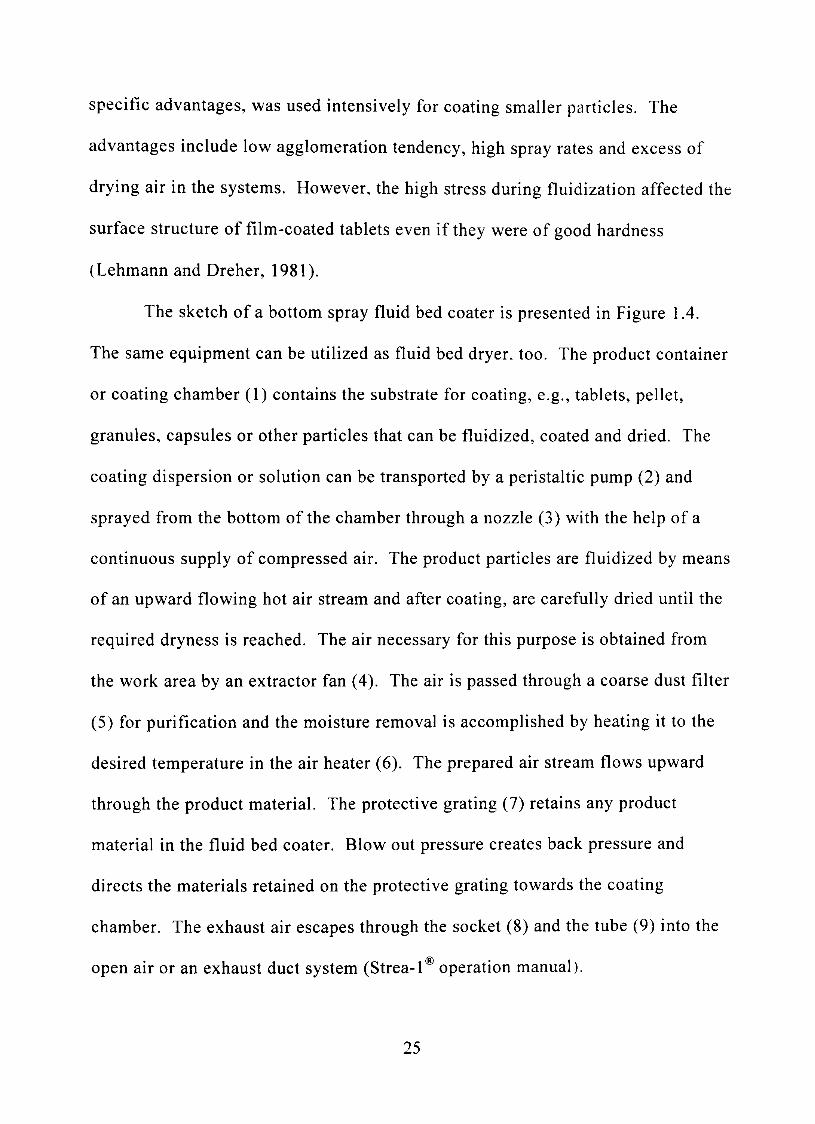
The sketch of a bottom spray fluid bed coater is presented in Figure 1.4.
The same equipment can be utilized as fluid bed dryer, too. The product container
or coating chamber (1) contains the substrate for coating, e.g., tablets, pellet,
granules, capsules or other particles that can be fluidized, coated and dried. The
coating dispersion or solution can be transported by a peristaltic pump (2) and
sprayed from the bottom of the chamber through a nozzle (3) with the help of a
continuous supply of compressed air. The product particles are fluidized by means
of an upward flowing hot air stream and after coating, are carefully dried until the
required dryness is reached. The air necessary for this purpose is obtained from
the work area by an extractor fan (4). The air is passed through a coarse dust filter
(5) for purifícation and the moisture removal is accomplished by heating it to the
desired temperature in the air heater (6). The prepared air stream flows upward
through the product material. The protective grating (7) retains any product
material in the fluid bed coater. Blow out pressure creates back pressure and
directs the materials retained on the protective grating towards the coating
chamber. The exhaust air escapes through the socket (8) and the tube (9) into the
open air or an exhaust duct system (Strea-1® operation manua ).
25
Figure 1.4. Schematic of a Wurster type fluid bed coater (Adapted from Strea-1 operation manual)
26
Polymers Used in Fluidized Bed Coating
A number of polymers are available for film coating. Based on aqueous
solubility polymers can be classified in some groups. Methyl cellulose (MC),
hydroxypropyl methyl cellulose (HPMC), hydroxypropyl cellulose (HPC).
hydroxyethyl cellulose (HEC), polyvinyl pyrrolidone (PVP). low molecular weight
polyethylene glycol (PEG) are examples of water soluble polymers. HPMC is the
most commonly used water soluble polymer, which also has good organic solvent
compatibility. These polymers are freely soluble in cold water but insoluble in hot
water. Ethylcellulose (EC), starch acetate (SA), cellulose acetate (CA). methacryl
ester copolymer are water insoluble polymers. Some of these are impermeable,
whereas others are permeablc Some polymers have pH dependent solubility.
These are generally acetyl and phthalyl derivatives of cellulose. Some examples
are cellulose acetate phthalate (CAP), hydroxypropyl methyl cellulose phthalate
(HPMCP), polyvinyl acetate phthalate, methacrylc acid copolymers, cellulose
triacetate (CTA), cellulose acetate butyrate (CAB) and cellulose acetate
propionate. These polymers are insoluble at low pH but dissolves at higher pH. A
mixture of alcohols and chlorinated hydrocarbons is also a good solvent. The
exact solubility depends on the extent of substitution. Drugs intended to be
released in the intestine are incorporated under enteric coating of these polymers.
27
Film Coating
Film coating is not a new technology as it has been used in paint and
adhesive industries for a long time. The major objectives to apply film coating are
to protect the drug and the subject taking the drug and to control the release
(Banker, 1966). Drugs can be protected from moisture or light in the environment
or from unfavorable pH in the stomach and the patient can be protected from awful
taste and irritation of certain drugs when film coating is used. Sugar coating could
be considered the fírst generation coating where, sucrose syrup was used to coat
tablets or pellets. Film coating with polymers is a relatively new process which
offers a number of advantages over sugar coating with respect to cost, time and
effícacy.
Although aqueous based dispersion offers several advantages including the
avoidance of risk associated with organic solvents, it has a major drawback of the
requirement of considerably higher temperature during the coating process to
provide the latent heat of vaporization of water and this brings up the requirement
of instruments with sophisticated design. Due to the slow evaporation of water,
the coating process is too lengthy compared to organic solution coating. Also the
preparation of an aqueous coating dispersion is a tedious job and its stability is a
very critical issue. AII these things increase the cost of manufacture. Besides,
water sensitive drugs generate another problem with aqueous coating and the high
temperature in the operation may exclude the usage of few thermolabile drugs. On
the other hand, the possible risk of inflammability and health hazards of organic
28
solvents can be overcome by using explosion-proof chambers and solvent recovery
systems. Also, the study of film formation and drug release from organic coated
system can be more easily performed than aqueous coating.
Mechanism of Film Formation
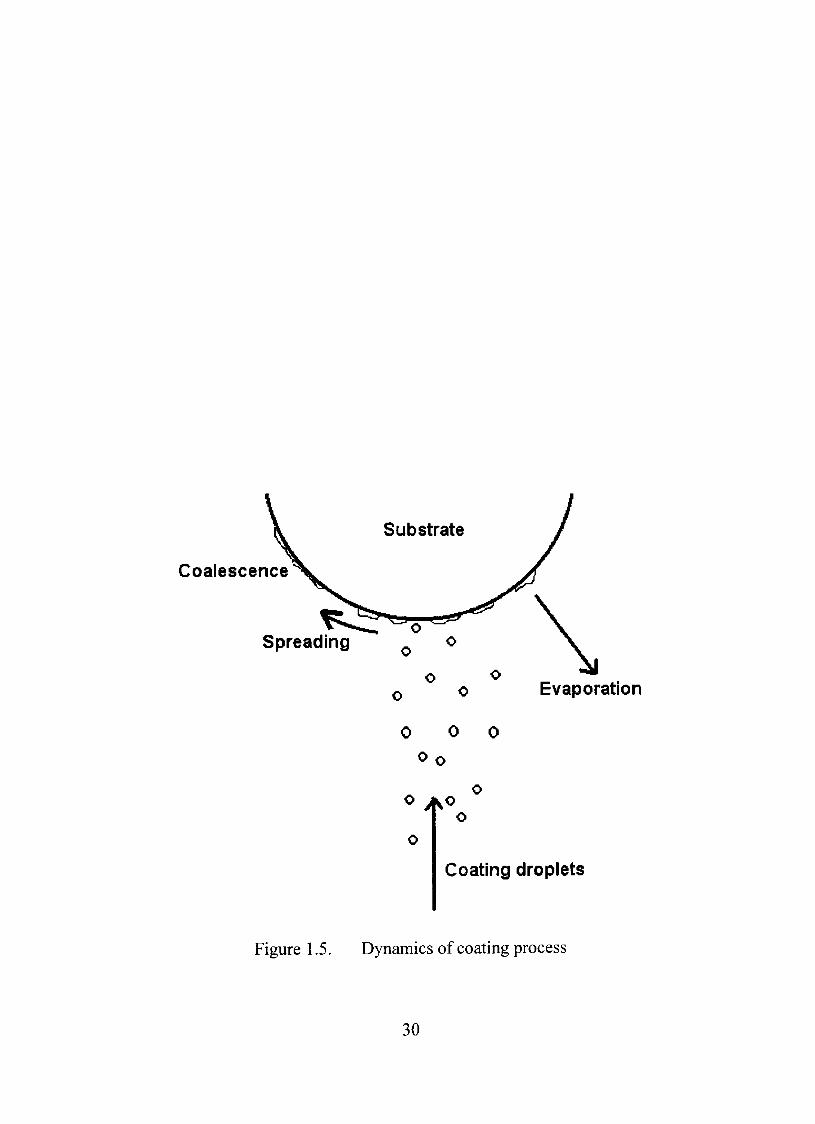
Application of a fílm to a solid is indeed very complex. A layer of coating
does not occur during a single pass through the coating zone but needs many such
passes to produce complete coverage of the surfacc Droplet formation, contact,
spreading, coalescence and evaporation occur simultaneously during the process
(Figure 1.5). When organic solutions are used for coating, initial evaporation of
the solvents leads to an increase in the concentration of the solution. This results
in increased viscosity of the sprayed film layer, which eventually brings the
polymeric chains in close proximity. Further evaporation results in the formation
of a dense polymeric network that provides the coating layer. An organic solvent
based coating formulation yields molecular dispersion of the plasticizer in the
polymer, a condition which maximizes intermolecular interaction and effective
plasticization.
Factors Affecting Film Formation
It is very important that a continuous and uniform polymeric film be formed on
the substrate without significant time dependent changes in the film properties occurring
29
Coalescence
Spreading
0 0 0
Oo
o
Coating droplets
Figure 1.5. Dynamics of coating process
30
in normal storage conditions. The formulation and process variables should be
appropriately investigated so that the optimization of the factors can be achieved.
Formulation Variables
Solid Content
Determination of the optimum polymer concentration is a critical step in making
coating formulation. Uniformity in film formation is more when the solid content is
reduced. However, very low concentration may lead to increase in duration of coating
process. Too high concentration may be undesirable because of the evolution of highly
viscous solutions which is impractical to use.
Coating Levels
Level of coating is generally measured as the percent increase of the substrate
weight. In general, an increase in coating level slows down dmg release. This is because
with increasing coating level, thickness of the coating layer increased that creates
physical barrier between the dmg and the medium. Increasing coating level may also
change dmg release mechanism. h was reported (Zhang et al., 1991) that at lower
coating level (2-10%), the dmg release rates followed a square root of time model while
when higher level of coating (12-20%) is used; the dmg release followed a zero order
release model.
31
Solubility of the Components
Typically organic solution coating does not require any excipient other than
plasticizer and the controUed release polymer. However, if too hydrophobic polymer is
used and if it makes too low dmg release, it may be desirable to add some water soluble
additives, including HPMC, PEG, or urea. These wiU form some pores within the film
and yield desired dmg release. Film on substrates can also be affected by the solubility
properties of the dmg itself and other components used in the dmg loading. If any of
these components are soluble in the organic solvent, some amount of those may leach to
the film during the coating process bringing a change into the film. Therefore,
components should be carefully selected. Besides, the substrate can also be heated for a
while before applying the coating.
Characteristics of Substrate
Substrate properties have great influence on the film formation on substrates. As
the substrate size becomes smaller, more amount of solid material is required to get the
same film thickness. The size distribution of the substrate is also important. Large
distribution creates batch variability. Rough surface area of the substrate is undesirable
since it creates the possibility of uneven thickness of film. Too much porosity may lead
to suction of the solvent by the substrate, which may reduce the strength of the core and
also may leave dry powder on the substrate.
32
Friability of the Core
The pellets are subjected to particle-particle and particle-wall frictional forces
during the coating process. This generates significant amount of fmes that get suspended
temporarily in the expansion chamber. Some of them retum to the chamber and get
embedded in the film. During the dissolution testing these are leached out resulting in
pores in the coating. Also friable pellets have larger surface area and result in faster
release rates due to reduced coating thickness. In general, for a given coating level,
friable pellets produce faster drug release rates than nonfriable pellets.
Plasticization
Plasticization is a critical step in coating process. Generally plasticizers are
added to get fílm with optimum strength and permeability. The favorable
proportion of plasticizer should be determined through experimentation. An incomplete
or discontinuous film may result if low levels of plasticizer are used. Conversely, a high
proportion of plasticizer may lead to seed agglomeration, sticking, and poor fluidization
caused by excessive softening of the polymeric film. Plasticizers must be compatible
with the polymer and the solvent of the system and must have low diffusion coefficients
in the polymeric film to minimize migration (Boyer, 1949; Rowe, 1984). Thus, h i s
important that for a given polymeric system, the effect of different types and levels of
plasticizer be thoroughly investigated during the early developmental stage in order to
select an optimal plasticizer and its level. Plasticizer should be added to the polymeric
solution under mild agitation and h should be continued for sufficient period to ensure
33
complete mixing of the plasticizer with the polymer and the solvent. The stirring process
should be continued during coating, if the duration is too long. Mechanism of
plasticization and efficiency of plasticizers would be discussed in a separate section.
Process Variables
Drying Temperature
Drying temperature is a very important issue in coating process (Yamaguchi et al.,
1995). Too low temperature may not evaporate the solvent enough to yield dense film
and too high temperature may reduce the solvent quantity so quickly that polymers do not
get chance to settle down properly. However, the inlet temperature must be above the
minimum film forming temperature (MFT) of the polymer. Before starting the coating.
the substrates should be warmed for few minutes to reach the required temperature. This
is known as prewarming.
Fluidized Air Volume
Air volume passed into the coating chamber can be adjusted to obtain
sluggish or vigorous fluidization of the particles. An inappropriate fluidization
may cause problems such as bonding to the side wall and attrition of the core
substrates. The volume of fluidizing air also effects droplet size, particle
velocity, and the fluidization pattern. The proper volume of fluidizing air should
be maintained throughout the coating process and should remain consistent from
batch to batch in a design (Parikh, 1991).
34
Spray Rate
Spray rate affects the size of droplets, the degree of wetting and the rate
of the overall coating process. Spray rate is dependent on three factors, capacity
of the air for solvent removal, the tackiness of the coating being applied and the
speed with which the particles travel through the coating zonc With most coating
systems, the fluidizing air has excess capacity for application. The rate limiting factor is
the tackiness of the coating formulation as it changes from liquid to solid. Inhially, the
coating spray rate is slow to prevent overwetting and to allow sufficient drying time.
This is because when the film thickness increases, entrapped solvent and water are much
more difficult to eliminate. The spray rate has to be reduced or even interrupted for
intermediate drying when agglomeration tendency increases. If spray rate is too slow
droplet mist may appear due to excess of drying air and it will result in spray drying of
the polymer even before congealing (Lorck et al., 1997).
Atomizing Pressure
Droplet size of a coating formulation in the chamber depends on atomizing air
volume and pressurc As these values increases, droplets become smaller. Coating
solution droplet size should be selected for a particular polymer-solvent system. Higher
droplet size may result in formation of liquid bridges and agglomeration of the polymer.
Excessively high atomization may result in loss of coating materials or the breakage or
attrition of substrate. Excessively low atomization may cause overwetting of the core and
bonding to the side wall of the chamber. Droplet size is also a function of viscosity and
35
surface tension of the coating formulation. Thus, droplet size is selected
empirically rather than determining mathematically or experimentally. Various
types of spray nozzles and spray guns are available. The arrangement of these
spray guns also has signifícant influence on the coating process (Mehta et al.,
1986).
Curing Conditions
The coalescence of polymer particles is generally incomplete after the
coating process, which necessitates a curing step to ensure that a continuous
homogenous fílm is obtained. Curing is a brief thermal treatment of the coated
materials. Both curing temperature and curing time are important for many
formulations (Bodmeier and Paeratakul; 1994, Goodhart, et al., 1984). Curing
temperature will vary in different systems and the time may range from several
hours to few days (Lippold et al., 1990). A better understanding of critical
parameters affecting bed temperature is needed for successful application of
controUed release fílm coating. After coating by additional drying, if the product
so treated is not allowed to cool before discharging it to a bulk container.
tackiness of the coating will simply bond pellets together during bulk storage.
Glass Transition Temperature and the Role of Plasticizer
The glass transition temperature (Tg) of a polymer is commonly known as the
temperature at which the polymer is in transition between a glassy state and a viscous
36
rubbery state. The glass transition differs from mehing. The former is the property of the
amorphous region of the polymer while the latter refers to the crystalline portion. Below
Tg, polymer molecules are immobile and above h, the molecules can wiggle around. The
transition of the polymer from glassy to semisolid state is a second order thermodynamic
process. On the other hand, below melting temperature (Tm) materials stay as an ordered
crystalline solid and above Tm h exhibits a disordered melt.
Glass transition temperature is different from the melting temperature. From the
thermodynamic viewpoint, melting is a first order transition between phases (Martin,
1993). Free energy of the systemremainsunchanged. Primary thermodynamic
functions, e.g., volume, density, specific volume, entropy and enthalpy undergo a sharp
discontinuity at the melting point. In fact, the latent heat of fusion is the change in
enthalpy. The glass transition is a second order transition. There is no transfer of heat
but the derived thermodynamic ftmctions, e.g., heat capacity, cubic isothermal expansion
coefficient, isothermal compressibility change abmptly. A change in some other
parameters, e.g., elastic modulus, dielectric constant, surface tension, thermal
conductivity, broad-line NMR and refractive index can also indicate the location of the
Tg.
From a kinetic viewpoint, the Tg is the temperature at which the relaxation time
for segmental motion in the polymer backbone is comparable to the time scale of the
temperature change during the measurement. Hence, the glass transition of a polymer is
not a sharp and well defined as the melting point and depends much more on the method
of measurement and on the rate of heating and cooling during the measurement.
37
The concept of plasticization can be best explained by the free volume theory
(Keutz et al., 1965). The free volume of a crystal, glass or liquid may be defined as the
difference between the free volume observed at a reference point, generally the absolute
zero temperature and the specific volume measured for the real crystal, glass, or liquid at
a given use temperature. Most of the commonly used film coating polymers have
relatively high Tg (Sakellariou et al., 1985). Thus, under normal coating
conditions, these polymers would be in the glassy state being rigid, tough and
brittle. To make these polymers more flexible, it is necessary to reduce their Tg
through a process referred to as plasticization. It can be achieved either by
internal plasticization or by external plasticization. Internal plasticization can be
done by modifying the chemical structure and by incorporating a monomer or
side chain. External plasticization is the most commonly used process to
plasticize pure polymers. Plasticizers are high boiling point liquids having low
vapor pressures at room temperature and are non-volatile (Sears and Darby,
1982). These substances act as lubricants between polymer chains facilitating
slippage of chains past chains under stress and thus extend the temperature range
for segmental rotation to lower temperatures. To be effective, a plasticizer must
interpose itself between the polymer chains and interact with the forces holding
the chains together thereby extending and softening the polymeric network.
Plasticizer efficiency is used to relate a desirable modifícation of the properties
of a given product to the amount of plasticizer required to achieve this effect.
Thus, reduction of the Tg can be taken as an indicator of the efficiency.
38
However, this has no absolute value and is only a relative measure. The
permanence of a plasticizer, i .c, its tendency to remain in the plasticized
material, depends on the size of the plasticizer molecule and its rate of diffusion
in the polymer. Since the property of the polymer is fundamentally influenced
by the plasticizer, the knowledge of its retention potential during coating and
storage has enormous signifícance. The retention potential of the plasticizer in
the polymer is influenced by its volatility. The larger the plasticizer molecule,
the lower is its vapor pressure or volatility in general, and therefore, the greater
is its permanence. The rate of diffusion of the plasticizer molecules within the
polymer matrix will also determine plasticizer permanence. However, while a
high rate of diffusion provides a greater plasticizer effíciency, it results in low
plasticizer permanence. The choice of a plasticizer, therefore, usually involves a
compromise since the requirements for good solvent compatibility. effíciency
and permanence cannot be met simultaneously (Immergut and Mark, 1965).
Optimization Techniques in Product Formulation
Optimization is a process of making a formulation as perfect as possible within
a given physical, chemical, and biological consideration. The primary goal of
pharmaceutical investigators is to efficiently determine a set of conditions that results in
an optimally performing product or process. Although ideally this could be
accomplished by the use of theoretical or mechanistic models, often pharmaceutical
systems and processes are so complex that it requires empirical models to describe
39
product or process characteristics. Qptimization methods have been extensively used in
engineering and chemical industries for many years but its application has started in use
in food and pharmaceutical industries only recentiy.
The fínal product must meet the requirements from a bioavailability, practical
mass production and product reproducibility standpoint. Using a rational approach to
the selection of a set of formulation and process variables, a formulation is qualitatively
selected. After the variables are selected, optimization is performed to quantitate a
formulation that has been determined qualitatively. The steps involved in the
optimization procedure are determination of the dependent and independent variables,
determination of the feasibility of using high and low levels of the variables,
performing statistically designed set of experiments, measurement of the response of
interest, optimization by placing constraints on the model with performing
mathematical calculations and graphical observation and verification of the optimized
formulation.
Experimental Designs
An appropriate design contains experiments, chosen such that the entire area of
interest is covered and analysis of results allows for separation of variables. Therefore,
a proper design improves the process efficiency and reduces data variability.
Depending upon the relationship obtained between dependent and independent
variables, experimental designs can be classified as first- and second-order. These will
be discussed in the foUowing sections.
40
First Qrder Designs
These designs are typically used to screen the effects of independent variables on
the response. The mathematical model of such design would be:
Y = A, + A,X, + A^X^ + A,X, + ... + A^X^ (1.3)
where Frepresents the response, ^o is the intercept and ^i-^n are the coefficients of the
factors. Based on the input data, the design calculates magnitudes and directions of the
main effects of the factors (Murray, 1992). Some of the first order designs are described
below.
Mixture Designs
Simplex lattice. This design is one of the most popular methods of defming
response surfaces formulation characteristics. It requires N = K-^\ number of
observations, where K is the number of variables. Therefore, when 3 variables are
considered, 4 observations are required. The simplex is represented by a triangle. A
three component design could be represented by an equilateral triangle in two
dimensions. For a four component design h would be a centroid in three dimensions.
When more than 4 components are involved, a single figure cannot be conveniently
constmcted but a theoretically conceived /V-sided figure in 7V-1 dimension can be
obtained. The great advantage of these designs is that the estimation of coefficients can
be obtained with minimum information (Anderson and McLean, 1974). h was reported
that a 3-component simplex optimization was used to prepare dispersible tablets of
cyproheptadine hydrochloride with different amounts of starch, magnesium stearate, and
41
dicalcium phosphate. A polynomial equation was obtained to predict disintegration time
(Goheletal., 1994).
Extreme vertices. This is an extension of the simplex lattice design. An important
featiu-e of this design is that the sum of factors should equal one. In its basic form an
extreme vertices design consists of points at the vertices of a polyhedra defined by the
upper and lower limits of the factors, points at the centroids of each end of the
polyhedron and one point at the centroid of all vertices. There is one problem with this
type of design and that is a non-uniformity of design points may exist resulting in poor
precision of the response estimate in areas having minimal trials (McLean and Anderson,
1966). Johnson et al. (1990) studied the optimization of a prolong release tablet varying
tablet matrix compositions using this design.
Fractional Factorial Designs
Fractional factorial can be of first or second order. This design is a subset of
two level factorial designs and is formed by totally confounding factor effects with
higher order interaction effects (Box et al., 1978a). Thus the individual effects cannot
be separated in the analysis. Examples of these designs are half-factorial and one
fourth-factorial designs. This is simply a block of a full factorial design. The main
advantage is that a large number of variables can be examined for main effects with
reduced number of experiments but the interaction data has to be sacrificed. The design
also lacks the ability to stand the interaction effects. A fractional factorial design was
used to evaluate the effect of various process variables in fluid bed granulation, on the
42
physico-chemical properties of granule and tablet containing a high dose, poorly water
soluble, low density and micronized dmg. The process variables studied were inlet air
temperature, inlet air flow, spray rate of the binder solution, and atomization air pressure
(Gao et al., 2002).
Plackett-Burman Screening Designs
Plackett-Burman screening designs are specifically used in the early stages of
experimentation and are intended to screen a large number of factors to find the most
significant ones affecting the observed response (Box and Draper, 1987). The design
has been applied to problems for screening over 100 factors. It allows for isolating the
main effects, but confounds all interactions with each other. Analysis of data provides
rank ordering of all variables, the magnitude and direction of each main effect on the
response variables are studied.
Khan et al. (2000) successfully prepared an osmotic tablet formulation of
captopril coated with cellulose acetate pseudolatex using Placket-Burman design to
screen formulation variables, The same design was also utilized to obtain controlled
release of ibuprofen from micromatrices of Eudragit RS-100 and Eudragit L-100. The
variables were the rate of addition of water, dmg to polymer ratio, polymer to polymer
ratio, alcohol to water ratio, amount of fiUer added, stirring speed, and compression
pressure (Kamachi et al., 1995).
43
Koshal Desiqn
These designs are the well known "one factor at a time" designs with N^ K^\
runs. For three variables only four experimental runs are needed and therefore it is very
economical. h can be of first, second or higher order (Box and Draper, 1987).
Latin Square Design
The Latin square arrangement has the property that each row and each column
receives each treatment exactly once (Box et al., I978b). This design is very popular in
clinical experiments where the number of treatments equals the number of observations.
The assumption in this design is that the effects of treatments are approximately
additive or equivalent, and no appreciable interaction occurs between them. Another
problem is the small degrees of freedom assigned to the error component in its analysis
of variance. The advantage is the small number of the experiments. The in vivo
bioavailability study of ampicillin trihydrate in different oily and aqueous suspensions
based on a 6 x 6 Latin square using the rabbit as the test animal has been investigated
(Alhamami, 2003).
Hadamard Matrix
This design has an advantage of providing good accuracy of the main effects
from a minimal number of experiments. Four parameters can be studied with eight
experiments. The experimental design introduces a reduced variable (X^) to each
44
parameter (Pi) (Montgomery, 1991). Reduced variable, which will range from -1 to
+ 1, can be calculated from the foUowing equation.
2(P ~ P )
X - — ! ^ "-^ (1.4) P - P
max min
A gentamicin carrier system composed of calcium phosphates, poly(DL-Iactide)
(PLA) and gentamicin was developed according to an experimental design based on the
Hadamard matrix. The technological variables included in the design were gentamicin
loading with respect to the implant weight, weight average molecular weight of the PLA
as a compound of the matrix and the presence or absence of a PLA coating of 200 kDa
(Baro et al., 2002).
Qrthogonal Arrays
This design is also known as Taguchi's method. This was utilized to decrease
costs and increase productivity and at the same time reduce system variability. The
typical approach to do so would be to remove the cause of the variation. However,
Taguchi recommends looking at the process and the product itself He proposed a
limited number of orthogonal arrays taken from the 2" design. Each design has two
components, inner arrays and outer arrays, both of which are experimental designs.
The inner array is built up for control factors. The outer array takes into account the
noise factors. The design requires running an outer array for each experimental run of
the inner array. Taguchi orthogonal experimental design was used to study the influence
45
of four different variables at three levels on nanoparticle size while preparing solid lipid
nanoparticles of an antitumor dmg, camptothecin.
Second Order Designs
The non-linear quadratic model generated by the design is of the form:
A,,X;-+A,,X,'^A,,Xi ^^'^^
where Frepresents the response associated with each factor level combination, AQ is the
intercept andAi-A^^ are the regression coefficients of the factors, AVA3 (Box and
Behnken, 1960). At least three levels of the factors are required to constmct the model
and the number of experiments must be greater than or equal to the number of
coefficients in the model. Some of the second order models are discussed in the
following sections.
Factorial Designs
Factorial designs are also known as Response Surface Methodology (RSM).
These designs determine the main effects and interactions simultaneously. The total
number of experiments in a factorial design is given by r, where f is the number of
factors and 1 is the number of levels. For a 3 factor 3 level design, a total of 27
experiments would be required. In pharmaceutical product development area, full
factorial designs are generally used only when five or fewer variables needed to be
investigated (Lewis et al., 1999).
46
A full factorial design was employed to investigate the influence of amount of
Eudragit® RS PO/RL PQ, a matrixing agent and HPMC K4M, an auxiliary matrixing
agent cum binder and PEG 4000, a channeling agent cum plasticizer on the properties of
a directiy compressed modified-release formulation of verapamil HCI (Gohel et al.,
2003).
The effect of formulation variables on dmg release and floating properties of a
Gastric Floating Dmg Delivery System was investigated using HPMC of different
viscosity grades and Carbopol® 934P as the formulation variables employing a fiall
factorial design (Li et al., 2003).
Simplex, fractional factorial and koshal designs described earlier can also be
modified to give second order designs.
Box-Behnken Design
This design is suitable for exploration of quadratic response surfaces and
constmcts a second order polynomial model. It helps in optimizing a process using a
small number of experimental runs. The design consists of replicated center points and
a set of points lying at the midpoints of each edge of the multidimensional cube that
defines the region of interest (Figure 1.6). For example, for three factors at three levels,
only 15 experiments (with 3 center points) are required with this design as compared to
27 experiments for a fuU factorial design.
A self-nanoemulsifíed tablet dosage form of ubiquinone was optimized using
Box-Behnken design. Amounts of copolyvidone, maltodextrin and microcrystalline
47
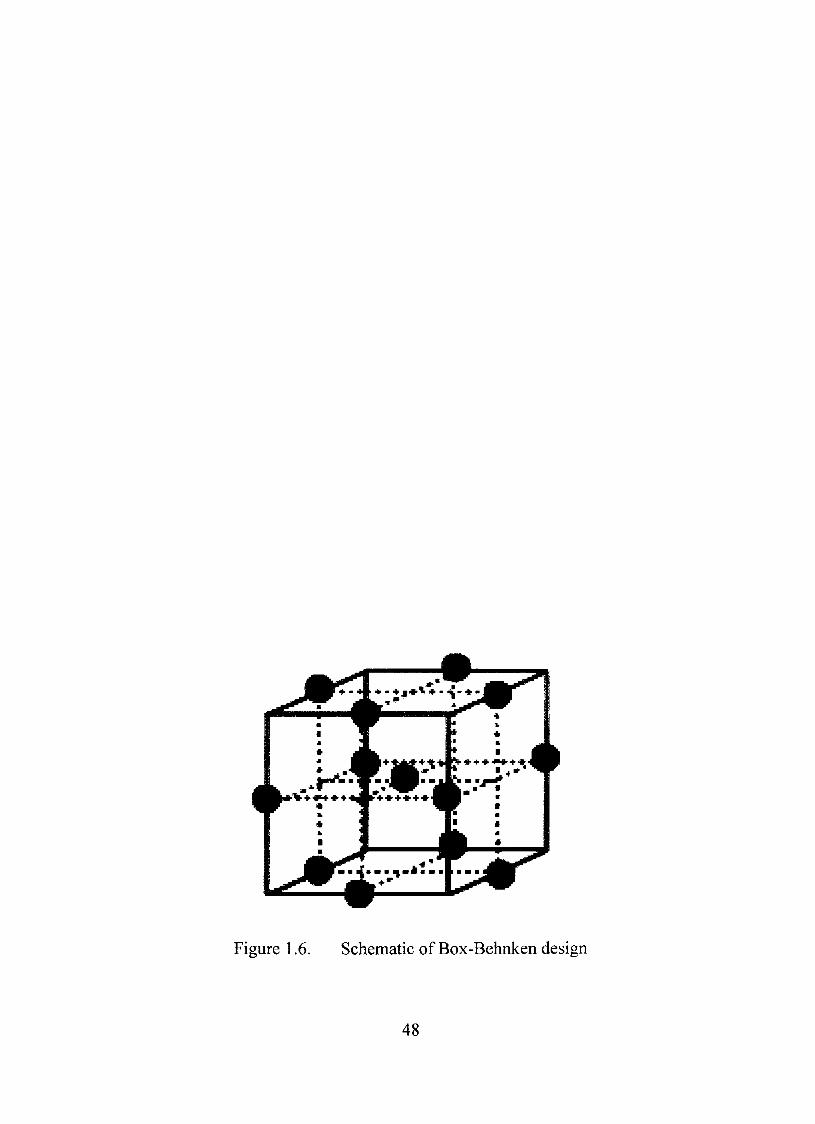
Figure 1.6, Schematic of Box-Behnken design
48
cellulose were the formulation variables whereas disintegration time, dissolution time
and 4 tablet physical properties were considered the responses (Nazzal et al,, 2002).
ControIIed release of ibuprofen from pellet dosage form coated with a latex
system was optimized using Box-Behnken design taking the solid content, volume and
plasticizer concentration of the latex as the variables (Singh et al., 1995).
Central Composite Design
This design is also known as Box-Wilson design, It is an extension of the
fractional factorial design augmented by replicated experiments at the center points and
symmetrically located star points (Box and Wilson, 1951). The replicated center point
provides a measurement of experimental error. The star points stay outside the factor
limits approximately the same distance from the center point at the comers of the two
level factorial box. The number of experimental trials, N can be obtained by
N = 2''-'' +2K + C, (1.6)
where K is the number of variables, F is the fraction of full factorial and C is the
number of replicate centerpoints. Central composite designs can be categorized in three
subtypes,
Face centered. This design is a fractional factorial design suitable for
exploration of quadratic response surfaces. It is essentially a Central Composite design
with star points normally lying outside the region of interest brought in to lie on the
boundary of the region of interest. The design provides an empirical mathematical
model to describe the effect of factors on the response. Vaithiyalingam and Khan
49
(2002) utilized this design to evaluate coating weight gain, duration of curing and
amount of plasticizer and optimized to obtain a zero order dmg release from a multi-
particulate dmg delivery system.
Qrthogonal. This is such a design that the distance from the center point to each
of the star point makes all estimated effects and interactions orthogonal to one another
in the second order model. All effects can be estimated independently. The effects of
film thickness and plasticizer concentration on salicylic acid transport through
methacrylate films in gastric and intestinal juices were studied with an orthogonal
composite design (Gumy et al., 1977).
Rotatable. If the variance of the estimated response is only a function of the
distance from the center of the design, not of the direction, the design is considered
rotatable. Therefore, rotatable central composite design has all points equally spaced
from the center point and hence, rotation around this point does not change the variance
of the responsc A rotatable central composite design was applied to predict the effects
of amounts of mannitol and crospovidone as well as compression force on the properties
of the water dispersible tablet, such as porosity, hardness, disintegration time and
increase in viscosity after dispersion (Schiermeier and Schmidt, 2002),
Methods of Qptimization
Optimization of the formulation is done after establishing the polynomial
equations. A number of techniques have been described for optimization process.
50
Simple Inspection
Simple inspection is a visual inspection of the responses to get a fairiy reasonable
idea of the levels of the factors to achieve the optimum response (Bolton, 1997). Often h
is required to have a quick guess about the effects of the factors on the responses and
sometimes it is achievable by simple inspection.
Evolutionary Operations
Evolutionary operations are techniques widely used in areas other than
pharmaceutical field especially in production situations. In this method the experimenter
makes a very small change in the formulation or process and repeats the same experiment
a number of times to determine statistically whether the product has improved. If there is
an improvement, then another change in the same direction is made and the experiment
performed many times. This procediue is continued until further changes do not improve
the product or become detrimental. However, as easily noticeable, large number of
experiments is required to obtain the optimum product and therefore, it becomes
impractical and expensive to use this technique (Box, 1957; Box and Draper, 1969).
Lagrangian Method
This classical method involves the use of calculus to optimize a response under a
certain set of constraints. The methods involves setting up constraint equations, changing
these inequality constraints to equality constraints by incorporating slack variables and
combining all the equations to a Lagrange function using a Lagrange multiplier. The
51
independent variables obtained from the partial differentiation and simultaneous
equations result in the maximum of a response with constraints on the other responsc
Lagrangian method was employed to generate optimal formulations in typical tablet
design problems and to locate optimizing levels of processing variables in a typical
encapsulation design problem (Fonner et al., 1970).
Grid Search Method
In this method the response surfaces, as defined by the appropriate equations,
are searched to locate the combination of independent variables yielding the optimum
response. The experimental range is divided into grids and searched methodically.
Contour and response surface plots are generated under specified constraints and are
superimposed to get the optimum rangc Multiple potency tablets of uniform weight
were optimized using sequential prediction analysis and grid search techniques
(Bohidar et al., 1986). This method yields good results but it is very tedious.
Computer Optimization
Computer aided optimization has practical applications in formulation and
process development as the optimization process is involved mathematically and
graphically. A variety of programs such as SAS®, RSI®, ECHIP®, X-Stat®, Statgraphics®
and Design Expert® are available. Nazzal et al. (2002) used a PC-based software
Statgraphics® to constmct a 15 mn Box Behnken design. Response surface plots and
polynomial equations were generated to determine the quadratic relationship and
52
interaction phenomena between the dependent and independent variables. An optimized
formulation was obtained and tested for the responses. Excellent agreement between the
predicted and observed values for the responses was reported.
Other Methods
Other methods of optimization include SUMT or successive unconstrained
minimization technique (Takayama et al., 1985) and SQP or successive quadratic
programming (Dawoodbhai et al., 1991). Artificial Neural Network (ANN) was
generated from the recent advances in computer science, neuroscience and applied
mathematics, It is a set of computational paradigms designed to mimic the functionality
of the human brain. They have the ability to discem complex and latent pattems in the
information. Details about this design will be discussed in a separate section.
Artificial Intelligence
Artificial intelligence (AI) has been introduced to the area of computer science to
simulate the sophisticated and intelligent computations as performed routinely by the
hiunan brain. It foUows methods, tools and systems similar to human methods of logical
and inductive knowledge acquisition, reasoning of brain activity for solving problems.
AI developments have two main categories. Expert systems, the type one includes
methods and systems that simulate human experience and draw conclusions from a set of
mles. The second type comprises of systems that model the way the brain works.
Artificial neural network is an example of the second type.
53
Expert systems depend on knowledge. It is an extension of conventional
computing and are some-times known as the fifth generation of computing. This
knowledge base allows an expert to define the mles that simulate a process of thinking
and provides a simple way to draw conclusions and solve problems by following a set of
mles. The idea of expert systems is that logical thinking can be modeled by compiling
lists of logical propositions and performing logical transformations upon them. Expert
systems were found to be useflil for medical diagnosis and other diagnostic problem
solving. It provides a guide for prediction and decision making especially in
environments where uncertainty and vagueness are present. Medical practice encounters
problems often associated with incomplete and inexact scientific models of human health
and disease and incomplete or sometimes inaccurate data about individual patients,
ANNs, the digitized models of a human brain are designed to simulate the way in
which human brain processes information. ANNs leam through experience with
appropriate leaming exemplars just as people do, not from programming. Neural
networks analyze the data and gather knowledge by detecting the pattems and
relationships, present in data. Artificial intelligent is capable of leaming, prediction and
recognition.
Artificial Neural Network
An artificial neural network (Zupan and Gasteiger, 1992; Zurada, 1992) is a
biologically inspired computational model formed from hundreds of single units,
artificial neurons, connected with coefficients, constituting the neural stmcturc They are
54
also called processing elements (PE) since they process information. Each PE has
weighted inputs, transfer function and one output. PE is an equation íhat balances inputs
and outputs. A single neuron can perform certain simple information processing
functions. But the power of neural computations is due to the interconnections of
neurons in a network. However. the intelligence of ANN is still a matter of argument.
ANN rarely has more than a few hundred or a few thousand PEs, comparing about 100
billion neurons of the human brain. This indicates that the comparison of ANN with a
human brain in complexity is still far beyond thinking, considering the creative capacity
of the human brain. There is no doubt that human brain is much more complex and many
of its intellectual fionctions are still not well known. Even though, ANNs are capable of
processing extensive amounts of data and making predictions that are sometimes
surprisingly accurate. There are many types of neural networks available till date and
new ones are invented every week but all of them can be described by the transfer
fimctions of their neurons, by the leaming rule and by the connection formula
(Agatonovic-Kustrin and Beresford, 2000).
The artificial neuron is the building block of the ANN designed to simulate the
function of the biological neuron. The signals that arrive at a neuron are called inputs.
Inputs are adjusted by multiplying by the connection weights and are fírst summed or
combined (Figure 1.7). Then they are passed through a transfer fimction to produce the
output for that neuron. The weighed sum of the neuron's inputs is activation function and
sigmoid ftinction is the most commonly used transfer function (Agatonovic-Kustrin and
Beresford, 2000).
55
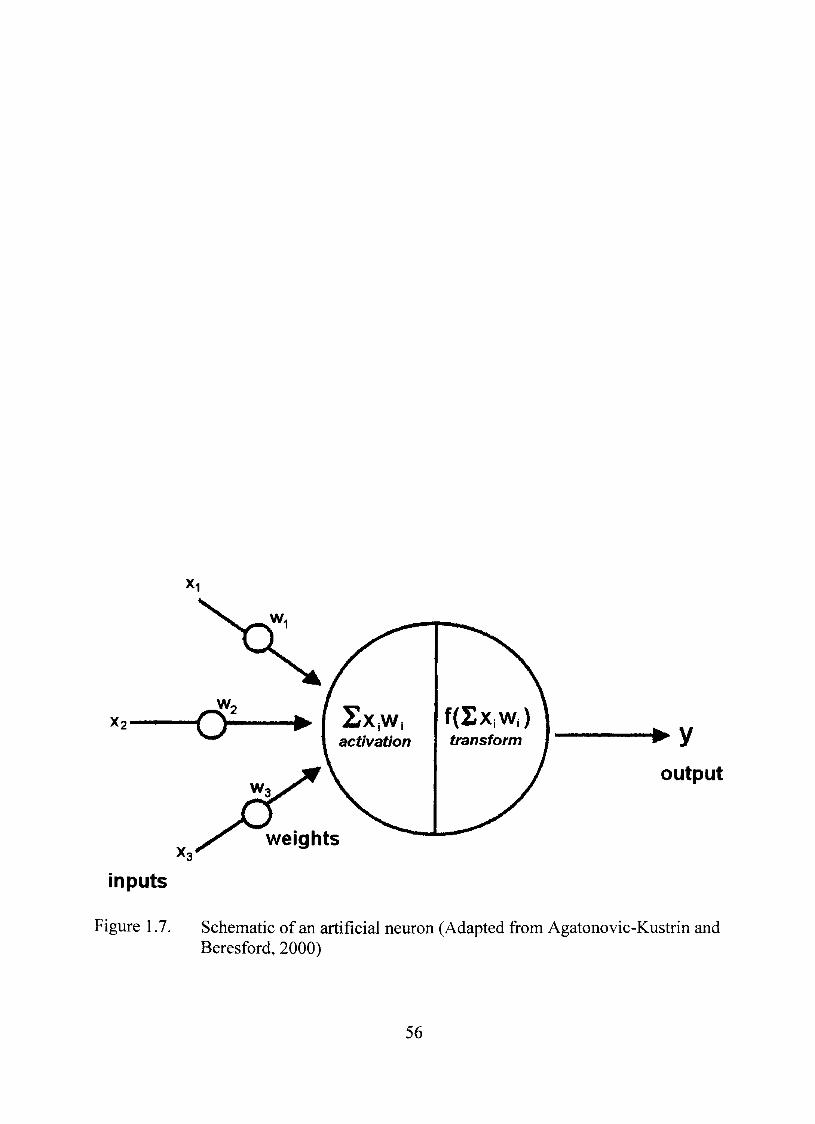
• y
output
ínputs
Figure 1.7. Schematic of an artificial neuron (Adapted from Agatonovic-Kustrin and Beresford, 2000)
56
The operation of the artificial neural network is significantiy dependent on the
way that the neurons are connected. Artificial neurons are analogous to biological
neuron with respect to receiving either excitatory or inhibitory inputs. The summing
mechanism cause of the next neuron to add up if the input is excitatory while it causes to
subtract if the input is inhibitory. A neuron can be inhibited by other neurons in the same
layer and this process is called lateral inhibition. The network wants to consider the
highest probability and inhibit all others. This concept is also known as compethion
(Agatonovic-Kustrin and Beresford, 2000).
Two types of network architecture were identified according to the absence or
presence of feedback connection, In feedback type of connections, the output of one
layer routes back to the input of a previous layer or to same layer. Each neuron has one
additional weight as an input and it will allow an additional degree of freedom when the
neuron tries to minimize the training error. Such a network keeps a memory of previous
state and therefore, the next state depends on input signals as well as on the previous
states of the network. Feedforward architecture does not have this type of back
connections (Agatonovic-Kustrin and Beresford, 2000).
A number of leaming mles have been used and the most often used is the Delta
rule or back-propagation mle. A neural network is trained to map a set of input data by
iterative adjustment of the weights. For proper recognizing abilities of ANN, the use of
the weighted links is essential. Information from inputs is fed forward through the
network to optimize the weights between neurons. During training or leaming phase,
optimization of the weights is made by backward propagation of the error. The ANN
57

reads the input and output values in the training data set and changes the value of the
weighted links in order to reduce the difference between the predicted and target values.
The network tries to minimize the error in prediction across many training cycles until
specified level of accuracy is reached. Too much training, however, is not good, since it
will overtrain and wiU lose the ability to generalize.
ANN Models and Leaming Algorithm
It is important to distinguish between ANN models, i.c, the network's
arrangement and ANN algorithms when neural networks are used for data analysis. ANN
algorithms in fact, are computations that eventually produce the network outputs. After a
network had been stmctured for a particular application, that network is ready to be
trained. There are two approaches to network training, supervised and unsupervised.
The most popular ANN is a fuUy connected, supervised network with backpropagation
leaming mle (Figure 1.8). This type of ANN performs excellent prediction and
classification tasks. Kohonen or Self Qrganizing Map is another type of ANN that
utilizes unsupervised leaming algorithm, which is excellent at finding relationships
among complex sets of data.
Supervised leaming predicts one or more target values from one or more input
variables. This leaming is a form of regression that relies on example pairs of data:
inputs and outputs of the training set. This type of network is a systen' that contains ftiUy
inter-connected neurons organized in layers, the input layer, the output layer and the
hidden layers between them. Data is provided to the input layer and the output neurons
58
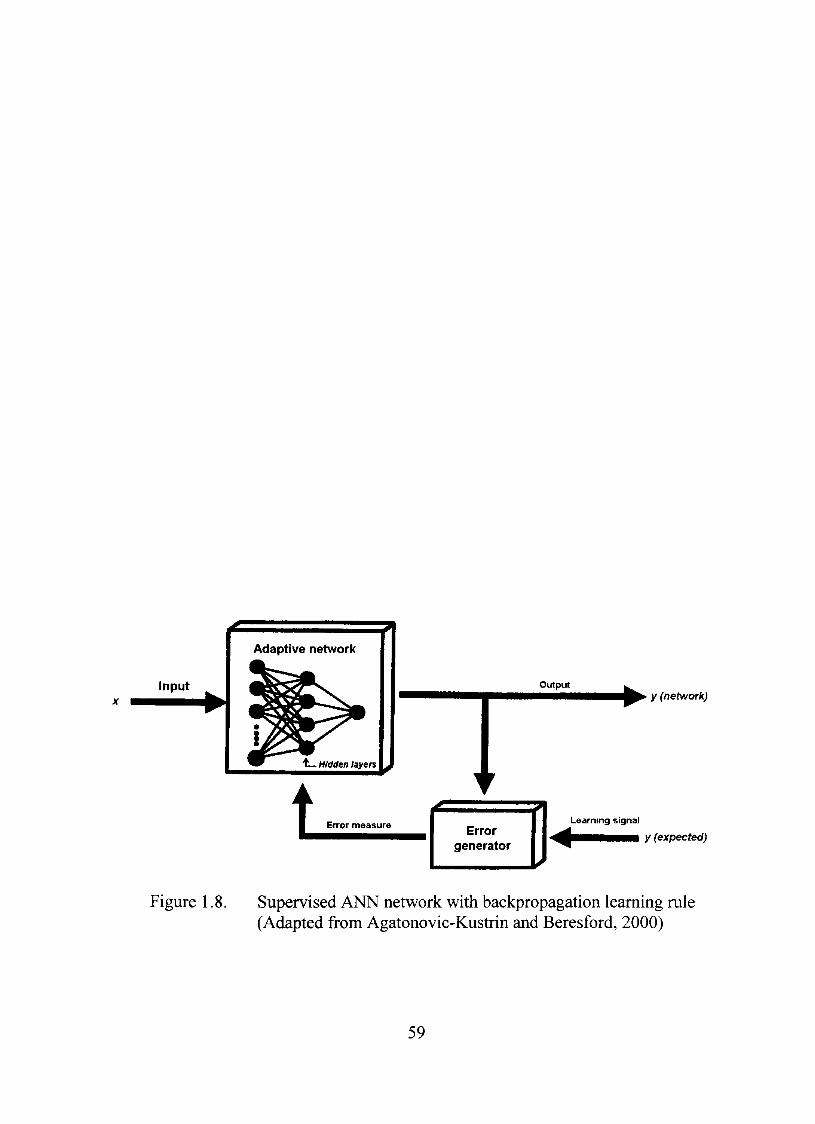
Input
Adaptive network
1— maaen layers
Output ^ ^ > y (network)
t Error measure Error generator
Learning signal
y (expected)
Figure 1.8. Supervised ANN network with backpropagation leaming mle (Adapted from Agatonovic-Kustrin and Beresford, 2000)
59
provide ANN's response corresponding to the input data. Hidden neurons communicate
only with other neurons. The large intemal pattem, including the layers determines a
solution to the problem. Theoretically, most functions can be approximated using a
single hidden layer (Ripley, 1996).
The information, which is passed from one processing element to another, is
contained within a set of weights. The network strengthens or weakens some of the
interconnections to obtain a more correct output. Back propagation of error is the most
commonly used leaming algorithm. The system fed the error in prediction backwards
through the network to adjust the weights and minimize the error, thus prevents the same
error from happening again. This process is continued with multiple training sets until
the error is minimized across many sets. This results in the mapping of inputs to outputs
via an abstract hidden layer.
The number of neurons in the hidden layer is very important since it influences
the number of connections. The system transforms the inputs by the connection weights
during training phase. Therefore, the network performance is largely dependent on the
number of connections. If too few hidden neurons are used the leaming process will be
hindered. On the other hand, involvement of too many hidden layers will depress
prediction abilities through overtraining. The ANN more closely follows the topology of
the training data set by increasing the number of the hidden neurons. However, there is
an optimum niunber above which the system wiU result in tracing the training pattem too
closely.
60
When the ANN is trained to a satisfactory level, the weighted links between the
units are saved. These same weights are then used as an analytical tool to predict results
for a new set of input data. This is a recall or prediction phase when network works only
by forward propagation of data and there is no backward propagation of error because the
model has already decided about the operating parameters for getting least error. The
output of a forward propagation is the predicted model for the validation data.
In unsupervised training, the network receives inputs but no corresponding
outputs. The system itself decides to select the features to group the input data. This is
often known as self-organization or adaptation. This behavior is characterized by
competition, co-operation or both between neurons. Neurons are organized into groups
of layers. Competitive leaming groups the neurons in such a way that when one neuron
responds more strongly to a particular input it suppresses or inhibits the output of the
other neurons in the group. The neurons within each group work together to reinforce
their output in co-operative leaming. The network trains itself by grouping the pattems
together that are similar in some way, extracting features of the independent variables and
generating its own classifications for inputs. ANNs reads the data provided to them, tries
to discover some of the properties of the data set and leams to reflect these properties in
their output. The target is to constmct feature variables in such a way that the observed
input and output variables can be predicted.
61
Application of ANN in Pharmaceutical Technology
ANN presents a promising model technique especially when non-linear
relationship is involved. To obtain a reliable outcome from ANN, the model needs to be
trained properiy. Generally, ANN requires a large number of data points to figure out the
relationship among the variables. This often limits the utility of ANN in different fields.
However, it was shovm that if the data, used in the training session is coUected
systematically, only small amount of data are sufficient to train the model
(Vaithiyalingam et al., 2000). The authors trained the ANN with the data obtained from
simplex optimization procedure and obtained desired dmg release characteristics by
mixing several beads of known strengths. Vaithiyalingam and Khan (2002) also
optimized a multi-particulate controlled release drug delivery system using ANN and
RSM models. It was found that the ANN was comparable to the RSM in calculating the
main and interaction effects.
ANN and pharmacokinetic simulations were used to design controUed release
formulation (Chen et al., 1999). Seven formulation variables and three other tablet
variables for 22 tablet formulations of a model sympathomimetic dmg were used as the
input. Three out of the four predicted formulations showed very good agreement
between the ANN predicted and the observed in vitro release profiles. ANN has also
been used in preformulation. Ebube et al. (2000) successfully used ANN to predict the
physicochemical properties e.g., hydration characteristics, Tg and rheological properties
of hydrophilic polymers and blends of hydrophilic polymers.
62
In the process miniaturization of solid dosage forms, high dmg content particles
were prepared using a fluidized bed granulator and the properties of the resulting
particles, such as the average diameter, particle strength, appearance and compressibility
using different airflow rates and atomizing flow volumes, were also investigated using
optimization of the operation conditions ANN analysis (Wang et al., 2003).
Characterization Techniques Used
The majority of pharmaceutically active ingredients are administered in the form
of solid dosage forms. Variability in the physical properties of the raw materials and
final solid products can create problematic situations, which could be avoided if those
had been better characterized (Monkhouse and Van Campen, 1984). Many dmgs can
rearrange their crystalline stmcture in the formulation, which may not be significant
chemically but might change the physical character of the dmg in the formulation. These
changes may create serious problems in terms of the reproducibility ia release and thus
affect the pharmacologic action. Recently the trend of manufacturing multi-particulate
dosage forms has been increased in pharmaceutical industry. The characterization of
coated and uncoated beads must be thoroughly investigated for a measure of quality
control and to ensure reproducibility. Performing characterization is important during
preformulation, as well as at various stages of product development. This would work as
a feedback loop to correlate the physical characteristics with the quality and behavior of
the product.
63
Physical properties can be studied at molecular and particulate levels. In most
cases, combination of several methods is required. In next few paragraphs scanning
electron microscopy (SEM), X-ray diffractometry (XRD) and infrared (IR) spectroscopy.
differential scanning calorimetry (DSC) and mechanical testing (of films) will be
discussed.
Scanning Electron Microscopy
SEM can be used to view the surface morphology of coated and uncoated
beads or tablets, which may serve to confírm, qualitatively, a physical picture of
the sample surface. It also serves as a means to keep a permanent record in the
form of photographs. The specimens first need to be coated with gold or gold-
palladium to improve conductivity. Several parameters, including acceleration
voltage, angle of tilt and working distance are optimized and kept constant when
comparisons among species are made. The surface is scanned by electron beam
where the intensity of secondary electrons is monitored. Analytical electron
microscopy makes it possible to characterize morphology, crystal stmcture, and
chemistry of minute particles as small as 10 nm. The analog STEM and SEM images can
be digitized and colored and their contrast greatly enhanced. By concentrating (focusing)
the entire beam energy into one point and scanning point-by-point STEM images are
obtained. These images can be digitized and enhanced e.g., by coloring the pertinent
features of the image. This is all carried out by an on-Iine computer using KEVEX
imaging software. KEVEX image analyzer is interfaced with a JEM-100 CX electron
64
microscope. The above different imaging modes are commonly separated into individual
electron microscopes under the name SEM, TEM (transmission electron microscopy), or
STEM (scanning and transmission electron microscopy). The AEM integrates all of
them into a single column. Thus, we can determine morphological, chemical, and
crystalline characteristics of a single clay particle without changing instruments and
without preparing different samples.
Valuable information not visible to the naked eye can be obtained from
SEM, The surface of the fílm coating provides important information in terms of
the nature of film, porosity, possible migration of drug and any rupture or cracks. In
case of coated beads, drug release rates are undoubtedly affected by the integrity of the
film. Morphology of pellets coated using different techniques were studied to figure
out their striking differences (Mehta and Jones, 1985). Therefore, SEM serves as an
effective tool to monitor surface properties of film to pharmaceutical scientists.
X-ray Powder Diffractometry
X-rays are electromagnetic radiations (EMR) that lie between ultraviolet and
gamma rays in the electromagnetic spectmm. The wavelength is expressed in angstrom
unhs (Å). Diffraction is a scattering phenomenon. Crystalline materials diffract X-rays
when the interatomic distances within lattices are similar to the wavelength of X-rays.
Bragg's equation (Equation 1.7), which relates the wavelength (Å) of the EMR, the
interplanar spacing of the crystal (d) and the diffraction angle (0) can be utilized to study
65
powder diffractometry of crystalline substances. In the equation n is the order of the
diffraction, which is 1 in most experimental setups.
nÅ = 2dsinØ (1.7)
Each crystalline solid has a characteristic set of d-spacings. Sample preparation is
a critical step in the process. Proper grinding of the powder mixture and appropriate
packing of the sample holder are required to reduce possibilities of preferred orientation,
crystallite size and microabsorption (Suryanarayanan, 1995). Therefore solid samples are
powdered before scans are performed. The intensity of X-ray reflections from a sample
is measured as a fimction of the contact angle.
The diffraction pattem may be used to identify different polymorphic forms of a
compound qualitatively. Computerized comparisons can be made for a pure compound
from existing powder pattems maintained as a database by the Intemational Center for
Diffraction Data (ICDD). The crystalline state of a sample is characterized by a
perfectly ordered lattice and the noncrystalline (amorphous) state is characterized by
the absence of a lattice. These are two extremes of lattice order and intermediate states
are possible. The term, degree of crystalinity is useful to quantify ihese intermediate
states of order, In general, the diffraction peak heights are integrated to peak areas.
The appearance or disappearance of any peak reflects the possible change in the crystal
stmcture of the specimen.
66
Fourier Transform Infrared Spectroscopy (FTIR)
Infrared spectroscopy is an important technique in organic chemistry and can be
successfuUy applied to the pharmaceutical field since all dmgs are pure chemical
enthies. It is an easy measure to identify the presence of certain fiinctional groups in a
molecule. Also, the unique coUection of absorption bands can be used to confirm the
identity of a pure compound or to detect the presence of specific impurities. The IR band
consists of three regions, near-, mid-, and far-IR regions, with their respective energy,
frequency or wave number limits. When a broad band source of energy irradiates a
sample, it absorbs energy of particular type due to transhions between molecular
vibrational, bending and rotational stretching of different types of chemical bonds
present in the compound. Brief instmmentation and principle of a Fourier transform
infrared spectrophotometer wiU be discussed in the foUowing paragraphs.
A source generates light across the spectmm of interest. The sample absorbs light
according to its chemical properties. AIl the sources of energies are sent through an
interferometer and onto the samplc In every scan, all source radiation gets to the samplc
The interferometer is a fundamentally different piece of equipment than a
monochromater. A monochromater, which is used in conventional IR spectrophotometer
can be either a salt prism or a grating with finely spaced etched lines. It separates the
source radiation into its different wavelengths. However, in the interferometer the light
passes through a beamsplitter, which sends the light in two directions at right angles.
One beam goes to a stationary mirror then back to the beamsplitter. The other goes to a
moving mirror. The motion of the mirror makes the total path length variable versus that
67
taken by the stationary-mirror beam. When the two meet up again at the beamsplitter,
they recombine, but the difference in path lengths creates constmctive and destructive
interference, an interferogram. The recombined beam passes through the sample. The
sample absorbs all the different wavelengths characteristic of hs spectmm, and this
subtracts specific wavelengths from the interferogram. The detector now reports
variation in energy versus time for all wavelengths simultaneously. A laser beam is
superimposed to provide a reference for the instmment operation. The initial data come
as energy versus time profile. A mathematical function called a Fourier transform allows
the computer interfaced instmment to convert an intensity versus time spectmm into an
intensity versus frequency or wave number spectrum.
There are several advantages to this design over conventional IR instmments, All
of the source energy gets to the sample, improving the inherent signal to noise ratio.
Resolution is lunited by the design of the interferometer. The longer the path of the
moving mirror, the higher the resolution. Even the least expensive FT instmment
provides better resolution that all but the best continuous wave (CW) instmments were
capable of The digitization and computer interface allows multiple scans to be coUected,
also dramatically improving the signal to noise ratio. Most of the computer programs
today allow further mathematical refmement of the data. A reference spectmm can be
subtracted, the baseline can be adjusted, spurious peaks can be edited or otherwise
corrected for sample limitations. The one minor drawback is that the FT instmment is
inherently a single beam instmment, it cannot use the channel ratio trick used in CW
operation. One result is that IR-active atmospheric components (CO2, H2O) will appear
68
in the spectmm. Usually, a background spectmm is mn and then automatically
subtracted from every spectmm.
Differential Scanning Calorimetry
In differential scanning calorimetry, the difference in heat flow between a
sample and a reference is measured as a function of time and temperature. both
the sample and reference being kept at controlled and similar environment. The
DSC plots are obtained as the differential rate of heating against temperature.
The area under the peak is directly proportional to the heat absorbed or evolved
by the thermal event and the heat of the reaction can be calculated from this peak
area. DSC curve may be used to determine some physical processes, e.g.,
crystallization, evaporation, melting, fusion and Tg. DSC can also be used to
determine the purity of a sample. A sharp symmetric curve indicates purity and
a broad asymmetric peak indicates more than one thermal process or impurities.
Mechanical Testing of Films
Mechanical strength of solids can be studied following the deformation by
tension, bending, shear, torsion and compression. However, tensile study is the
most commonly used mechanical testing for fílms. American Standard for
Testing Materials (ASTM) requires the data for tensile properties obtained in the
form of load-time, load displacement or stress-strain profíle. According to
Hooke's law, the stress is directly proportional to the strain.
69
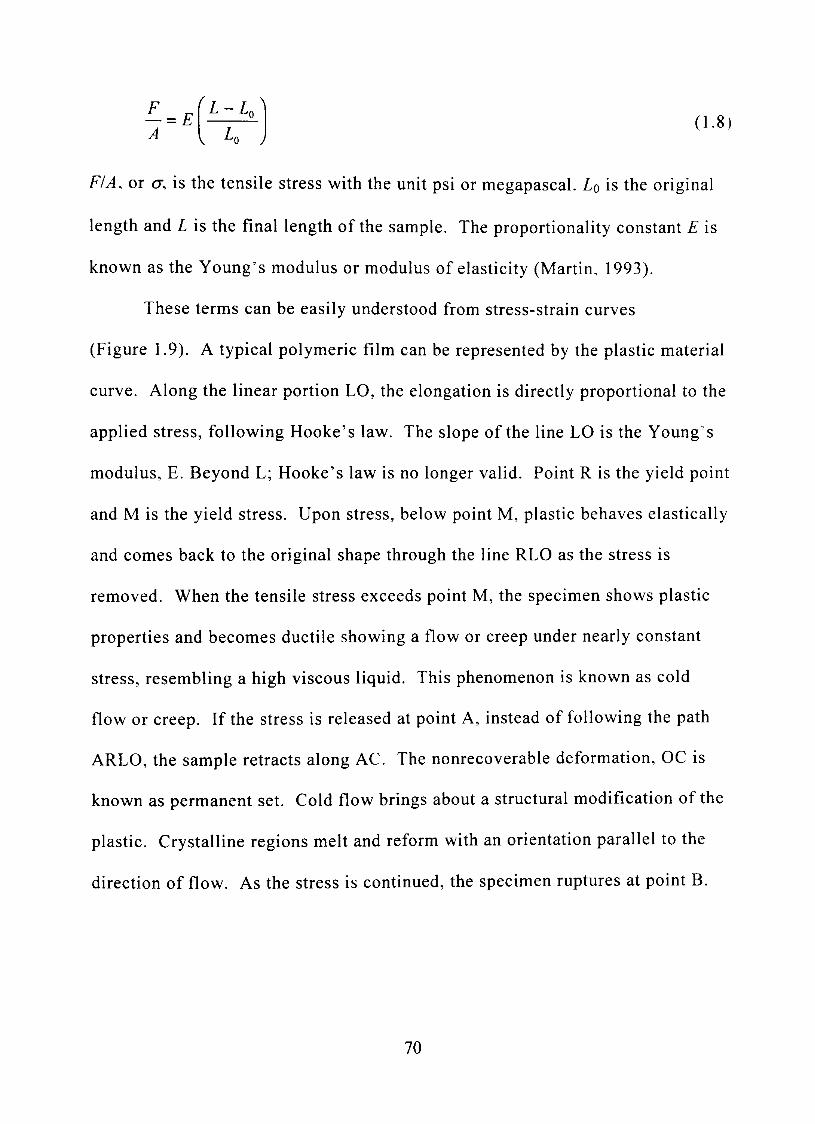
A (1.8)
F/A. or o-, is the tensile stress with the unit psi or megapascal. LQ is the original
length and L is the final length of the sample. The proportionality constant E is
known as the Young's modulus or modulus of elasticity (Martin, 1993).
These terms can be easily understood from stress-strain curves
(Figure 1.9). A typical polymeric fílm can be represented by the plastic material
curve. Along the linear portion LO, the elongation is directly proportional to the
applied stress, following Hooke's law. The slope of the line LO is the Young s
modulus, E. Beyond L; Hooke's law is no longer valid, Point R is the yield point
and M is the yield stress. Upon stress, below point M, plastic behaves elastically
and comes back to the original shape through the line RLO as the stress is
removed. When the tensile stress exceeds point M, the specimen shows plastic
properties and becomes ductile showing a flow or creep under nearly constant
stress, resembling a high viscous liquid, This phenomenon is known as cold
flow or creep. If the stress is released at point A, instead of following the path
ARLO, the sample retracts along AC. The nonrecoverable deformation, OC is
known as permanent set. Cold flow brings about a structural modifícation of the
plastic Crystalline regions melt and reform with an orientation parallel to the
direction of flow. As the stress is continued, the specimen ruptures at point B.
70
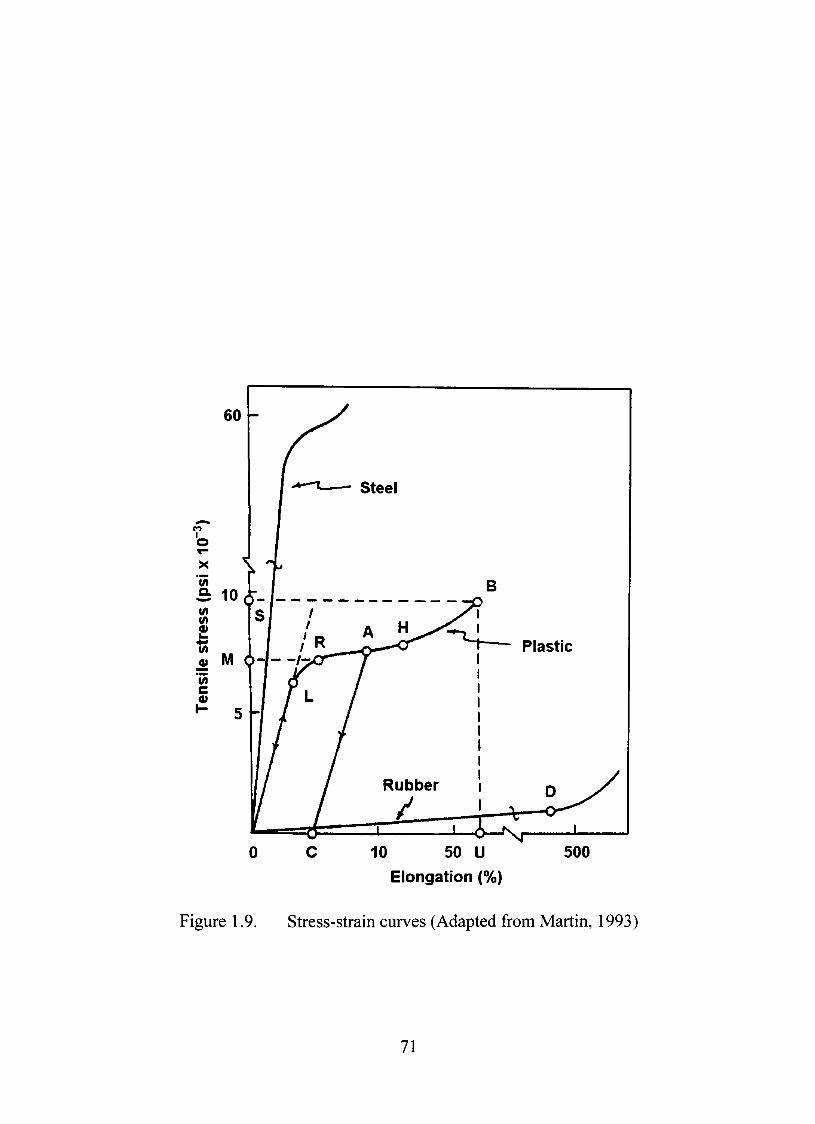
10 50 U Elongation (%)
Figure 1.9. Stress-strain curves (Adapted from Martin, 1993)
71
The corresponding stress, S and the corresponding elongation, U are known as
the tensile strength or ultimate strength and the elongation at break or the
ultimate elongation (Martin, 1993).
The ultimate elongation is most popularly represented by percent
increased in length (% elongation) and signifíes the flexibility of the fílm
sample. The modulus of elasticity represents the hardness or softness of a
specimen. Tensile strength indicates the strength of the fílm telling if the sample
is strong or weak. Toughness or brittleness of the specimen can be measured by
the area under the stress-strain curve and is actually the energy or work required
to break the polymeric material. The unit of area under the curve is megajoule
e=B
per cubic meter. The area would be equal to \a ds, where z is the elongation 0
of the sample (Martin, 1993).
A description on official and unofficial mechanical tests for polymeric
material was given by Lever and Rhys (1968).
Surface Roughness Study
Study of surface profile may take an important part in designing pharmaceutical
formulation. Since coating is a process which involves the adhesion of the coating
materials to the substrate, the surface characteristics of the substrate may influence
coating efficiency. The initial core should have some roughness to hold the film coating
on it. h was shown that increasing surface roughness of tablets led to increase adherence
72
of the coating with them (Felton and McGinity, 1999; Nadkami et al., 1975). As the
coating process goes on, the surface profiles of the tablet or pellets changes gradually.
Usually the surface becomes smoother and after sometimes, it starts to become rough
again. The transition point is probably the indication of the completion of a layer. A
solution with HPMC yielded minimum surface roughness until 2 m/u. After that the
roughness was increased. Polymer concentration in the coating solution too was shown
to influence the surface roughness of tablets. HPMC concentration in solution used over
2%, increased roughness of films (Rowe, 1978). It suggests the presence of an optimum
concentration of polymer for getting the best effects. Vaithiyalingam et al, (2002)
studied the effect of coating weight gain on surface roughness of multi-particulate system
and it was found that after a certain weight gain the roughness was steady.
Perthometer Concept® of Mahr Corporation is an instmment that can be used to
measure the surface roughness profile of solids. The needle shape sensor moves within a
specified area over the surface of a specimen and calculates the roughness using several
roughness parameters. R^ (Equation 1.9) is the arithmetic mean deviation of the
roughness profile (aka roughness average), R^ (Equation 1.10) is the root mean square
deviation of the roughness profile (aka RMS roughness). Z(x) are the profile ordinates of
the roughness profile and / is the length of the profilc
R^ = ^j]\Z(x)\dx (1.9)
R^=J^-\zUx)dx (1-10) 7 í^' ( )
73
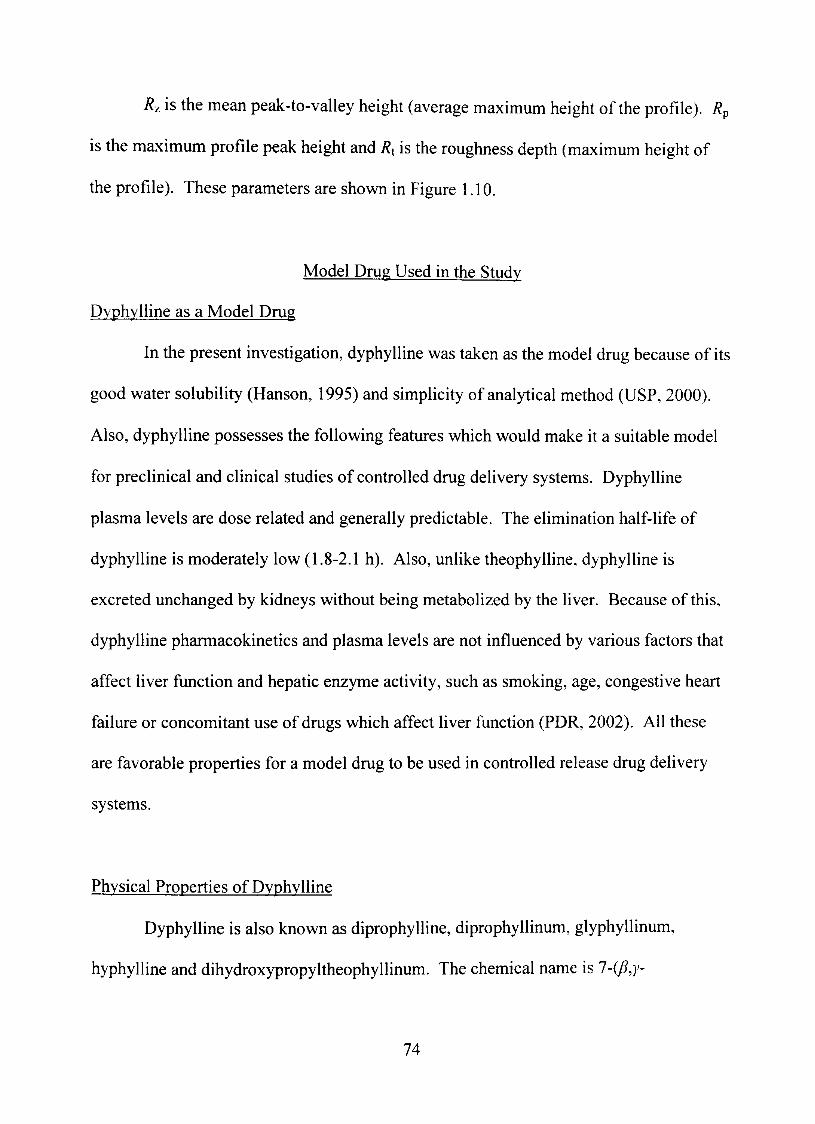
i?z is the mean peak-to-valley height (average maximum height of the profile). R^
is the maximum profile peak height and Rt is the roughness depth (maximum height of
the profile). These parameters are shown in Figure 1.10.
Model Dmg Used in the Studv
Dyphylline as a Model Dmg
In the present investigation, dyphylline was taken as the model drug because of its
good water solubility (Hanson, 1995) and simplicity of analytical method (USP, 2000).
Also, dyphylline possesses the foUowing features which would make it a suitable model
for preclinical and clinical studies of controlled dmg delivery systems. Dyphylline
plasma levels are dose related and generally predictable. The elimination half-Iife of
dyphylline is moderately low (1.8-2.1 h). AIso, unlike theophylline, dyphylline is
excreted unchanged by kidneys without being metabolized by the liver. Because of this,
dyphylline pharmacokinetics and plasma levels are not influenced by various factors that
affect liver fionction and hepatic enzyme activity, such as smoking, age, congestive heart
failure or concomitant use of drugs which affect liver function (PDR, 2002). All these
are favorable properties for a model dmg to be used in controlled release drug delivery
systems.
Physical Properties of Dyphylline
Dyphylline is also known as diprophylline, diprophyllinum, glyphyllinum,
hyphylline and dihydroxypropyltheophyllinum. The chemical name is 7-05,)'-
74
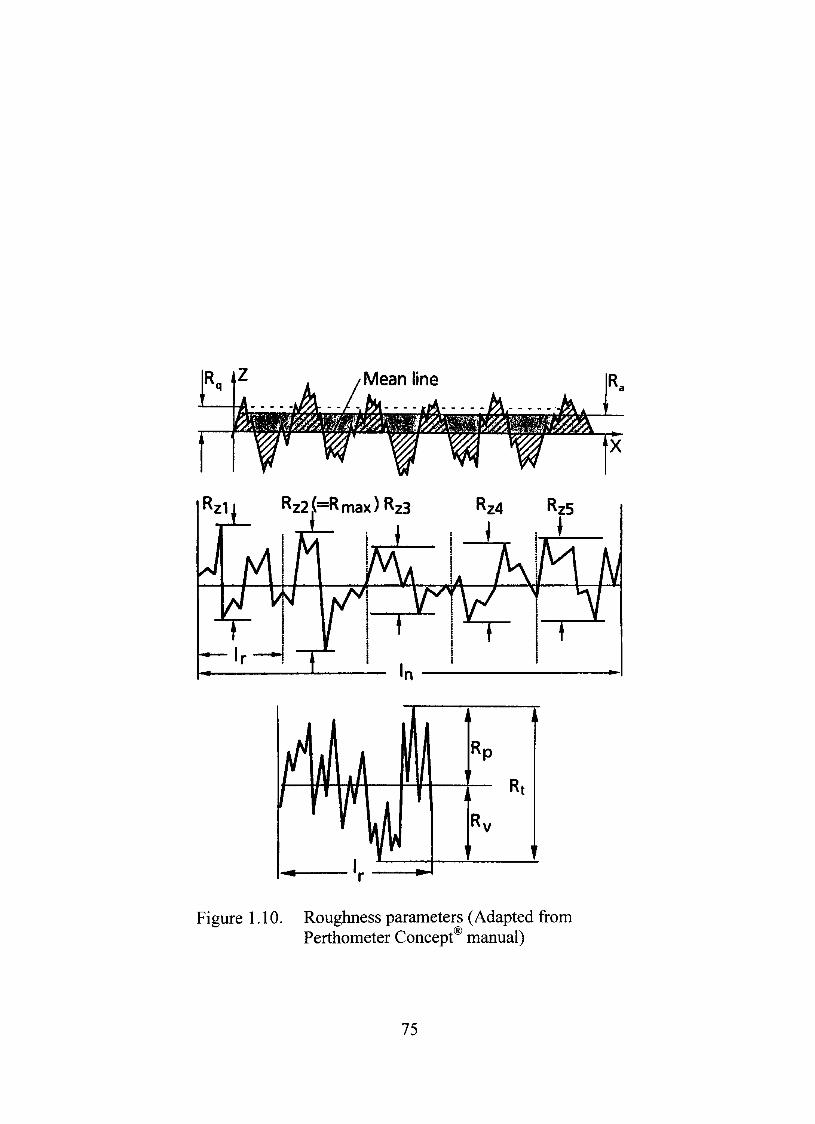
Rzl i R22 ,(==R max) Rz3
MA ^^ni 1 !
m ' -^ r
i
'
Rp
. P
Rv • 1'
Figure 1.10. Roughness parameters (Adapted from cg) Perthometer Concept manual)
75
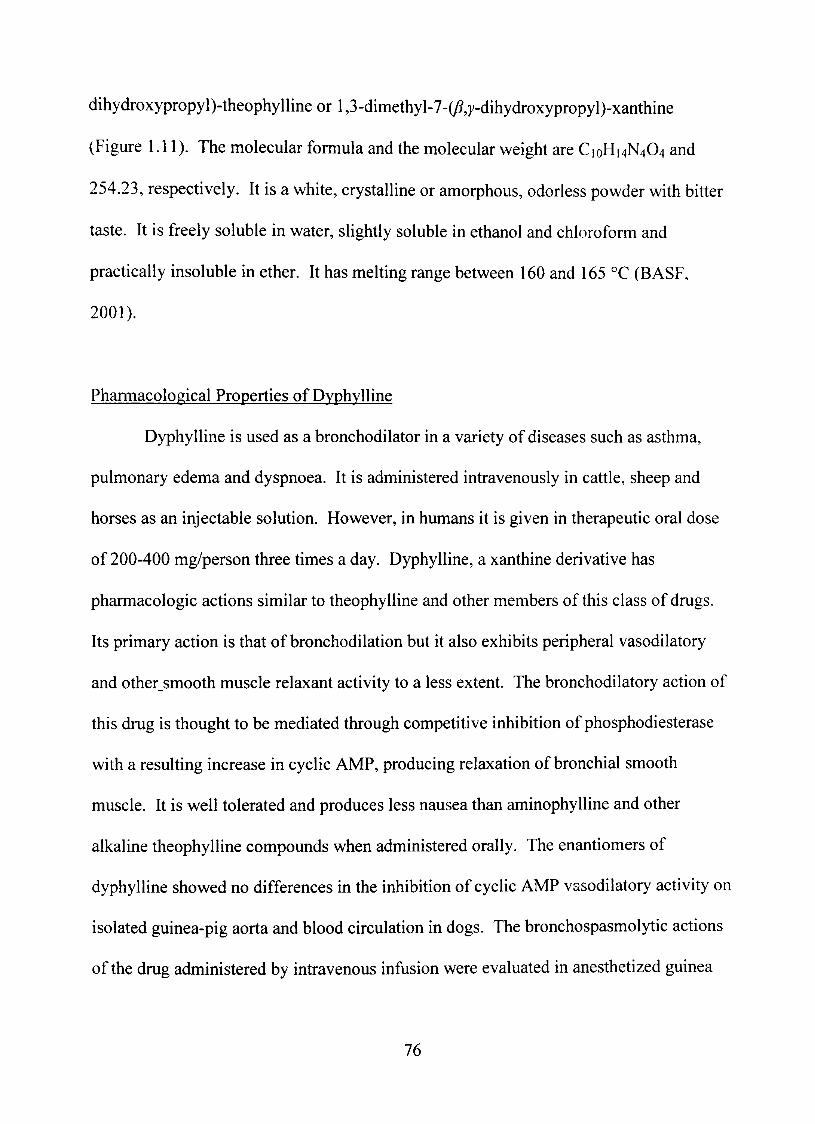
dihydroxypropyl)-theophylline or 1,3-dimethyI-7-(/î,y-dihydroxypropyI)-xanthine
(Figure 1.11). The molecular formula and the molecular weight are CIQHHN^Q^ and
254.23, respectively. It is a white, crystalline or amorphous, odorless powder with bitter
taste, h is freely soluble in water, slightly soluble in ethanol and chloroform and
practically insoluble in ether. It has melting range between 160 and 165 °C (BASF,
2001).
Pharmacological Properties of Dyphylline
Dyphylline is used as a bronchodilator in a variety of diseases such as asthma,
pulmonary edema and dyspnoea. It is administered intravenously in cattle, sheep and
horses as an injectable solution. However, in humans it is given in therapeutic oral dose
of 200-400 mg/person three times a day. Dyphylline, a xanthine derivative has
pharmacologic actions similar to theophylline and other members of this class of dmgs.
Its primary action is that of bronchodilation but it also exhibits peripheral vasodilatory
and othersmooth muscle relaxant activity to a less extent. The bronchodilatory action of
this dmg is thought to be mediated through competitive inhibition of phosphodiesterase
with a resulting increase in cyclic AMP, producing relaxation of bronchial smooth
muscle. It is well tolerated and produces less nausea than aminophylline and other
alkaline theophylline compounds when administered orally. The enantiomers of
dyphylline showed no differences in the inhibition of cyclic AMP vasodilatory activity on
isolated guinea-pig aorta and blood circulation in dogs. The bronchospasmolytic actions
of the dmg administered by intravenous infusion were evaluated in anesthetized guinea
76
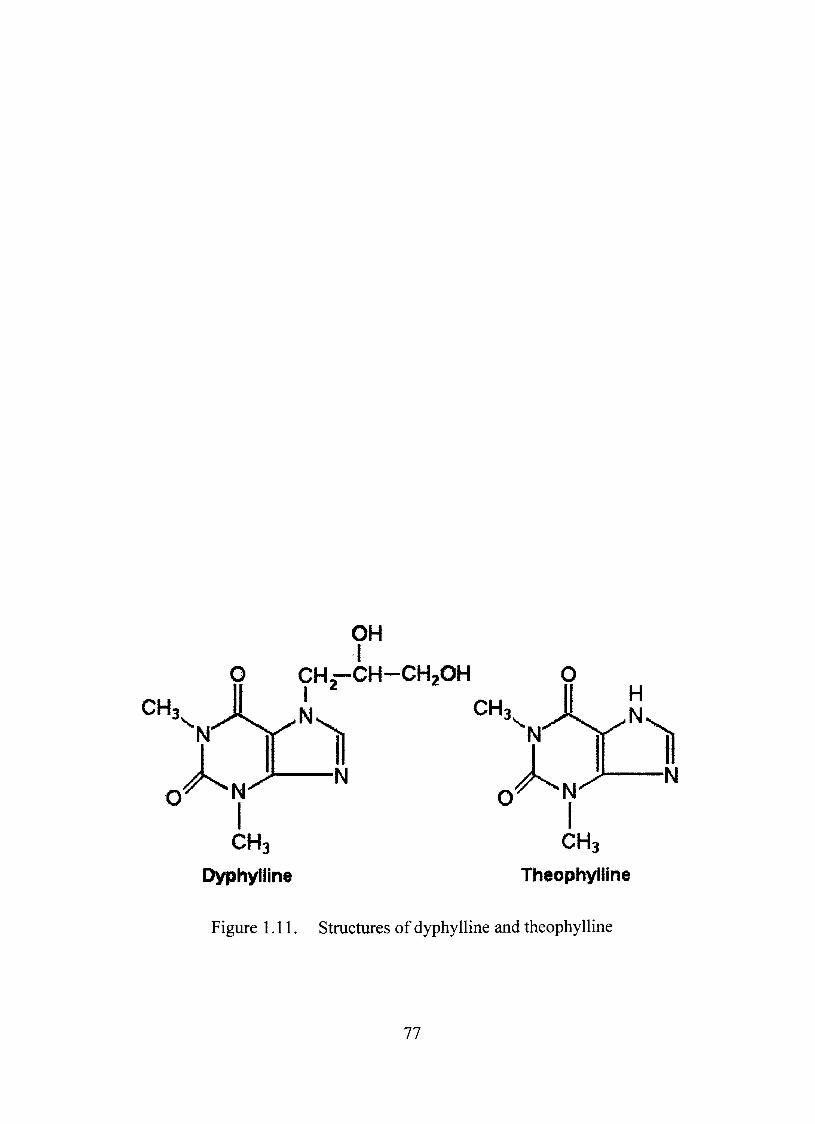
CH
OH I
O CH2-CH-CH2OH
CH
CH3
Dyphyiljne
CH3
Theophylllne
Figure 1.11. Structures of dyphylline and theophylline
77
pigs. h was given alone at doses of 320 to 640 mg/kg but had no effect on lung function.
High doses caused a fall in blood pressure and an increase in heart rate. However, the
drug_was effective in reducing bronchoconstriction induced by various mediators, viz.
histamine, serotonin and bradykinin (EMEA, 1998). hs plasma levels are dose related
and generally predictable. The range of plasma levels within which dyphylline can be
expected to produce effective bronchodilation has not been determined (PDR, 2002).
Pharmacokinetics of Dyphylline
Unlike the hydrolysable salts of theophylline, dyphylline is not converted to free
theophylline in vivo. It is excreted unchanged by the kidneys without being metabolized
in the liver. About 84% of the dmg was coUected in urine. Because of this, its
pharmacokinetics and plasma levels are not influenced by various factors that affect liver
function and hepatic enzyme activity, such as smoking, age, or concomitant use of dmgs
which affect liver fiinction (PDR, 2002). It is rapidly absorbed in therapeutic active form
and in healthy volunteers reaches a peak plasma concentration of 19.3-23.5 //g/ml in
around 1 h following a single dose of 19-27 mg/kg of the dmg (Simons and Simons,
1979). The minimal therapeutic concentration is 12 /ig/mL (Hanson, 1995). It is almost
completely absorbed from the gastro-intestinal tract with an oral bioavailability of about
90%. In animals too, the pharmacokinetics data revealed that dyphylline is not
metabolized. It is eliminated as the parent compound in the urine. Plasma elimination
half-Iife is very short (-2 hrs) and h is widely distributed in the body (r^ = 1.0 L/kg).
The elimination half-life of dyphylline in rabbh was found to be 0.74 hrs, The apparent
78
volume of distribution and total body clearance in rabbit were 1008 mL/kg and 942
mL/h/kg, respectively.
Dyphylline is rapidly absorbed from the GI tract and form the site of intra
muscular injections. The renal clearance would be correspondingly reduced in patients
with impaired renal function. In anuric patients, the half life may be increased 3-4 times
normal.
Commercial Preparations of Dyphylline
Some of the commercially available dosage forms of dyphylline are listed below.
Dilor®- Tablets, 200 and 400 mg (Savage Labs)
Dilor®- Elixir, 53 mg/ 5 mL
Dilor^- Injection (IM), 250 mg/mL
Dilor-G®- Tablet, dyphylline 200 mg and Guaifenesin 200 mg
Dilor-G®- Liquid, dyphylline 100 mg and Guaifenesin 100 mg in each 5 mL
Lufyllin-- Tablets, 200 and 400 mg (Carter-Wallace)
Lufyllin®- Injection (IM), 250 mg/mL
Lufyllin®-GG- Film coated tablet, dyphylline 200 mg and Guaifenesin 200 mg
Lufyllin®-GG- Elixir, dyphylline 100 mg and Guaifenesin 100 mg in each 15 mL
Dyflex®-Tablets, 200 and 400 mg (Econo Med)
Dyflex®-G- Tablet, dyphylline 200 mg and Guaifenesin 200 mg
Neothylline®- Tablets, 200 and 400 mg (Lemmon, Major)
NeothyIIine®GG- Tablet, dyphylline 200 mg and Guaifenesin 200 mg (Teva)
79
Dyline-GG®- Liquid, dyphylline 100 mg and guaifenesin 100 mg in each 5 mL (Seatrace)
,® Dyline-GG - Tablet, dyphylline 200 mg and Guaifenesin 200 mg
80
CHAPTER II
PURPOSE OF STUDY
Hypothesis
The hypothesis of the present study was "starch acetate with high degree of
substitution may be utilized as a coating agent to obtain controUed dmg delivery from a
multi-particulate system." A number of raw materials and methods were investigated to
synthesize starch acetate with high degree of substitution. Multi-particulate beads were
used to carry the model dmg, dyphylline. Rats were used in the bioavailability study.
Qbiectives
The overall objectives of the present study are summarized below.
• Synthesis and characterization of starch acetate:
• To develop a suitable method with a suitable raw material for the synthesis of
high degree of substitution of starch acetate.
• To characterize the synthesized starch acetate with degree of substitution,
molecular mass, infrared spectroscopy and X-ray diffractometry.
• To characterize starch acetate in solution with rheological and surface tension
studies.
• To prepare free films and observe the effects of various plasticizers on film
properties using visual, mechanical, thermal, scanning electron microscopic and
diffusion analyses.
81
Screening and optimization of formulation and process variables of film coating and
characterization of the optimization formulation:
• To study the compatibility of the dmg with some excipients for dmg loading
using thermal, infrared and content analyses and prepare drug loaded multi-
particulate beads.
a To screen a number of formulation and process variables for controlled release of
dyphylline from the multi-particulate system.
• To understand the main and interaction effects of formulation and process
variables that affect the coated bead properties.
u To optimize the coated bead system using RSM and ANN.
• To find out the dmg release mechanism from the optimized system.
• To characterize the optimized formulation by thermal, X-ray. infrared and
electron microscopic analyses.
• To correlate film formation with the surface roughness of coated beads.
In vitro and in vivo dmg release study from the optimized formulation:
• To investigate the effect of pH and enzyme on the integrity of the coating.
• To study the in vivo dmg release from the optimized formulation in rats.
82
CHAPTERIII
MATERIALS AND METHODS
The list of materials used is provided in Table 3.1. The list of instmments and
softwai'e is available in Table 3.2.
Synthesis of Starch Acetate
Starch acetate was synthesized by acetylation of native (chemically unmodified)
com starch. Commercially available com starch, Pure-Dent® B700 with about 25%
amylose was used for this purpose. However, using Pure-Dent® B700 directly in the
acetylation reaction would not yield high degree of acetylation, This is because, starch in
native form remains as granules of concentric regions of altemate crystalline and
noncrystalline segments and therefore, untreated starch granules keep the molecules inside
the granules intact as these do not come in contact with the acetylating agents for reaction
(Mullen and Pacsu, 1942; Wolff et al., 1951). Reaction with unmodified starch yielded low
dS (<1) starch acetate, which was unacceptable for our work. Hence, starch acetate was
synthesized in two steps.
Pregelatinization of Com Starch
To increase the degree of acetylation, the native com starch must be
pregelatinized as much as possible before the reaction. Fifty grams of starch was
suspended in 550 mL of deionized water in a 1000-mL conical flask. The suspension
83
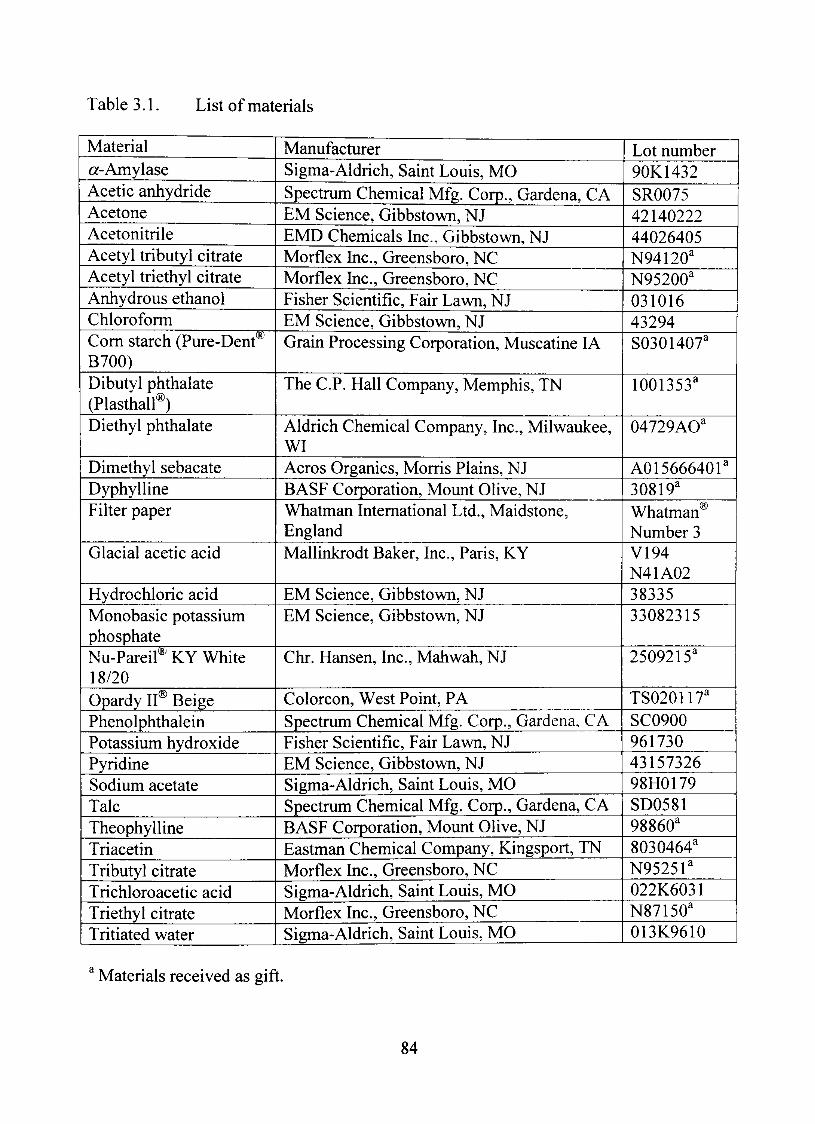
Table3.1 List of materials
Material a-Amylase Acetic anhydride Acetone Acetonitrile Acetyl tributyl citrate Acetyl triethyl citrate Anhydrous ethanol Chloroform Com starch (Pure-Dent® B700) Dibutyl phthalate (Plasthall®) Diethyl phthalate
Dimethyl sebacate Dyphylline Filter paper
Glacial acetic acid
Hydrochloric acid Monobasic potassium phosphate Nu-Pareil'' KY White 18/20 Opardy II® Beige Phenolphthalein Potassium hydroxide Pyridine Sodium acetate Talc Theophylline Triacetin Tributyl citrate Trichloroacetic acid Triethyl citrate Tritiated water
Manufacturer Sigma-Aldrich, Saint Louis, MO Spectmm Chemical Mfg. Corp., Gardena, CA EM Science, Gibbstown, NJ EMD Chemicals Inc, Gibbstown, NJ Morflex Inc, Greensboro, NC Morflex Inc, Greensboro, NC Fisher Scientific, Fair Lawn, NJ EM Science, Gibbstown, NJ Grain Processing Corporation, Muscatine lA
The C.P. Hall Company, Memphis, TN
Aldrich Chemical Company, Inc, Milwaukee, WI Acros Organics, Morris Plains, NJ BASF Corporation, Mount Olive, NJ Whatman Intemational Ltd., Maidstone, England Mallinkrodt Baker, Inc, Paris, KY
EM Science, Gibbstown, NJ EM Science, Gibbstown, NJ
Chr. Hansen, Inc, Mahwah, NJ
Colorcon, West Point, PA Spectmm Chemical Mfg. Corp., Gardena. CA Fisher Scientific, Fair Lawn, NJ EM Science, Gibbstown, NJ Sigma-AIdrich, Saint Louis, MO Spectmm Chemical Mfg. Corp., Gardena, CA BASF Corporation, Mount Olive, NJ Eastman Chemical Company, Kingsport, TN Morflex Inc, Greensboro, NC Sigma-Aldrich, Saint Louis, MO Morflex Inc, Greensboro, NC Sigma-Aldrich, Saint Louis, MO
Lot number 90K1432 SR0075 42140222 44026405 N94I20' N95200' 031016 43294 S0301407'
1001353'
04729AO'
A015666401' 30819' Whatman" Number 3 V194 N41A02 38335 33082315
2509215'
TS020117' SC0900 961730 43157326 98H0179 SD0581 98860' 8030464' N95251' 022K6031 N87150' 013K9610
Materials received as gift.
84
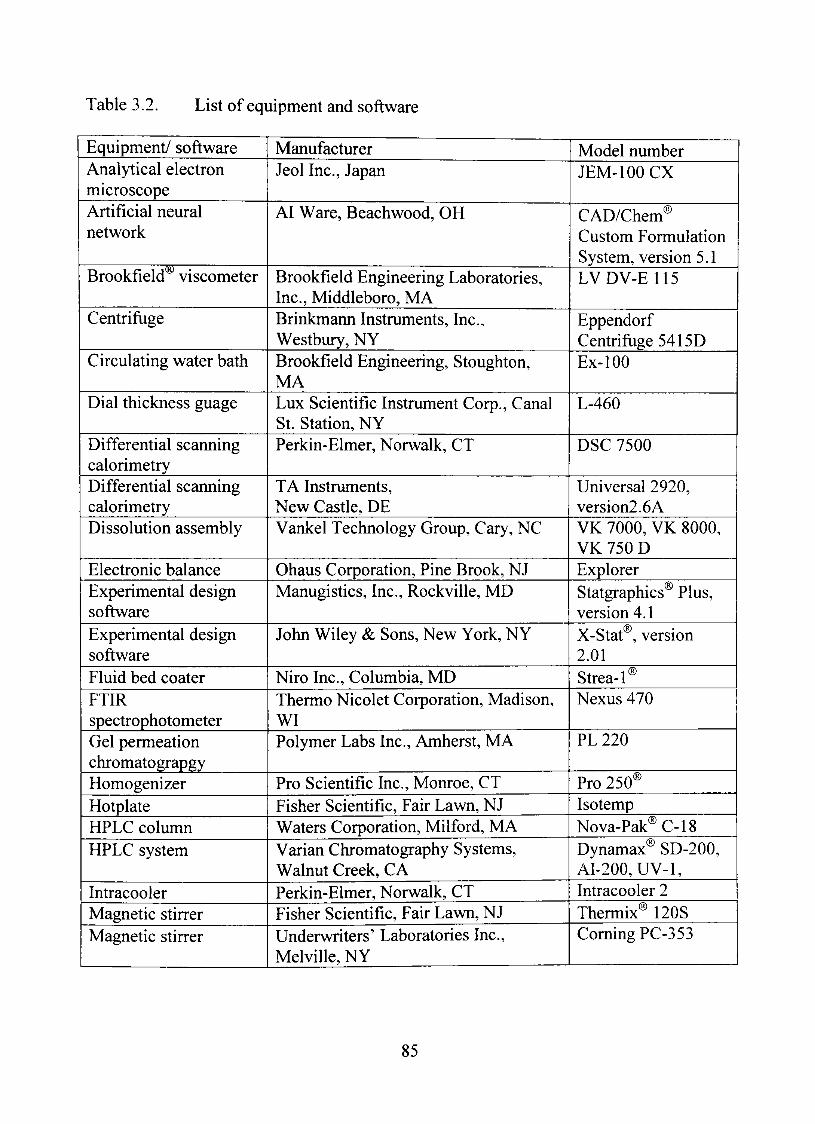
Table 3.2. List of equipment and software
Equipment/ software Analytical electron microscope Artificial neural network
Brookfield^ viscometer
Centrifuge
Circulating water bath
Dial thickness guage
Differential scanning calorimetry Differential scanning calorimetry Dissolution assembly
Electronic balance Experimental design software Experimental design software Fluid bed coater FTIR spectrophotometer Gel permeation chromatograpgy Homogenizer Hotplate HPLC column HPLC system
Intracooler Magnetic stirrer Magnetic stirrer
Manufacturer Jeol Inc, Japan
AI Ware, Beachwood, OH
Brookfield Engineering Laboratories, Inc, Middleboro, MA Brinkmann Instmments, Inc, Westbury, NY Brookfield Engineering, Stoughton, MA Lux Scientific Instrument Corp., Canal St. Station, NY Perkin-EImer, Norwalk, CT
TA Instmments, New Castie, DE Vankel Technology Group, Cary, NC
Qhaus Corporation, Pine Brook, NJ Manugistics, Inc, RockviUe, MD
John Wiley & Sons, New York, NY
Niro Inc, Columbia, MD Thermo Nicolet Corporation, Madison, WI Polymer Labs Inc, Amherst, MA
Pro Scientific Inc, Monroe, CT Fisher Scientific, Fair Lawn, NJ Waters Corporation, Milford, MA Varian Chromatography Systems, Walnut Creek, CA Perkin-Elmer, Norwalk, CT Fisher Scientific, Fair Lavm, NJ Underwriters' Laboratories Inc, MelviUe, NY
Model number JEM-IOOCX
CAD/Chem® Custom Formulation System, version 5.1 LVDV-E1I5
Eppendorf Centrifuge5415D Ex-lOO
L-460
DSC 7500
Universal 2920, version2.6A VK 7000, VK 8000, VK 750 D Explorer Statgraphics® Plus, version4.1 X-Stat®, version 2.01 Strea-1® Nexus 470
PL220
Pro 250® Isotemp Nova-Pak®C-18 Dynamax® SD-200, AI-200,UV-1, Intracooler 2 Thermix® 120S ComingPC-353
85
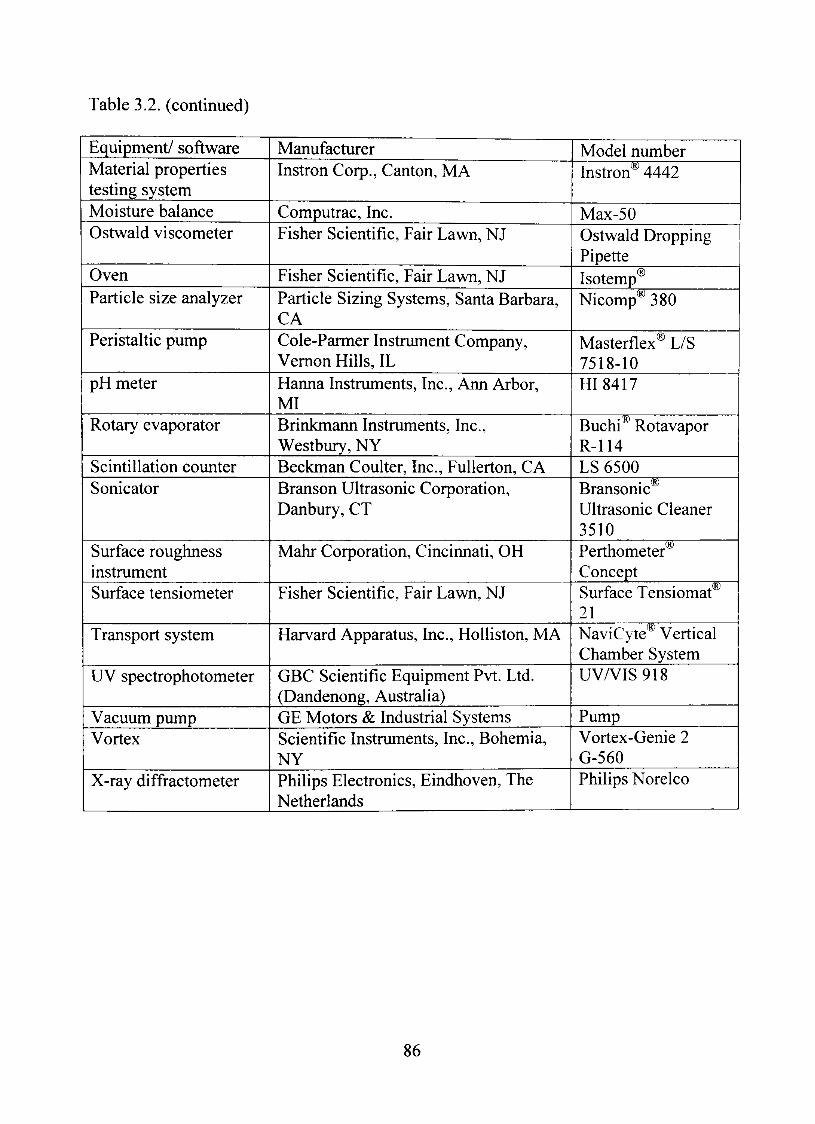
Table 3.2, (continued)
Equipment/ software Material properties testing system Moisture balance Ostwald viscometer
Qven Particle size analyzer
Peristaltic pump
pH meter
Rotary evaporator
Scintillation counter Sonicator
Surface roughness instmment Surface tensiometer
Transport system
UV spectrophotometer
Vacuum pump Vortex
X-ray diffractometer
Manufacturer Instron Corp., Canton, MA
Computrac, Inc Fisher Scientific, Fair Lawn, NJ
Fisher Scientific, Fair Lavm, NJ Particle Sizing Systems, Santa Barbara, CA Cole-Parmer Instmment Company, Vemon HiUs, IL Hanna Instmments, Inc, Ann Arbor, MI Brinkmann Instmments, Inc, Westbury, NY Beckman Coulter, Inc, FuIIerton, CA Branson Ultrasonic Corporation, Danbury, CT
Mahr Corporation, Cincinnati, OH
Fisher Scientific, Fair Lawn, NJ
Harvard Apparatus, Inc, HolUston, MA
GBC Scientific Equipment Pvt. Ltd. (Dandenong, Australia) GE Motors & Industrial Systems Scientific Instmments, Inc, Bohemia, NY Philips Electronics, Eindhoven, The Netherlands
Model number Instron'' 4442
Max-50 Ostwald Dropping Pipette Isotemp® Nicomp' ^^^O
Masterflex® L/S 7518-10 HI8417
Buchi^ Rotavapor R-114 LS 6500 Bransonic® Uhrasonic Cleaner 3510 Perthometer® Concept Surface Tensiomat® 21 NaviCyte''^ Vertical Chamber System UV/VIS918
Pump Vortex-Genie 2 G-560 Philips Norelco
86
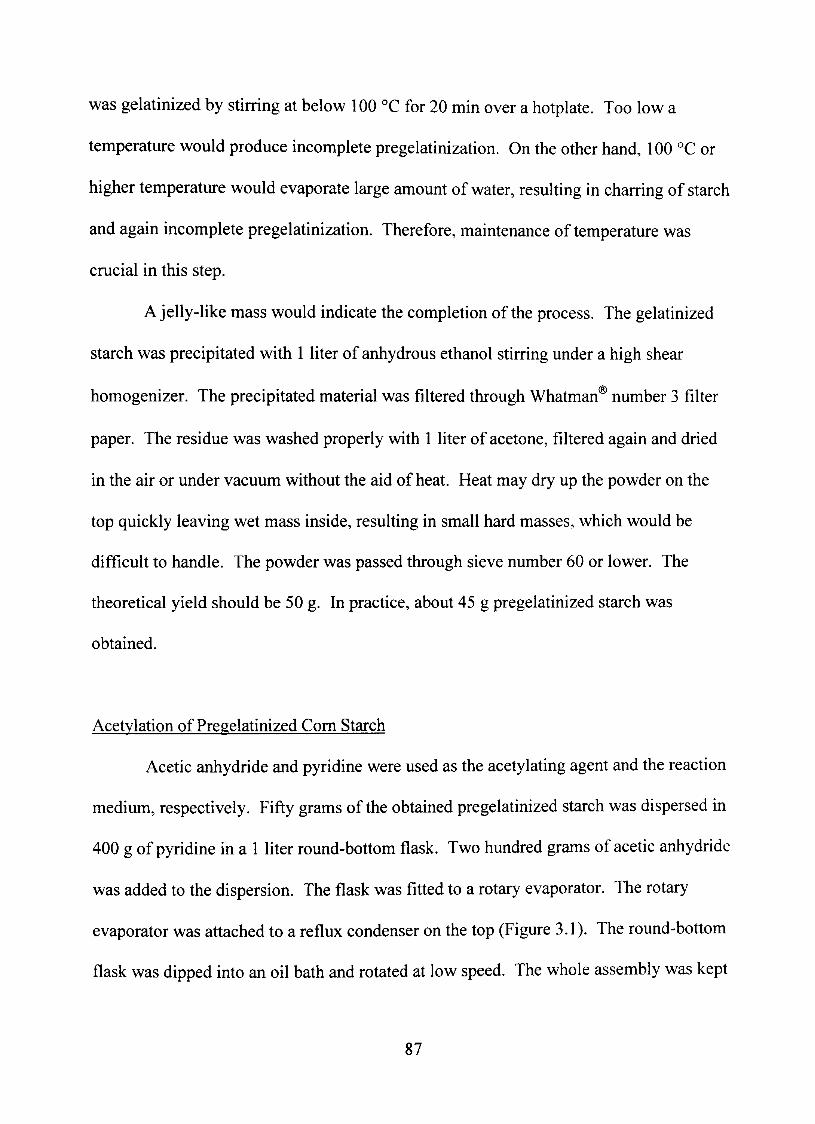
was gelatinized by stirring at below 100 "C for 20 min over a hotplate. Too low a
temperature would produce incomplete pregelatinization. On the other hand, 100 °C or
higher temperature would evaporate large amount of water, resulting in charring of starch
and again incomplete pregelatinization. Therefore, maintenance of temperature was
cmcial in this step.
A jelly-like mass would indicate the completion of the process. The gelatinized
starch was precipitated with 1 liter of anhydrous ethanol stirring under a high shear
homogenizer. The precipitated material was filtered through Whatman® number 3 filter
paper. The residue was washed properly with 1 liter of acetone, filtered again and dried
in the air or under vacuum without the aid of heat. Heat may dry up the powder on the
top quickly leaving wet mass inside, resulting in small hard masses, which would be
difficult to handle. The powder was passed through sieve number 60 or lower. The
theoretical yield should be 50 g. In practice, about 45 g pregelatinized starch was
obtained.
Acetylation of Pregelatinized Com Starch
Acetic anhydride and pyridine were used as the acetylating agent and the reaction
medium, respectively. Fifty grams of the obtained pregelatinized starch was dispersed in
400 g of pyridine in a 1 liter round-bottom flask, Two hundred grams of acetic anhydride
was added to the dispersion. The flask was fitted to a rotary evaporator. The rotary
evaporator was attached to a reflux condenser on the top (Figure 3.1). The round-bottom
flask was dipped into an oil bath and rotated at low speed, The whole assembly was kept
87
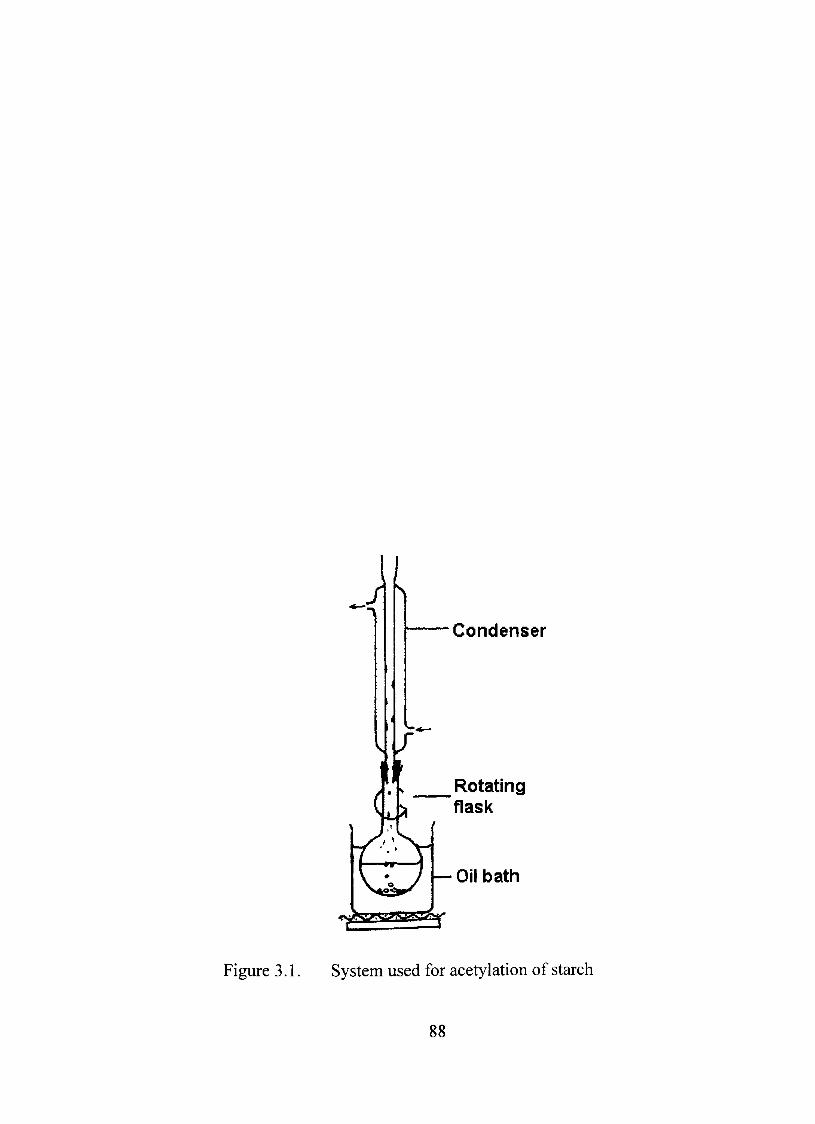
^ / \
Condenser
Rotating flask
— Oil bath
< ^ ^ ^ ^ ^ ^
Figure 3.1. System used for acetylation of starch
88
inside a fiame hood. The temperature was maintained at 100 °C. Lower temperature
might result in incomplete reaction whereas; higher temperature would cause excessive
degradation of starch molecules. The reaction was carried out for 4 h. Initially the
mixture was in a suspension form but after 15-20 minutes it appeared to be a
homogeneous viscous mass. Continuous stirring is required for proper mixing of the
reactants. The final reaction mixture came out as a transparent light amber colored jelly-
like mass.
The mixture was transferred to a container with larger opening and cooled to room
temperature. The product was precipitated from 2600 ml of ethanol under high shear
homogenization. The obtained precipitate was filtered through Whatman® number 3 fiher
paper, washed well with 1600 ml and 1200 ml of ethanol consequently and filtered again.
A well washing could be demonstrated by the absence of pyridine smell in the precipitate.
More washing was performed when required. Finally, it was dried in the air or under
reduced pressure in absence of heat, The powder was passed through sieve number 60 or
lower.
Characterization of Svnthesized Starch Acetate
Starch acetate synthesized eariier was characterized by chemical, spectroscopic,
microscopic and physical analyses. The description is provided in the next few sections.
89
Measurement of Degree of Substitution
Since, three hydroxyl groups are present in each monomeric moiety of starch the
theoretical maximum dS is 3.0. A number of methods can be followed to determine the dS
value. These could be UV, NMR, FTIR, saponification combined with titration methods
(Ogawa et al., 1999). Considering availability and simplicity the last method was used in
the present study.
Saponification-Titration Method
One gram of starch acetate and 50 mL of 75% ethanol were mixed in an
Erlenmeyer flask wdth a loose stopper, The mixture was stirred in a water bath at 50 °C for
30 min. After cooling to room temperature, 40 mL of 0.5 N KOH solution was added to
this mixture, The flask was fitted with a tight stopper and kept at room temperature with
occasional shaking for 72 hours for complete saponification. The reaction in saponifícation
of acetyl ftinction with the base can be shown as in Equation 3.1. After the period, an
excess of alkali in the solution was titrated with 0.5 N HCI solution using phenolphthalein
as the indicator. The solution was allowed to stand for 2 hr and then any additional alkali,
which might leach from the sample, was titrated. A blank test was performed with Pure-
Dent B700® foUowing the same procedure. A triplicate test was done to get accurate
results.
-OCOCH, + KOH -^ -0H-\- CH.COOK (3.1)
90
The percents of the acetyl group (db) and dS were calculated using equations 3.2
and 3.3, respectively (Ogawa et al., 1999). Values for the blank and sample are the
volumes of 0.5 N HCl in ml used in titration.
_ (value forblank - value forsample) x normality ofHCl x 0.043 x 100
samplingweight in g
4300-42x(ú?ô)
Fourier Transform Infrared Spectroscopy
Starch and starch acetate powders were subjected to FTIR study. Few milligrams
of samples were kept on the flat sample plate of the instmment and were sandwiched
between the plate and the press tips by pressing the clamp position control knob. Number
of scans was 32 per mn. Scanning was performed between wavenumbers 4000 and 600
cm"\ Automatic atmospheric suppression option was used. Background spectmm was
collected before mnning each samplc Data were recorded as % transmittance.
Later on in this study, dyphylline, the coated bead ingredients and coated beads
were studied by FTIR analysis for compatibility and stability experiments.
X-ray Powder Diffraction Study
X-ray diffraction study was performed using a diffractometer equipped with a
graphite monochromator and operated at 40 kV and 20 mA using nickel filtered Cu-Ka
radiation and a scintillation counter controlled by a personal computer with a home-made
software. Starch and starch acetate samples were loaded on aluminum pans and scanned
91
between 2 and 27 ° (<9) at a speed of 1 7min. X-ray diffraction would also be used in the
compatibility study of the dmg,
Particle Size Analvsis
Particle size of starch and starch acetate samples was determined with the particle
size analyzer. Dilute suspensions of samples were prepared in water and kept in glass
sample vials. The scattering intensity in the display was brought to 300 KHz before
scanning. Sample was mn until a steady value was obtained. Intensity-weight, number-
weight and volume-weight particle size distributions were recorded.
Determínation of Molecular Mass
Molecular masses of starch and starch acetate were determined using gel
permeation chromatography (GPC), which was performed in Noveon, Inc, Brecksville,
OH. The apparatus was PL-GPC 220, with two PLgel Mixed-B columns, calibrated with
polystyrene molecular mass standards. The PL-GPC 220 system is a fully automated
instmment designed to mn almost all polymer, solvent and temperature combinations,
from 30 to 220 °C. PLgel mixed columns are able to work with high MW polymer
analysis and demanding eluent conditions and are compatible with up to MW of 10
million. The sample was filtered through 0.45 /mi polytetrafluoroethylene (PTFE) filter
at room temperature and 100 //L of that was used in the study. The mobile phase was
dimethyl acetamide and 0.05m sodium nitrate at 100 °C used at a flow rate of 1.0 ml/min.
Elutes were detected with a refractive index (RI) detector.
92
Differential Scanning Calorimetrv
Thermal behavior of the polymer samples was studied by DSC. The DSC
instrument was calibrated using indium standards. Accurately weighed samples (5-10
mg) were hermetically sealed in flat bottom aluminum pans and heated in the range of
-100 to 200 °C as needed, at a rate of 10 C per min under an atmosphere of nitrogen.
Any sudden change in the heat flow- temperature curve indicated the transition state of
the samplc The transition point was calculated using the inbuilt software. Thermograms
were normalized and rescaled as needed before comparing.
DSC were also used to determine melting endotherms of dyphylline, dmg loading
ingredients and the optimized formulation for any possible interaction between
components and to calculate glass transition temperature of free films.
Further Characterization of Starch Acetate
Starch acetate was also studied for a number of physical parameters, including
solubility, bulk density, moisture content and physical statc
Characterization of Starch Acetate in Solution
Rheological Studies
Starch acetate was dissolved in chloroform to obtain solution of different
concentrations (0.5-5%). One time point viscosity of those solutions was measured with
an Qstwald viscometer. Chloroform was considered as the reference. Viscosity of starch
acetate solutions at different shear rates was determined with a Brookfield viscometer
93
using 5 spindles. Spindle ULA, a special type of spindle with a UL adapter are capable
of measuring very low value of viscosity, whereas, spindle number 4 could measure up to
2,000,000 cps. Spindles were operated at 18 different speeds (0.3, 0.5, 0.6, 1.0, 1.5, 2.0,
2.5, 3, 4, 5, 6, 10, 12, 20, 30, 50, 60, and 100 rpm) to monitor the viscosity. Viscosity in
cps was directly displayed in the screen. To get reliable results, data with torque less than
10% were discarded.
Measurement of Surface Tension
The effect of polymer concentration on surface tension of the liquid was studied,
The platinum iridium ring was immersed in the test liquid and pulled up until the liquid
film mptures. The apparent surface tension recorded from the dial was converted to the
absolute surface tension.
Preparation of Free Films
Five percent (w/v) solution of starch acetate in chloroform was prepared with
continuous stirring. This solution was used to prepare films for thermal, mechanical,
spectroscopic and other characterization. Appropriate amount of plasticizers were added
to the solution. A number of plasticizers from different chemical family were tested for
their effectiveness. A list of plasticizers is enclosed in Table 3.3. The mixture was stirred
for about 2 hours for proper mixing of plasticizers. Appropriate amount of these
solutions were poured into flat bed teflon petridishes, 5 cm in diameter so that film of
0.15 mm thickness could be obtained. The petrídishes were kept at room temperature for
94
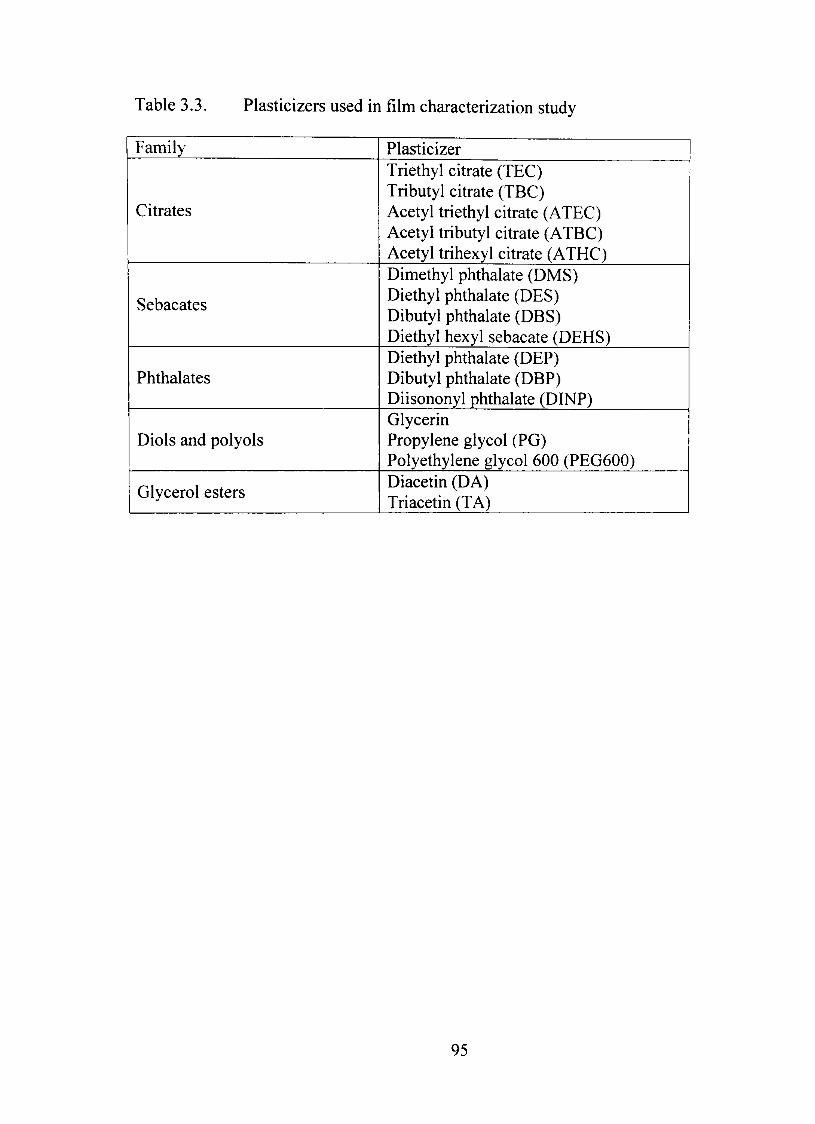
Table 3.3. Plasticizers used in film characterization study
Family
Citrates
Sebacates
Phthalates
Diols and polyols
Glycerol esters
Plasticizer Triethyl citrate (TEC) Tributyl citrate (TBC) Acetyl triethyl citrate (ATEC) Acetyl tributyl citrate (ATBC) Acetyl trihexyl citrate (ATHC) Dimethyl phthalate (DMS) Diethyl phthalate (DES) Dibutyl phthalate (DBS) Diethyl hexyl sebacate (DEHS) Diethyl phthalate (DEP) Dibutyl phthalate (DBP) Diisononyl phthalate (DINP) Glycerin Propylene glycol (PG) Polyethylene glycol 600 (PEG600) Diacetin (DA) Triacetin (TA)
95
few hours to evaporate the bulk of the solvent before transferring to oven at 45 °C and
57.5% relative humidity, where those were kept for 24 h. The films were peeled off the
petridishes and cut in appropriate sizes and stored in airtight containers for particular
experiments. The thicknesses of all films were measured using a thickness gauge.
Characterization of Free Films
Mechanical Properties
Mechanical properties of casted starch acetate films were determined using 30 to
100% concentration of different plasticizers. The plasticizer concentration was measured
with respect to the amount of starch acetate in the solution. Prepared films were cut into
size of 0.7x4 cm^ patches and used with Instron ^ system, equipped with computer
integrated data acquisition system, Films were fixed between the upper and lower grips.
The distance between two grips was kept constant at 2 cm. The load cell was calibrated
before each reading. The crosshead along with the upper grip was raised at a constant
speed of 30 mm/min. The movement of the crosshead was continued until the films
broke. Series 9 software from Instron® was used to analyze the obtained data. Young's
modulus, tensile strength, % elongation, and toughness were the parameters in concem.
The average and the standard deviation of at least three readings were taken.
Thermal Analysis
DSC was used to characterize thermal properties of the free films. Plasticizers,
which yielded promising results in the mechanical study, were used in thermal study.
96
Accurately weighed samples (5 to 10 mg of small pieces of free films) were sealed and
used in the study. Intracooler, connected to the DSC was utilized to obtain temperature
below ambient temperature, The glass transition temperatures (Tg) of plasticized and
unplasticized films were determined by the DSC, The results were correlated to the
plasticizer concentrations.
Scanning Electron Microscopy
The surface topography of unplasticized and plasticized films was examined
under a JEM-IOO CX Analytical Electron Microscope (Jeol Inc, Japan) interfaced with
KEVEX Image Analyzer. The samples were loaded on copper sample holder and sputter
coated with carbon followed by gold. The uncoated and coated (optimized) beads and
cross section of optimized bead were also be examined by SEM.
Difftision Studv
Diffusion study was performed with a NaviCyte vertical chamber system
(Figure 3.2) with six pair of side by side cells of 6 ml capacity each. The temperature of
the system was maintained at 37 °C by a circulating water bath. Starch acetate films
were prepared as described earlier with different plasticizer concentration. Triacetin was
used as the plasticizer and the concentration range was 50-80%. Films of plasticizer
concentration below 50% was too brittle for diffusion study and over 80% was so soft
and sticky making it unsuitable for handling in the experiment. All the films were
97
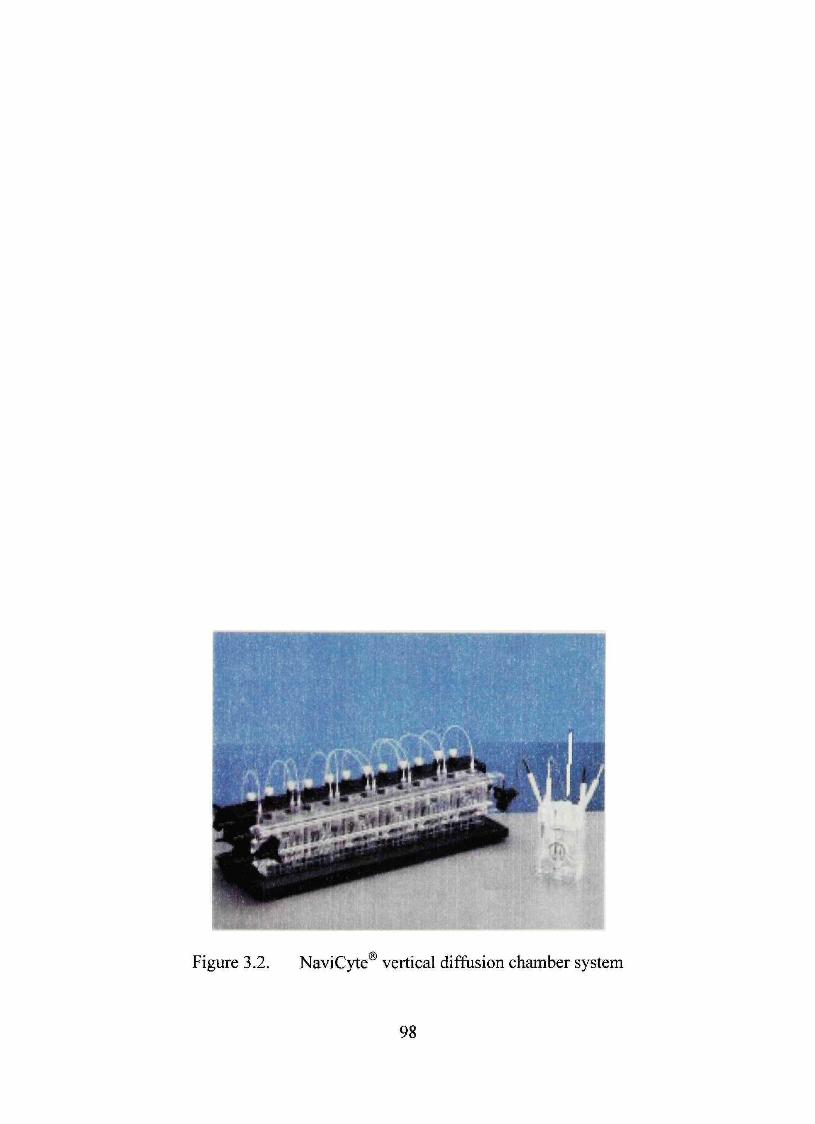
.® Figure 3.2. NaviCyte vertical diffiision chamber system
98
immersed in water for 5 minutes to come to equilibrium to the system before mounting
inside chamber.
Tritiated water of radioactivity of 1 mCi/ml was used in the study. Fifty
microUter of tritiated water (50 /yCi) was added to the donor side of the diffusion
chamber containing 6 ml of deionized water. The receiver side also contained 6 ml of
deionized water. Ten microliter of sample was withdrawn from the receiver cell at
different time points (5, 10, 15, 30, 45 min, 1, 1.5, 2, 3 and 5 h) and replaced with 10 //L
of fresh deionized water. The samples were diluted adding 5 ml of scintiUation cocktail
and analyzed with a scintiUation counter. The obtained counts (dpm) were plotted
against time (min) and straight lines were obtained. dM/dt was the slopes of the straight
lines. The radioactivity of the donor chamber was much higher than the receiver
chamber and therefore, the counter diffusion of tritiated water was negligiblc The
permeability coefficients for the films (Dressman et al.. 1994) were calculated using the
equation
dM , x h
P = — ^ . (3.4) 60 X yí X CQ
In this equation, P is the permeability coefficient (cm /sec), dM/dt is the
radioactivity of tritiated water permeated (dpm/min), h is the thickness (cm) of the film,
which was measured before mounting the films. A is the area of the effective diffusion
region, which was calculated to be 1.74 cml Co is the initial radioactivity (dpm/ml) in
the donor compartment and it was measured at the beginning of the study.
99
Compatibility Studies between the Dmg and Dmg Loading Excipients
Before loading the drug on the inert beads, it was necessary to see whether the
dmg was compatible or not with the loading excipients. Incompatibility might arise from
a number of reasons including, but not limited to accelerated potency loss, complex
formation, acid/base interactions and eutectic formation (Ford and Timmins, 1989). To
identify the possible degradation of the active ingredient in a short period of time, binary
blends of dmg and excipient can be stored at high temperature in the presence of
moisture (Serajuddin et a l , 1999). It was suggested that possibility of interaction of two
compounds can be maximized when they are mixed at equal amounts (Akers, 1976) and
hence, the samples were mixed at 1:1 or 1:1:1:1 ratios in the preformulation studies.
Dyphylline (the dmg), Opadry®, ground Nu-pareil"^ bead and talc were blended
together at a w/w ratio of 1:1, or 1:1:1:1. Water at a w/w level of 5% was sprayed on the
powder blend and mixed properly. The mixture was kept in tightiy closed scintillation
vials and kept at 55 °C. After one month the samples were observed physically for any
identifiable change and then undergone thermal, infrared and content analyses.
Dmg Loading and Seal Coating
Nu-pareil® beads (sugar/starch inert beads) of mesh# 18/20 were used as the core
for dmg loading. The composition of the dmg loading suspension is given in Table 3.4.
Opadry II® beige, which is chemically HPMC/ polydextrose was used as the binder, Talc
was the anti-caking agents. First the dmg was dissolved in water. Then talc was added
to it under medium speed of homogenization. h was homogenized for about 5 minutes.
100
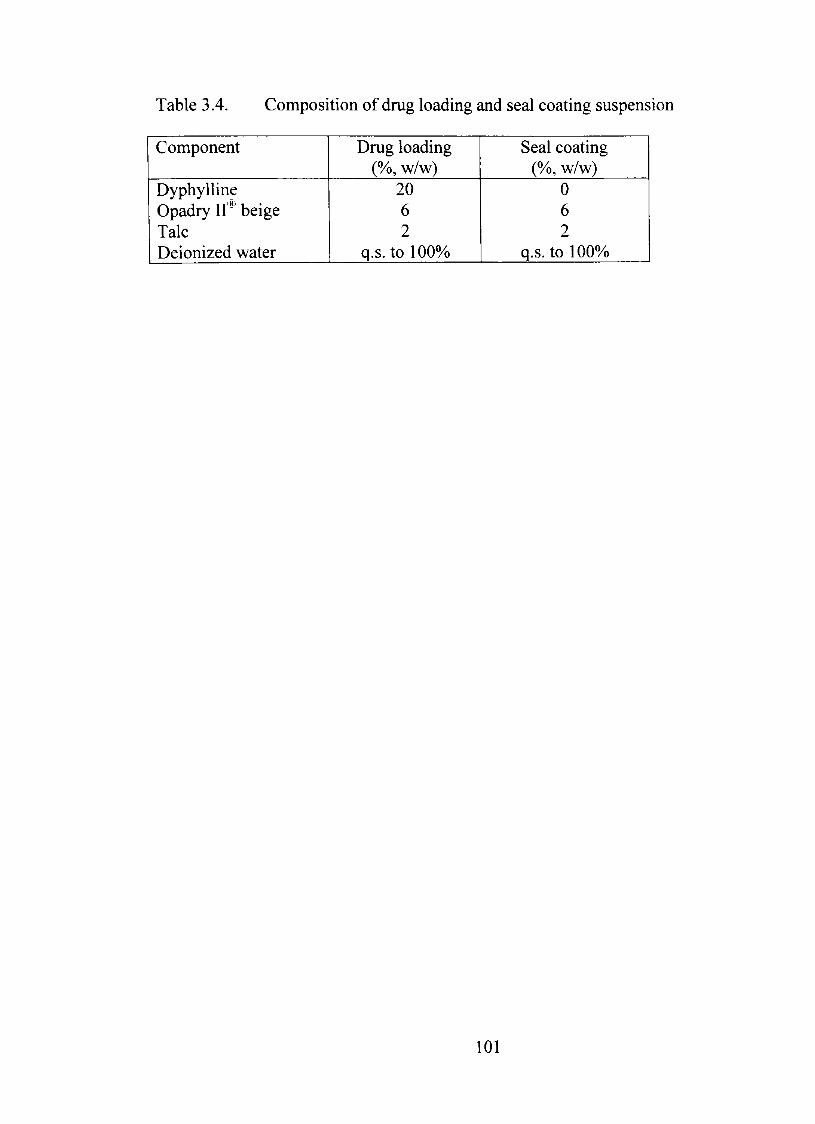
Table 3.4. Composition of dmg loading and seal coating suspension
Component
Dyphylline Opadry lí" beige Talc Deionized water
Drug loading (%, w/w)
20 6 2
q.s.tol00%
Seal coating (%, w/w)
0 6 2
q.s. to 100%
101
Opadry II beige was added slowly and the whole mixture was homogenized for about 25
minutes. A similar formulation (Table 3.4) excluding the dmg was prepared to obtain the
seal coating suspension. The latter formulation was used to provide seal coating on dmg
loaded beads. Seal coating was applied to prevent loss of dmg by attrition of the beads
with the coating equipment or by dmg leaching during controlled release coating. The
seal coating suspension was also used to prepare some placebo beads, which were
utilized to make blank solutions for UV spectrophotometric analysis.
A Strea-l^ fluid bed coater with bottom spray assembly (Wurster type) was used
for dmg loading, seal coating, and controlled release coating. The processing conditions
for dmg loading and seal coating are listed in Table 3.5. FoUowing the seal coating,
beads were dried in the coating chamber at 45 °C for 20 min and subsequently transferred
into an oven at 37 °C and kept there for 6 h.
Content Analysis
The fnst step of content analysis was the extraction of the dmg which was
performed by cmshing accurately 100 mg of dmg loaded beads in a mortar containing
100 ml of water, transferring into an Erlenmeyer flask and sonicating for 30 min. The
remaining steps of the analysis were filtration, appropriate dilution and spectroscopic
measurement of dmg content using a UV spectrophotometer at 273 nm. Placebo beads
were used to prepare blank solution for spectrophotometric analysis, Each sample was
done in triplicate to get the mean and standard deviation, The spectrophotometric
analysis was based on the following section. This analysis would help us determine
102
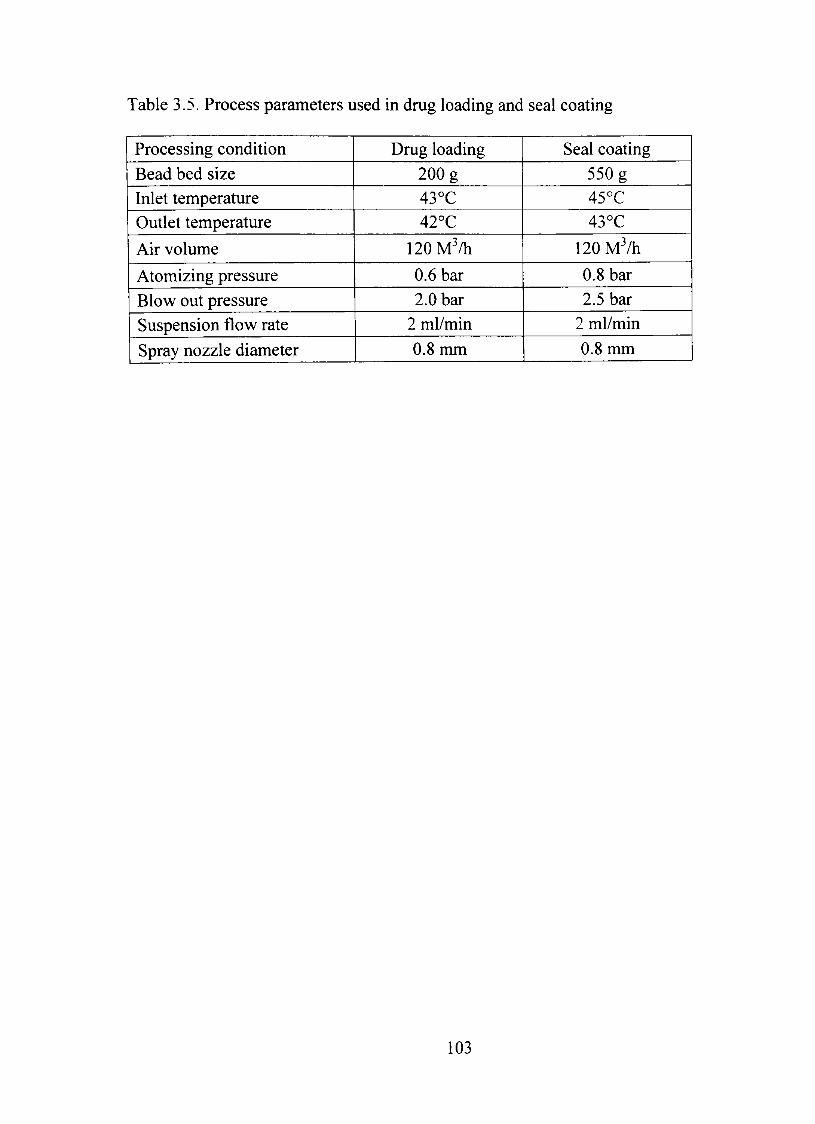
Table 3.5. Process parameters used in dmg loading and seal coating
Processing condition Bead bed size Inlet temperature Outlet temperature
Air volume
Atomizing pressure BIow out pressure Suspension flow rate Spray nozzle diameter
Drug loading 200 g 43°C 42°C
120M^/h
0.6 bar 2.0 bar
2 ml/min 0.8 mm
Seal coating 550 g 45°C 43°C
120 M /h
0.8 bar 2.5 bar
2 ml/min 0.8 mm
103
exactly how much beads would contain the required amount of dmg. This also confírms
content uniformity within a batch.
UV Spectrophotometric Analysis
A 10 //g/ml standard solution of dyphylline in deionized water was scarmed in the
UV spectrophotometer from 180 to 300 nm. Two region of absorption maxima were
found at around 214 and 273 nm. The primary peak at 214 nm was aî the lower end of
the UV range and also there were a number of peaks and valleys around that region, The
absorption curve had comparatively less fluctuation around 273 and also, absorption due
to the excipients, e.g., Opadry and Nu-pareil was negligible at this wavelength.
Therefore, the wavelength of secondary peak at 273 nm was selected as the wavelength
for absorption for spectroscopic studies. The selected wavelength was consistent with
literature (USP, 2000). Standard dyphylline solutions of concentrations 1. 2.5. 5, 10, 15,
and 20 jug/mL were prepared in deionized water to constmct the calibration curve.
Controlled Release Coating
Dmg loaded beads were coated with starch acetate (either 1% or 2% in screening
design, 2% in optimization design) containing suitable amount (depending on the design
batch) of triacetin as the plasticizer. The solution was prepared in a similar fashion
described eariier. Strea-1® was used as tiie coating instmment. The process parameters
are listed in Table 3.6. Coating was continued until the desired coating level (coating
weight gain) was obtained. FoUowing coating, the beads were dried in the coating
104

Table 3.6. Process parameters used in controlled release coating
Processing condition
Bead bed size
Inlet temperature
Outlet temperature
Air volume
Atomizing pressure
Blow out pressure Coating solution flow rate
Spray nozzle diameter
Screening design
200 g
37 or 40 °C
36 or 39 °C
120 M %
0.75 or 1 bar
1 or 1.25 bar 2 ml/min
0.8 mm
Optimization design
200 g 37 °C
36 °C
120M^/h
Ibar 1.5 bar
2 ml/min
0.8 mm
105
chamber at either 37 or 40 °C for 20 min and later on cured in an oven at either 40 or 45
°C or 50 °C for 12, 16, or 18 h, depending on the run variables. In the optimization
design the curing was done for 16 h.
Dissolution Studies
Dissolution was performed with coated beads from different batches, described in
the experimental design in the subsequent chapters. Beads, containing 300 mg of
dyphylline, as determined by the content analysis had undergone dissolution study to
calculate in vitro dmg release profile. An automated USP apparatus II, VK 7000 with the
paddle speed of 50 rpm and 900 ml of deionized water as the dissolution medium at
37 °C was employed. Samples were withdrawn at different time points (0.5, 1, 2, 4, 6, 8,
10, and 12 h), suitably diluted with water and assayed spectrophotometrically at 273 nm.
Cumulative percent release of the dmg was calculated from the concentration of the
diluted sample. Each mn from the experimental design was duplicated and the mean
values were used in the design. Among the samples, the ones at 0.5, 1, 4, 8, and 12 h
were used in the design for screening of factors and optimization of the formulation.
Plackett-Burman Screening Design
Plackett-Burman design was utilized to screen a number of formulation and
processing factors, which might have influence on dmg release pattem. A number of
preliminary experiments were done to pick up the independent variables and select the
other processing parameters in the coating process of the screening. A description of the
106
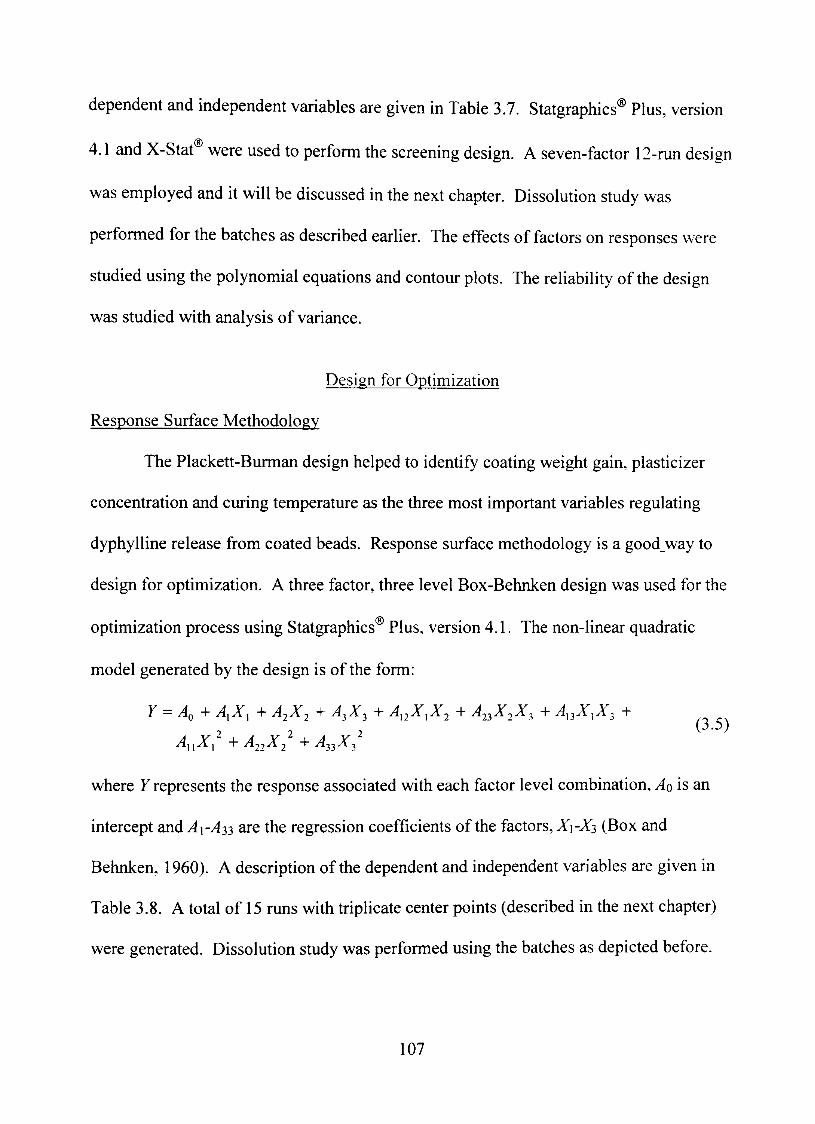
dependent and independent variables are given in Table 3.7. Statgraphics® PIus, version
4.1 and X-Stat' were used to perform the screening design. A seven-factor 12-mn design
was employed and h will be discussed in the next chapter. Dissolution study was
performed for the batches as described eariier. The effects of factors on responses vvere
studied using the polynomial equations and contour plots. The reliability of the design
was studied with analysis of variancc
Design for Optimization
Response Surface Methodology
The Plackett-Burman design helped to identify coating weight gain, plasticizer
concentration and curing temperature as the three most important variables regulating
dyphylline release from coated beads. Response surface methodology is a good_way to
design for optimization. A three factor, three level Box-Behnken design was used for the
optimization process using Statgraphics Plus, version 4.1. The non-linear quadratic
model generated by the design is of the form:
Y = A,^ A,X, + A,X, + A,X, + A,,X,X, + A,,X,X, + A,,X,X, + , ^
A,,X: +A,,X,'+A,,X,'
where 7 represents the response associated with each factor level combination, AQ is an
intercept and 1- 133 are the regression coefficients of the factors, X\-XT, (Box and
Behnken, 1960). A description of the dependent and independent variables are given in
Table 3.8. A total of 15 runs with triplicate center points (described in the next chapter)
were generated. Dissolution study was performed using the batches as depicted before.
107
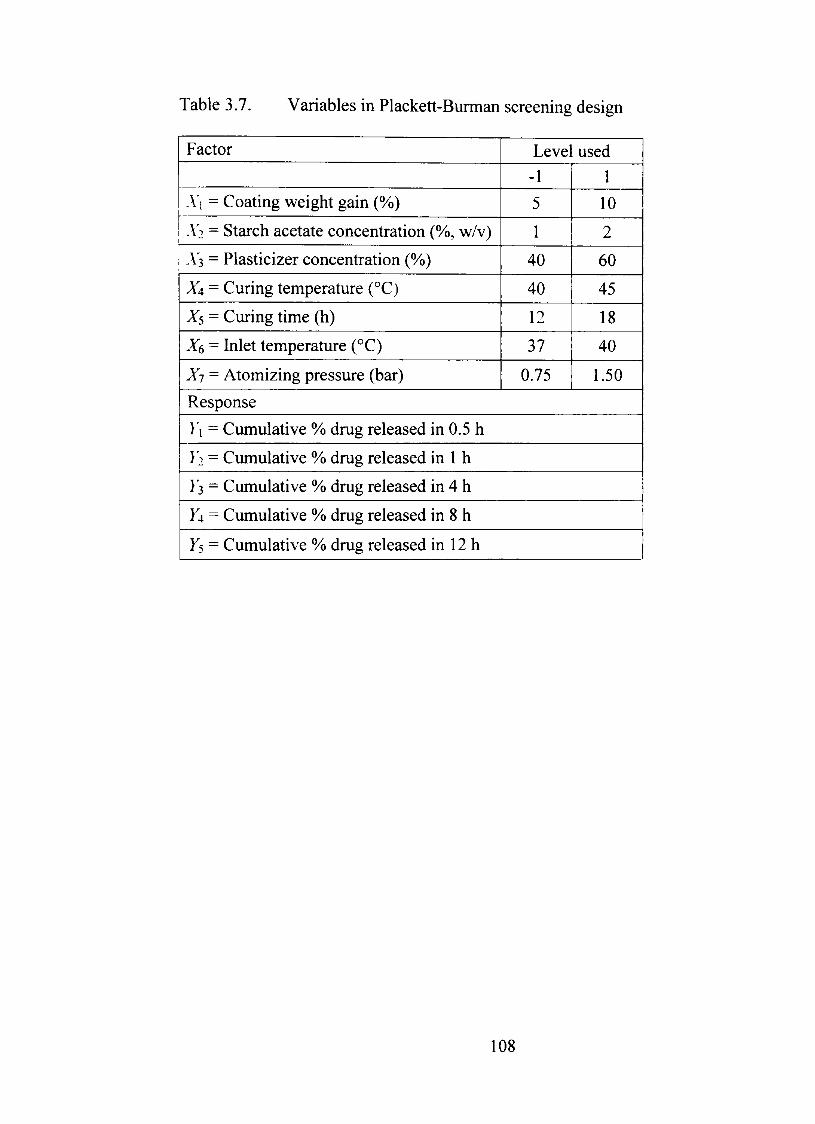
Table 3.7. Variables in Plackett-Burman screening design
Factor
A'i = Coating weight gain (%)
A2 = Starch acetate concentration (%, w/v)
A3 = Plasticizer concentration (%)
X4 = Curing temperature (°C)
Xs = Curing time (h)
Xe = Inlet temperature (°C)
Xj = Atomizing pressure (bar)
Level used
-1
5
1
40
40
12
37
0.75
1
10
2
60
45
18
40
1.50
Response
}'i = Cumulative % drug released in 0.5 h
¥2 = Cumulative % drug released in 1 h
Yj = Cumulative % drug released in 4 h
Y4 = Cumulative % drug released in 8 h
^5 = Cumulative % drug released in 12 h
108
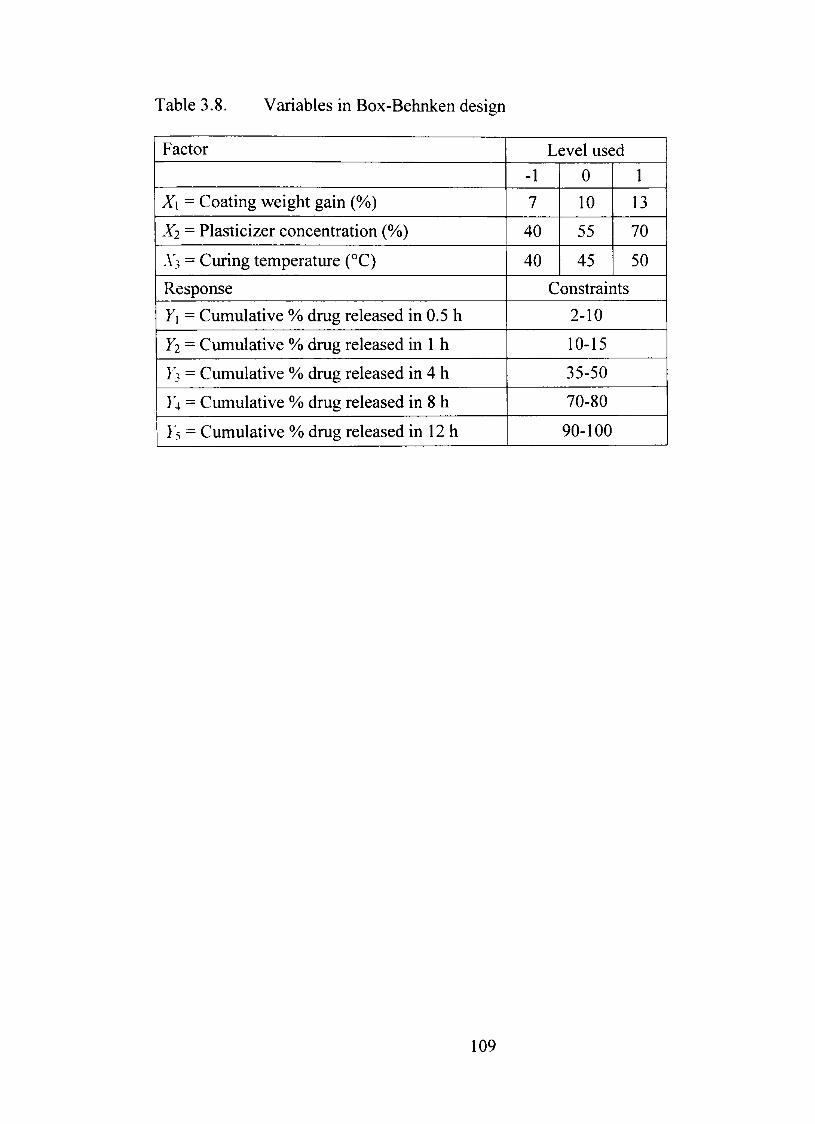
Table 3.8. Variables in Box-Behnken design
Factor
X\ = Coating weight gain (%>)
X2 = Plasticizer concentration (%>)
Xi = Curing temperature (°C)
Response
Y\ = Cumulative % drug released in 0.5 h
Y2 = Cumulative %> drug released in 1 h
Y} = Cumulative % drug released in 4 h
}'4 = Cumulative %> drug released in 8 h
}'5 = Cumulative % drug released in 12 h
Level used -1
7
40
40
0
10
55
45
I
13
70
50
Constraints
2-10
10-15
35-50
70-80
90-100
09
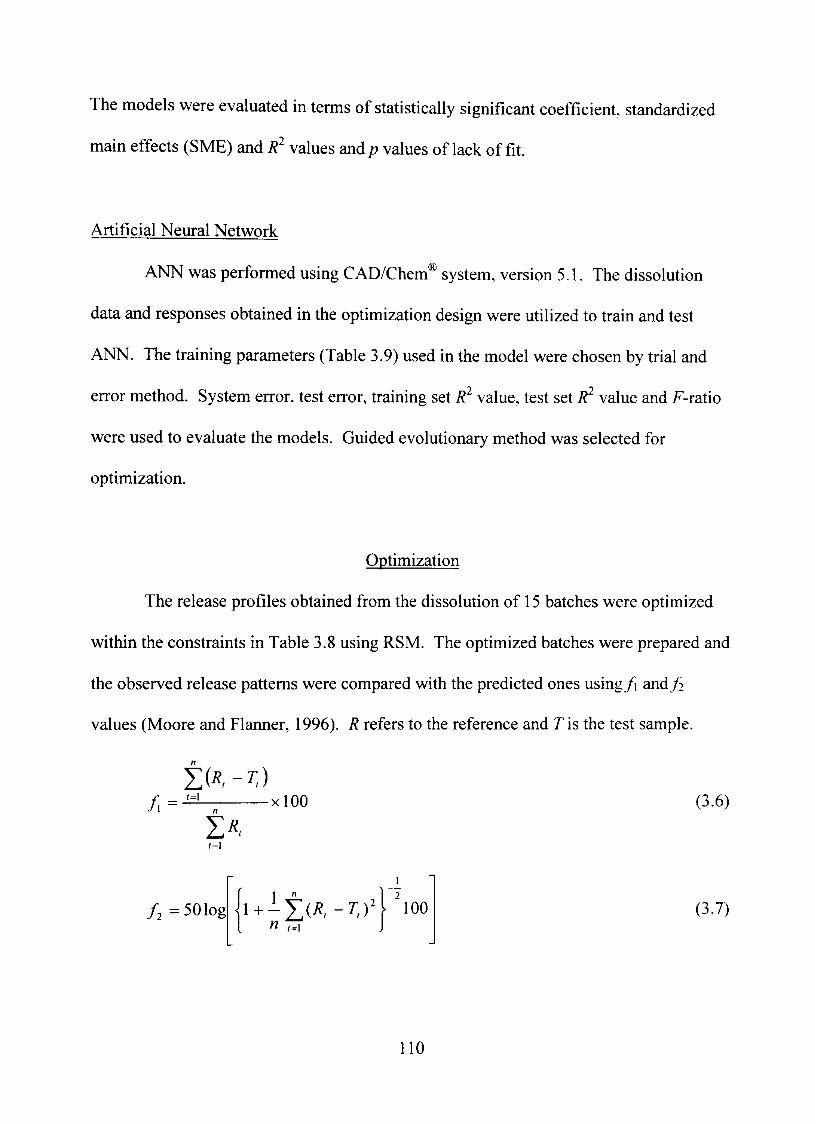
The models were evaluated in terms of statistically significant coefficient, standardized
main effects (SME) and R^ values andp values of lack of fit.
Artificial Neural Network
ANN was performed using CAD/Chem® system, version 5.1. The dissolution
data and responses obtained in the optimization design were utilized to train and test
ANN. The training parameters (Table 3.9) used in the model were chosen by trial and
error method. System error. test error, training set R^ value, test set R^ value and 7^-ratio
were used to evaluate the models. Guided evolutionary method was selected for
optimization.
Qptimization
The release profiles obtained from the dissolution of 15 batches were optimized
within the constraints in Table 3.8 using RSM. The optimized batches were prepared and
the observed release pattems were compared with the predicted ones using/i and fi
values (Moore and Flanner, 1996). R refers to the reference and T is the test sample.
/ , =i=L_ xlOO (3.6)
t=\
/ , =50Iog i + i | ; ( / î , - r , )4 ' ioo (3.7)
110
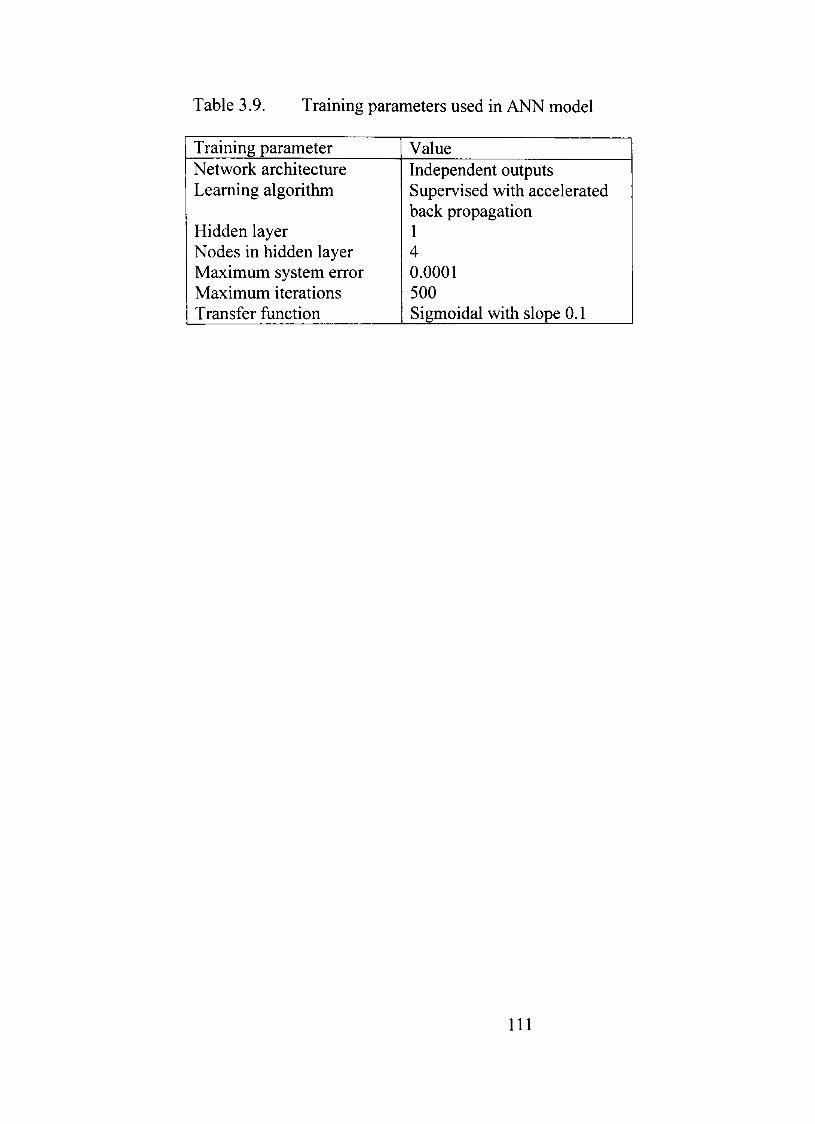
Table 3.9. Training parameters used in ANN model
Training parameter Network architecture Leaming algorithm
Hidden layer Nodes in hidden layer Maximum system error Maximum iterations Transfer function
Value Independent outputs Supervised with accelerated back propagation 1 4 0.0001 500 Sigmoidal with slope 0.1
11
Characterization of the Optimized Formulation
The batch optimized using RSM was characterized by thermal, X-ray, infrared
and scanning electron microscopic analyses, AIl the methods were described eariier.
The beads were cmshed to powder with mortar and pestle and used in the studies,
Surface Roughness Study
Dmg loaded beads were coated with 2% starch acetate solution, containing 55%
plasticizer in the range 1-6% coating weight gain. Representative beads from each batch
were studied to get surface roughness profile with Perthometer®. The beads were placed
individually over the measuring station and fixed on a piece of clay. The sensor was
brought down until it just touched the bead surface. The sensor was run through
101 lines within an area of 0.5x0.5 mm for each samplc Three beads from each batch
were scanned and the mean and standard deviation of the rough parameters Ra, Rq, Rz, Rt
and Rp were recorded. The roughness parameters had been correlated with the coating
weight gain.
Effect of Gastric Acidíty on the Optimized Formulation
Before performing the in vivo bioavailability study it was necessary to see if
gastric acidity could affect the integrity of starch acetate coating. The conditions used in
the in vitro dissolution study were similar to those mentioned beforc A 0.1 N
hydrochloric acid solution at pH 1.2 was used as the dissolution medium. The optimized
112
formulation was used in the study. Dissolution data were obtained in triplicate and were
compared with that obtained in water using/i a n d / values.
Effect of Amylase on the Optimized Formulation
Since starch acetate is a derivative of carbohydrate, it was important to fínd out if
starch acetate could stay intact as opposed to its parent polymer, starch in presence of a
carbohydrate splitting enzyme, a-amylase. The enzyme obtained from Bacillus species
was used at a concentration of 9,000 lU/L as described by Rahmouni et al. (2001), It was
informed by the supplier that the enzyme was most active in 50 mM phosphate buffer at
pH 6.8. Therefore, phosphate buffer was taken as the dissolution medium, FoIIowing
USP instmction, six liters of buffer was prepared by mixing 1500 ml of monobasic
potassium phosphate and 672 ml of sodium hydroxide both at the concentration of 0.2 M
and adding sufficient quantity of water to make up the volumc The optimized
formulation containing 300 mg of dyphylline was used in the study. For correct
comparison, dmg release in only the buffer medium was performed and considered as
standard. Dissolution data were obtained in triplicate and were compared using t h e / and
/ values.
In Vivo Study
Collection of Plasma Samples
The in vivo study was carried out using male Sprague-Dawley rats weighing from
250 to 300 g each. Optimized beads containing an appropriate amount of dmg were
113
enclosed in size 9 gelatin capsules. Capsules containing powdered dyphylline were used
as the control. The dose of dyphylline used in the study was 20 mg/kg of body weight.
Six rats were used for both sample and controls. Rats were anesthetized with a solution
of ketamine and xylazine prior to the experiment and the anesthesia was maintained
throughout the process. Capsules were inserted through the esophagus using a capsule
inserting device. The tip of the rat tail was cut and about 200 //L of blood samples were
coUected in heparinized microfuge tubes at each time point (1, 2, 4, 6, 8, 10 and 12 h). A
blood sample was also collected just before administering the dose (zero time). Blood
samples were immediately centrifuged at 1380 g for 5 min and plasma was collected and
stored at -20 °C until analyzed by HPLC.
Extraction Procedure
Theophylline was used as the intemal standard in the study. Twenty microliter of
the intemal standard solution (100 //g/ml) was added to 50 /ÍL of thawed plasma sample
in a microcentrifuge tubc Serum proteins were precipitated by the addition of 30 /yL of
40% trichloroacetic acid solution to the centrifuge tube. The mixture was vortexed for
few seconds. After centrifugation of the sample in a microfuge at 15,000 g for 4 min, the
supematant was transferred to a second labeled microcentrifuge tube and again
centriftiged for 1 min. A 15-//L aliquot of the supematant obtained after the second
centrifugation was injected directiy onto the chromatographic system (Kester et al ,
1987).
114
Analysis of Plasma Samples
A modification of the HPLC method described by Kester et al. (1987) was
followed for the analysis of plasma samples. A C-18 column (150 mm x 3.9 mm ID, 5
jum particle packing) of Waters Corporation was used for the HPLC analysis at 274 nm.
The mobile phase was USP acetate buffer containing 4% of acetonitrilc Acetate buffer
(11 mM) was prepared by dissolving 1.5 g of sodium acetate trihydrate in water. The pH
of the solution was adjusted to 4 using dilute glacial acetic acid solution before making
the volume up to 1 liter. The flow rate was maintained at 1 ml/min. AU the samples
were mn at ambient temperature for 15 min. The concentrations of dyphylline and
theophylline were calculated using the peak-area ratios and comparing those to the
standard curves.
115
CHAPTER IV
RESULTS AND DISCUSSION
Synthesis of Starch Acetate
The objectives of this part of the study were to synthesize starch acetate from com
starch by a suitable method, figure out the extent of reaction, compare the synthesized
polymer with the raw material, starch and characterize starch acetate with several
chemical and physical parameters.
A number of starch source were tried in the process. It was described in
Chapter II that pretreatment of starch was necessary for proper reaction and pretreatment
through gelatinization yielded better reactivity than pretreatment with ammonia or
pyridine. Spress® B820 and Spress® B825 are two commercially available pregelatinized
com starches from the Grain Processing Corporation, the former being partially and the
latter completely gelatinized. These two Spress® samples were directly used for the
acetylation reaction (skipping the pregelatinization step). However, starch ester with
only low dS was obtained in both the cases. It could be due to different methods used by
the manufacturer for the pregelatinization of íhose commercial samples. The samples
were sieved and only the fine powders were used in the study, An unchanged result
indicated that particle size of the Spress® samples were not responsible for the incomplete
reaction. Com starch whh very high (70%) amylose content, e.g., Hylon" VII from
National Starch and Chemical Company (Bridgewater, NJ) and Amylogel® 03003 from
Cargill, Inc (Cedar Rapids, lA) were also used in the synthesis process with and without
116
the pregelatinization step. Both produced starch acetate with dS less than 1. These
proved that very high amylose starch was not suhable for acetylation.
Different methods were also tried in the synthesis process. A method in aqueous
medium as described by Mark and Mehltretter (1974) had some advantages including no
requirement of the pretreatment step, no strict requirement for the moisture content of the
starch sample, avoidance of organic media and low rate of degradation of starch during
the reaction. However, the reaction in this method did not yield suitable starch acetate in
practice.
Finally, starch acetate with high dS was obtained in two steps including
pregelatinization in plain water in presence of heat and acetylation in the reaction vehicle,
pyridine. The acetylation reaction scheme is shown in Figure 4.1. The starting material
of the whole process was Pure-Dent B700® from Grain Processing Corporation, which
was a native (immodified) starch (25% amylose) obtained from dent (com), Zea mays L.
The synthesized starch acetate was characterized for its dS and molecular mass values.
The theoretical maximum yield of starch acetate from 50 g of starch is 89 g in case of
complete acetylation of starch acetatc In practice, 74 g was obtained. The
discrimination could be due to incomplete reaction or the loss during handling the
reaction products.
117
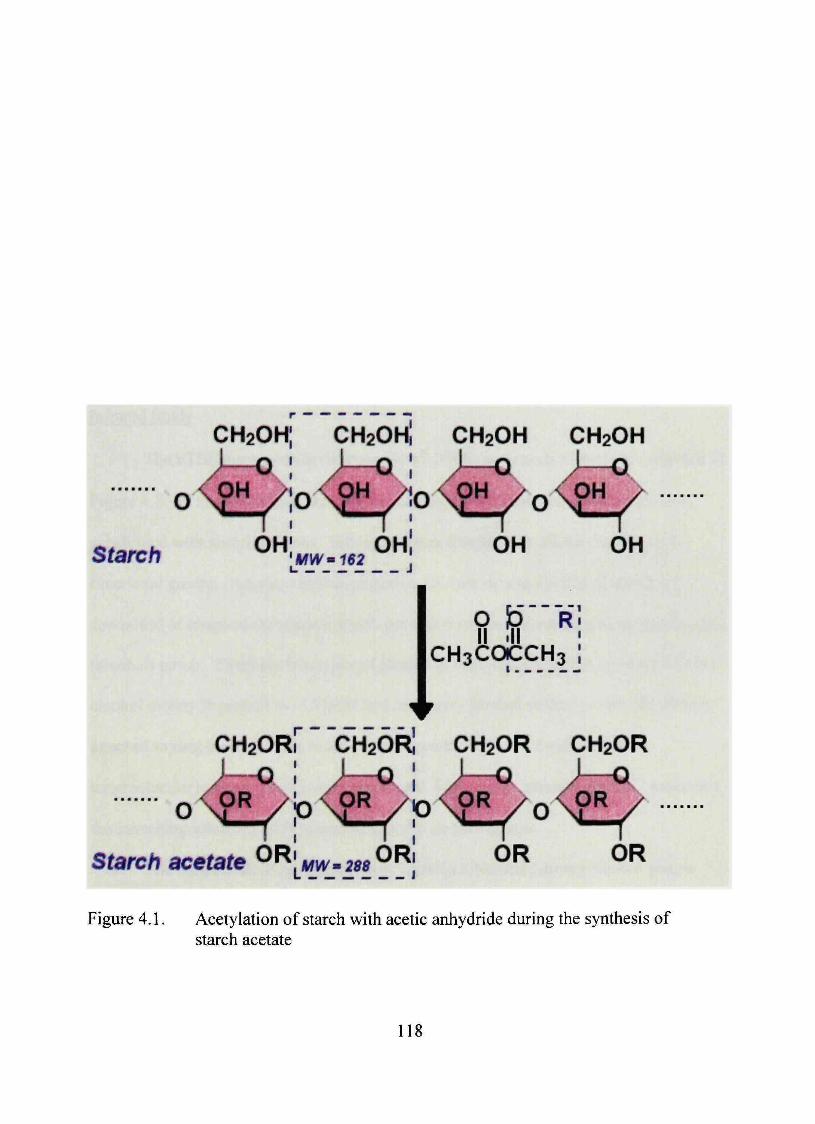
CHÎOH; CHSOHI CH^OH CH^OH >—o ; >—o ; J—o J—o
o<s£|y!o\£l/io\2:Í/o\2î / Starch 0":«v..,«0"i °» 0»
I J
CH3COCCH3
CH^ORr " "CH"2ÔR!
Starch acetate ^^[MWjm^^|
Figure 4.1. Acetylation of starch with acetic anhydride during the synthesis of starch acetate
118
Characterization of the Synthesized Starch Acetate
Degree of Substitution
The obtained dS using the equation 3.3 was 2.9 (theoretical maximum, 3,0) and
the acetyl content with the equation 3.2 was 43.94 (theoretical maximum, 44.79). These
values proved almost complete acetylation. High dS was essential for controUed release
properties of the polymer. Therefore, prepared starch acetate would be suitable for using
in the controlled release multi-particulate dmg delivery systems.
Infrared Study
The FTIR spectra of starch (Pure-Dent B700) and starch acetate are presented in
Figure 4.2. In the acetylation reaction, the OH moieties of monomers in starch were
substituted with acetyl moieties. Infrared spectra should show all the changes in the
functional groups. Amylose and amylopectin, the two stmctural units of starch are
composed of identical monomers, which have only one prominent functional group, OH
(alcohol) group. There are two types of alcohol groups in those stmctural unhs. Primary
alcohol moiety is present as -CH2OH and secondary alcohol moiety as the OH. directly
attached to ring carbons. The broad peak at around 3400 cm" could be due to
intermolecularly hydrogen bonded OH groups. The peak at around 1020 cm" explained
the stretching vibration of the secondary cyclic alcohol groups,
The broad peak of intermolecularly hydrogen bonded primary alcohol groups
completely disappeared in the starch acetate spectmm showing that OH was almost
completely substituted. The two peaks at 1240 cm" and 1040 cm" were due to the
119
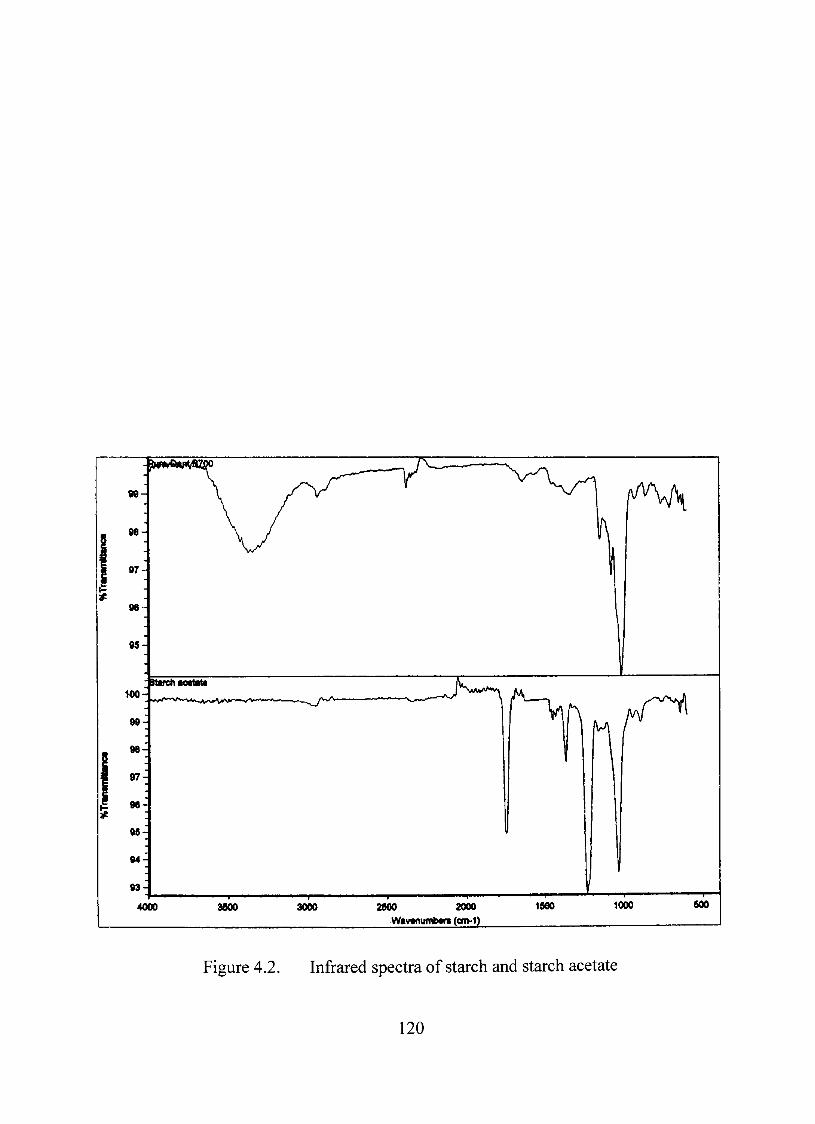
2900 2000 Wawnumbcra (cm-1)
Figure 4.2. Infrared spectra of starch and starch acetate
120
presence of C-O-C vibrations. The C=0 group in the ester moiety were responsible for
the peak at 1750 cm"V AU these spectral changes supported that an almost complete
acetylation had occurred.
X-ray Diffraction Studv
The X-ray diffraction pattems of native starch and starch acetate are presented in
Figure 4.3. The large flat region of the diffractogram showed that the polymer was
mostly amorphous. However, it showed few reflections in the X-ray pattern, especially
those at 7.533, 8.892, 9.050, and 11.542 °(0). These peaks may correspond to an A-type
crystal stmcture (Ogawa et al., 1999). AU the reflections were lost in the starch acetate
diffractogram. This was due to the dismption of starch granules during the
pregelatinization process that resulted in almost completely amorphous polymer. This
supported a good environment for complete acetylation of starch. The strong reflection at
21.633° came from the metallic aluminum of the sample pan used in the study.
Particle Size Analysis
The comparative results for particle size distribution of starch and synthesized
starch acetate are presented in Table 4.1. A representative figure of the distribution is
shown in Figure 4.4. The bell shaped figure for all particle size parameters proved
unimodal distribution of the particles. Particle size is of great importance when a
dissolution step is involved in the process. Particles with smaller size dissolve faster than
the larger ones. In case of soluble polymers when viscosity increases rapidly with
121
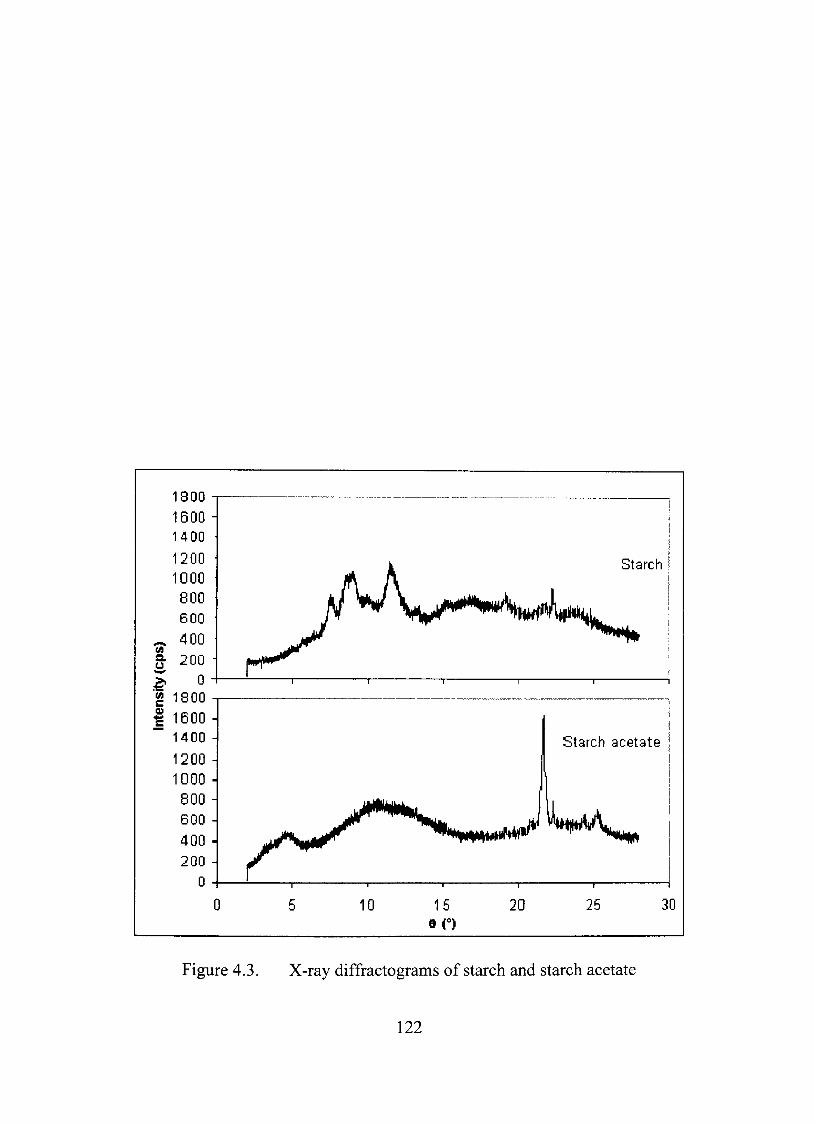
1800 1600 1400 1200 1000 800 600 400 200
0
Starch
1600 -1400 -
1200 -
10 O •
800 -
600 -
400 •
200 -
0 -
Starch acetate
jfcf^bfc 1
.y^^^%^^K^^ ^ Jf ^^a^ ^"^^mM^ ^ %M*
f \ 1 • • 1 r
10 15 20 25 30
Figure 4.3. X-ray diffractograms of starch and starch acetate
122
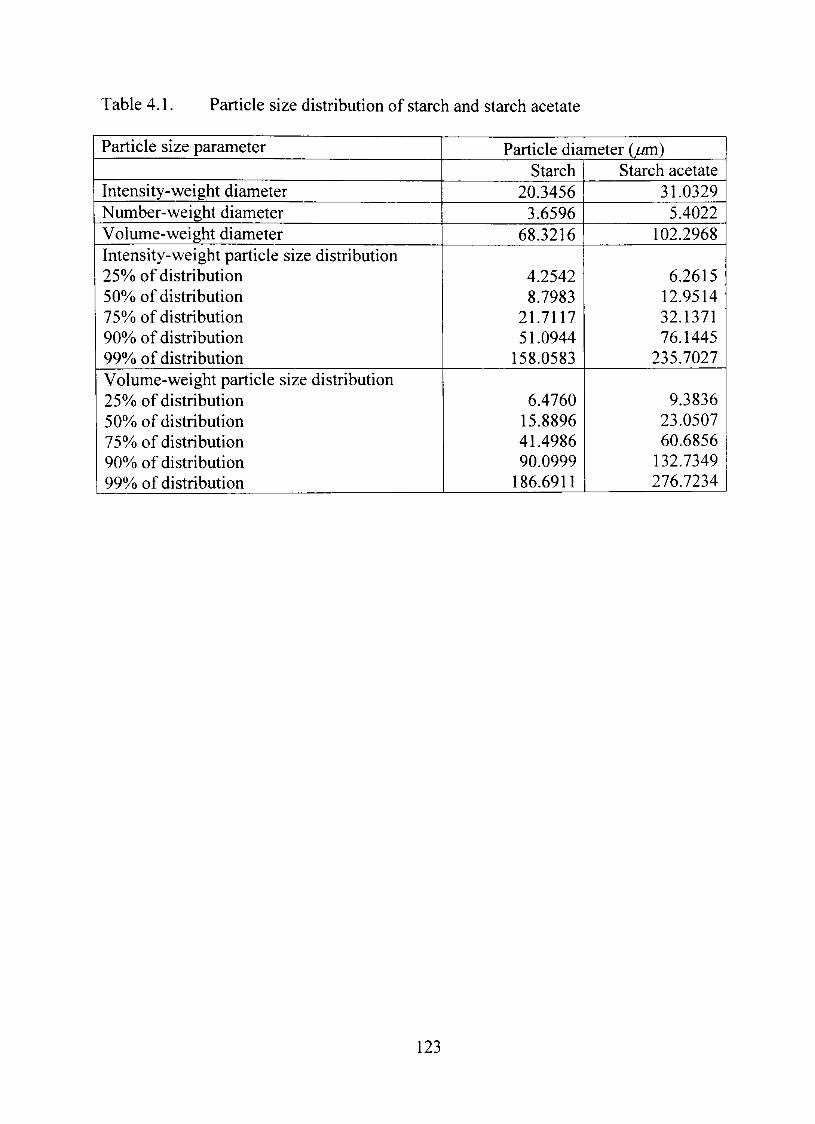
Table 4.1. Particle size distribution of starch and starch acetate
Particle size parameter
Intensity-weight diameter Number-weight diameter Volume-weight diameter Intensity-weight particle size distribution 25% of distribution 50%ofdistribution 75% of distribution 90%ofdistribution 99%ofdistribution Volume-weight particle size distribution 25% of distribution 50%ofdistribution 75% of distribution 90%ofdistribution 99%ofdistribution
Particle diameter ( / ^ ) Starch
20.3456 3.6596
68.3216
4.2542 8.7983
21.7117 51.0944
158.0583
6.4760 15.8896 41.4986 90.0999
186.6911
Starch acetate 31.0329
5.4022 102.2968
6.2615 12.9514 32.1371 76.1445
235.7027
9.3836 23.0507 60.6856
132.7349 276.7234
123
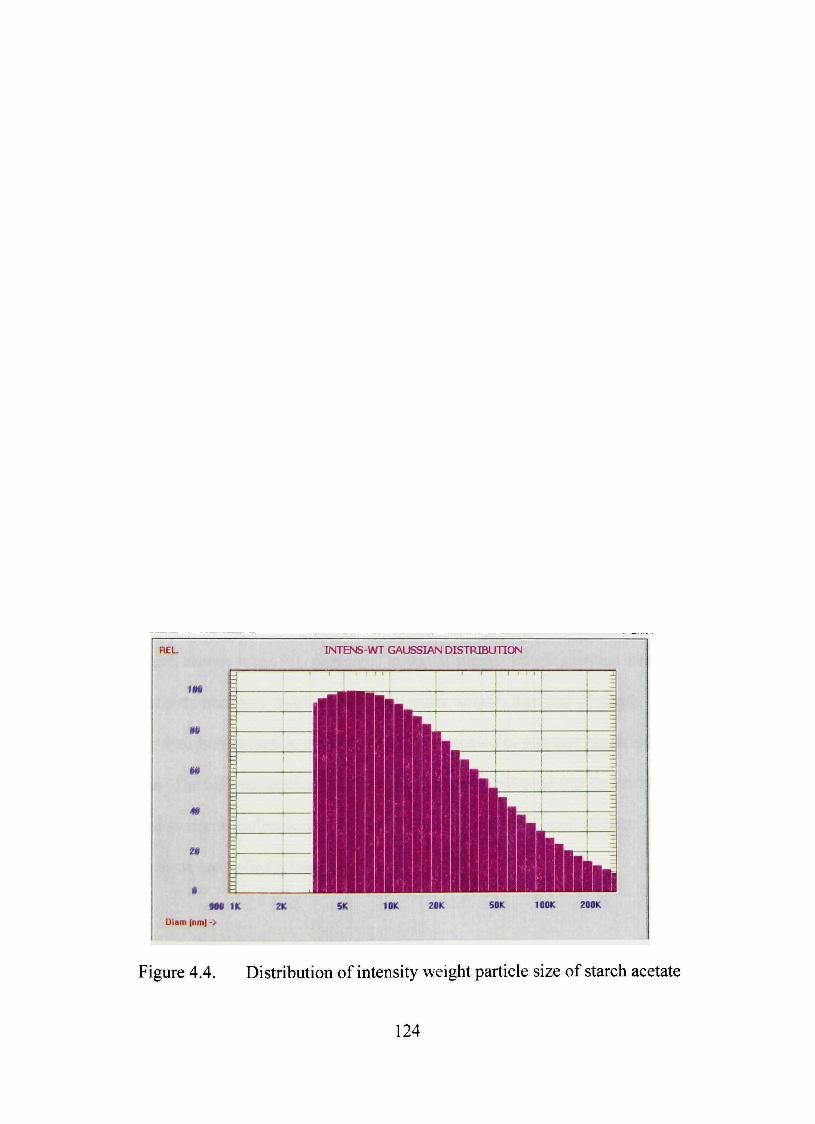
REL
m
m
u
Diam (nmj ->
:t-
t
INTeNB-WT GAUSSIAN DISTRIBUTION
I
5K lOK 20K 50K 100K 200K
Figure 4.4. Distribution of intensity weight particle size of starch acetate
124
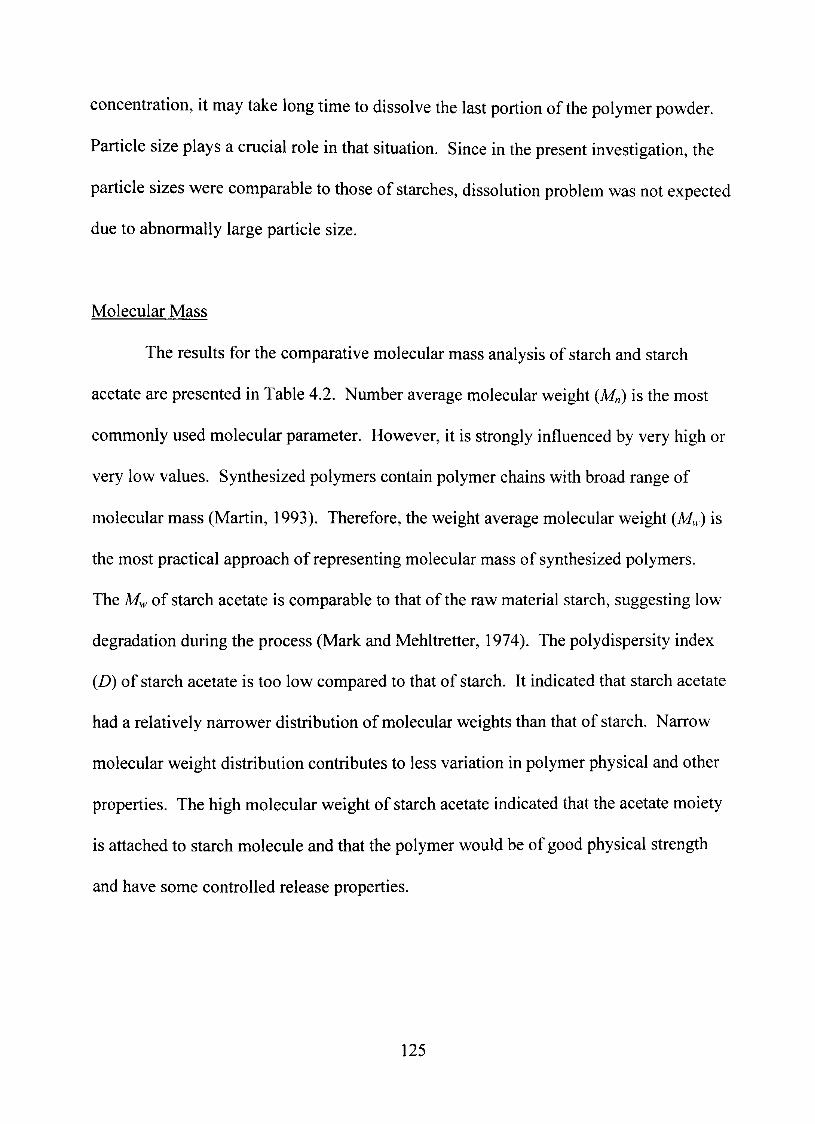
concentration, it may take long time to dissolve the last portion of the polymer powder.
Particle size plays a crucial role in that situation. Since in the present investigation, the
particle sizes were comparable to those of starches, dissolution problem was not expected
due to abnormally large particle size.
Molecular Mass
The results for the comparative molecular mass analysis of starch and starch
acetate are presented in Table 4.2. Number average molecular weight (M^) is the most
commonly used molecular parameter. However, it is strongly influenced by very high or
very low values. Synthesized polymers contain polymer chains with broad range of
molecular mass (Martin, 1993). Therefore, the weight average molecular weight (M,) is
the most practical approach of representing molecular mass of synthesized polymers.
The Mr of starch acetate is comparable to that of the raw material starch, suggesting low
degradation during the process (Mark and Mehltretter, 1974). The polydispersity index
(D) of starch acetate is too low compared to that of starch. It indicated that starch acetate
had a relatively narrower distribution of molecular weights than that of starch. Narrow
molecular weight distribution contributes to less variation in polymer physical and other
properties. The high molecular weight of starch acetate indicated that the acetate moiety
is attached to starch molecule and that the polymer would be of good physical strength
and have some controlled release properties.
125
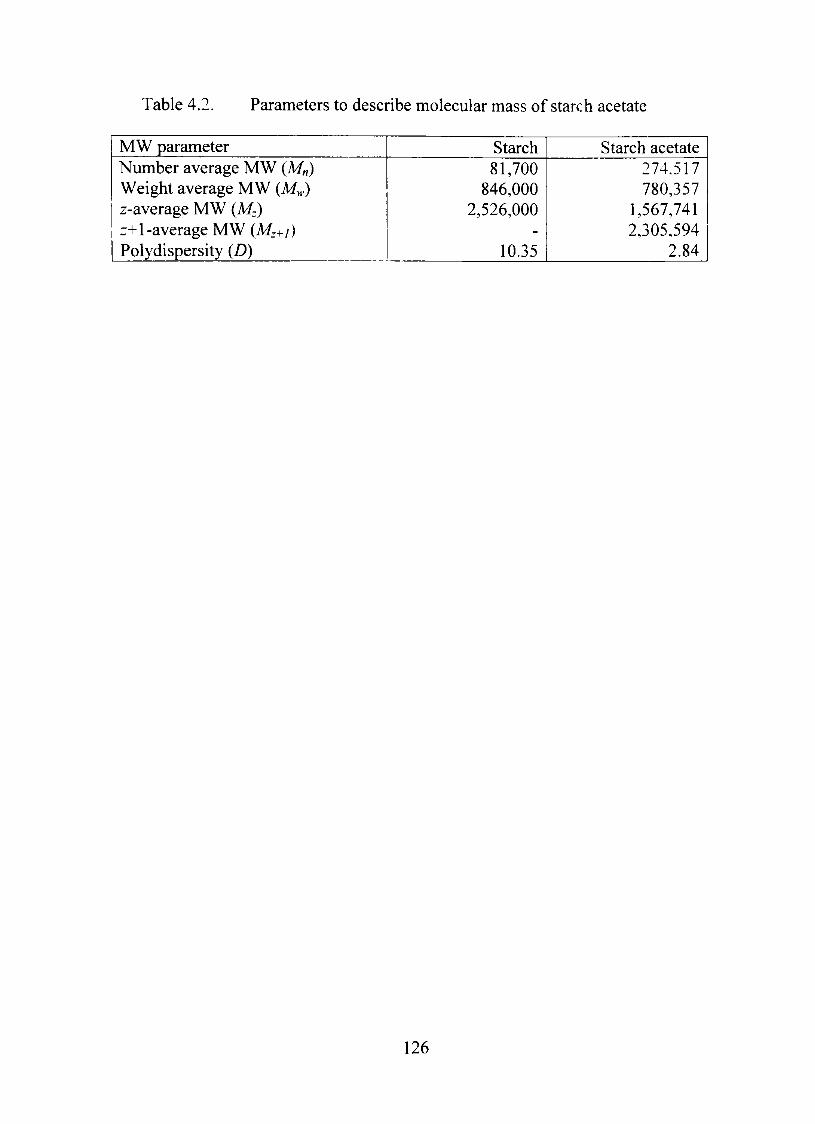
Table 4.2 Parameters to describe molecular mass of starch acetate
MW parameter Number average MW (Mn) Weight average MW (M^,) z-average MW (A/-) r+l-average MW (Mr+/) Polydispersity (D)
Starch 81,700
846,000 2,526,000
-
10.35
Starch acetate 274.517 780,357
1,567,741 2,305,594
2.84
126
Differential Scanning Calorimetrv
DSC was performed to determine the glass transition temperature of starch
acetate. It was found to be 34.43 °C. A low Tg was an indication that low inlet
temperature would be enough to form a good fílm during coating, The DSC thermogram
of starch acetate is shown in Figure 4.5.
Further Characterization of Starch Acetate
Starch acetate was further characterized with some physical characteristics. It
was a white powder. The pungent odor was due to the presence of trace amount of
pyridine, which was diffícult to remove completely, Otherwise, starch acetate is
odorless. The bulk density was about 0,25 g/mL, indicating it as a very light polymer.
The loss on drying after heating at 105 °C until the weight reached equilibrium, was only
2,38%. The volatile materials were not moisture, since the synthesis process was carried
out in organic medium. Those were mostly pyridine and alcohol. The loss on drying of
native starch was 11-12% and the lost mass was bound moisture.
The solubility of starch acetate was also determined. It was not only insoluble in
water, but also hydrophobic. Water could not wet it. This is contrary to the parent
polymer, starch, which was not completely soluble in water but hydrophilic and made
colloidal dispersion with water. This complete change in nature was the key point of the
conversion. Hydrophobic polymers make h possible to control drug release, Starch
acetate was completely soluble in chloroform and dimethyl sulfoxide (DMSO). It was
insoluble in alcohol, acetone, carbon tetrachloride, dichloromethane, ethyl acetate, ether
and hexane.
127
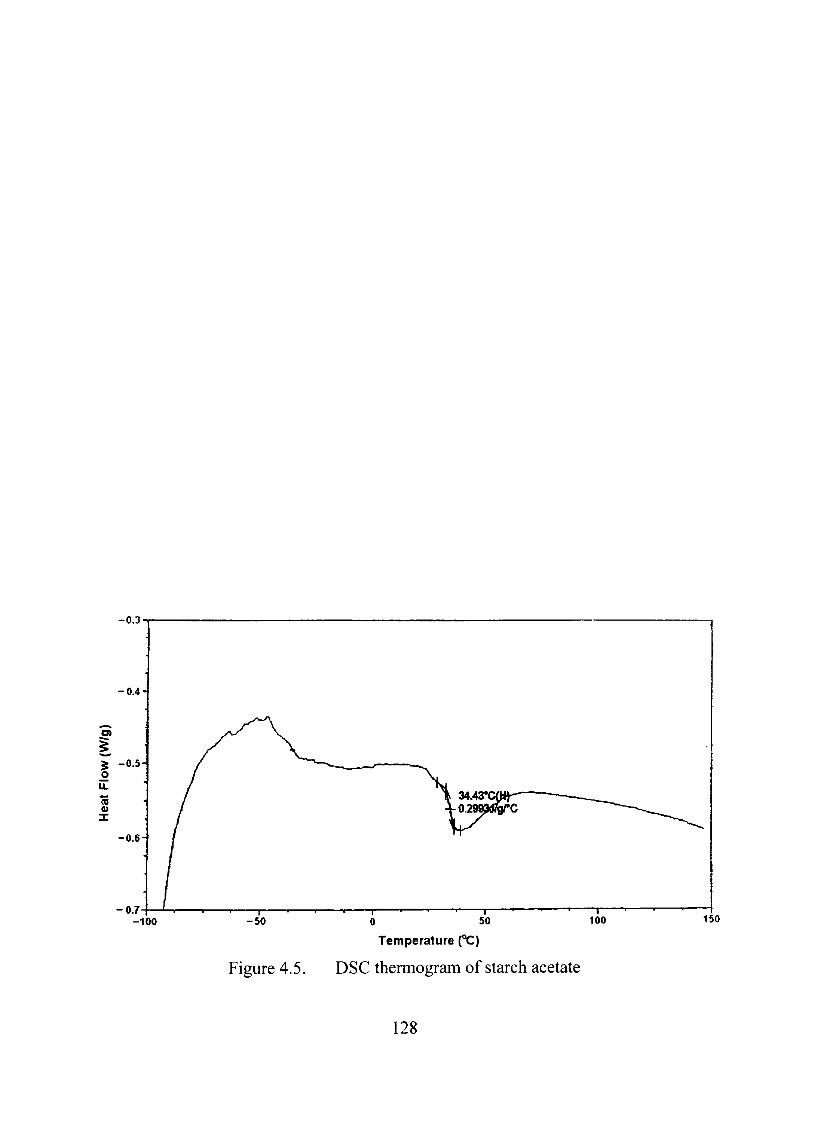
0.3
0.4
I ^ -0 .5 o
LL
"íD V
0.6
0.7 100 - 5 0
« 1 ' ' ' T" 0 50
-, —^ 100
Temperature (°C)
Figure 4.5, DSC thermogram of starch acetate
150
128
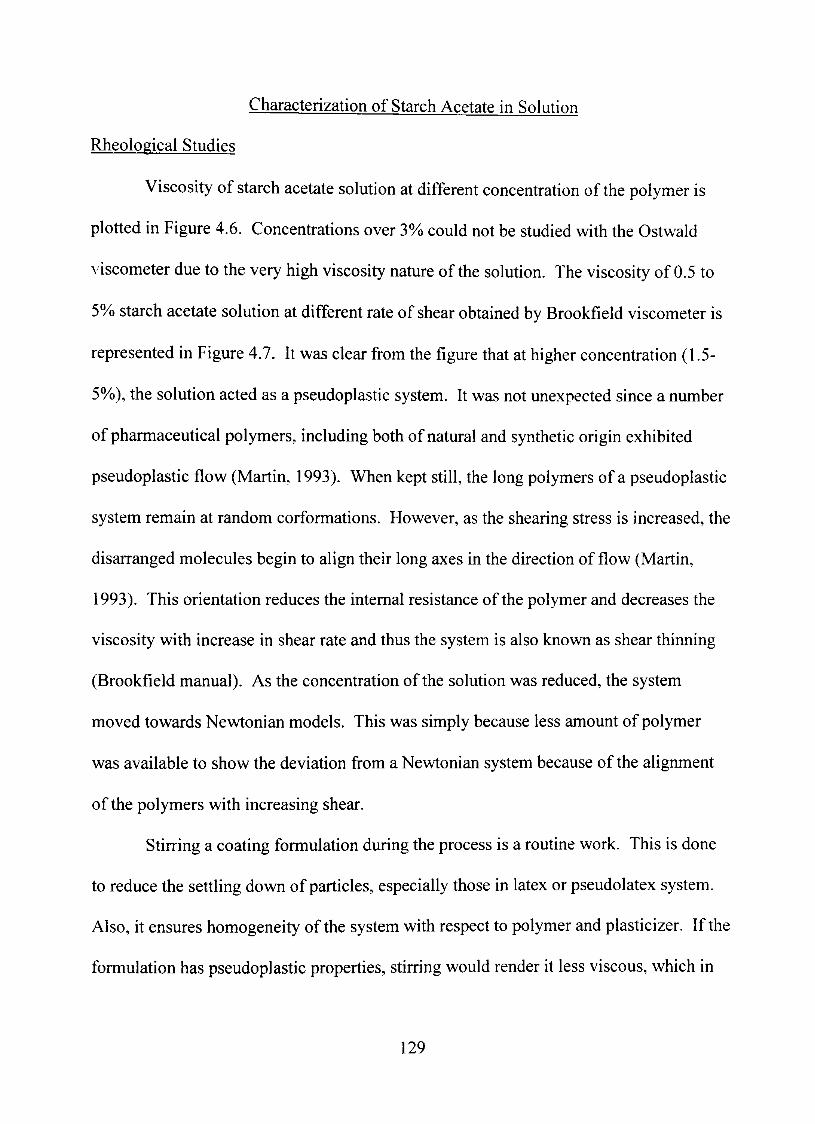
Characterization of Starch Acetate in Solution
Rheological Studies
Viscosity of starch acetate solution at different concentration of the polymer is
plotted in Figure 4,6. Concentrations over 3% could not be studied with the Ostwald
viscometer due to the very high viscosity nature of the solution. The viscosity of 0.5 to
5% starch acetate solution at different rate of shear obtained by Brookfíeld viscometer is
represented in Figure 4.7. It was clear fi-om the fígure that at higher concentration (1.5-
5%), the solution acted as a pseudoplastic system. It was not unexpected since a number
of pharmaceutical polymers, including both of natural and synthetic origin exhibited
pseudoplastic flow (Martin, 1993). When kept still, the long polymers of a pseudoplastic
system remain at random corformations. However, as the shearing stress is increased, the
disarranged molecules begin to align their long axes in the direction of flow (Martin,
1993), This orientation reduces the intemal resistance of the polymer and decreases the
viscosity with increase in shear rate and thus the system is also known as shear thinning
(Brookfíeld manual). As the concentration of the solution was reduced, the system
moved towards Newtonian models. This was simply because less amount of polymer
was available to show the deviation from a Newtonian system because of the alignment
of the polymers with increasing shear.
Stirring a coating formulation during the process is a routine work. This is done
to reduce the settling down of particles, especially those in latex or pseudolatex system.
Also, h ensures homogeneity of the system with respect to polymer and plasticizer. If the
formulation has pseudoplastic properties, stirring would render it less viscous, which in
129
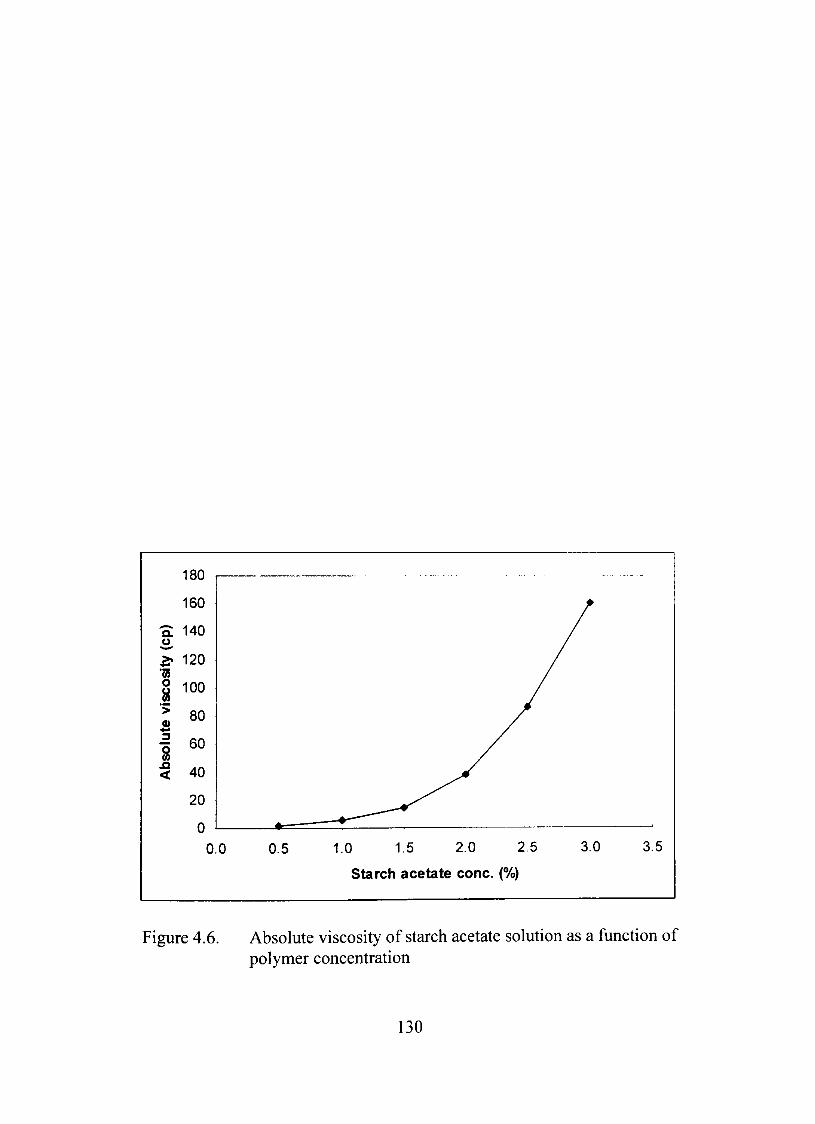
Q. O
i^ 'm
sco
> 0) «rf
3
S J3 <
180
160
140
120
100
80
60
40
20
0 0.0 0.5 1.0 1.5 2.0 2.5
Starch acetate conc. (%)
3.0 3.5
Figure 4.6. Absolute viscosity of starch acetate solution as a function of polymer concentration
130
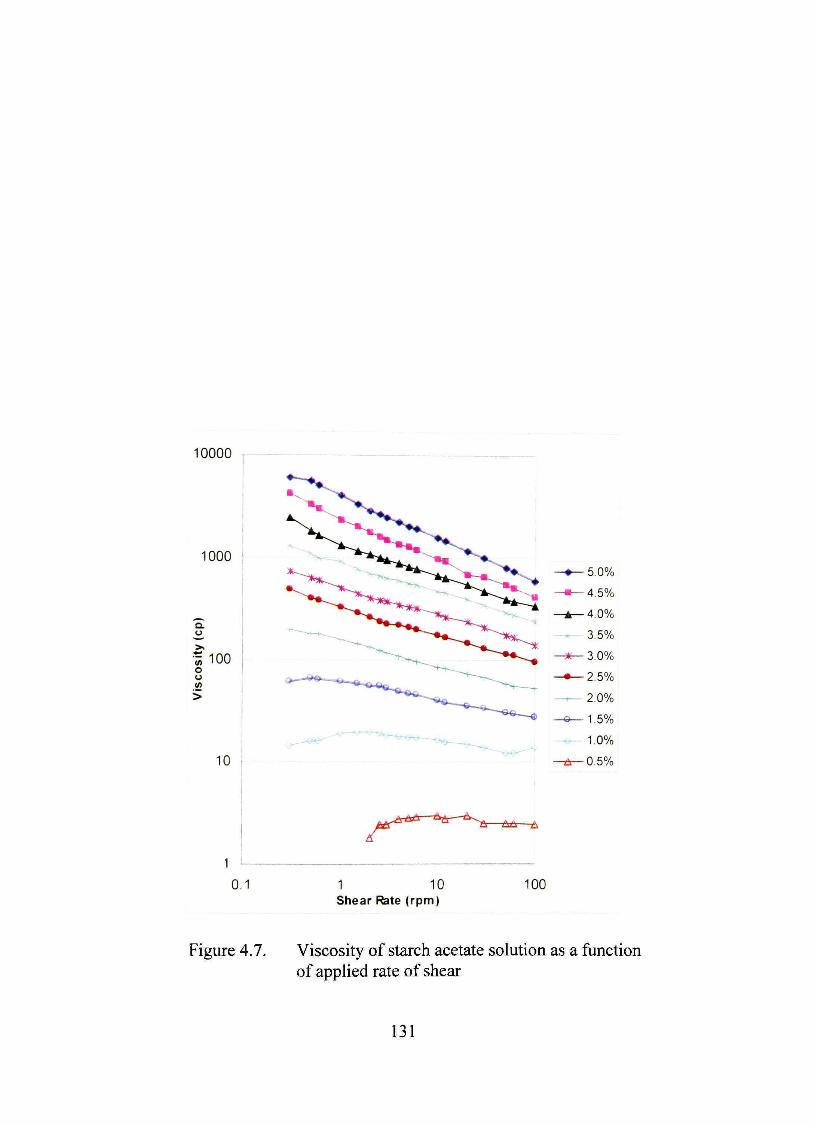
10000
1000
Q.
•f 100 o o w >
10
-•— 5.0%
-•»—4.5%
-A—4.0%
- - 3.5%
-í*e- 3.0%
•*—2.5%
- ^ 2.0%
•«— 1.5%
1.0%
0,5%
A ^ -A
0.1 1 10 Shear Rate (rpm)
100
Figure 4.7. Viscosity of starch acetate solution as a function of applied rate of shear
131
tum would allow using a formulation system with higher viscosity with ease. In this way
a coating formulation with pseudoplastic flow is advantageous over others.
Surface Tension
The solution of starch acetate in chloroform did not show any appreciable change
in surface tension with change in polymer concentration. The measurements were carried
out with between 0.5 and 5% of starch acetate. The surface tension values were between
28.36 and 33.31 dyne/cm within the used concentration range at 20 °C. The surface
tension of pure chloroform at this temperature was 27.1 dyne/cm. This was
understandable since for a polymer with such a high molecular mass it is very difficult to
concentrate between the interfaces and affect the surface tension of the system. Since the
surface tension of starch acetate solution was unaffected by the polymer concentration,
the latter was expected to have minimal effect on fílm formation,
Characterization of Free Films
Film Appearance and Homogeneity
Starch acetate made a slightly cloudy solution when completely dissolved in
chloroform. Since the solvent is of low boiling point, fílms could be prepared in
considerably less time period. However, it was necessary to make sure that the solution
was continuously stirred all the time before pouring the solution on the pan or during the
coating process. A separation of the plasticizer from the polymer solution was found to
occur if the solution was kept unstirred for several hours.
132
The majority of the plasticizers used in the study did not yield good fílm. Films
with ATHC, DES, DBS, DEHS, DINP, and PEG600 were completely or partially white.
This was due to incompatibility of the plasticizers with starch acetate and hence, the
plasticizers migrated during the fílm forming process. Besides, those fílms were
considerably brittle suggesting their inefficiency in the systems. It was noteworthy that
the higher molecular weight species from each groups showed incompatibility indicating
that the plasticizer molecules were too large to incorporate themselves into the
intermolecular spaces of the polymers. ATBC and DBP generated brittle and translucent
fílms with white edges. Glycerin, PG, and DA all absorbed a lot of moisture from the
atmosphere as well as they produced translucent fílm making them unsuitable for film
formation. The hygroscopic nature of these plasticizers was responsible for accumulation
of water.
Among the others, TEC, TBC, ATEC, and TA yielded films, which were among
the best in appearance. DMS and DEP also made transparent films. Therefore, TEC,
TBC, ATEC, TA, DMS and DEP were tested for mechanical properties of starch acetate
films.
Overall, the citric acid esters and triacetin gave homogeneous fílms with good
appearance due to their comparatively small molecular size. Phthalic acid esters contain
an aromatic ring but their sizes are comparable to the citrates and probably that was the
reason for their moderate activity in fílm formation. On the other hand, sebacic acid
esters contain at least 22 carbons. h is not very easy for such a long chain to occupy
itself entirely into the intermolecular voids of the polymer.
133
Mechanical Properties
Aging was shown to have effect on the mechanical and other physical properties
of polymeric films (Guo, 1994; Krogars et al., 2003). Therefore, although films with
good physical properties can be prepared with a broad range of plasticizers at broad range
of concentrations, a careful selection is essential to ensure that the films would retain
their properties over time.
Plasticizers fi'om different chemical family had been tested for the mechanical
study. AU the plasticizers produced transparent film suggesting their !ow diffiision
coefficients in the polymer. The results of the mechanical properties of starch acetate
films with different plasticizers are listed in Table 4.3. Plasticizers occupy their place
between polymer molecules and act as lubricants. In this way they increase film
flexibility, as would be evident from increased elongation. Due to their tendency to
separate polymer molecules from each other, they decrease the tensile strength and
toughness of the fílms. Plasticizer also increases the softness of films. It is clear from
Table 4.3 that tensile strength, Young's modulus, toughness of the films decreased and
elongation increased consistently when the fílms were prepared with triethyl citrate or
triacetin. AIso these fílms were stronger compared to others as evident from the higher
tensile strength values. These have better flexibility and considerable toughness.
Therefore, triethyl citrate and triacetin were selected for ftirther studies.
134
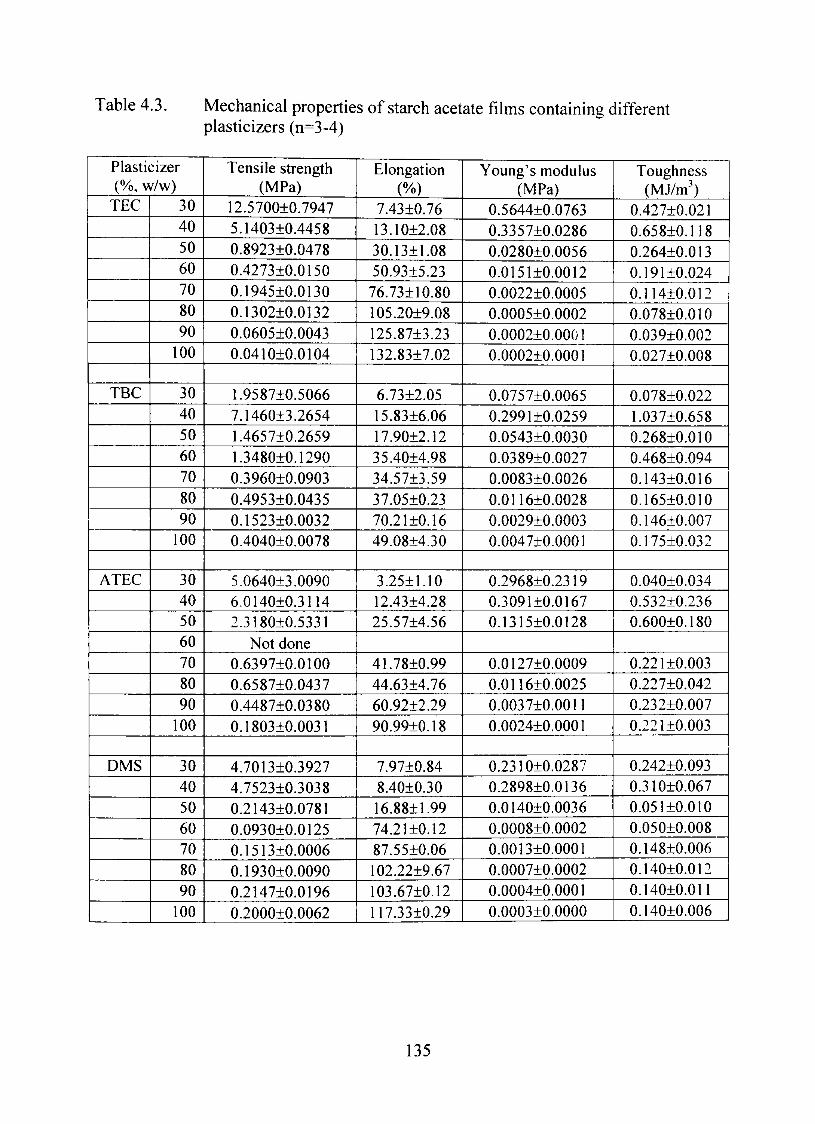
Table4.3. Mechanical properties of starch acetate fílms containing different plasticizers (n=3-4)
Plasticizer (%, w/w) TEC
TBC
ATEC
DMS
30 40 50 60 70 80 90 100
30 40 50 60 70 80 90 100
30 40 50 60 70 80 90 100
30 40 50 60 70 80 90 100
Tensile strength (MPa)
12.5700±0.7947
5.1403+0.4458
0.8923+0.0478
0.4273+0.0150
0.194510.0130
0.1302±0.0132
0.0605±0.0043
0.0410±0.0104
1.9587±0.5066
7.1460±3.2654
1.4657±0.2659
1.3480±0.1290
0.3960±0.0903
0.4953±0.0435
0.1523±0.0032
0.4040±0.0078
5,0640±3.0090
6,0140+0.3114
2,3180±0.5331
Not done
0.6397±0.0100
0.6587±0,0437
0,4487±0.0380
0.1803±0.0031
4.7013±0.3927
4.7523±0.3038
0.2143+0.0781
0.0930±0.0125
0.1513±0.0006
0.1930±0.0090
0.2147±0.0196
0.2000±0.0062
Elongation (%)
7.43±0.76
13,10±2.08
30.13±1.08
50.93±5,23
76.73+10.80
105.20±9.08
125.87±3.23
132.83±7.02
6.73±2.05
15.83±6,06
17.90±2.12
35.40±4,98
34.57±3,59
37.05±0.23
70.21 ±0.16
49,08±4,30
3,25±1,10
12,43±4.28
25,57±4.56
4],78±0.99
44.63±4.76
60.92±2.29
90.99±0.18
7,97±0,84
8,40±0,30
16,88±1,99
74.21 ±0.12
87.55±0,06
102,22±9,67
103,67±0,12
117.33±0.29
Young's modulus (MPa)
0.5644±0.0763
0.3357±0.0286
0.0280±0.0056
0.0151±0,0012
0.0022±0.0005
0.0005±0,0002
0.0002±0,0001
0,0002±0,0001
0,0757±0.0065
0.2991 ±0.0259
0.0543±0,0030
0,0389±0,0027
0.0083±0.0026
0.0116±0,0028
0,0029±0.0003
0,0047±0,0001
0,2968±0,2319
0,3091±0,0167
0,1315±0.0128
0,0127±0,0009
0.0116±0,0025
0.0037±0,0011
0.0024±0,0001
0,2310±0,0287
0.2898±0,0136
0.0140±0,0036
0,0008±0,0002
0.0013±0,0001
0.0007±0,0002
0.0004±0,0001
0.0003±0,0000
Toughness (MJ/m^)
0.427±0.021
0.658±0.118
0.264±0.013
0.191±0.024
0,114±0,0]2
0,078±0,010
0.039±0,002
0,027±0,008
0,078±0,022
1.037±0,658
0,268±0.010
0.468±0.094
0.143±0.016
0,165±0.010
0.146±0.007
0.175±0.032
0.040±0,034
0,532±0,236
0,600±0,180
0.221 ±0,003
0.227±0.042
0.232±0.007
0.221±0,003
0,242±0,093
0,310±0.067
0.051 ±0.010
0.050±0.008
0.148±0.006
0.140+0.012
0.140±0.011
0.140±0,006
135
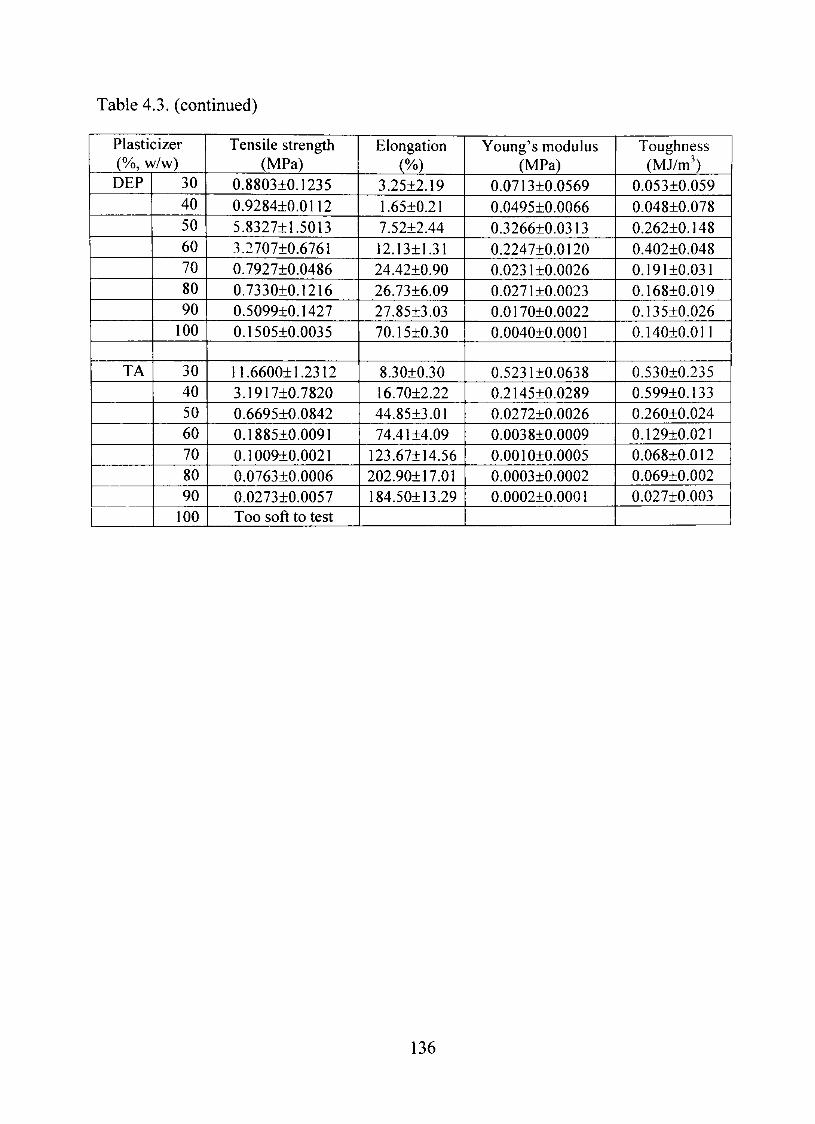
Table 4.3. (continued)
Plasticizer (%, w/w) DEP
TA
30 40 50 60 70 80 90 100
30 40 50 60 70 80 90 100
Tensile strength (MPa)
0,8803±0.1235
0,9284±0,0112
5,8327±1,5013
3,2707±0.6761
0.7927±0.0486
0,7330±0,1216
0.5099±0.1427
0.1505±0.0035
11.6600±1.23I2
3.1917±0,7820
0.6695±0,0842
0.1885±0,0091
0,1009±0.0021
0.0763±0.0006
0,0273±0.0057
Too soft to test
Eiongation
(%) 3.25±2.19
1.65±0.21
7.52±2.44
12.13±1.31
24,42±0.90
26.73±6.09
27.85±3,03
70.15±0,30
8,30±0,30
16.70±2.22
44.85±3.01
74.41±4.09
123.67±14.56
202.90±17.01
184,50±13,29
Young's modulus (MPa)
0,0713±0,0569
0,0495±0,0066
0,3266±0,0313
0.2247±0,0120
0,0231±0,0026
0,0271+0,0023
0.0170±0,0022
0.0040±0,0001
0.5231±0.0638
0.2145±0,0289
0,0272±0,0026
0,0038±0,0009
0,0010±0.0005
0.0003±0.0002
0,0002±0,0001
Toughness (MJ/m')
0.053±0.059
0.048±0.078
0.262±0.148
0.402±0,048
0.191±0.031
0.168±0.019
0.135±0.026
0,140±0,011
0,530±0,235
0.599±0.133
0.260±0,024
0.129±0.021
0.068±0.012
0.069±0.002
0.027±0.003
136
Thermal Analvsis
The primary objective of adding plasticizer to a polymer system is to reduce the
glass transhion temperature, which would ultimately decrease the fílm forming
temperature, so that, coating could be prepared whh ease at low temperature. Plasticizers
acts as lubricants between the polymer chains, provoking the slippage of chain past chain
under stress and extending the temperature range for segmental rotation to lower
temperatures and that actually leads to the formation of continuous fílms.
It is obvious from Figure 4.8 that Tg decreased linearly with TEC and TA
concentrations. However, it reached a plateau at 80% concentration, suggesting that
there was not enough void space in the polymers to carry more plasticizers and using
plasticizers above that concentration would be meaningless. Since triacetin showed
better ability than TEC to lower the Tg, TA was preferred for subsequent experiments. A
40% concentration of triacetin was enough to bring the Tg below zero degree Celsius.
Therefore, triacetin concentration in the range of 40 to 80% would be used in fijrther film
characterization and coating process. Unplastiziced fílm (0% plasticizer) showed a Tg of
31,80 ""C, which is close to the Tg of starch acetate powder (34.43 °C). This suggested
almost complete removal of solvent from the fílm during the fílm drying process.
SEM Analvsis
The scanning electron microscopic pictures of a plasticized and an unplasticized
starch acetate films are shown in Figure 4.9. The unplasticized film appeared to be rough
and layered whereas; the plasticized film was smooth and continuous. This tells that
137
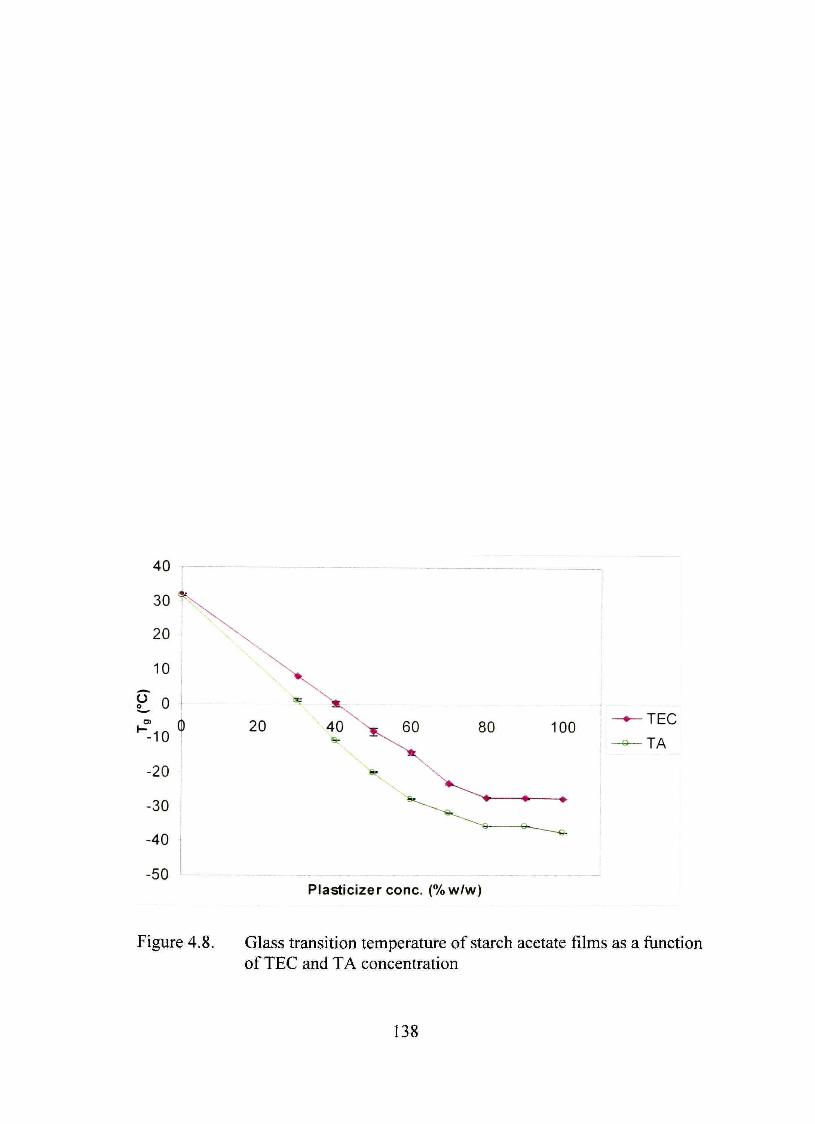
• ^ T E C
• ^ T A
Plasticizer conc. (%w/w)
Figure 4.8. Glass transition temperature of starch acetate films as a fimction of TEC and TA concentration
138
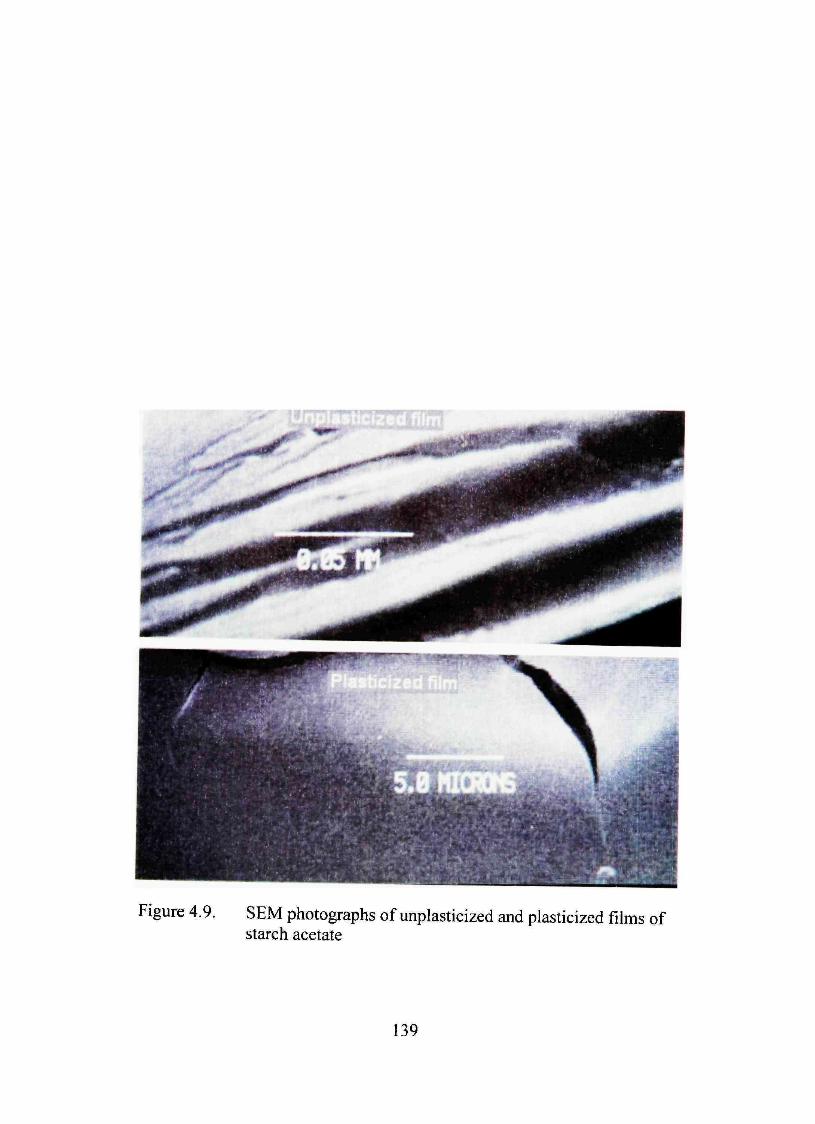
Figure 4.9. SEM photographs of unplasticized and plasticized fílms of starch acetate
139
plasticizer changed film morphology to make homogeneous film and thus h could be
expected that triacetin might help in obtaining uniform film during coating.
Diffusion Studv
Plasticizer was shown to affect the water permeability of polymer film coatings
(Jian-Hwa, 1994), Tritium diffusion study was used earlier by researchers to get idea of
membrane permeability (Vaithiyalingam et al., 2002). Permeability through starch
acetate films was found to be dependent on triacetin concentration in the film (Table 4.4).
Triacetin is water soluble and its dissolution in water opened up the channels in the
membrane through which tritiated water could diffuse faster than if there would had been
no plasticizer. The very low values of the coefficient indicate low permeability,
suggesting suitability of starch acetate as a controlled release coating agent.
Compatibilitv Studies Between the Drug and Excipients
Thermal Analysis
DSC thermograms are represented by Figures 4.10, 4.11 and 4.12. Drug excipient
interaction may lead to peak appearance or disappearance, change in peak shape, size and
position. Dyphylline showed melting at about 163 °C. In all the thermograms of
mixtures, the drug peak was retained. The peaks were somewhat broadened and shifted
to lower temperatures. However, shifts were only less than 10 ''C. Peak broadening and
shift of the endothermic peak were probably due to intermixed nature of the components,
not interaction (Ford and Timmins, 1989).
140
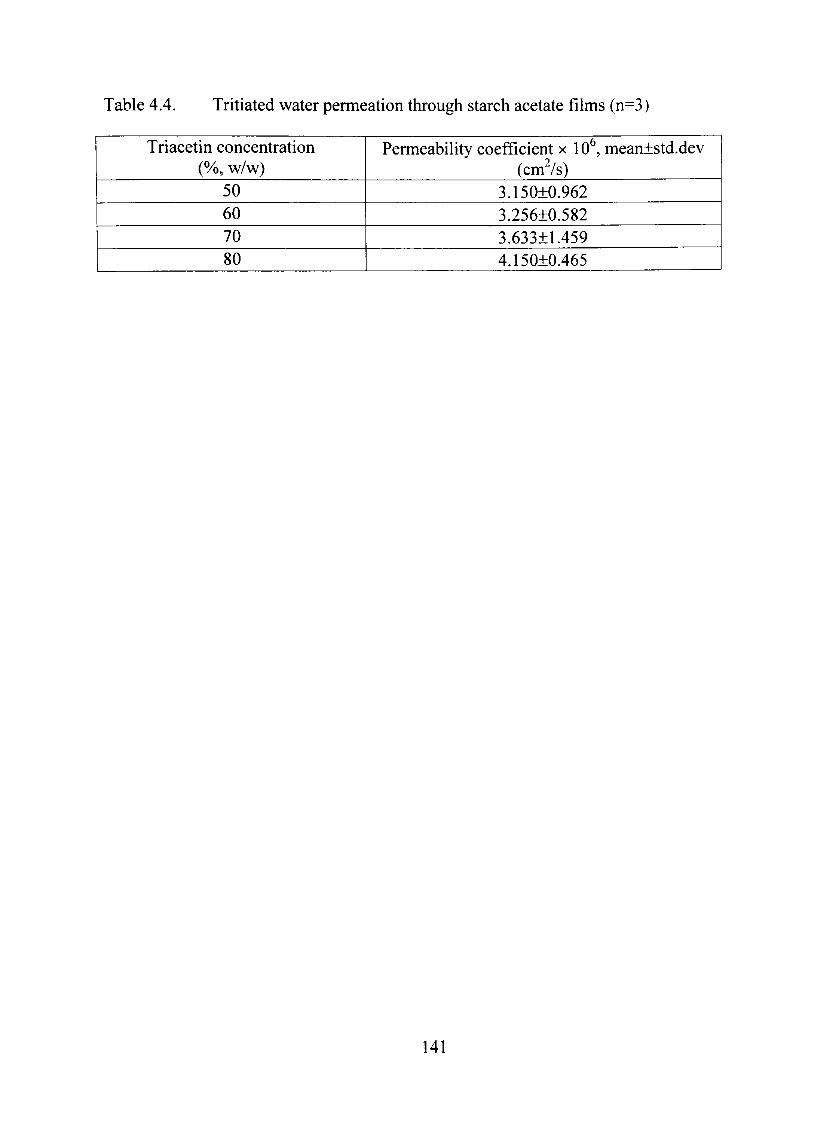
Table 4.4. Tritiated water permeation through starch acetate films (n=3
Triacetin concentration (%, w/w)
50 60 70 80
Permeability coefficient x lO , mean±std.dev (cm^/s)
3.150±0.962 3.256±0.582 3.633±1.459 4.150+0.465
141
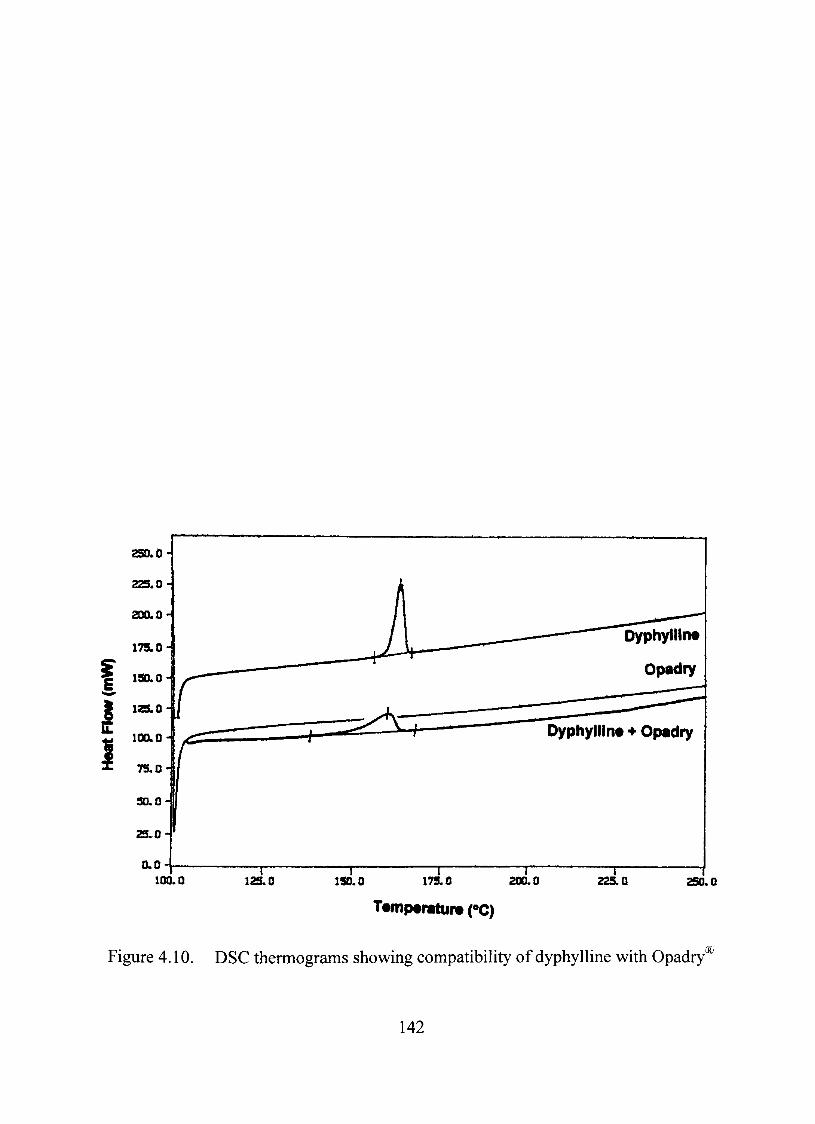
I
ao 100.0 12S.0 m o 179.0 225.0 250.0
Figure 4.10. DSC thermograms showing compatibility of dyphylline with Opadry^
142
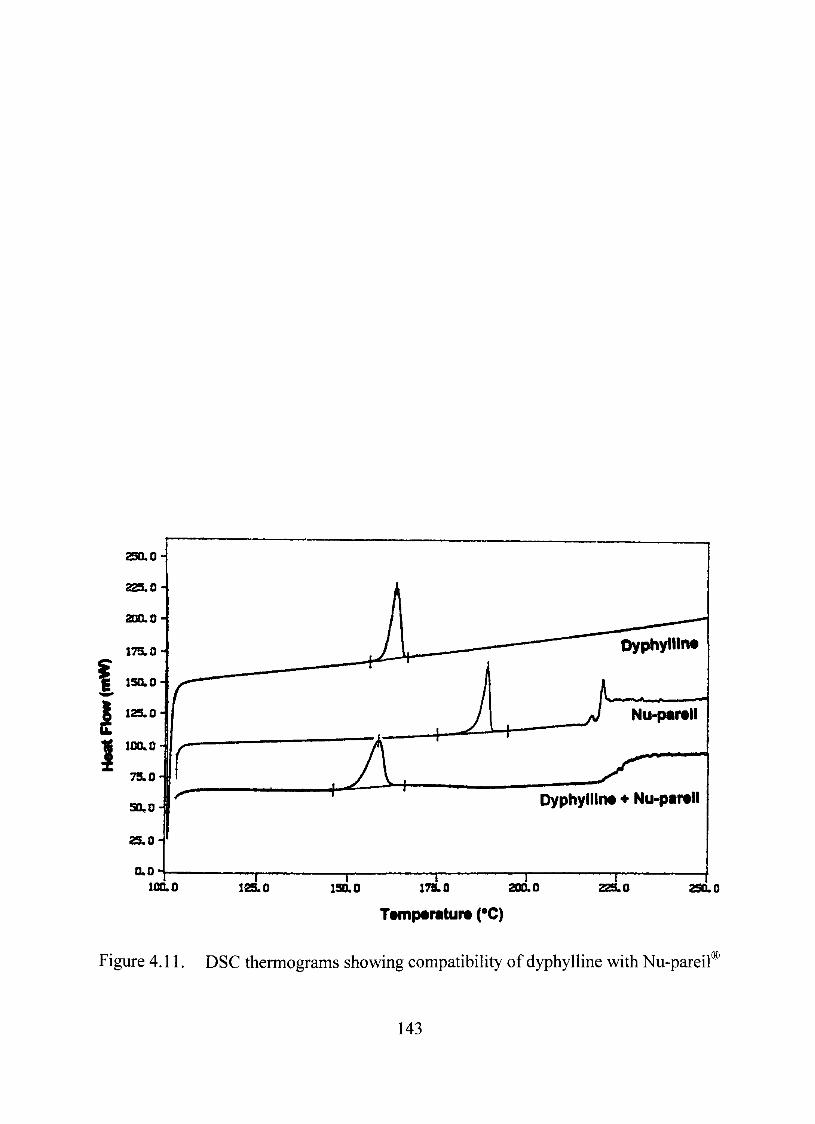
I
ao 100.0 12S.Û —r"
150.0 —r-1 ^ 0
DyphylllM • Nu-partil
— T " 200.0 — p -
225.0 250.0
T9fnp«r«tur* ( 'C)
Figure 4.11. DSC thermograms showing compatibility of dyphylline with Nu-pareil
143
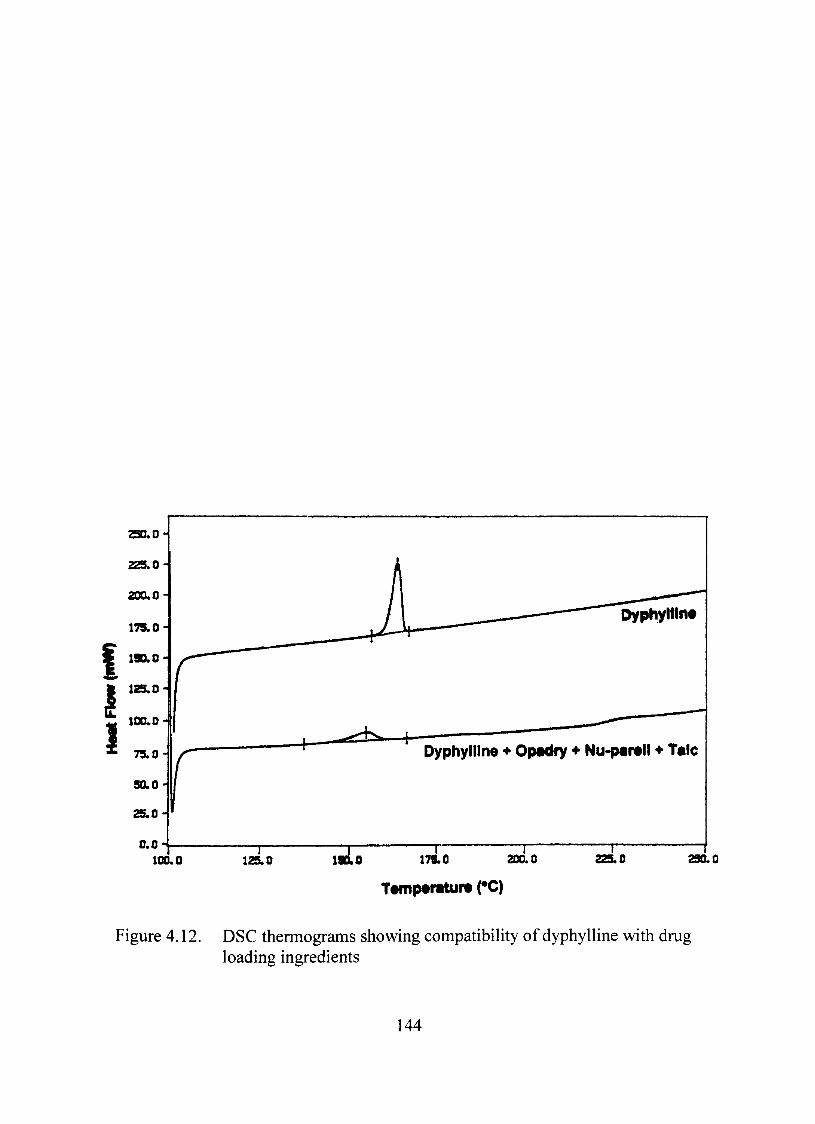
î I I
0,0
100.0
Dyphyllln*
Dyphylline * Opadiy ^ Nu-partll ^ Tafc
125.0 mo 178.0 200.0 —n" 225.0
— f 250.0
T«mp«ratur« (*C)
Figure 4.12. DSC thermograms showing compatibility of dyphylline with drug loading ingredients
144
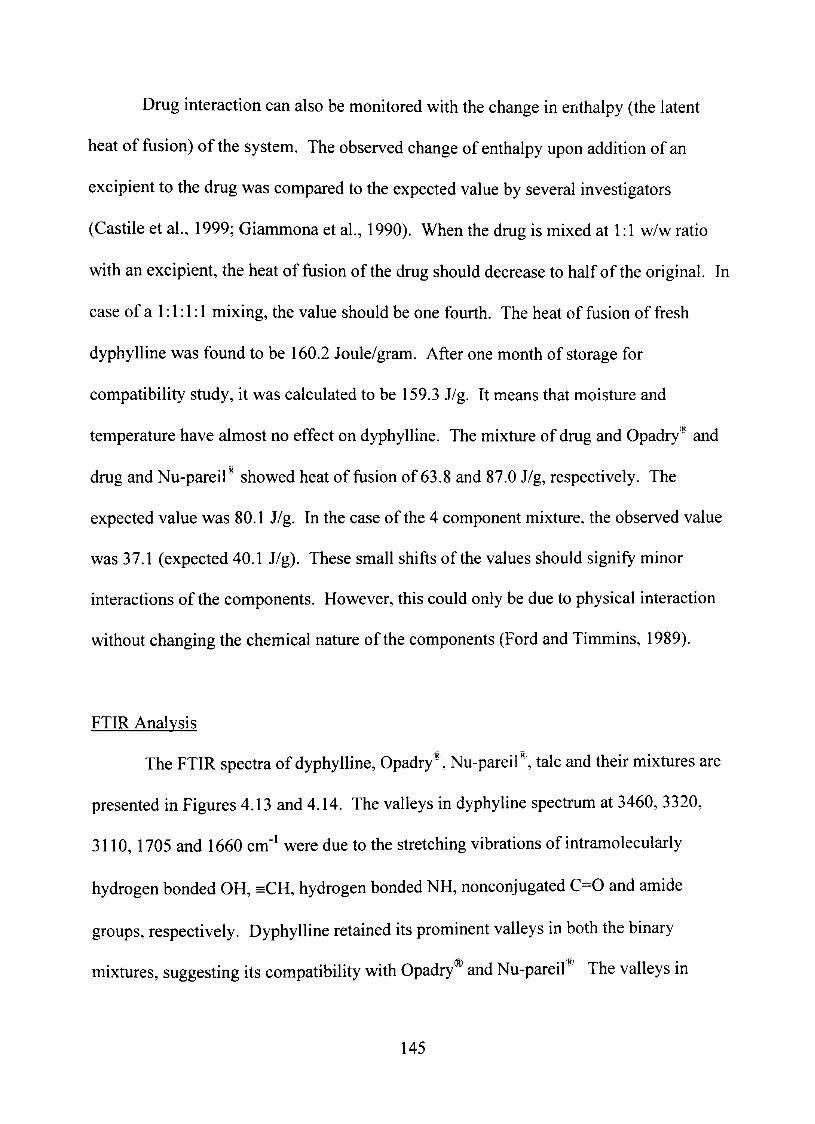
Drug interaction can also be monitored with the change in enthalpy (the latent
heat of fusion) of the system. The observed change of enthalpy upon addhion of an
excipient to the drug was compared to the expected value by several investigators
(Castile et al., 1999; Giammona et al., 1990). When the drug is mixed at 1:1 w/w ratio
with an excipient, the heat of fusion of the drug should decrease to half of the original. In
case of a 1:1:1:1 mixing, the value should be one fourth. The heat of fusion of fresh
dyphylline was found to be 160,2 Joule/gram. After one month of storage for
compatibility study, h was calculated to be 159.3 J/g. It means that moisture and
temperature have almost no effect on dyphylline, The mixture of drug and Opadry" and
drug and Nu-pareil" showed heat of ftision of 63.8 and 87.0 J/g, respectively. The
expected value was 80.1 J/g. In the case of the 4 component mixture, the observed value
was 37.1 (expected 40.1 J/g). These small shifts of the values should signify minor
interactions of the components. However, this could only be due to physical interaction
without changing the chemical nature of the components (Ford and Timmins, 1989).
FTIR Analysis
The FTIR spectra of dyphylline, Opadry^, Nu-pareil", talc and theh mixtures are
presented in Figures 4,13 and 4.14. The valleys in dyphyline spectrum at 3460, 3320,
3110, 1705 and 1660 cm'^ were due to the stretching vibrations of intramolecularly
hydrogen bonded OH, =CH, hydrogen bonded NH, nonconjugated C=0 and amide
groups, respectively. Dyphylline retained its prominent valleys in both the binary
mixtures, suggesting its compatibility with Opadry® and Nu-pareil'^ The valleys in
145
pgfsføh&^'^
95
í 90H
^yphylllhe &^Nu-par9ÍI
3000
V A A|[f\s
"H lYrtmy^T^
2000 1000
WavanumberB (cm-1)
Figure 4.13. FTIR spectra of dyphylline, Opadry®, Nu-pareil" and physical mixtures
146
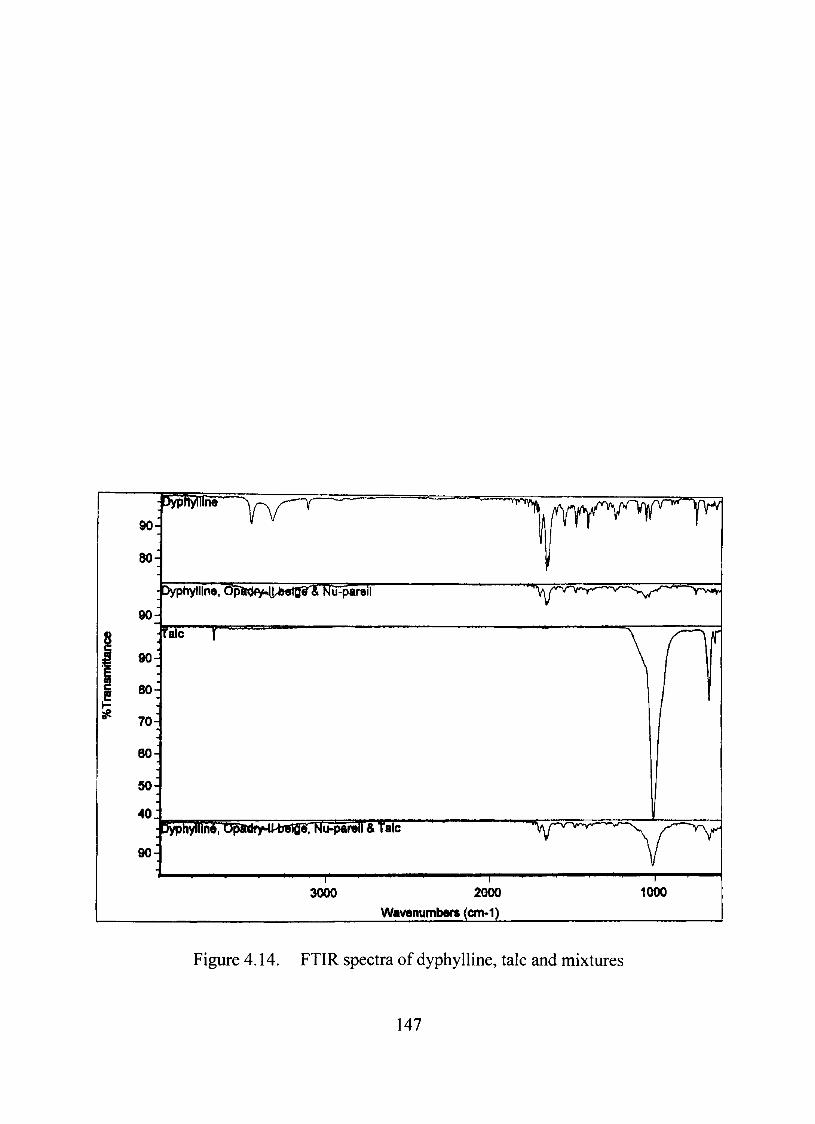
Jypllynini'
90
80H
Dyphylline. dpft<}fy.4J^Mrtor& NíTpareil
90-
rsE—r 90-1
80
70
60-
50-
40
90-
:>ypMlni, Opadr^iMsQigr Nu-parall & Talc
• "^rrrf^
3000 2000
Wavenunrtbers (cm-1)
1000
Figure 4.14. FTIR spectra of dyphylline, talc and mixtures
147
mixture containing talc were overshadowed due to a huge talc valley at about 1000 cm"'
But still the prominent valleys of dyphylline were identifiable. This tells us that the
chemical integrity of the drug was either not changed or changed to an insignificant
extent.
Content Analvsis
The compatibility of the drug with the excipients can be supported by content
analysis. In all cases, above 95% of the original amount of the drug WQTQ found in the
mixtures. Also the powder mixtures look physically stable with no caking, liquefaction,
discoloration, gas or odor formation.
From all these studies it was assumed that dyphylline had very low
incompatibility with the excipients and can be used together to prepare drug loaded beads
for controlled release coating study with starch acetate.
Plackett-Burman Screening Design
Plackett-Burman factorial designs can identify factors which have the most
important main effects on the dependent variables. Since these designs offer very
economical means of screening a large number of factors, these are extremely useful in
preliminary studies where the objective is to identify formulation and processing
variables that can be included or eliminated in fiirther investigation (Plackett and
Burman, 1946). The mathematical model of such design would be:
Y = A, +A,X, +^2^2 + 4 ^ 3 +. . . + ^.-^„ (4.1)
148
v^here l'represents the response, AQ is a constant andArAn are the coefficients of the
factors. Based on the input data, the design calculates magnitudes and directions of the
main effects of the factors. A description of the dependent and independent variables
were given in Table 3.7. A seven-factor 12-run design employed and the responses
obtained are shown in Table 4.5, Drug release pattems for all runs are graphically shown
in Figures 4.15 and 4.16. The effects of factors on responses were studied using the
polynomial equations and contour plots. The reliability of the design was studied with
analysis of variance (ANOVA). Cumulative percent release of drug after 12 h (^5) was
given the primary importance among the responses in the present study.
Polynomial Equations
The main effects with their magnitude and direction on all the responses can be
obtained from the model for each factor. The higher the value, the stronger is the
relationship. Positive sign signifies synergistic relationship, whereas negative sign means
antagonist relation. Main effects can be calculated from Equation 4.2. In the equation,
m,=[Y,y('x,.'x„x,....'xJ-j;^y(\.\,\....\)\/2„ (4.2)
"xs are nominal values, referring to the lowest possible value and xs are the extreme
values, referring to the extreme tolerance range for the factor concemed. The 2„ indicates
the maximum possible assemblies, which is 6 in the present case.
The standard main effect values on Ys can be shown by the standardized Pareto
chart (Figure 4.17) and the directions by the main effect plot (Figure 4.18). The values
with their signs presented in Table 4.6 showed that X^ and Xe had positive main effects on
149
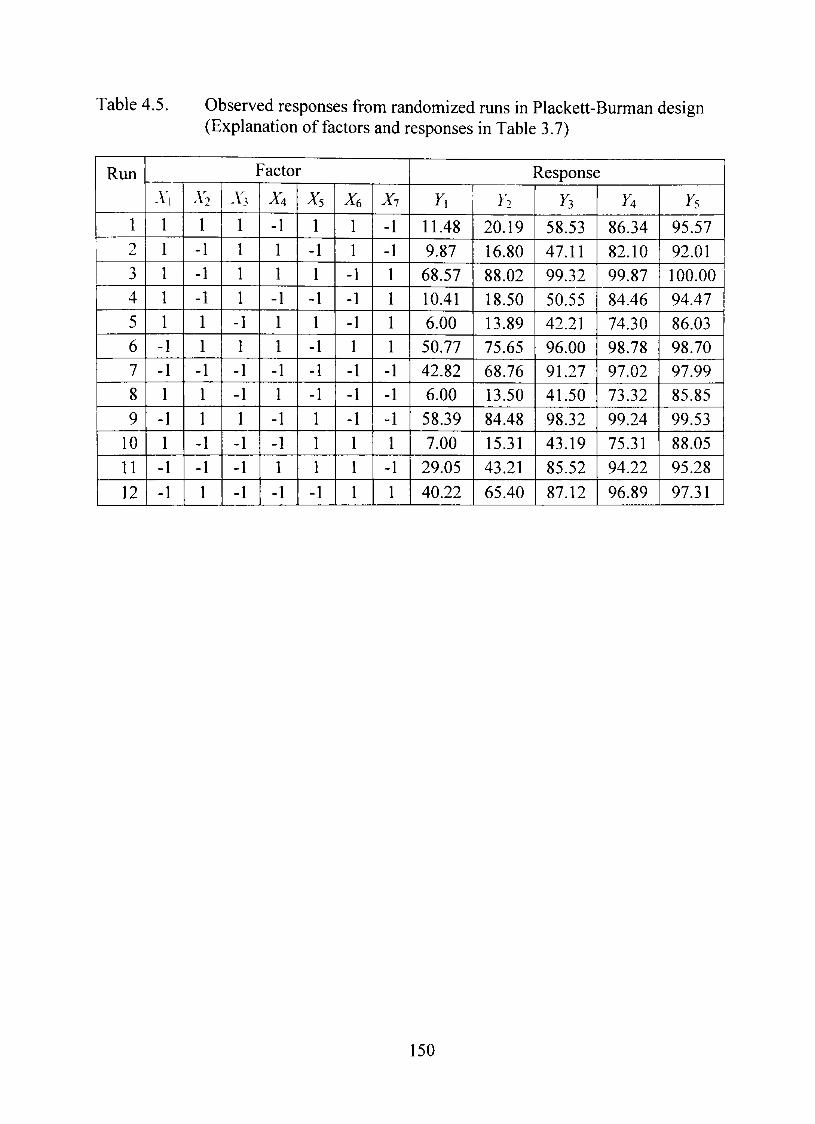
Table 4.5 Observed responses from randomized runs in Plackett-Burman design (Explanation of factors and responses in Table 3.7)
Run
1 9
3 4
5
6 7
8
9
10
11
12
Factor
-V,
-1
-1
-1
-1
A2
-1
-I -1
-1
-1
X3
-I
-1
-1
-1
-1
x, -1
1
1 -1
1 1 -1 1
-1
-1
1
-1
Xs
-1
-1
-1
-1
-1
X6
-1
-1 -1
-1
-1
Xi
-1
-1
-1
-1
-1
Response
Y\
11.48 9.87
68.57 10.41
6.00 50.77 42.82 6.00
58.39
7.00 29.05
40.22
Y2
20.19
16.80 88.02
18.50 13.89 75.65 68.76 13.50
84.48 15.31
43.21
65.40
Yi
58.53 47.11 99.32
50.55 42.21 96.00 91.27 41.50
98.32 43.19
85.52
87.12
n 86.34
82.10 99.87
84.46 74.30 98.78 97.02 73.32 99.24
75.31 94.22
96.89
F5
95.57
92.01 100.00 94.47
86.03 98.70 97.99 85.85
99.53 88.05 95.28
97.31
150
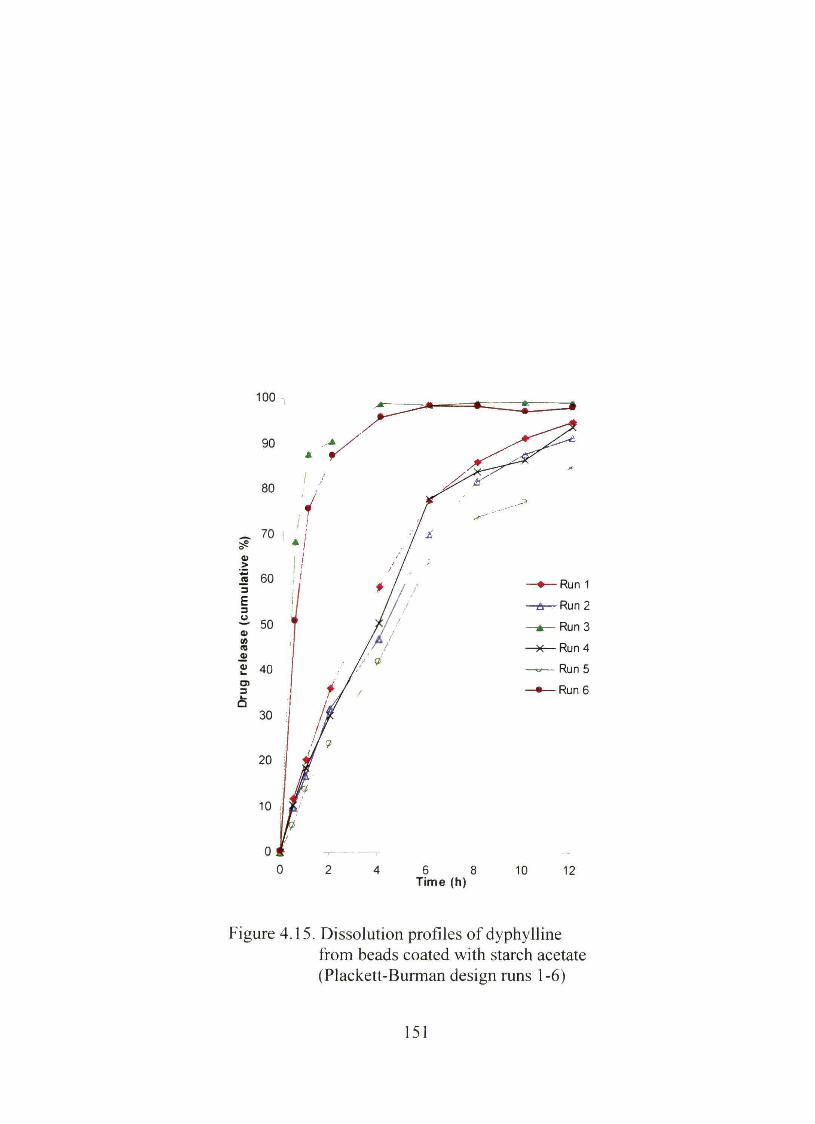
100 ^
6 Tíme (h)
10 12
Figure 4.15. Dissolution profiles of dyphylline from beads coated with starch acetate (Plackett-Burman design runs 1-6)
151
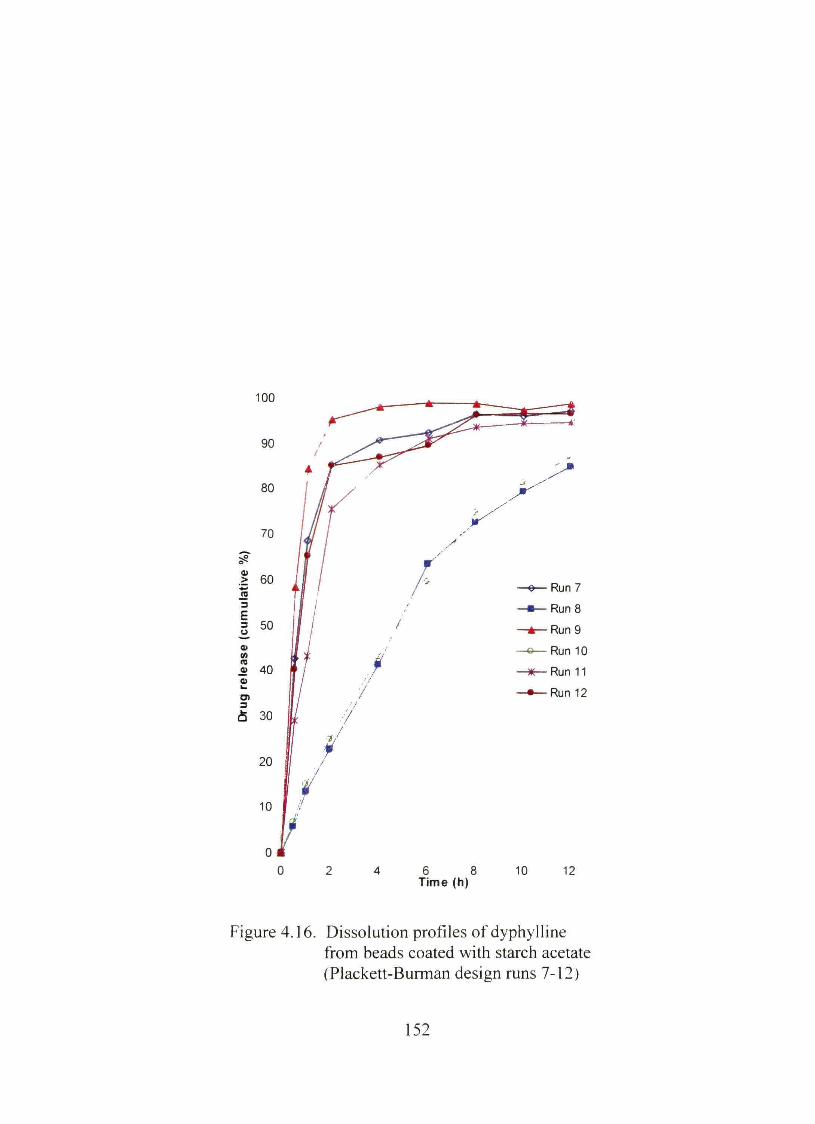
100
6 8 Time (h)
10 12
Figure 4.16. Dissolution profiles of dyphylline from beads coated with starch acetate (Plackett-Burman design runs 7-12)
152
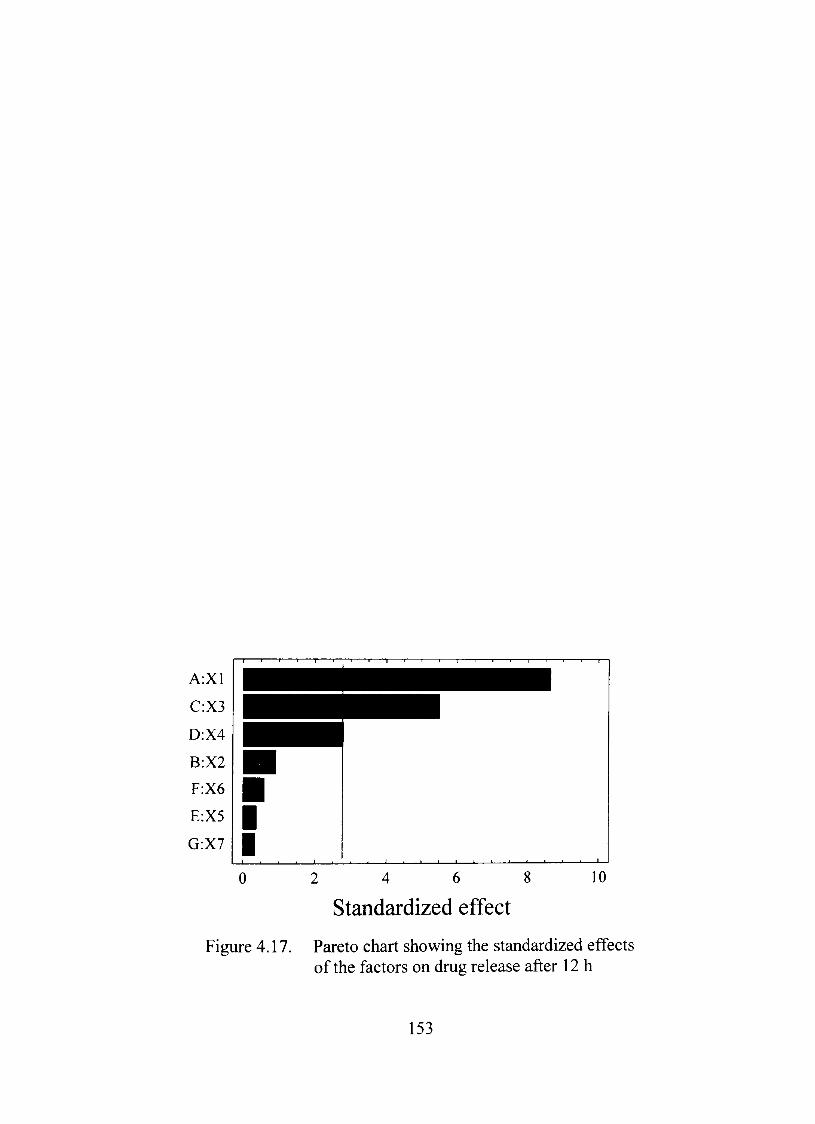
2 4 6 8
Standardized effect
Figure 4.17. Pareto chart showing the standardized effects of the factors on drug release after 12 h
153
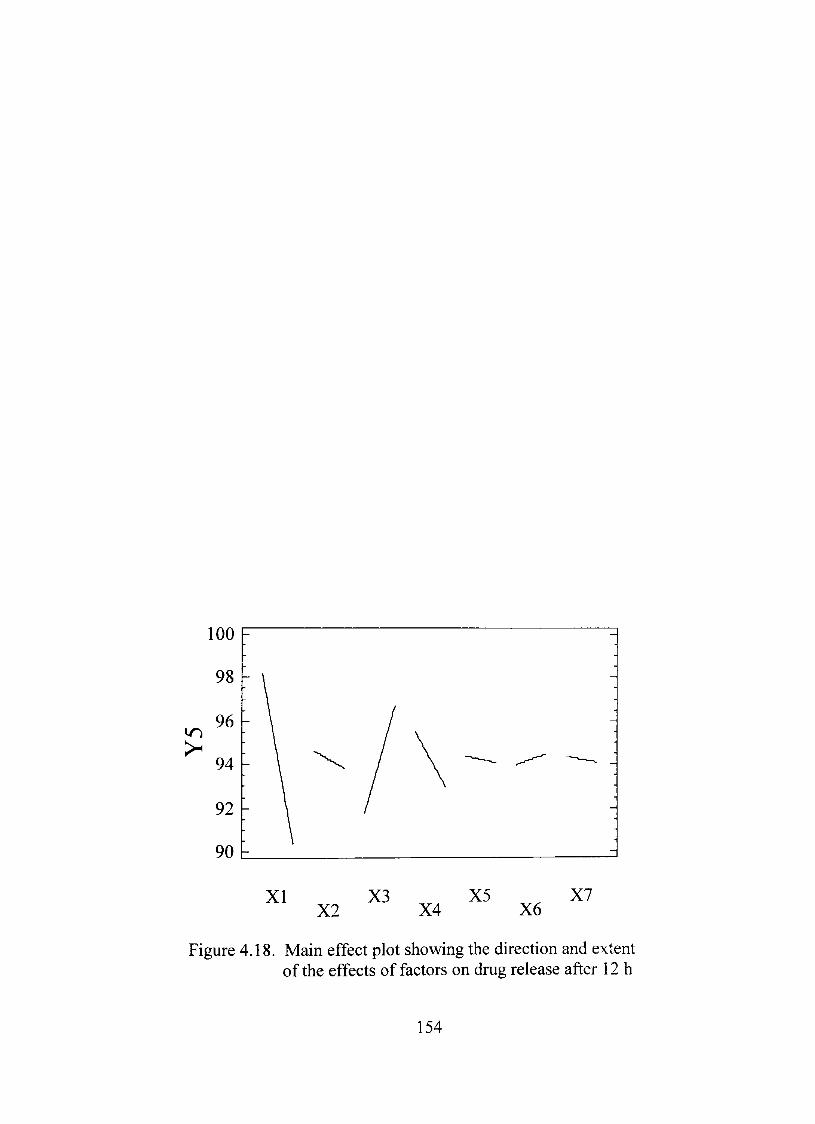
XI X3 ^ ^ X5 ^^ X7 X2 X4 X6
Figure 4.18. Main effect plot showing the direction and extent of the effects of factors on drug release after 12 h
154
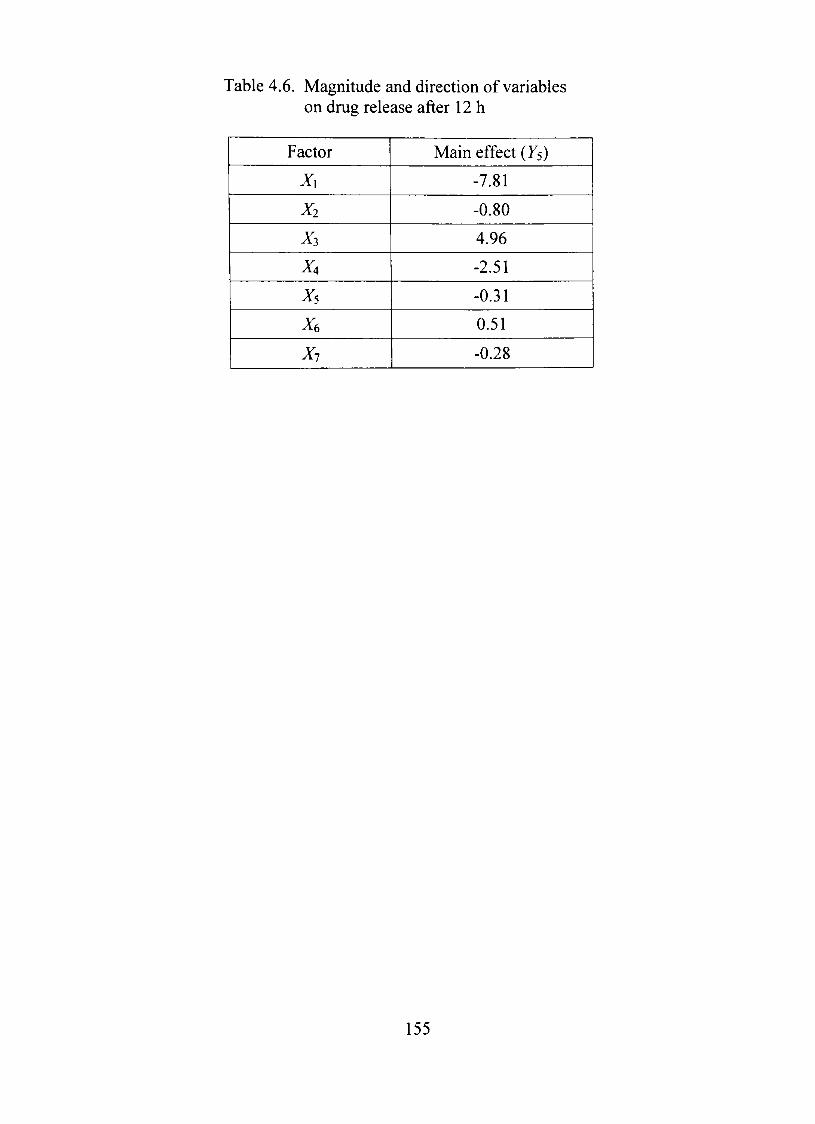
Table 4.6. Magnitude and direction of variables on drug release after 12 h
Factor
X\
X2
x^ X,
Xs
X(,
X,
Main effect ( 5)
-7.81
-0.80
4.96
-2.51
-0.31
0.51
-0.28
155
the response. X^ showed a strong directiy proportional relationship (p=0.005) with ) 5.
However, X\ had the strongest effect (/?=0.001) on the response. Other factors did not
show signifícant influence on ^5. However, factorXi was close (/?=0.05).
The dependence the responses on the factors can be better understood using
mathematical relationship in the form of polynomial equations. Factors with large
coefficient values have profound effects on the responses. As evident from Table 4.7,
factor .Vi has good impact on all the responses. Factor X3 also showed significant effects
on all of the responses. Among the others, X^ showed the most important effects on the
responses, in general.
ANOVA
The significance of the ratio of mean square variations as a resuh of regression
and residual error was tested using ANOVA (Table 4.8). It indicated a significant
(p<Q.05) effect of the factors on response Ys [Fcai (16.22) > Fcxix (6.09)]. The confidence
that the regression equation predicts the observed values better than the mean is above
99% and the model as fitted explained above 96% of the variability in ^5. The predicted
values for response Ys in Table 4.8 were obtained by substituting the factor levels in the
polynomial equation (Table 4.7). The small residual value further supports the reliability
of the used model.
156
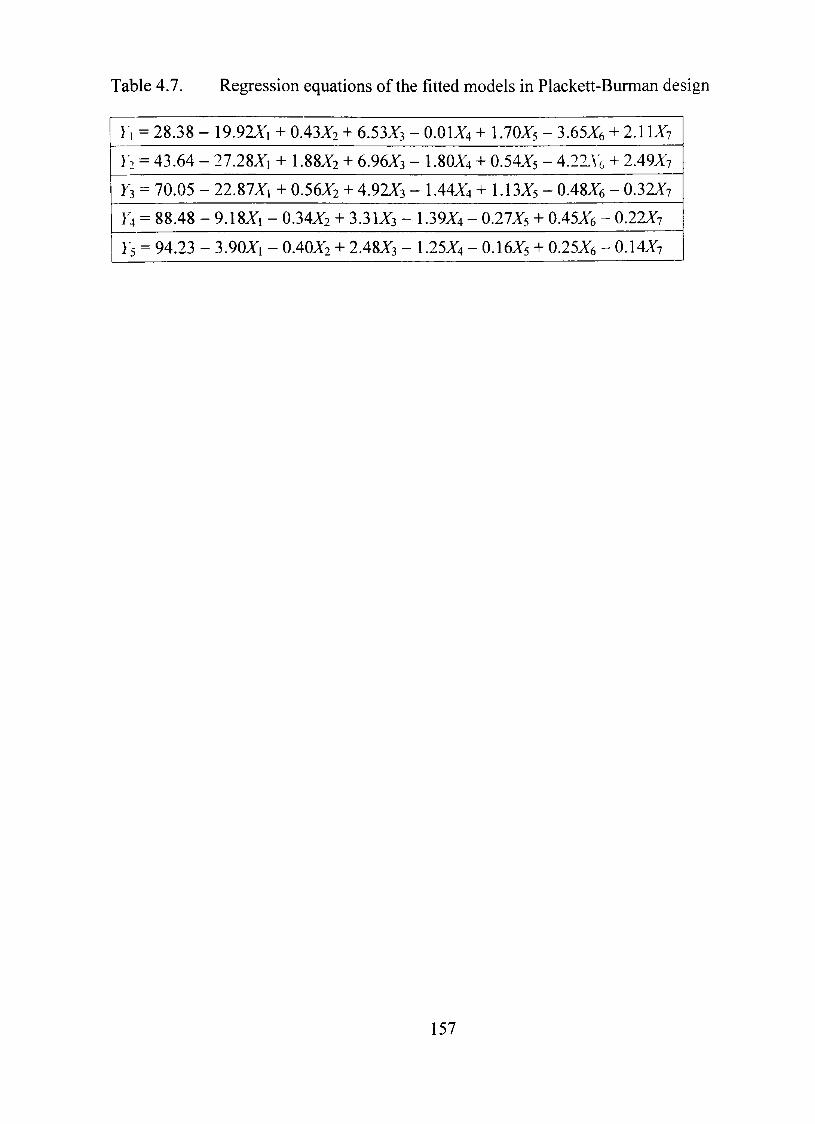
Table 4.7. Regression equations of the fitted models in Plackett-Burman design
}, =28.38-
}', = 43.64-
73 = 70.05 -
} 4 = 88.48 -
} 5 = 94.23 -
-19.92X1 + 0.43X2 + 6.53X3-
-27.28X,+ 1.88X2 + 6.96X3-
-22.87X1+0.56X2 + 4.92X3
-9.18X1-0.34X2 + 3.31X3-
- 3.90X1 - 0.40X2 + 2.48X3 -
- 0.01X4 + 1.70X5 - 3.65X6 + 2.11X7
- I.8OX4 + 0.54X5 - 4.21V6 + 2.49X7
- 1.44X4 + 1.13X5 - 0.48X6 - 0.32X7
1.39X4 - 0.27X5 + 0.45X6 - 0.22X7
1.25X4 - 0.16X5 + 0.25X6 - 0.14X7
157
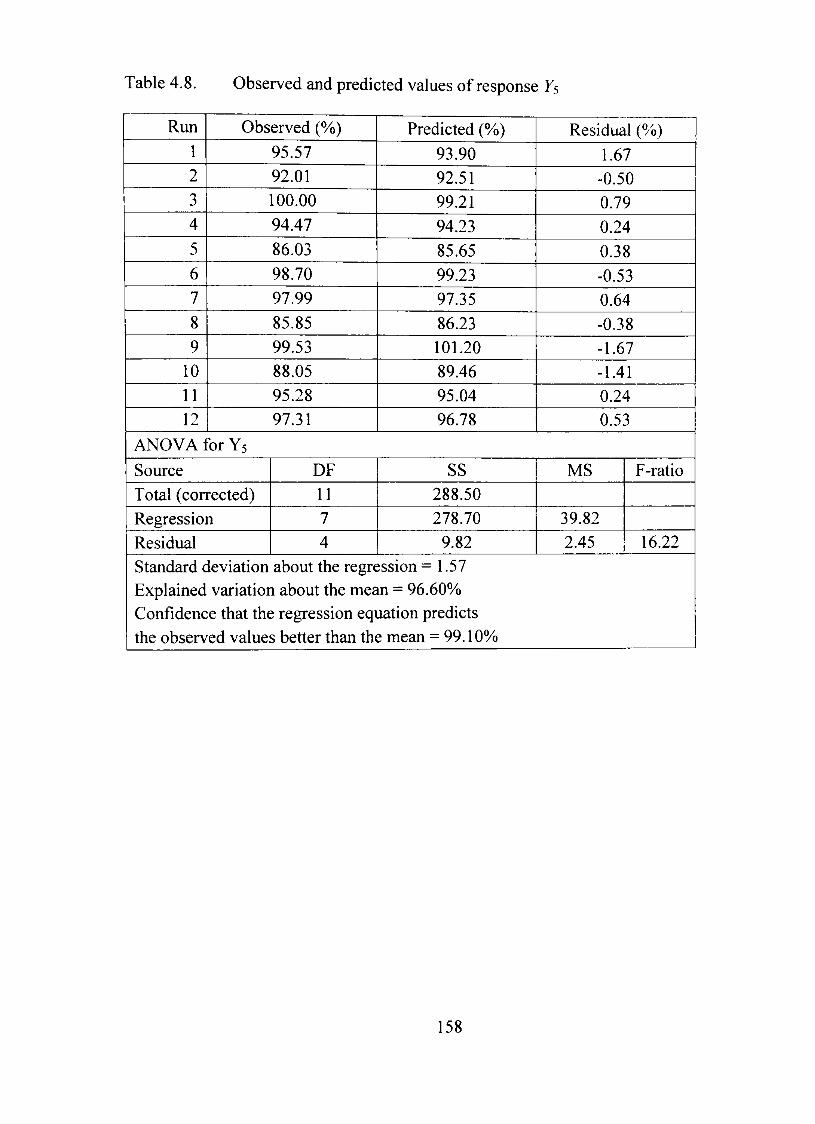
Table 4.8. Observed and predicted values of response Yt
Run
1
2
3
4
5
6
7
8
9
10 11 12
Observed (%)
95.57 92.01
100.00
94.47
86.03
98.70 97.99
85.85
99.53 88.05
95.28 97.31
Predicted (%)
93.90 92.51 99.21
94.23
85.65
99.23
97.35
86.23 101.20 89.46 95.04 96.78
Residual (%)
1.67 -0.50 0.79
0.24
0.38
-0.53 0.64
-0.38 -1.67 -1.41 0.24 0.53
ANOVA for Y5
Source
Total (corrected) Regression
Residual
DF
11 7 4
SS 288.50 278.70
9.82
MS
39.82
2.45
F-ratio
16.22
Standard deviation about the regression = 1.57 Explained variation about the mean = 96.60% Confidence that the regression equation predicts the observed values better than the mean = 99.10%
158
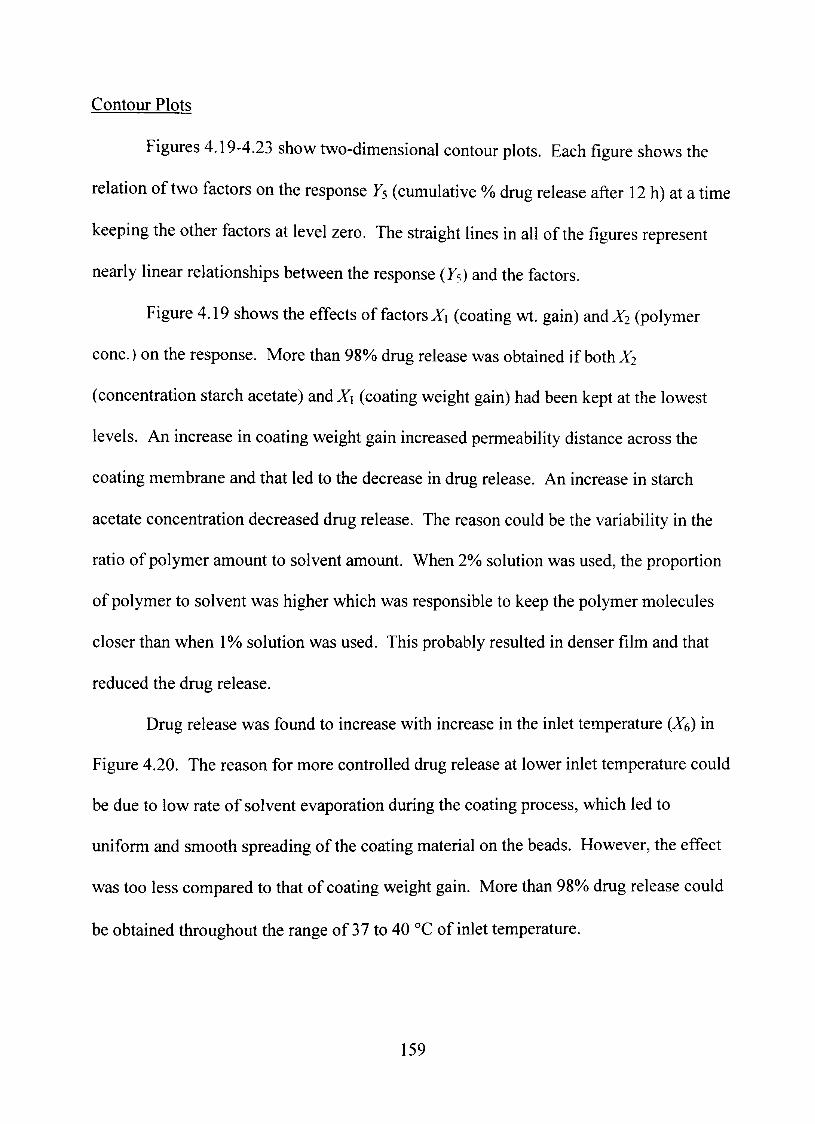
Contour Plots
Figures 4.19-4.23 show two-dimensional contour plots. Each figure shows the
relation of two factors on the response Ys (cumulative % drug release after 12 h) at a time
keeping the other factors at level zero. The straight lines in all of the figures represent
nearly linear relationships between the response (7?) and the factors.
Figure 4.19 shows the effects of factors JTi (coating wt. gain) andX^ (polymer
conc.) on the response. More than 98% drug release was obtained if bothJ^
(concentration starch acetate) and Xi (coating weight gain) had been kept at the lowest
levels. An increase in coating weight gain increased permeability distance across the
coating membrane and that led to the decrease in drug release. An increase in starch
acetate concentration decreased drug release. The reason could be the variability in the
ratio of polymer amount to solvent amount. When 2% solution was used, the proportion
of polymer to solvent was higher which was responsible to keep the polymer molecules
closer than when 1% solution was used. This probably resulted in denser film and that
reduced the drug release.
Drug release was found to increase with increase in the inlet temperature (X^) in
Figure 4.20. The reason for more controlled drug release at lower inlet temperature could
be due to low rate of solvent evaporation during the coating process, which led to
uniform and smooth spreading of the coating material on the beads, However, the effect
was too less compared to that of coating weight gain. More than 98% drug release could
be obtained throughout the range of 37 to 40 °C of inlet temperature.
159
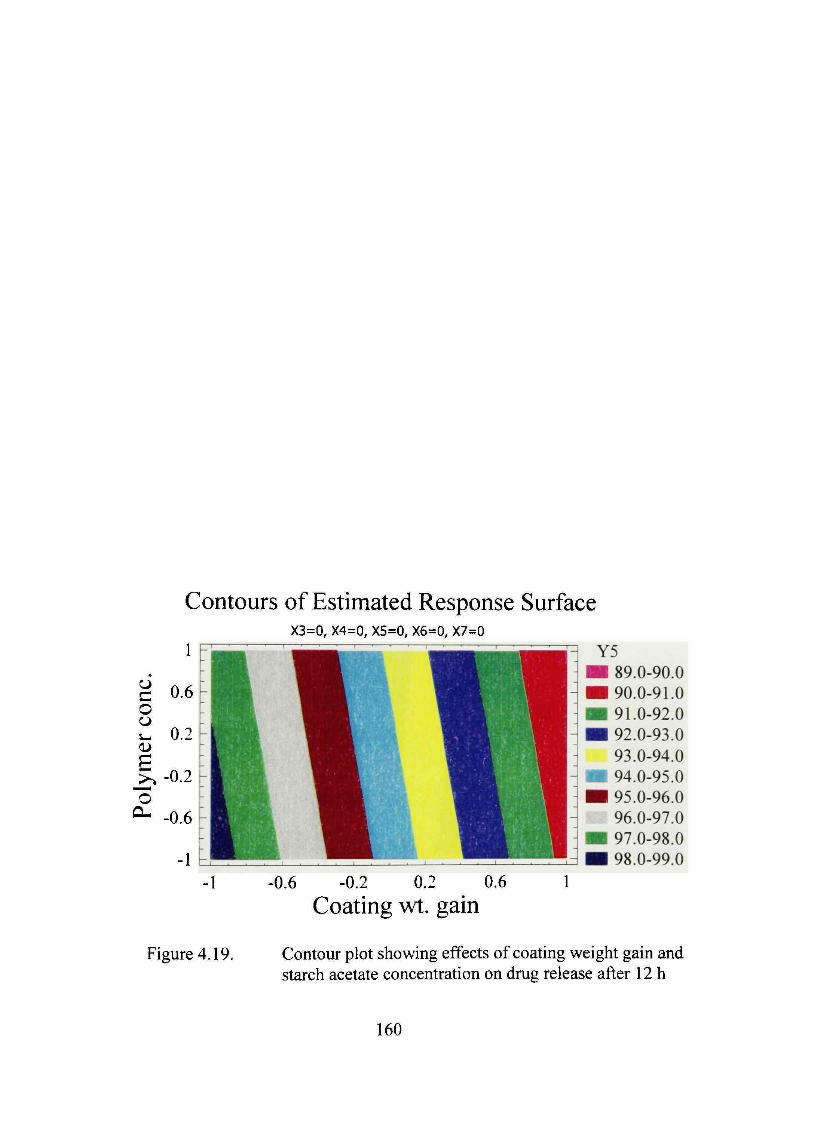
Contours of Estimated Response Surface
o
o o
>.-0.2
-0.6
X3=0, X4=0, X5=0, X6=0, X7=0
-0.6 •0.2 0.2 0.6
Coating wt. gain
^ Y5 89.0-90.0 90.0-91.0 91.0-92.0 92.0-93.0 93.0-94.0 94.0-95.0 95.0-96.0 96.0-97.0 97.0-98.0 98.0-99.0
Figure 4.19. Contour plot showing effects of coating weight gain and starch acetate concentration on drug release after 12 h
160
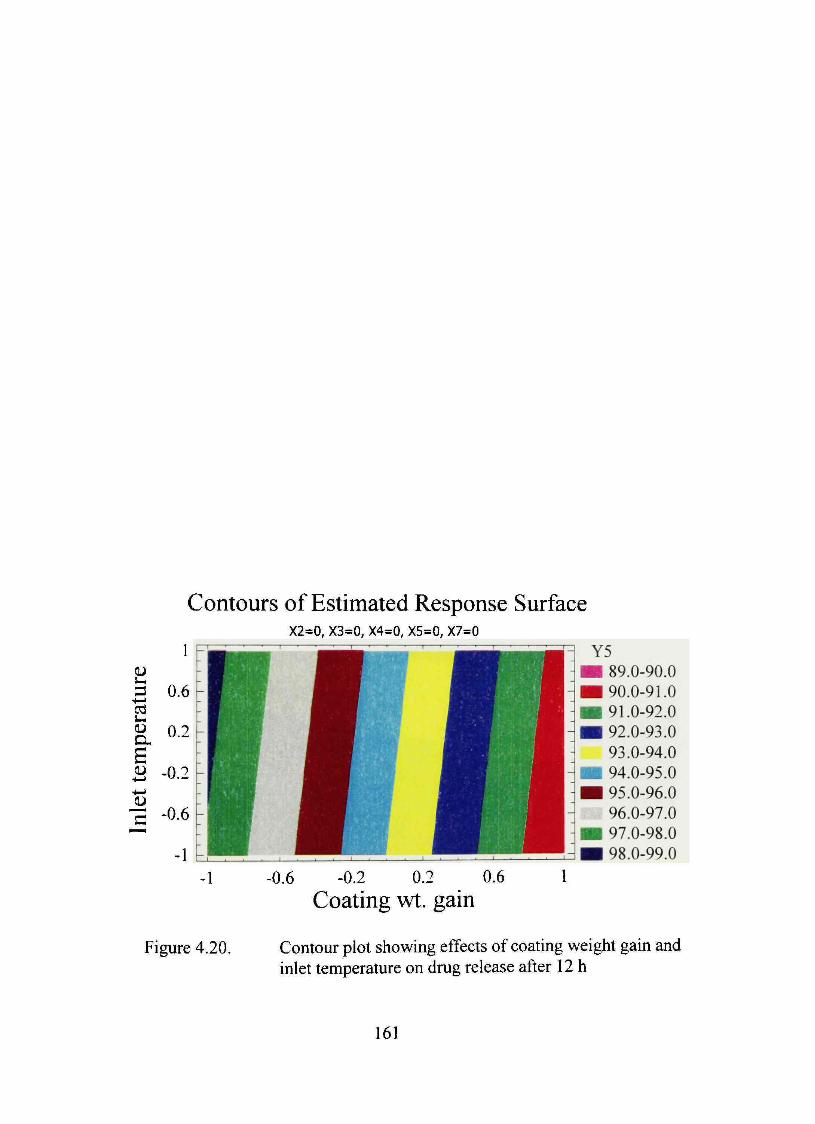
Contours of Estimated Response Surface
cd
cx
1
0.6
0.2
0.2
0.6
-1
X2=0, X3=0, X4=0, X5=0, X7=0 ; _ 1 ^ ^ ^ ^ ^ ^ ^ , , . , , 1 ' • • 1 _
^^m ^ ^ ^ ^ ^ ^ 1 ~ i~H ^^^^Ê |^^H^^^?1^H~
m ^^M ^ÊÊ fl^ ^ ^ V ^ÊÊÊ ^ l ~
- _ ^^H ^^H ^ l ' I H Í ^^V ^^Ê M^Ê'
- ^^B ^^H ^ | H j^Ê'' '~^^m ^^m ^^m ^ l ~ ' ^^m ^^íé^m ^^K' ^ l ~
Y5 • 89.0-90.0 • 90.0-91.0 •191.0-92.0 • 1 92.0-93.0
93.0-94.0 m 94.0-95.0 • 1 95.0-96.0
96.0-97.0 • i 97.0-98.0 • 98.0-99.0
Figure 4.20.
0.6 -0.2 0.2 0.6 1
Coating wt. gain
Contour plot showing effects of coating weight gain and inlet temperature on drug release after 12 h
61
S-H
•4—»
(U
cx
•4—»
ÛX)
=3 u
Contours of Estimated Response Surface X1=0, X3=0, X5=0, X6=0, X7=0
Y5 91.0-92.0 92.0-93.0 93.0-94.0 94.0-95.0 95.0-96.0
-1 -0.6 -0.2 0.2 0.6 1
Polymer conc.
Figure 4.21. Contour plot showing effects of starch acetate concentration and curing temperature on drug release after 12 h
162
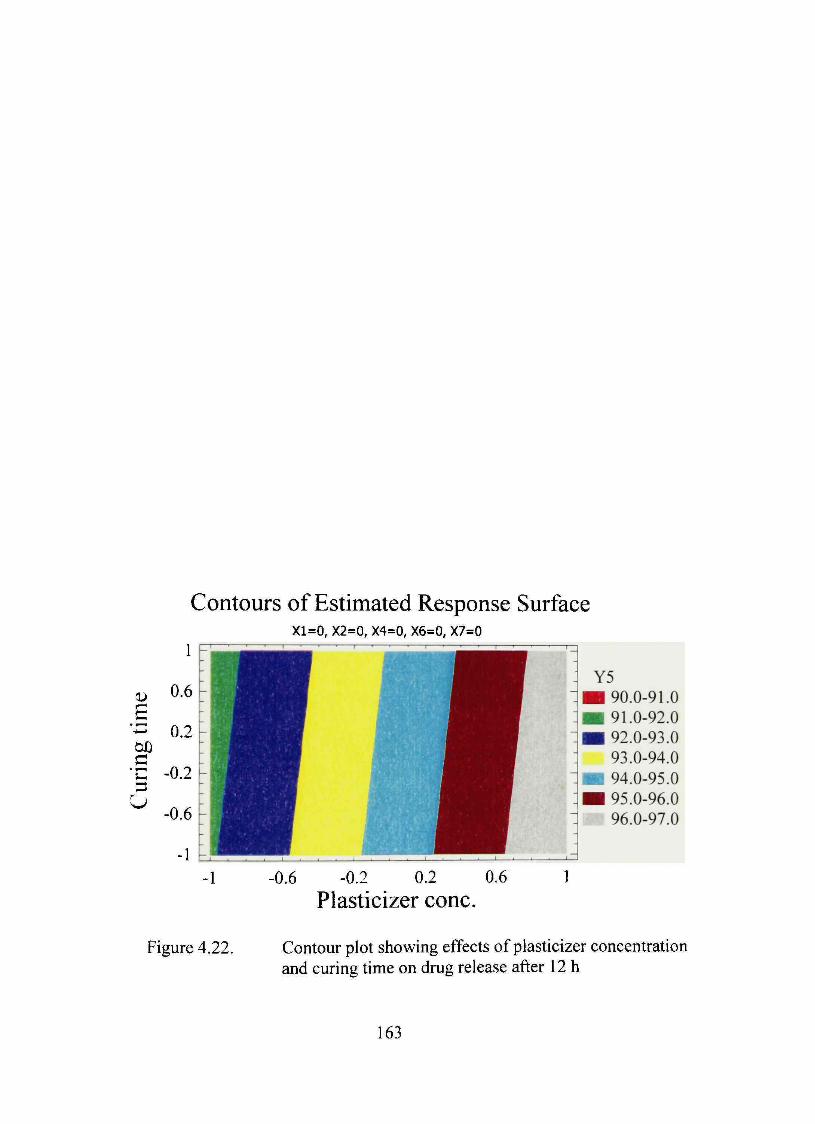
Contours of Estimated Response Surface X1=0, X2=0, X4=0, X6=0, X7=0
•0.6 -0.2 0.2 0.6
Plasticizer conc.
Y5 90.0-91.0 91.0-92.0 92.0-93.0 93.0-94.0 94.0-95.0 95.0-96.0 96.0-97.0
Figure 4.22. Contour plot showing effects of plasticizer concentration and curing time on drug release after 12 h
163
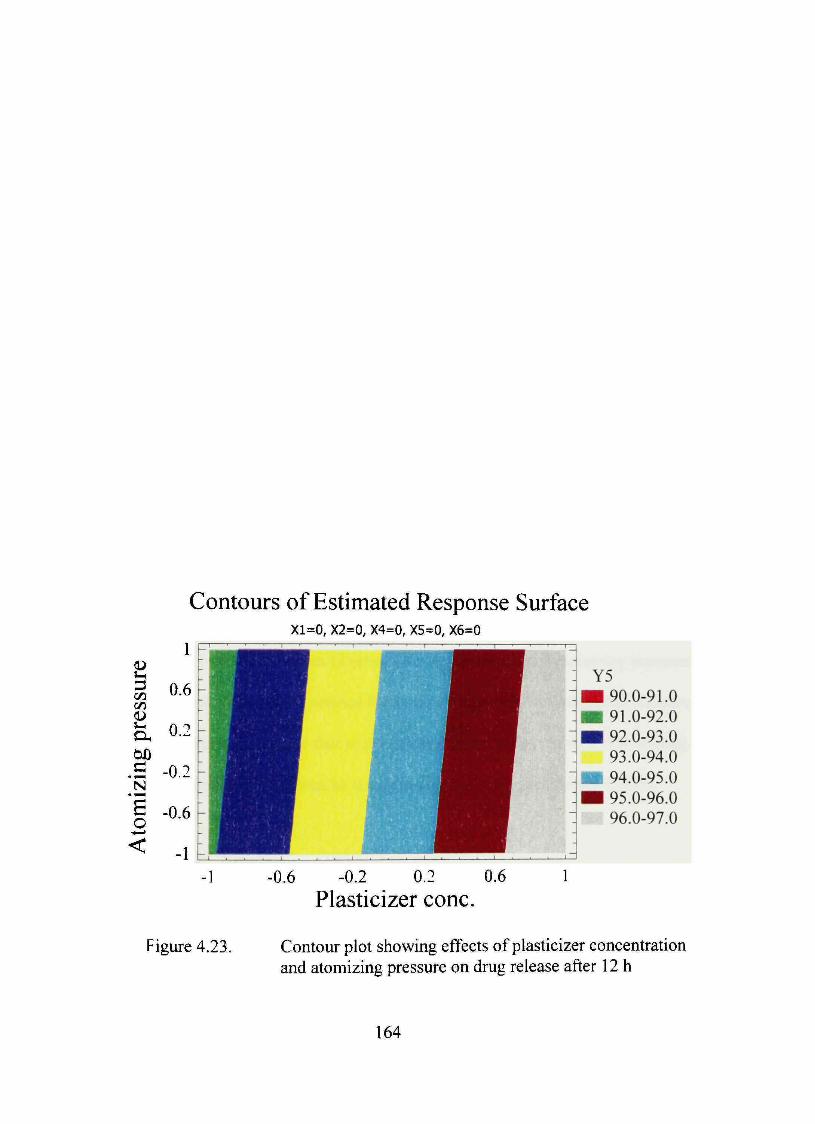
Contours of Estimated Response Surface X1=0, X2=0, X4=0, X5=0, X6=0
Y5 90.0-91.0 91.0-92.0 92.0-93.0 93.0-94.0 94.0-95.0 95.0-96.0 96.0-97.0
-1 -0.6 -0.2 0.2 0.6 1
Plasticizer conc.
Figure 4.23. Contour plot showing effects of plasticizer concentration and atomizing pressure on drug release after 12 h
164
h is evident from Figure 4.21 thatXi (curing temperature) have negative effect on
drug release. Curing of polymeric film accelerates the rate of coalescence of polymer
particles to form a homogeneous fílm. Increased temperature facilitated coalescence.
The effect of curing on drug release depends upon physicochemical properties of the drug
and polymer coatings (Bodmeier et al., 1997).
Figure 4.22 shows thatX^ (concentration of plasticizer) had profound effect on
drug release. The primary reason of adding plasticizer to a polymer system is to reduce
the glass transhion temperature. However, plasticizer also increases the free volume in
the film. Increase in free volume increased drug release across the membrane as were
shown in literature (Sastry et al., 1998; Sinko and Amidon, 1989). It was not surprising
that triacetin would facilitate drug release through the open channels it created in
dissolution media since it has considerable water solubility. Curing time (Xs) showed
inverse relation with drug release. The main reason as discussed in the previous
paragraph was the positive effect of curing time of proper coalescence of the film.
Figure 4.23 shows the effect of plasticizer concentration and atomizing pressure
(A'7) on drug release. The almost vertical lines made it apparent that atomizing pressure
had negligible effect compared to that of plasticizer concentration. About 97% of drug
release would be obtained if plasticizer concentration had been maintained at 60%.
Selection of Important Factors
Plackett-Burman screening design revealed that all the factors used had effects on
dyphylline release at all time points (0.5 to 12 h), However, coating weight gain and
165
triacetin concentration showed statistically significant effect on drug release after 12 h.
Curing temperature also showed prominent effect. These three factors had also affected
drug release at other time points to a great extent. Other factors, in general, affected drug
release less significantly. Since the model as fitted explained more than 96% of the
variability in drug release after 12 h, h can be concluded that the factors, coating weight
gain, plasticizer concentration and curing temperature can be used in optimization
process to obtain starch acetate coated dyphylline multi-particulate beads with desired
drug-release properties.
Response Surface Methodology
In preliminary studies we identified the three most important factors affecting
dyphylline release from a multi-particulate drug delivery system coated with starch
acetate. Those were coating weight gain, plasticizer concentration and curing
temperature. The other factors, such as starch acetate concentration, inlet temperature,
atomizing pressure and curing time were kept constant throughout the RSM. A three
factor, three level Box-Behnken design was used for the optimization process using
Statgraphics® Plus. A description of the dependent and independent variables were given
in Table 3.8. The models were evaluated using statistically significant coefficients,
standardized main effects (SME) and R^ values.
166
Experimental Designs and the Fitted Models
A three-factor three-Ievel Box-Behnken design as the RSM requires 15
experiments. The independent variables of the 15 experimental runs and their responses
are given in Table 4.9. Nine batches showed at least 90% drug release at 12 h (7?) and
the range of Ys for all batches was 74.66-99.5%. The complete dissolution profiles are
presented in Figures 4.24 to 4.26. The fitted models can be viewed as regression
equations as in Table 4.10, generated by the software. Only statistically significant
coefficients are included in the equations. It is clear from the equations that coating
weight gain (X\) and curing temperature (X3) has negative effects on the responses, Y\-Ys.
whereas, the plasticizer concentration (Xj) has positive effects. Increasing coating weight
gain increased the physical barrier between the drug in the beads and the dissolution
medium and that produced the slow rate of drug release. During the coating process, the
inlet temperature of the coating chamber evaporates the bulk of the solvent and thus
polymer accumulates on the substrates (beads). However, film formation is completed
only after curing of the products. Curing helps gradual coalescence of the polymers on
the substrate, which leads to smooth and homogeneous film (Bodmeier et al., 1997).
Higher temperature helps the curing process of the film and slowed drug release rate.
Plasticizers increase free volume in polymeric film, which positively affects drug release
(Sastry et al,, 1998; Sinko and Amidon, 1989). Besides, the good water solubility of
triacetin also facilitated the release of a water soluble drug dyphylline. Coefficients with
higher order terms or more than one factor term in the regression equations represent
quadratic relationships or interaction terms, respectively. The equations also show
167
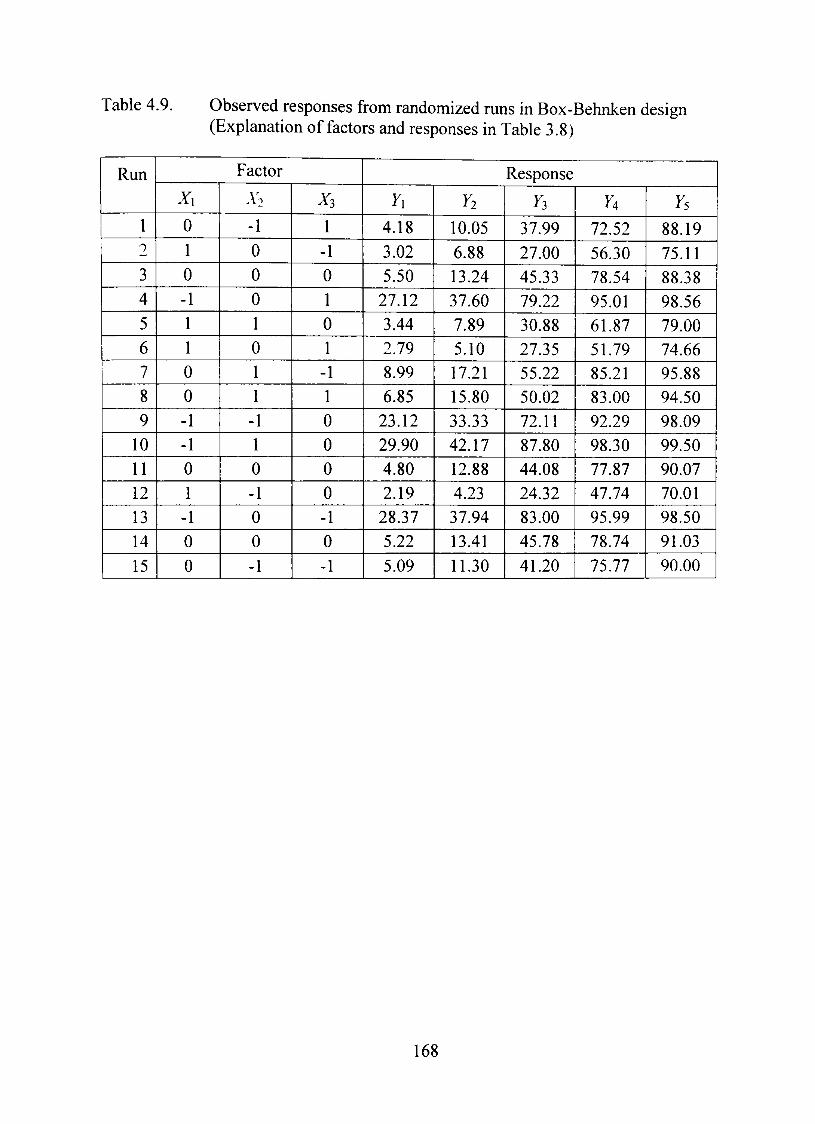
Table 4.9. Observed responses from randomized runs in Box-Behnken design (Explanation of factors and responses in Table 3.8)
Run
1 2
3
4
5
6 7
8
9
10 11
12
13 14
15
X\
0
1
0
-1
1
1
0
0
-1 -1
0
1 -1
0
0
Factor
A'2
-1
0
0
0
1
0 1 1
-1 1
0
-1 0
0
-1
-^3
1
-1
0
1
0 1
-1 1
0
0 0
0 -1
0
-1
Y\
4.18
3.02
5.50 27.12 3.44
2.79 8.99
6.85 23.12
29.90 4.80
2.19 28.37 5.22
5.09
Y2
10.05
6.88 13.24
37.60 7.89 5.10 17.21 15.80
33.33 42.17 12.88
4.23 37.94
13.41
11.30
Response
^3
37.99
27.00
45.33 79.22
30.88 27.35 55.22 50.02
72.11 87.80
44.08 24.32 83.00 45.78
41.20
n
72.52
56.30 78.54
95.01 61.87 51.79 85.21 83.00 92.29
98.30 77.87 47.74 95.99 78.74
75.77
Ys
88.19
75.11
88.38 98.56 79.00 74.66 95.88 94.50 98.09 99.50 90.07 70.01 98.50 91.03
90.00
168
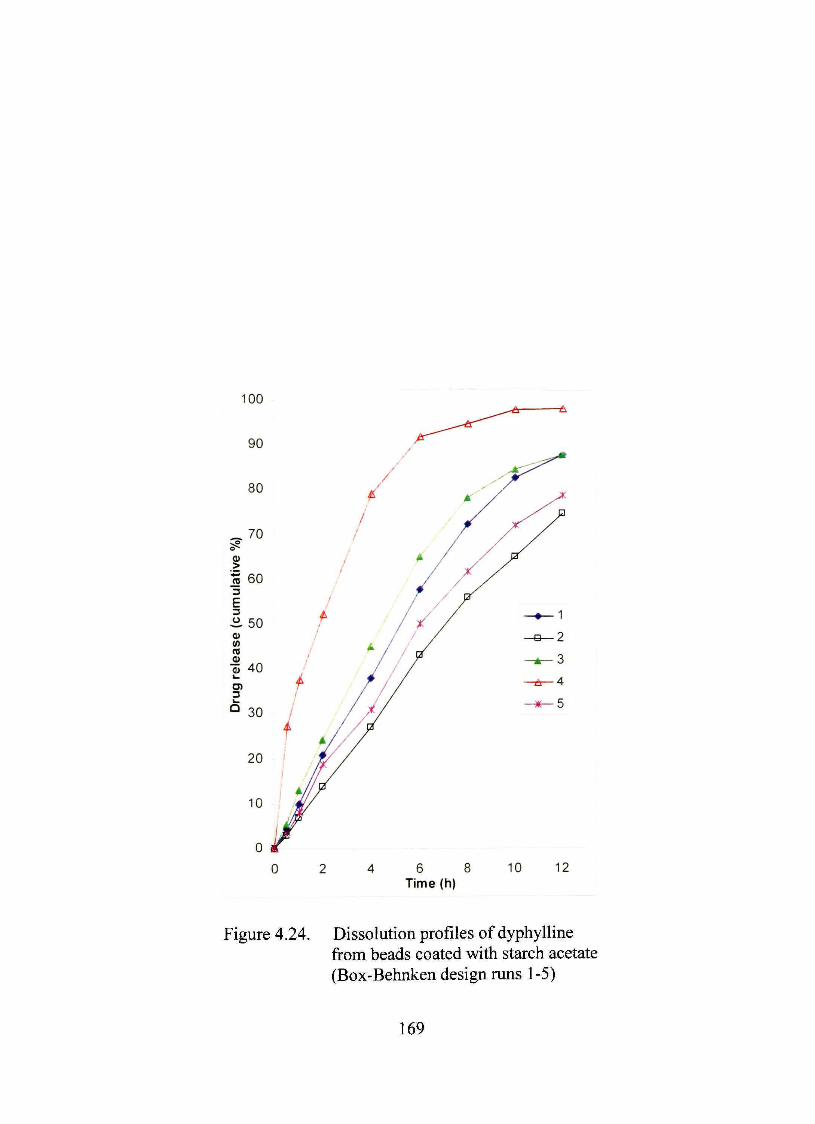
100
10 12
Figure 4,24. Dissolution profiles of dyphylline from beads coated with starch acetate (Box-Behnken design runs 1-5)
169
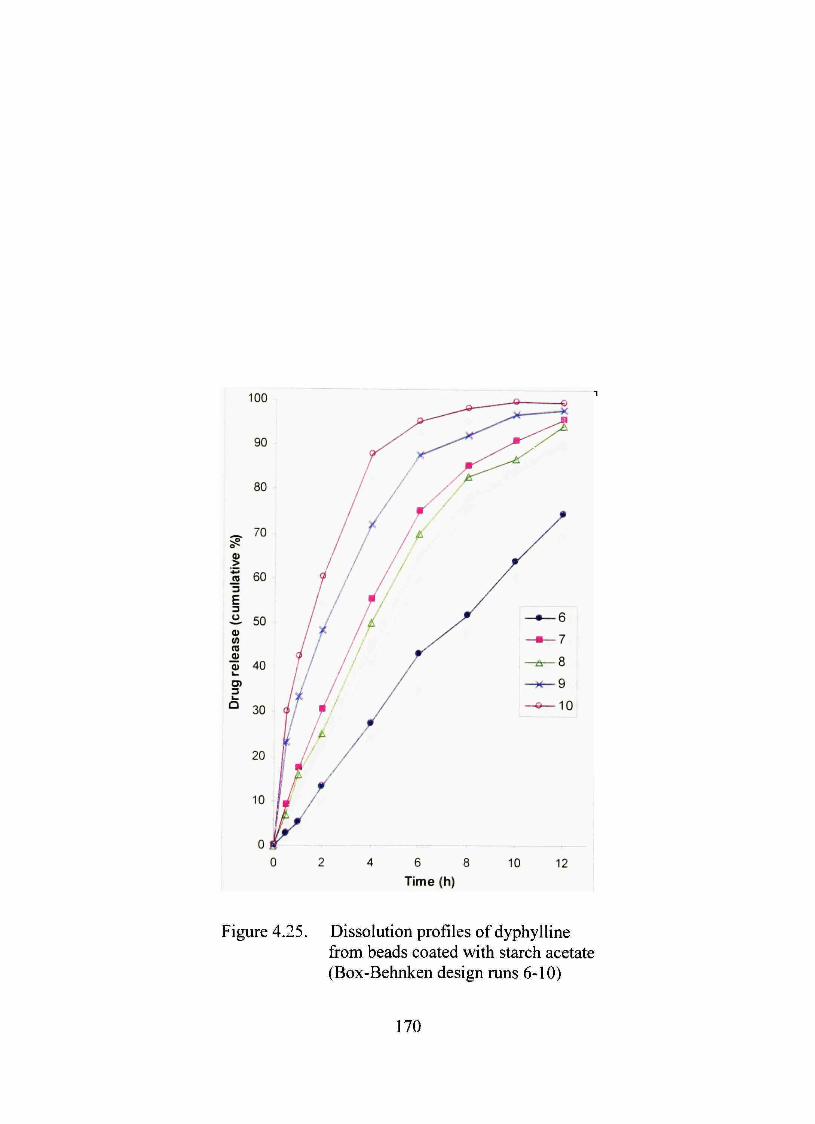
Figure 4.25. Dissolution profiles of dyphylline from beads coated with starch acetate (Box-Behnken design runs 6-10)
170
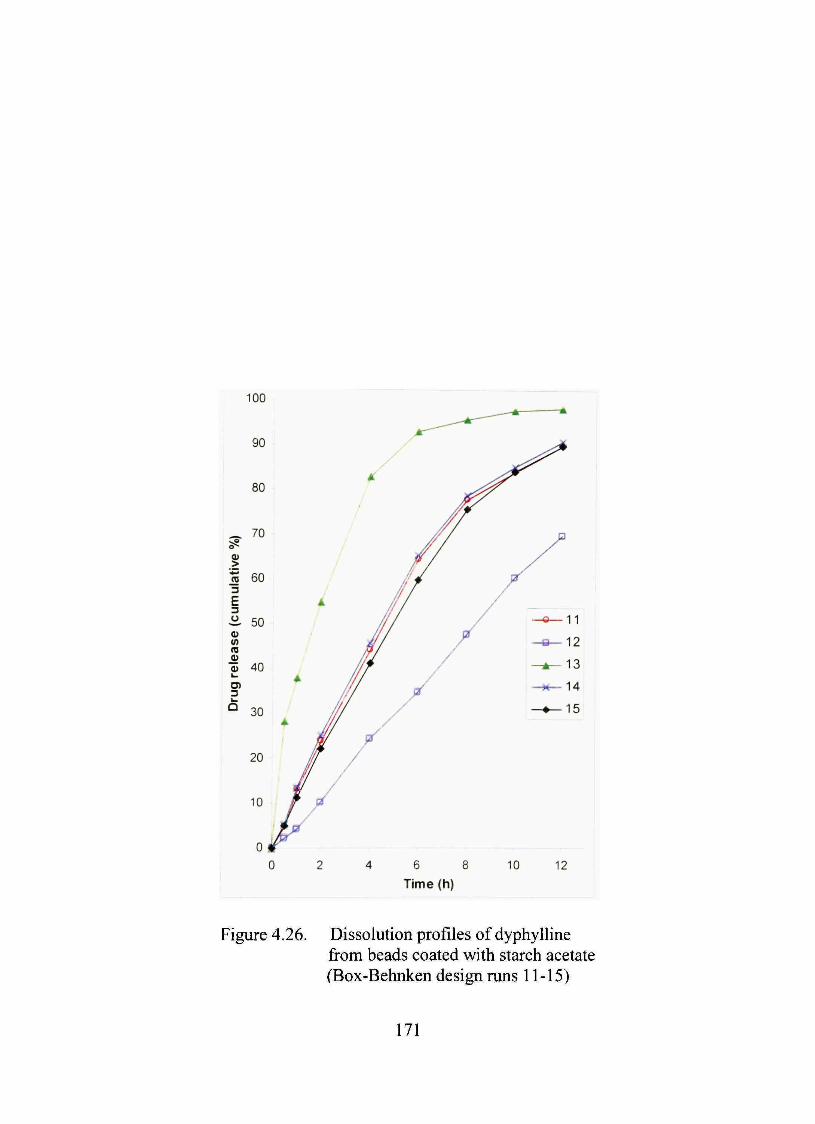
100
6 8
Time (h) 10 12
Figure 4.26. Dissolution profiles of dyphylline from beads coated with starch acetate (Box-Behnken design runs 11-15)
171
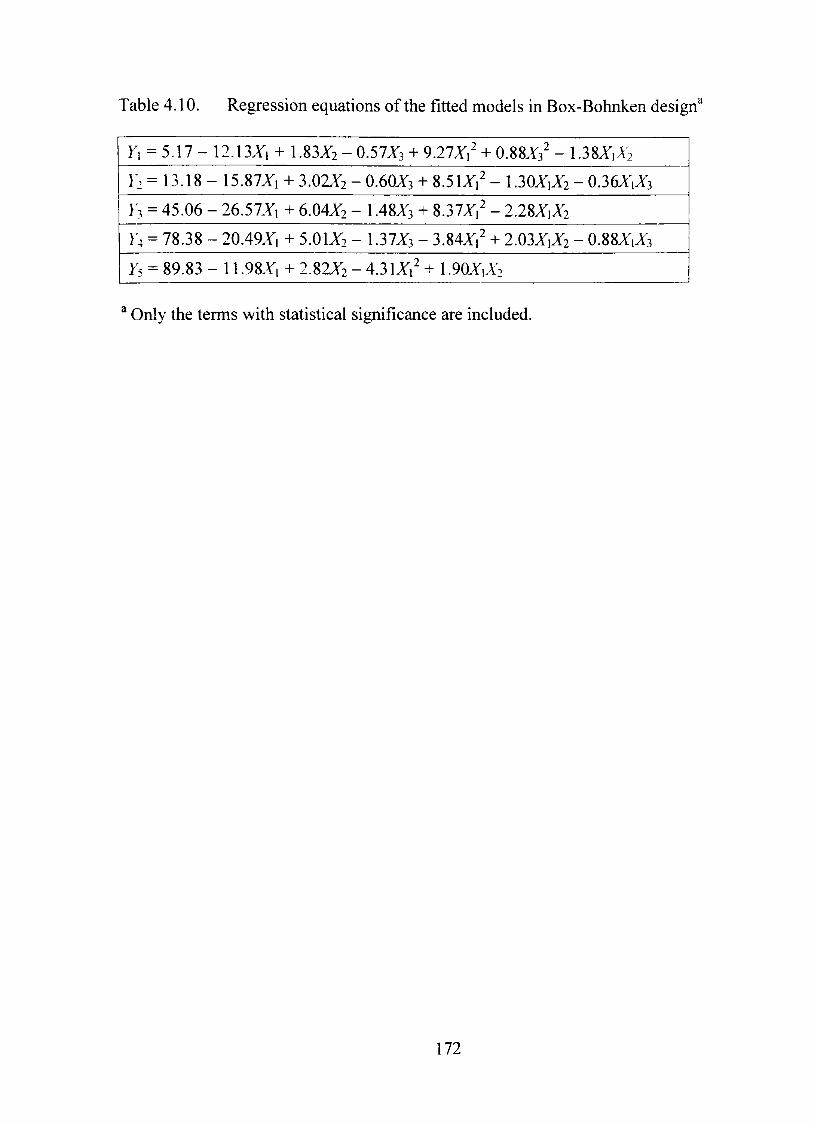
Table 4.10. Regression equations of the fitted models in Box-Bohnken design''
Y\ = 5.17-12.13Xi + 1.83X2 - 0.57^3 + 9.27Xi^ + 0.88X3^ - 1.38X|A;
}'2 = 13.18 - 15.87^1 + 3.OZY2 - O.6OA3 + 8.51X1^ - 1.30X1X2 - 0.36X1X3
13 = 45.06 - 26.57Xi + 6.O4X2 - 1.48X3 + 8.37Xr - 2.28X,X2
}4 = 78.38 - 20.49X| + 5.0IX2 - 1.37X3 - 3.84Xr + 2.O3X1X2 - O.88X1X3
Yi = 89.83 - 11.98Xi + 2.82X2 - 4.3 IXi^ + 1.90X,X:
Only the terms with statistical significance are included.
72
interaction effect of factors Xj andX^ on Y\ through Ys. X\ also showed quadratic effect
on all the responses. This could be due to its (X\) much higher effects compared to the
other two factors on the responses. The interaction terms will be explained further with
the help of contour and response surface plots.
Standardized Main Effects (SME) and Reliabilitv of the Models
SME, presented in Table 4.11 were calculated by dividing the main effects with
the standard error of the main effects. Only statistically significant (p<0.05) values are
given. The larger SME of Jíi suggests the paramount importance of coating weight gain
on drug release. R value signifíes the percentage of variability in responses that are
explained by the models. In the present study, the high R values (>99%) represented
reliability of the design. Besides, the/?-value for lack of fit for all models in Table 4.11
are greater than 0.05, suggesting absence of any lack of fít of the models and that also
strengthened the reliability of the models.
Contour and Response Plots
Two-dimensional contour plots and three dimensional response surface plots as
presented in Figures 4.27 through 4.32 are very useftil to see interaction effects of the
factors on the responses. These type of plots show effects of two factors on the response
at a time. In all the presented figures the third factor was kept at level zero. The almost
straight lines in the Figures 4.27 and 4.28 predicted neariy linear relationship of factor JTi
with factors Xj andX^. As for example, more than 97% of drug release after 12 h was
173
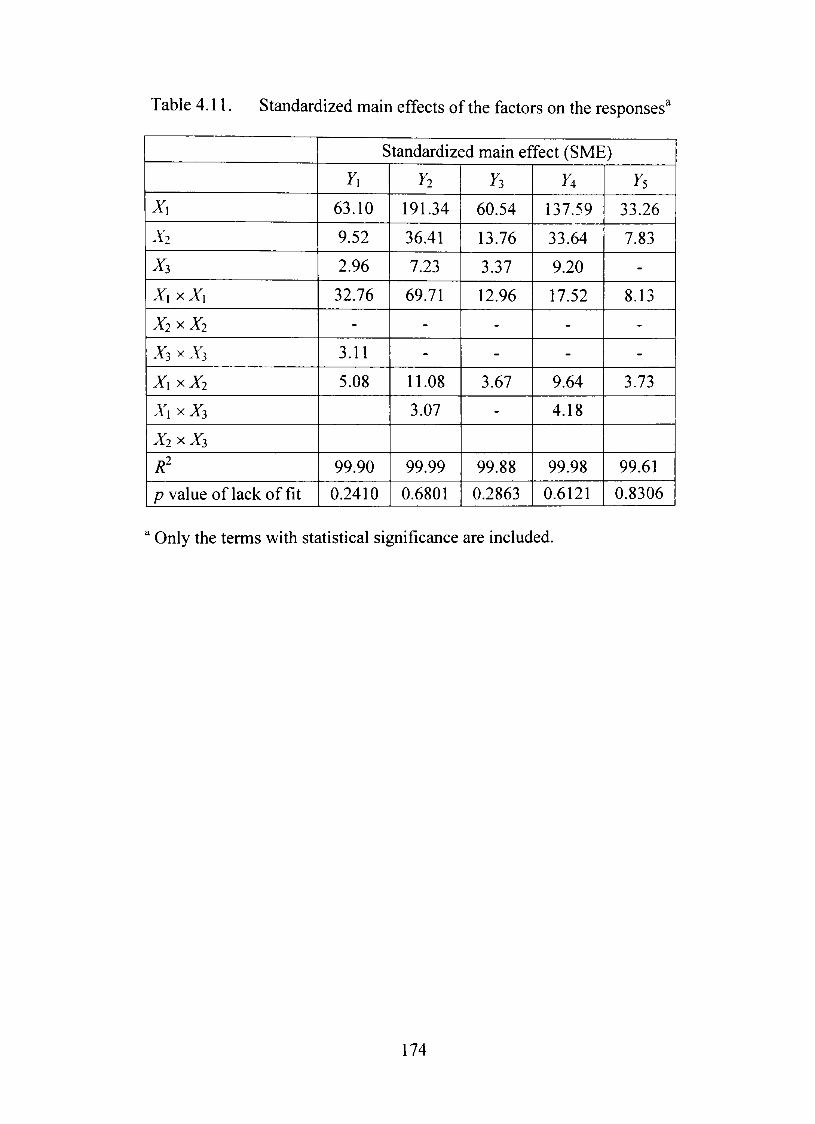
Table 4.11. Standardized main effects of the factors on the responses^
X\
X2
X3
X, X x .
X2 X X2
X3 X X3
X, xXz
Xi X X3
X2XX3
R^
p value of lack of fit
Standardized main effect (SME)
Y\
63.10
9.52
2.96
32.76
-
3.11
5.08
99.90
0.2410
Y2
191.34
36.41
7.23
69.71
-
-
11.08
3.07
99.99
0.6801
Yi
60.54
13.76
3.37
12.96
-
-
3.67
-
99.88
0.2863
n 137.59
33.64
9.20
17.52
-
-
9.64
4.18
99.98
0.6121
Ys
33.26
7.83
-
8.13
-
-
3.73
99.61
0.8306
" Only the terms with statistical significance are included.
74
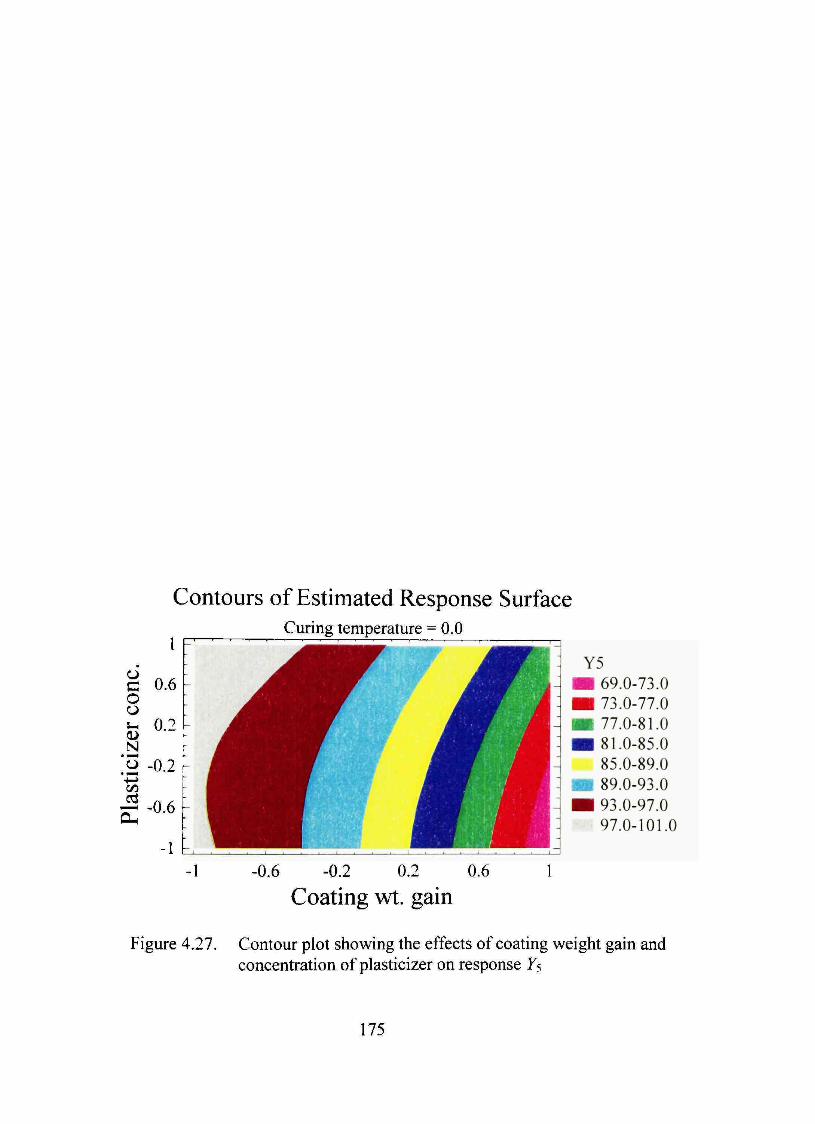
o a o o (U N
Contours of Estimated Response Surface Curing temperature = 0.0
0.6 -
0.2
. o -0.2 -
^ - 0 . 6
Y5 69.0-73.0 73.0-77.0 77.0-81.0 81.0-85.0 85.0-89.0 89.0-93.0 93.0-97.0 97.0-101.0
-1 -0.6 -0.2 0.2 0.6 1
Coating wt. gain
Figure 4.27. Contour piot showing the effects of coating weight gain and concentration of plasticizer on response Y^
175
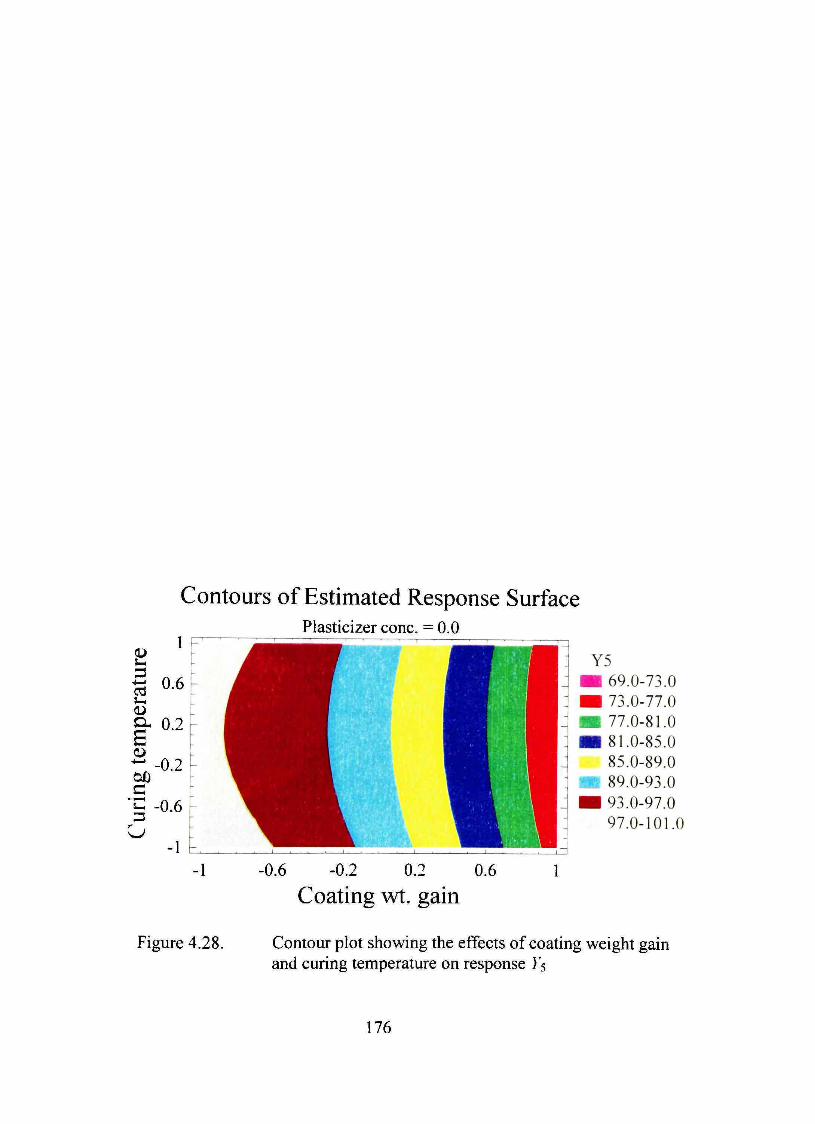
Contours of Estimated Response Surface
CD
5
1 F
l 0.6^
0.2 h h h
•0.2
•0.6
Plasticizer conc. = 0.0
mmm,
Y5 69.0-73.0 73.0-77.0 77.0-81.0 81.0-85.0 85.0-89.0 89.0-93.0 93.0-97.0 97.0-101.0
-1 -0.6 -0.2 0.2 0.6 1
Coating wt. gain
Figure 4.28. Contour plot showing the effects of coating weight gain and curing temperature on response Ys
76
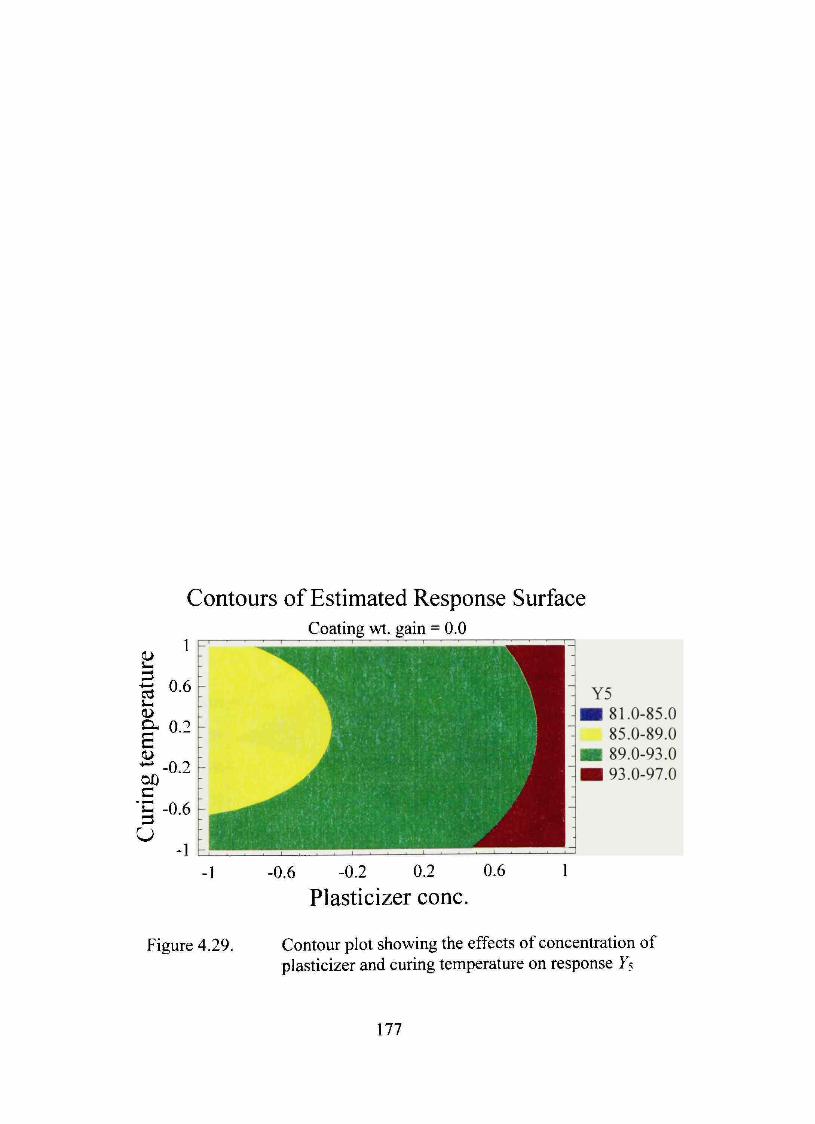
Contours of Estimated Response Surface Coating wt. gain = 0.0
•0.6 -0.2 0.2
Plasticizer conc 0.6
Y5 81.0-85.0 85.0-89.0 89.0-93.0 93.0-97.0
Figure 4.29. Contour plot showing the effects of concentration of plasticizer and curing temperature on response Y^
\11
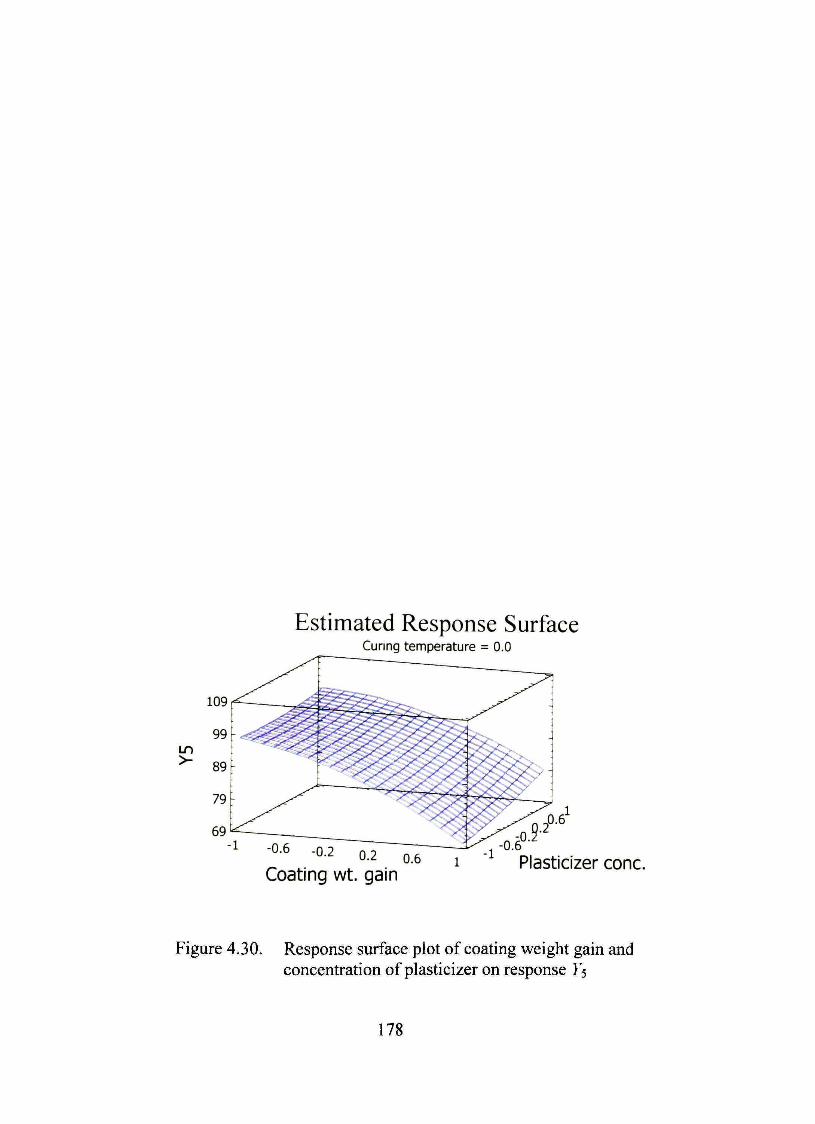
m
Estimated Response Surface Cunng temperature = 0.0
0-2 0.6
Coating wt. gain Plasticizer conc,
Figure 4.30. Response surface plot of coating weight gain and concentration of plasticizer on response Ys
78
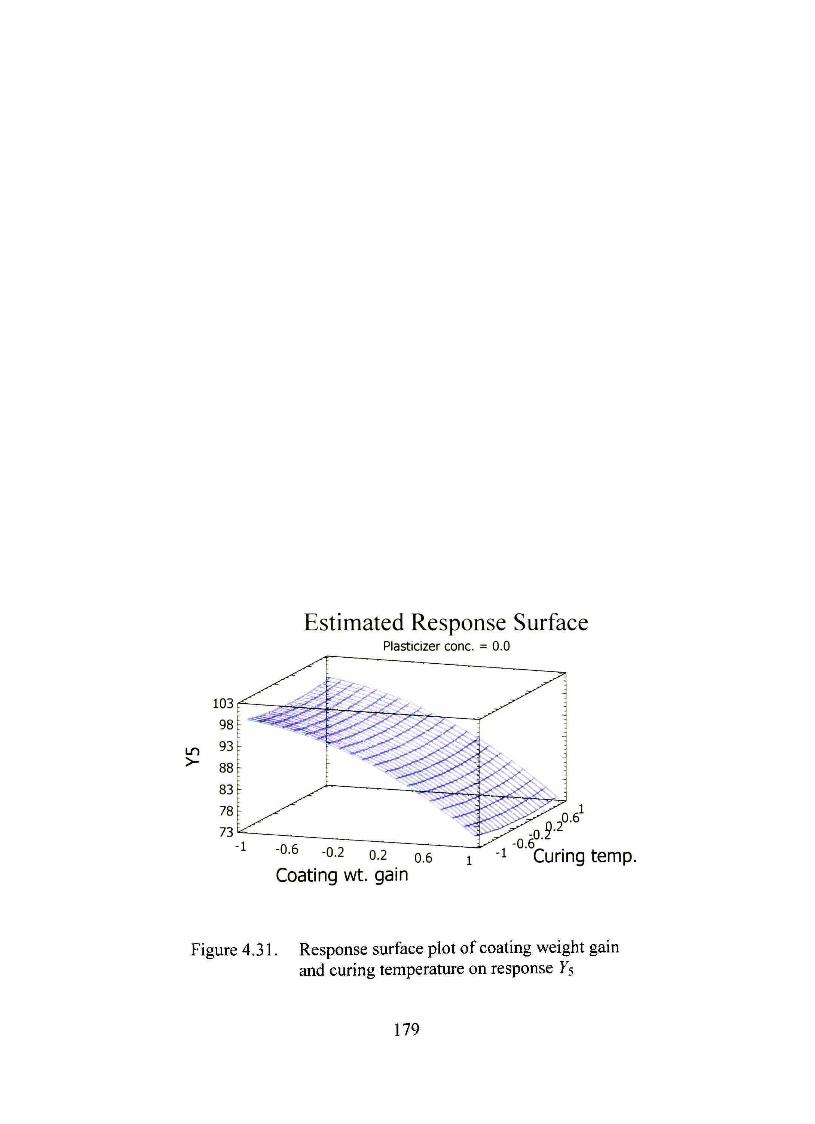
Estimated Response Surface Plasticizer conc. = 0.0
-0.6 -0-2 0.2 0.6
Coating wt. gain •1 Cunng temp.
Figure 4.31. Response surface plot of coating weight gain and curing temperature on response 5
179
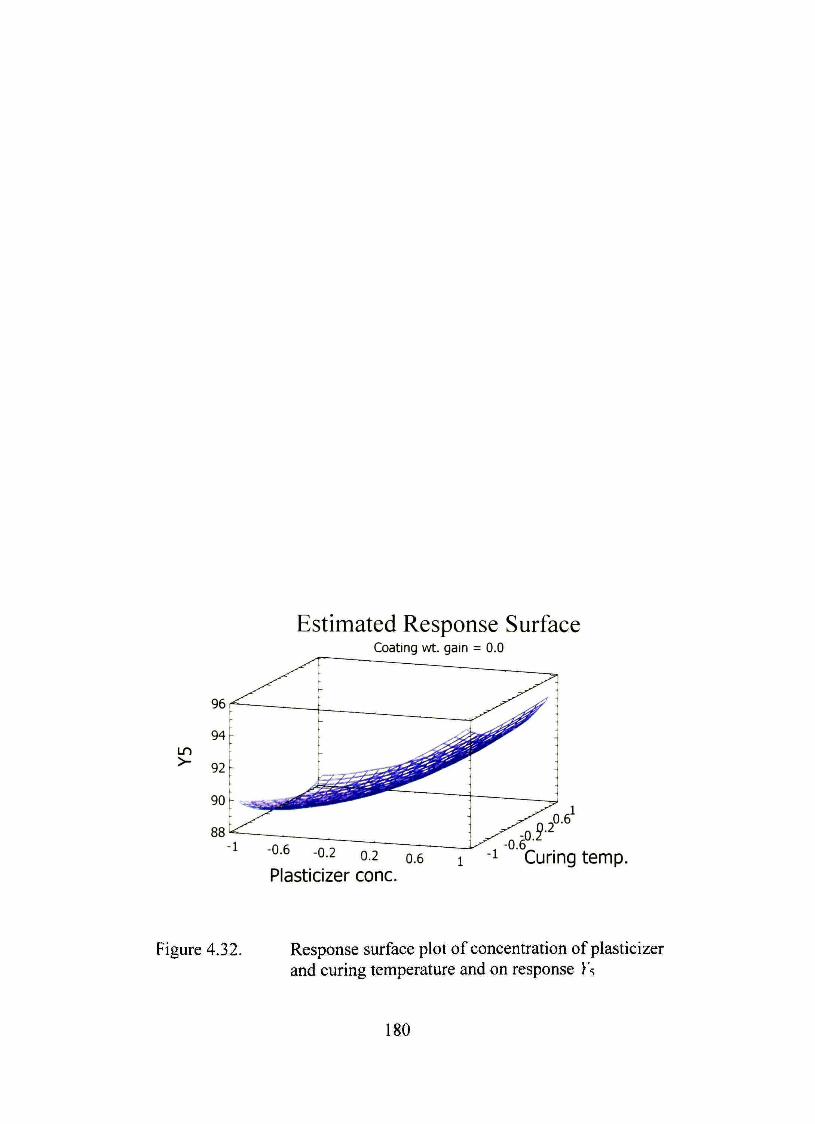
m >-
Estimated Response Surface Coating wt. gain = 0.0
-0-2 0.2 0.6
Plasticizer conc. Curing temp.
Figure 4.32. Response surface plot of concentration of plasticizer and curing temperature and on response I's
180
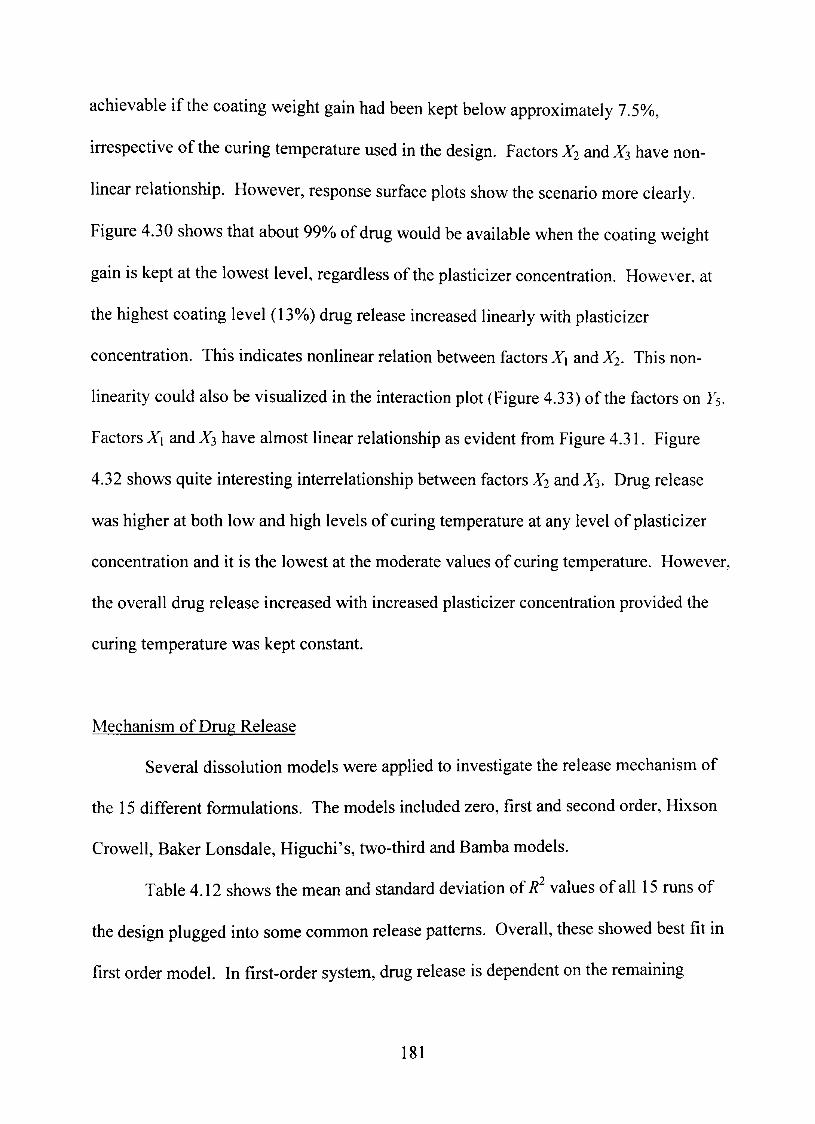
achievable if the coating weight gain had been kept below approximately 7.5%,
irrespective of the curing temperature used in the design. FactorsX^ andX^ have non-
linear relationship. However, response surface plots show the scenario more cleariy.
Figure 4.30 shows that about 99%> of drug would be available when the coating weight
gain is kept at the lowest level, regardless of the plasticizer concentration. However, at
the highest coating level (13%)) drug release increased linearly with plasticizer
concentration. This indicates nonlinear relation between factors X\ and X^. This non-
linearity could also be visualized in the interaction plot (Figure 4.33) of the factors on Y^.
Factors X\ and X^ have almost linear relationship as evident from Figure 4.31. Figure
4.32 shows quite interesting interrelationship between factors X2 and A3. Drug release
was higher at both low and high levels of curing temperature at any level of plasticizer
concentration and it is the lowest at the moderate values of curing temperature. However,
the overall drug release increased with increased plasticizer concentration provided the
curing temperature was kept constant.
Mechanism of Drug Release
Several dissolution models were applied to investigate the release mechanism of
the 15 different formulations. The models included zero, first and second order, Hixson
Crowell, Baker Lonsdale, Higuchi's, two-third and Bamba models.
Table 4.12 shows the mean and standard deviation ofR^ values of all 15 runs of
the design plugged into some conunon release pattems. Overall, these showed best fit in
first order model. In fírst-order system, drug release is dependent on the remaining
181
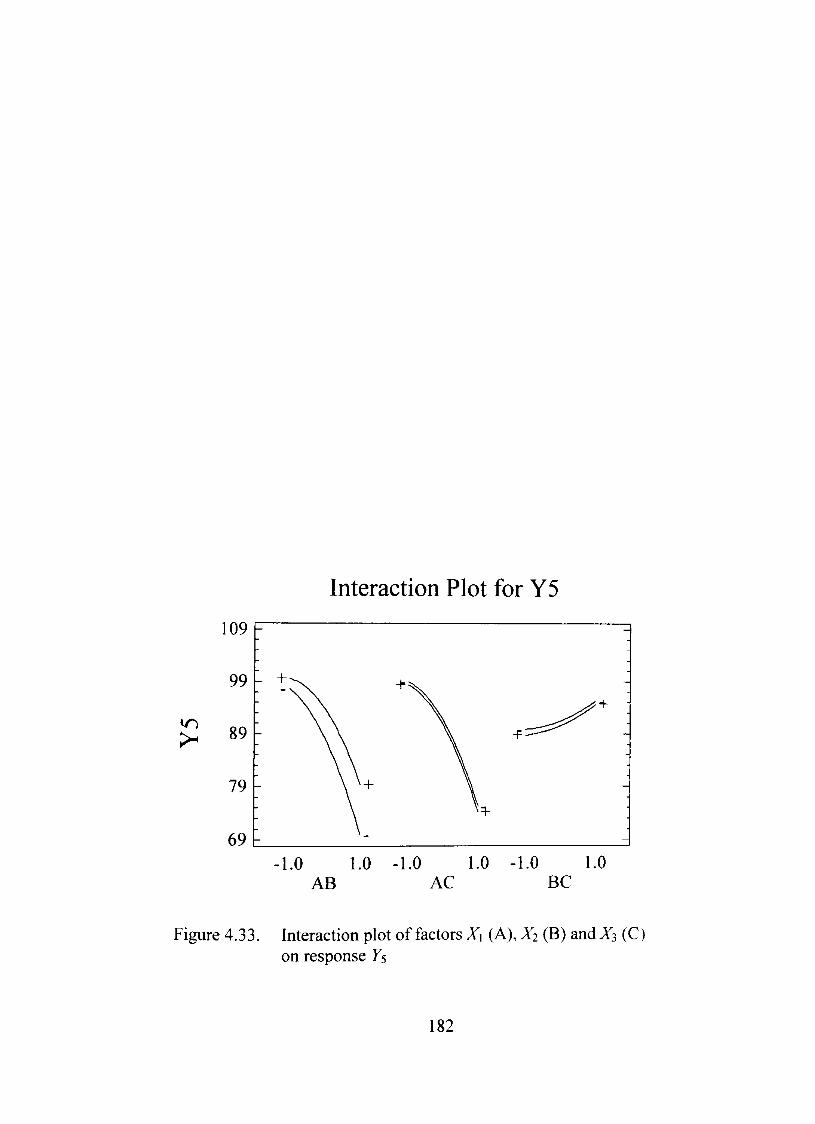
Interaction Plot for Y5
-1.0 1.0 -1.0 1.0 -1.0 1.0 AB AC BC
Figure 4.33. Interaction plot of factors Xi (A), X (B) and X3 (C) on response F5
182
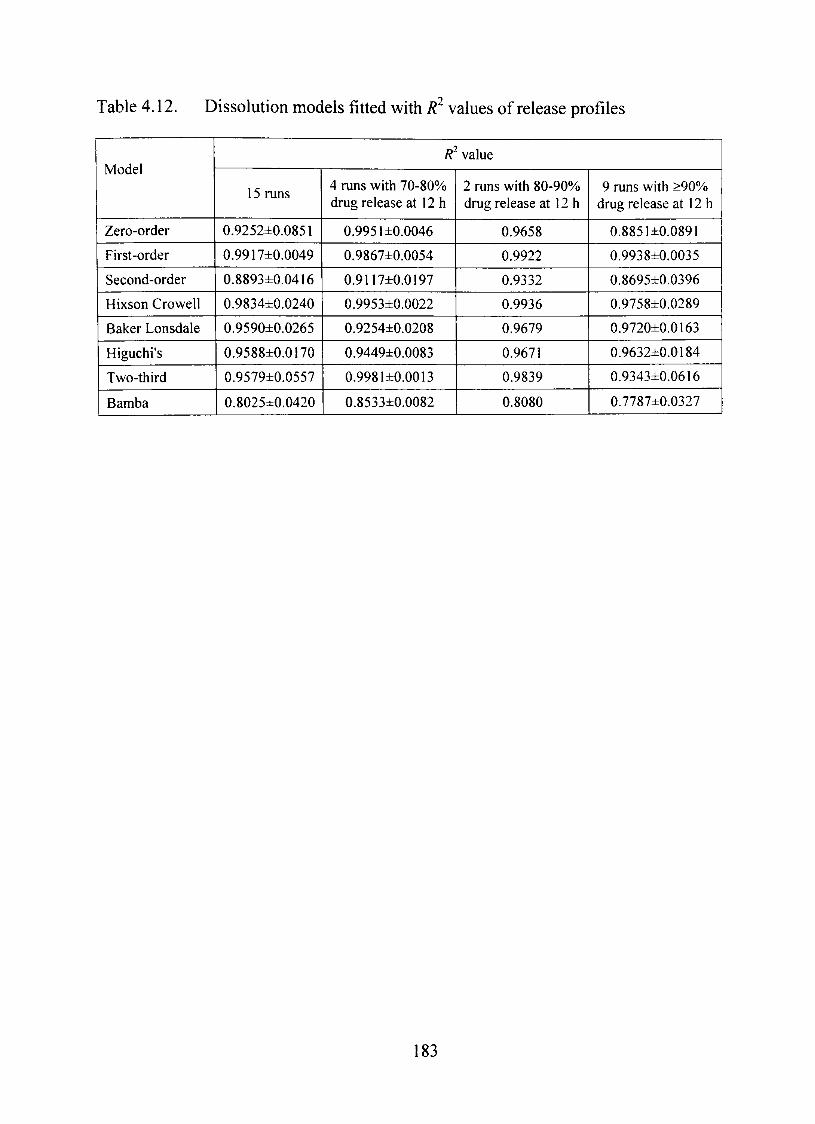
Table 4.12. Dissolution models fitted with R^ values of release profiles
Model
Zero-order
First-order
Second-order
Hixson Crowell
Baker Lonsdale
Higuchi's
Two-third
Bamba
^ value
15 runs
0.9252±0.0851
0.9917±0.0049
0.8893±0.0416
0.9834±0.0240
0.9590±0.0265
0.9588±0.0170
0.9579±0.0557
0.8025±0.0420
4 runs with 70-80% drug release at 12 h
0.9951 ±0.0046
0.9867±0.0054
0.9117±0.0197
0.9953±0.0022
0.9254±0.0208
0.9449±0.0083
0.9981 ±0.0013
0.8533±0.0082
2 runs with 80-90% drug release at 12 h
0.9658
0.9922
0.9332
0.9936
0.9679
0.9671
0.9839
0.8080
9 runs with >90% drug release at 12 h
0.8851±0.0891
0.9938±0.0035
0.8695±0.0396
0.9758±0.0289
0.9720±0.0163
0.9632±0.0184
0.9343±0.0616
0.7787±0.0327
183
concentration of drug in the bead. However, Hixson Crowell model also fitted well to the
experimental batches. The mathematical expression of Hixson Crowell model is
m^^ -m'^^ =kt (4J)
where m is the amount of drug left undissolved (Hixson and Crowell, 1931). h is
noteworthy that as we shifted from batches with slower release to faster release, first-
order model fitted better but Hixson Crowell model tended to deviate. Zero-order release
provides constant drug release over time irrespective of the formulation and
environmental components. Therefore, it should be the ideal model for drug release.
Our 15 runs could explain 92.52% variability of the results by zero-order model.
It is clear from the last three columns of Table 4.12 that batches with slow release tended
to show zero-order release which deviates as drug release increased. Since, coating
weight gain had the greatest influence on drug release it can be concluded that in general,
batches with higher coating should show zero-order release.
Zero-order model was fitted to the release profile of non-osmotic, membrane
controlled, spherical muhi-particulate dosage forms by several investigators (Frohoff-
Hulsmann et al., 1999; Wang et al., 1997). The mathematical modeling of such time
independent reservoir systems (Peppas, 1995) would be
dm ^CA DKrr
dt r^ - r,
where dm/dt, release rate, ÁC. difference in concentration between two sides of the
membrane, D, diffiision coefficient of drug through the membrane, K, partition
(4.4)
184
coefficient of the drug between the reservoir and membrane, r\, intemal radius and re,
extemal radius of the bead.
Optimization
Constraints were placed on responses Y\ to Í4 (Table 3.8) for the optimization.
Response Ys was maximized and other responses were minimized within the constraint
limits to exclude outliers, if any. The optimized formulation generated by the design is
given in Table 4.13 and tumed out to be identical with one of the batches of the design.
Still, a fresh batch was prepared with the optimized formulation and studied for drug
release. The expected and observed results of the responses are presented in Table 4.13.
Those are in close agreement. The dissolution profiles of the observed and the expected
data were compared using two fit factors/i and/2. These fit factors provide a single
number describing two curves that consist of several points to reduce the complexity of
curve comparison. The fit factors/ a n d / are zero and 100. respectively, if the two
curves are identical and change up to 100 and zero, respectively as those become
completely dissimilar. According to FDA (1995, 1997a, 1997b, 1997c), two pattems are
said to be identical if the difference factor,/ is less than 15 and similarity factor,/ is
between 50 and 100. The calculated values of/ a n d / were 0.61 and 97.44, respectively,
suggesting the closeness of observed and predicted values. The release pattem of the
optimized formulation was best fitted to both first order and Hixson Crowell kinetics with
R^ value of 0.9962. The master formula for the optimized batch is shown in Table 4.14.
85
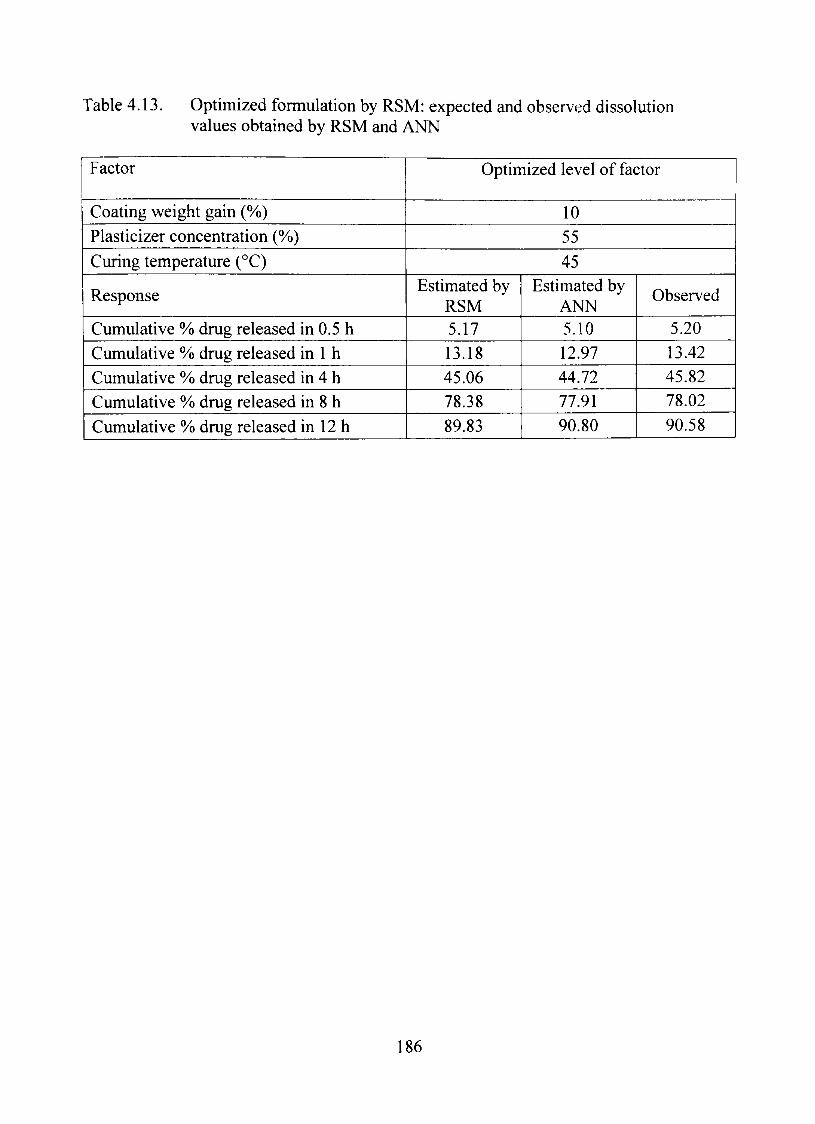
Table 4.13. Optimized formulation by RSM: expected and observed dissolution values obtained by RSM and ANN
Factor
Coating weight gain (%)
Plasticizer concentration (%)
Curing temperature (°C)
Response
Cumulative % drug released in 0.5 h
Cumulative % drug released in 1 h
Cumulative % drug released in 4 h
Cumulative % drug released in 8 h
Cumulative % drug released in 12 h
Optimized level of factor
10
55
45 Estimated by
RSM 5.17
13.18
45.06 78.38
89.83
Estimated by ANN 5.10 12.97 44.72 77.91
90.80
Observed
5.20 13.42
45.82 78.02
90.58
186
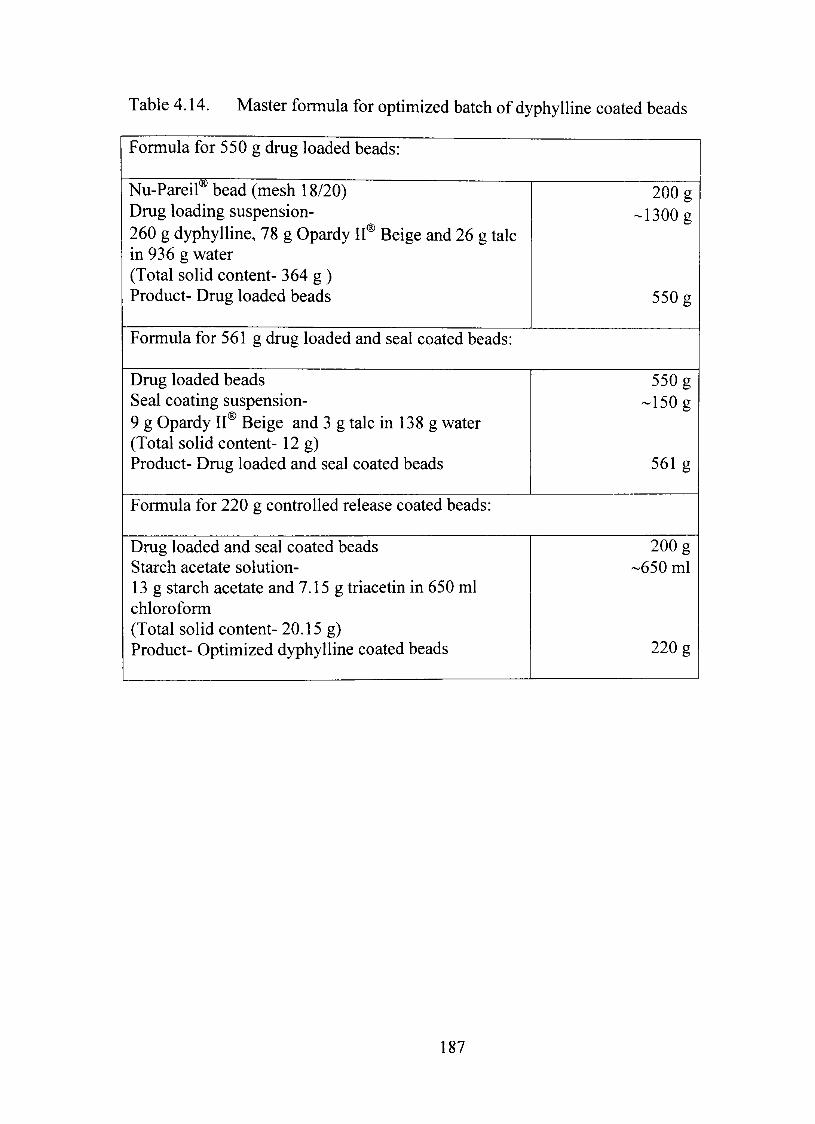
Table 4.14. Master formula for optimized batch of dyphylline coated beads
Formula for 550 g drug loaded beads:
Nu-Pareir bead (mesh 18/20) Drug loading suspension-260 g dyphylline, 78 g Opardy II® Beige and 26 g talc in 936 g water (Total solid content- 364 g ) Product- Drug loaded beads
Formula for 561 g drug loaded and seal coated beads:
Drug loaded beads Seal coating suspension-9 g Opardy II® Beige and 3 g talc in 138 g water (Total solid content- 12 g) Product- Drug loaded and seal coated beads
200 g -1300 g
550 g
550 g -150 g
561 g
Formula for 220 g controlled release coated beads:
Drug loaded and seal coated beads Starch acetate solution-13 g starch acetate and 7.15 g triacetin in 650 ml chloroform (Total solid content- 20.15 g) Product- Optimized dyphylline coated beads
200 g -650 ml
220 g
187
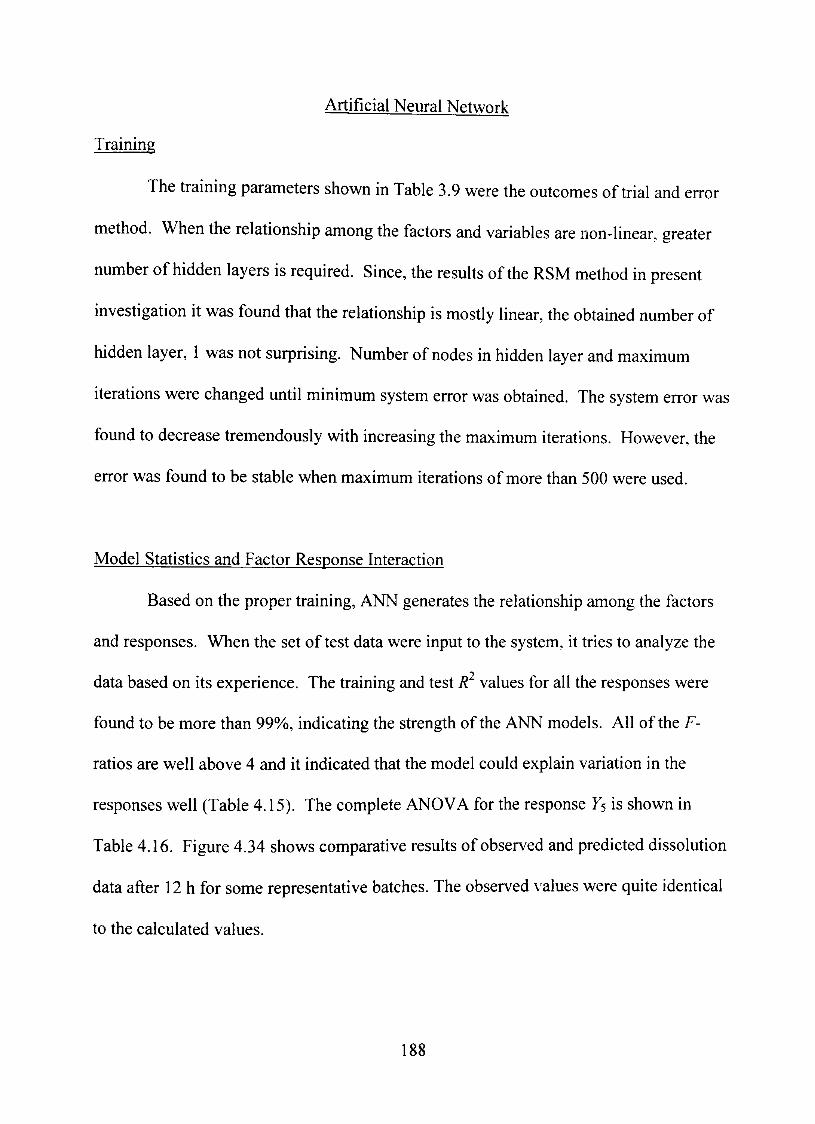
Artificial Neural Network
Training
The training parameters shown in Table 3.9 were the outcomes of trial and error
method. When the relationship among the factors and variables are non-Iinear, greater
number of hidden layers is required. Since, the results of the RSM method in present
investigation it was found that the relationship is mostiy linear, the obtained number of
hidden layer, 1 was not surprising. Number of nodes in hidden layer and maximum
iterations were changed until minimum system error was obtained. The system error was
found to decrease tremendously with increasing the maximum iterations. However, the
error was found to be stable when maximum iterations of more than 500 were used.
Model Statistics and Factor Response Interaction
Based on the proper training, ANN generates the relationship among the factors
and responses. When the set of test data were input to the system, it tries to analyze the
data based on its experience. The training and test R values for all the responses were
found to be more than 99%), indicating the strength of the ANN models. All of the F-
ratios are well above 4 and it indicated that the model could explain variation in the
responses well (Table 4.15). The complete ANOVA for the response Ys is shown in
Table 4.16. Figure 4.34 shows comparative resuhs of observed and predicted dissolution
data after 12 h for some representative batches. The observed values were quite identical
to the calculated values.
188
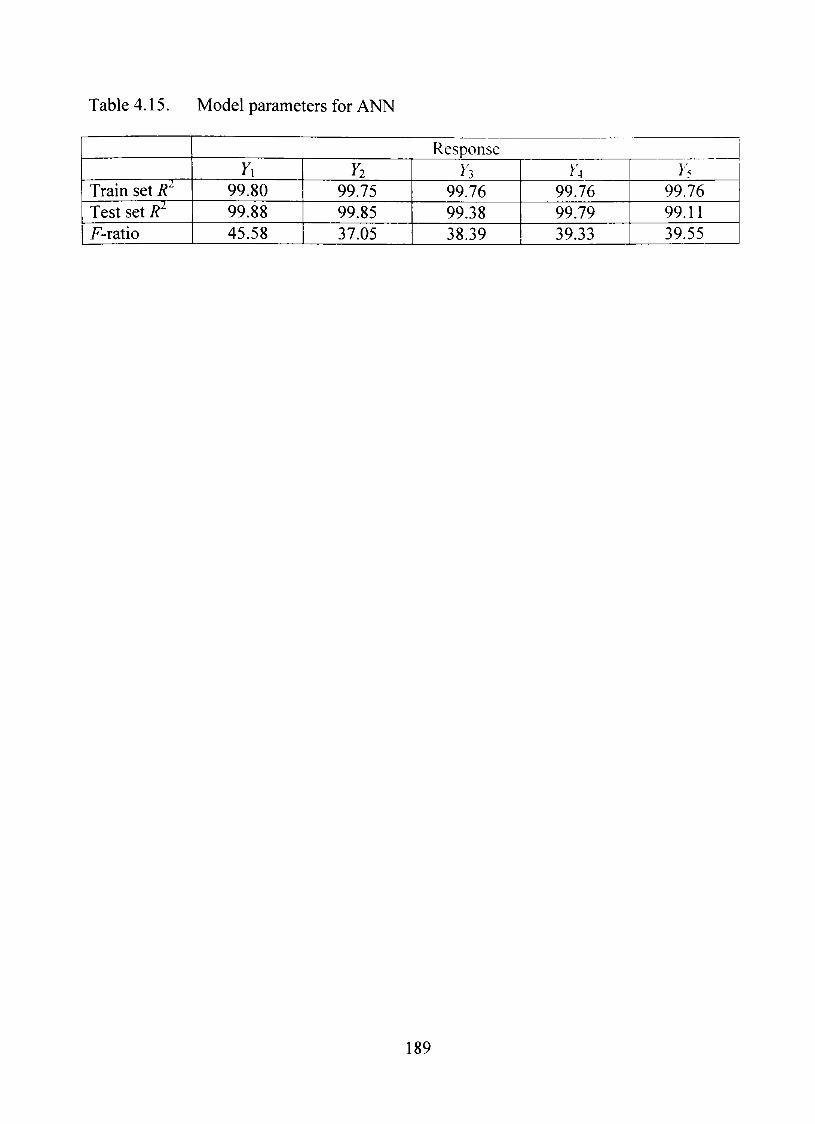
Table 4.15. Model parameters for ANN
Train set R'^ Test set R^ F-ratio
Response Y\
99.80 99.88 45.58
Í2
99.75 99.85 37.05
^3
99.76 99.38 38.39
Y, 99.76 99.79 39.33
}'5
99.76 99.11 39.55
189
Table 4.16. Analysis of variance for the response Ys
Source of variation Model Error Total Train Set i? Test Set R'
Sum of squares
2170.1842 5.2260
2157.5563 99.7578 99.1103
Degrees of freedom
21 2
23
Mean squares
103.3421 2.6130
Computed F ratio
39.5490
90
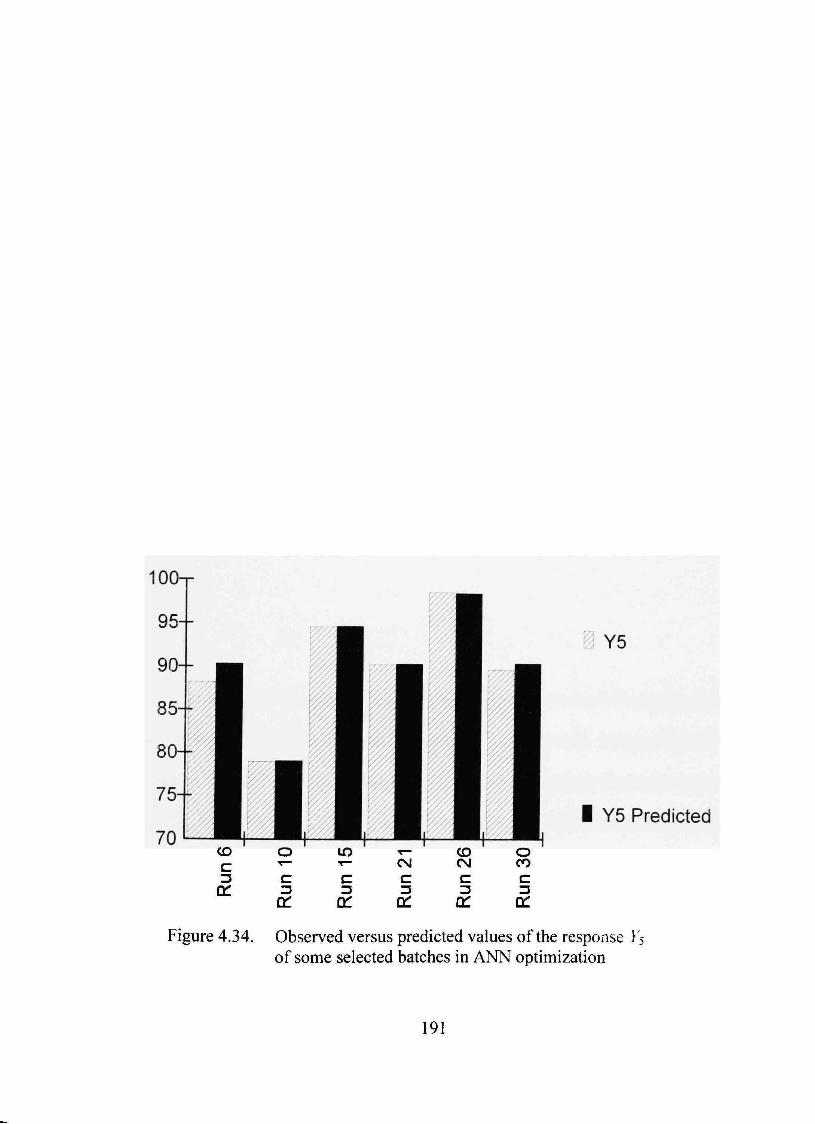
Í Y5
I Y5 Predicted
Figure 4.34. Observed versus predicted values of the response Y^ of some selected batches in ANN optimization
91
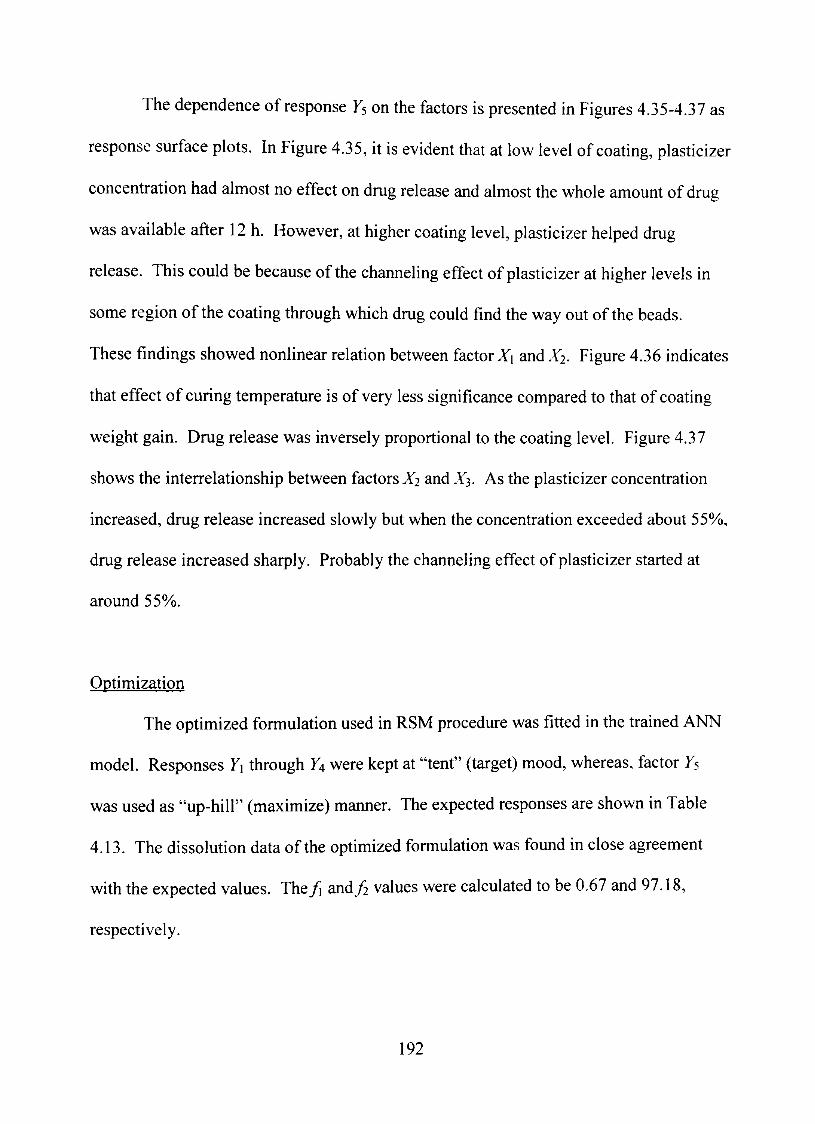
The dependence of response Ys on the factors is presented in Figures 4.35-4.37 as
response surface plots. In Figure 4.35, h is evident that at low level of coating, plasticizer
concentration had almost no effect on dmg release and almost the whole amount of drug
was available after 12 h. However, at higher coating level, plasticizer helped drug
release. This could be because of the channeling effect of plasticizer at higher levels in
some region of the coating through which dmg could find the way out of the beads.
These findings showed nonlinear relation between factor Xi and X^. Figure 4.36 indicates
that effect of curing temperature is of very less significance compared to that of coating
weight gain. Drug release was inversely proportional to the coating level. Figure 4.37
shows the interrelationship between factors X^ and X^. As the plasticizer concentration
increased, drug release increased slowly but when the concentration exceeded about 55%,
drug release increased sharply. Probably the channeiing effect of plasticizer started at
around 55%.
Optimization
The optimized formulation used in RSM procedure was fitted in the trained ANN
model. Responses Y\ through Y4 were kept at "tent" (target) mood, whereas, factor Ys
was used as "up-hilf' (maximize) manner. The expected responses are shown in Table
4.13. The dissolution data of the optimized formulation was found in close agreement
with the expected values. T h e / a n d / values were calculated to be 0.67 and 97.18,
respectively.
192
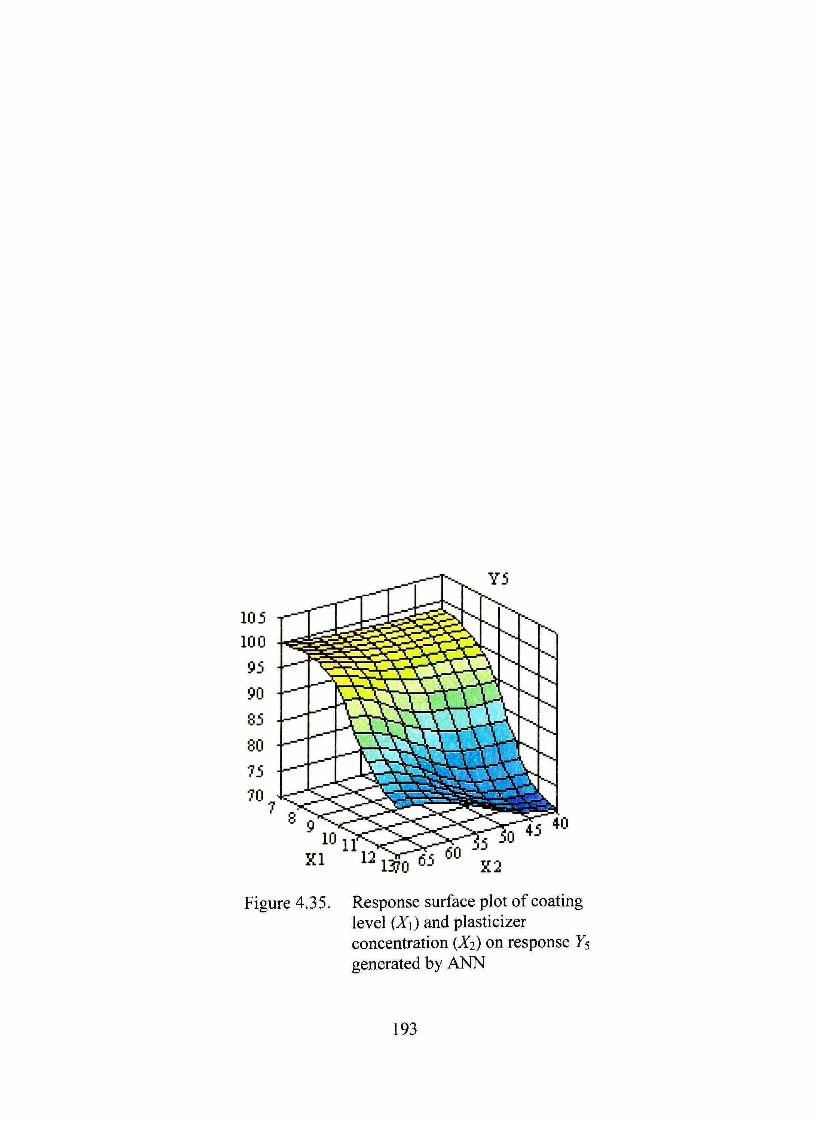
Response surface plot of coating level (X]) and plasticizer concentration (X2) on response Ys generated by ANN
193
SSvi^" XI -lil^^^r"^;,^.^
Figure 4.36. Response surface plot of coating level (X]) and curing temperature (X3) on response ^5 generated byANN
94
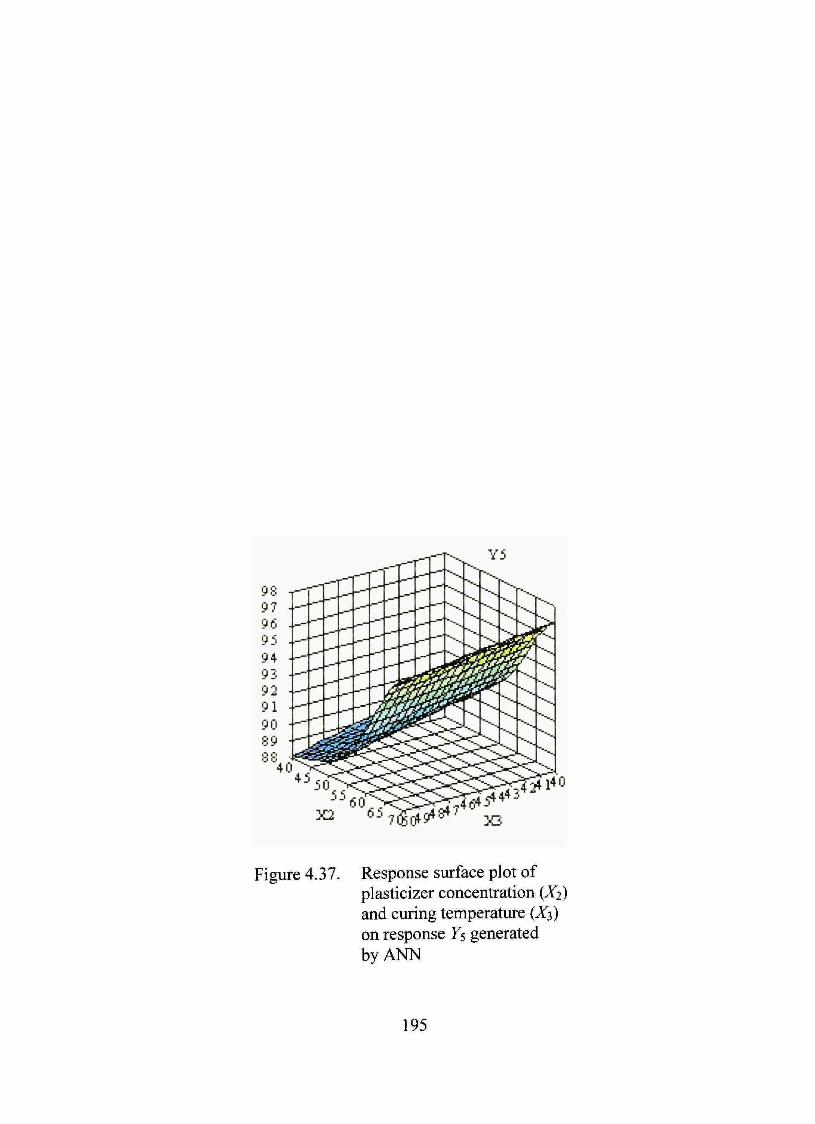
Figure 4.37. Response surface plot of plasticizer concentration (X^) and curing temperature (X^,) on response Ys generated byANN
195
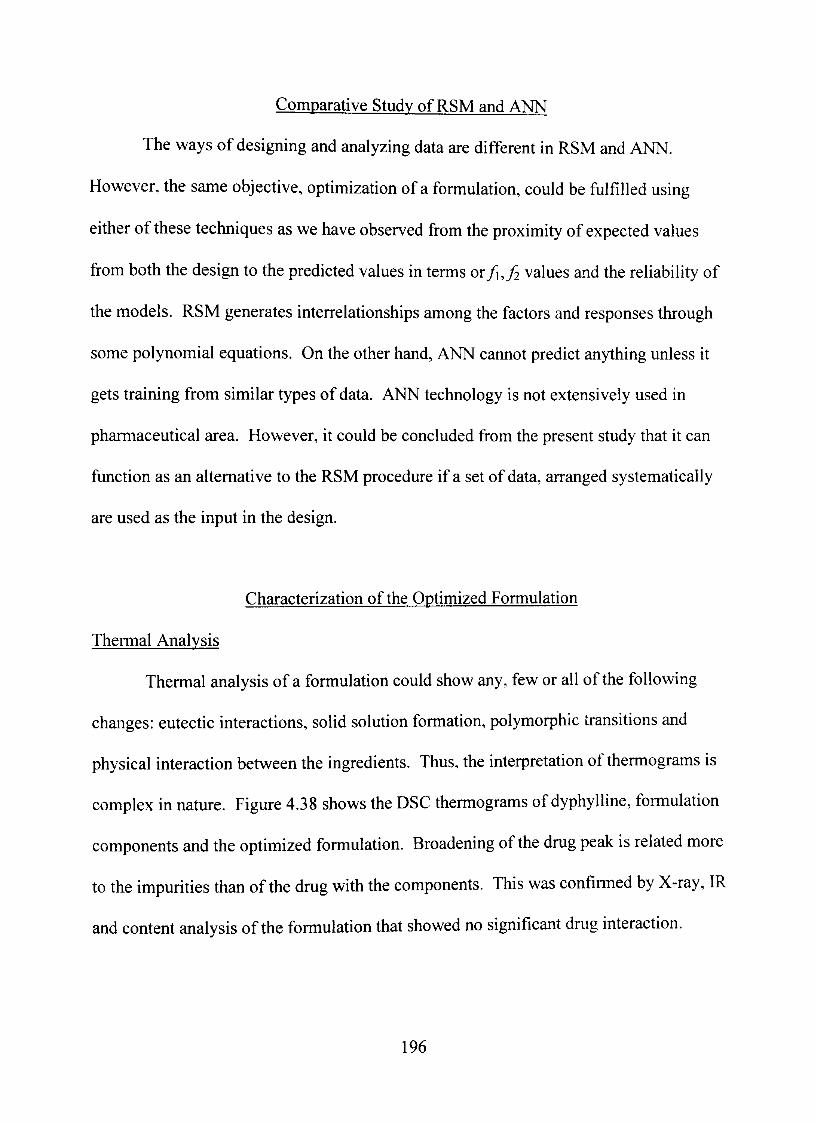
Comparative Studv of RSM and ANN
The ways of designing and analyzing data are different in RSM and ANN.
However, the same objective, optimization of a formulation, could be ftilfílled using
either of these techniques as we have observed from the proximity of expected values
from both the design to the predicted values in terms o r / , / values and the reliability of
the models. RSM generates interrelationships among the factors and responses through
some polynomial equations. On the other hand, ANN cannot predict anything unless it
gets training from similar types of data. ANN technology is not extensively used in
pharmaceutical area. However, it could be concluded from the present study that it can
fiinction as an altemative to the RSM procedure if a set of data, arranged systematically
are used as the input in the design.
Characterization of the Optimized Formulation
Thermal Analysis
Thermal analysis of a formulation could show any, few or all of the following
changes: eutectic interactions, solid solution formation, polymorphic iransitions and
physical interaction between the ingredients. Thus, the interpretation of thermograms is
complex in nature. Figure 4.38 shows the DSC thermograms of dyphylline, formulation
components and the optimized formulation. Broadening of the dmg peak is related more
to the impurities than of the dmg with the components. This was confirmed by X-ray, IR
and content analysis of the formulation that showed no significant drug interaction.
196
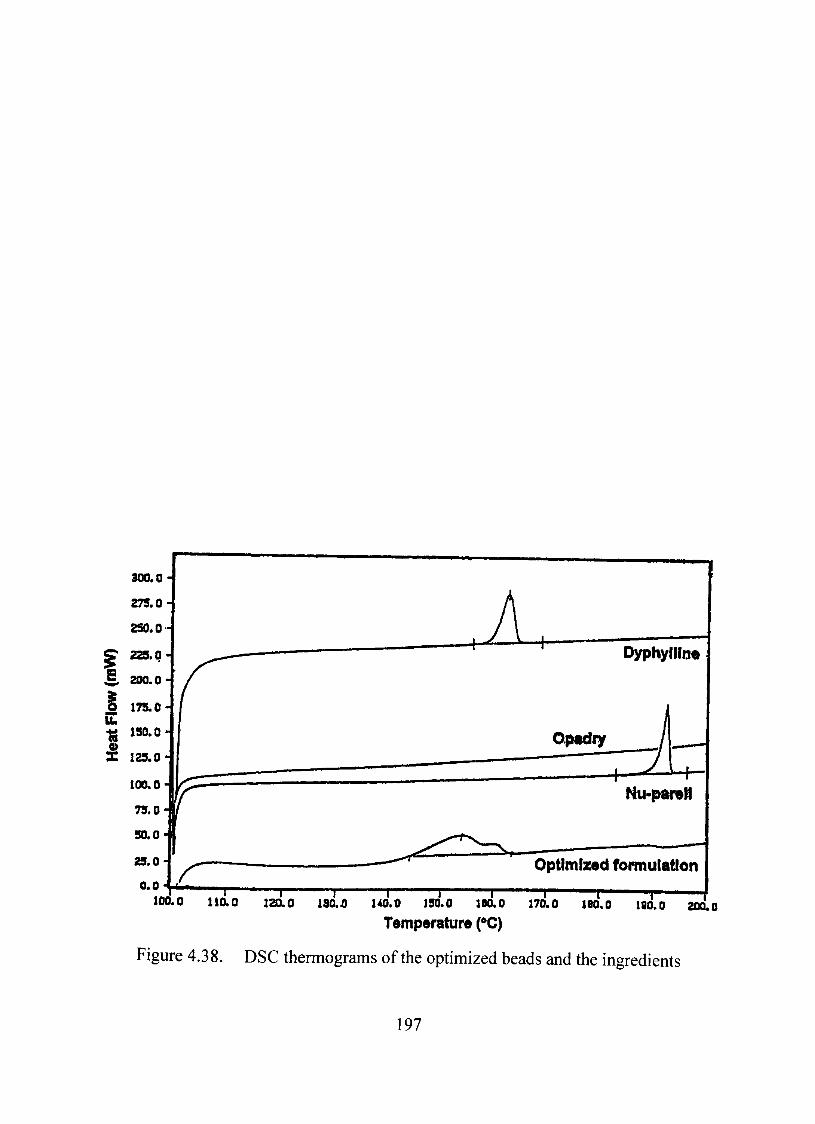
I
300.0 -
275.0 -
250.0-
223.0-
200.0-
175.0-U. ^ 1S0.0*1
X 12S.0-1
100.0-
29.0 0.0-OLM
100.0 iiao i2ao 130.0 —r-140.0
Dyphylllne
Nu-par»H
Optimlzod formulatlon
190.0 160.0 170.0 ieo.0 180.0 • /
200.0 Tømpdratura f C)
Figure 4.38. DSC thermograms of the optimized beads and the ingredients
97
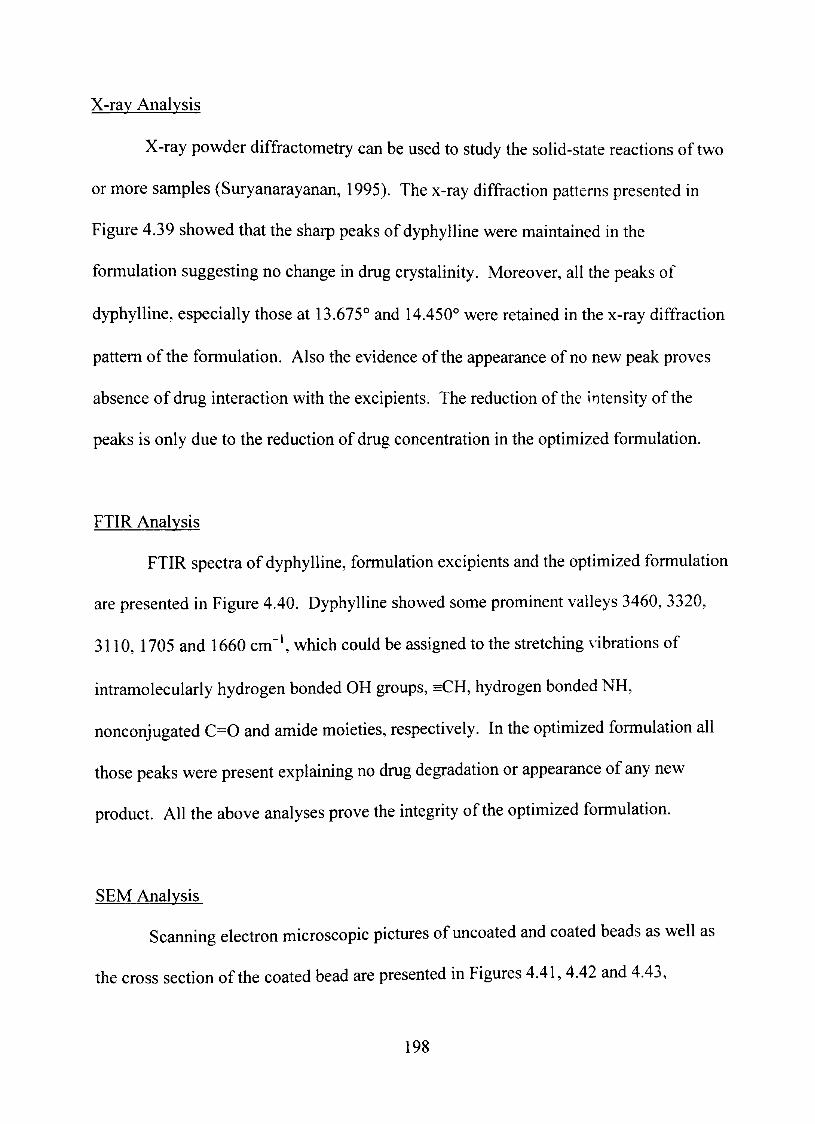
X-rav Analysis
X-ray powder diffractometry can be used to study the solid-state reactions of two
or more samples (Suryanarayanan, 1995). The x-ray diffraction patterns presented in
Figure 4.39 showed that the sharp peaks of dyphylline were maintained in the
formulation suggesting no change in drug crystalinity. Moreover, all the peaks of
dyphylline, especially those at 13.675° and 14.450° were retained in the x-ray diffraction
pattem of the formulation. Also the evidence of the appearance of no new peak proves
absence of drug interaction with the excipients. The reduction of the intensity of the
peaks is only due to the reduction of dmg concentration in the optimized formulation.
FTIR Analysis
FTIR spectra of dyphylline, formulation excipients and the optimized formulation
are presented in Figure 4.40. Dyphylline showed some prominent valleys 3460, 3320,
3110, 1705 and 1660 cm"', which could be assigned to the stretching vibrations of
intramoleculariy hydrogen bonded OH groups, =CH, hydrogen bonded NH,
nonconjugated C=0 and amide moieties, respectively. In the optimized formulation all
those peaks were present explaining no dmg degradation or appearance of any new
product. All the above analyses prove the integrity of the optimized formulation.
SEM Analvsis
Scanning electron microscopic pictures of uncoated and coated beads as well as
the cross section of the coated bead are presented in Figures 4.41, 4.42 and 4.43,
98
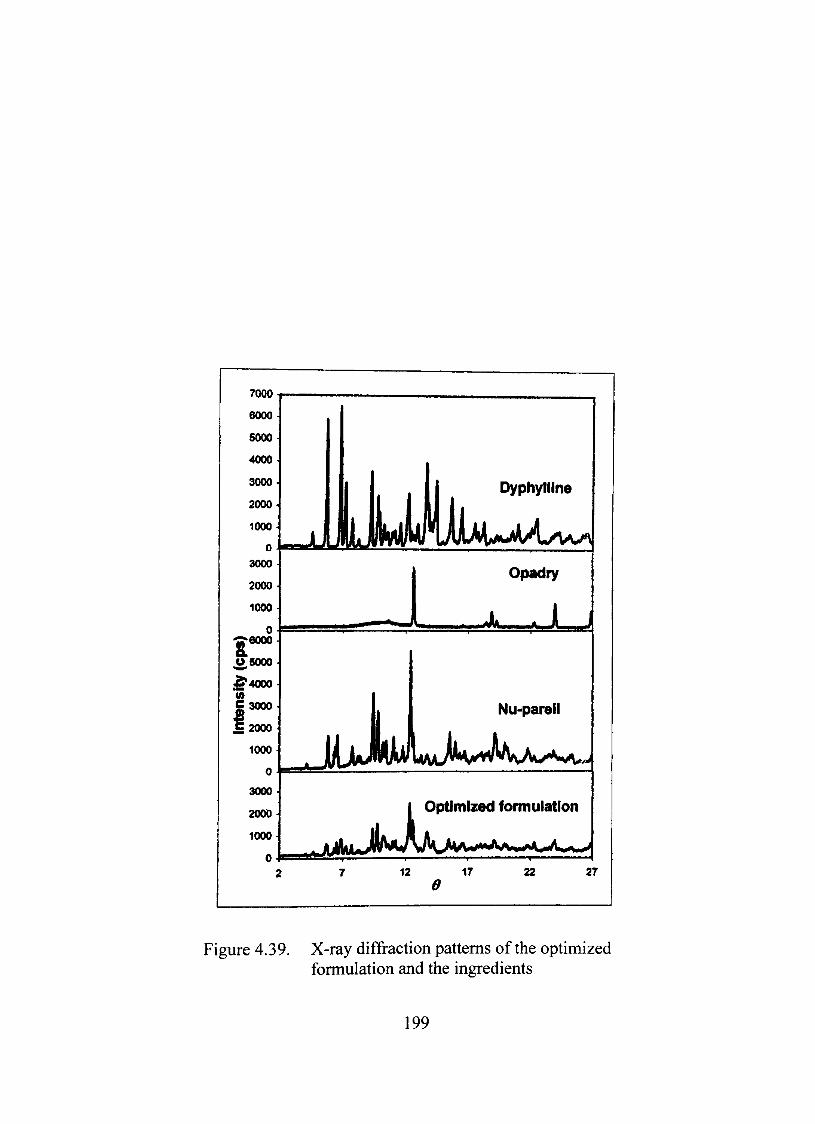
7000
6000
60004
4000
3000
2000
1000
0
3000
2000
1000
j I l l Dyphylllna
_JL1J I I J IUJWU^
0
^ e o o o
^6000 ^
é*4000
C3000 £2000
1000
0
3000
2000
1000
0
J Opadry
li Nu-parail
I optimizad formuiation
2 7 12 17 22 27 0
Figure 4.39. X-ray diffraction pattems of the optimized formulation and the ingredients
199
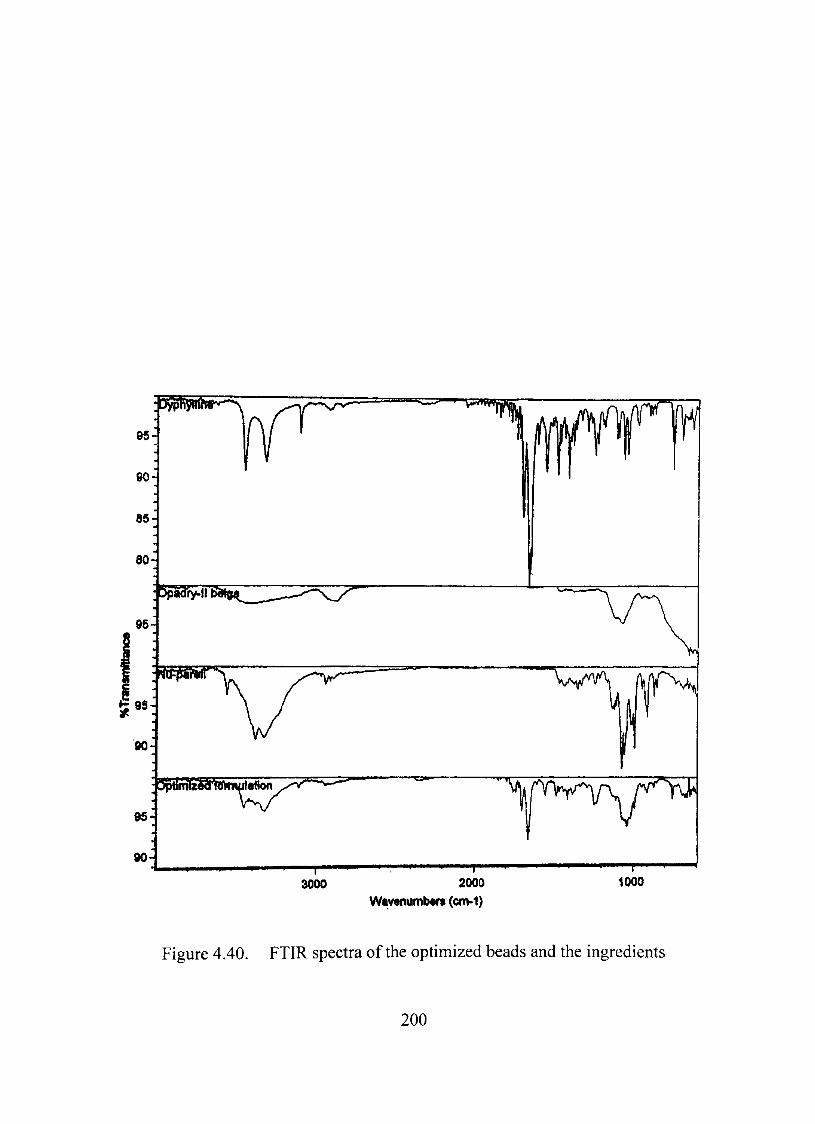
I I . ' ' ' I
3000 2000 Wavønumbm (cm-l)
1000
Figure 4.40. FTIR spectra of the optimized beads and the ingredients
200
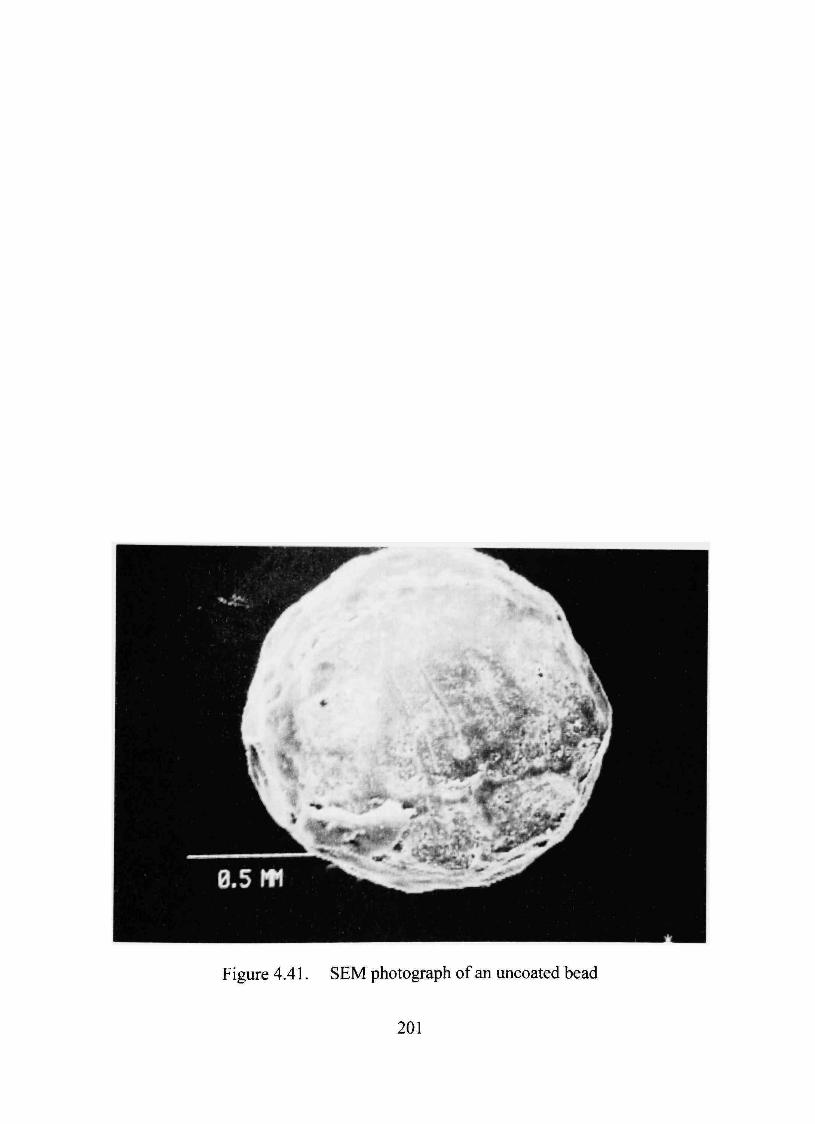
Figure 4.41. SEM photograph of an uncoated bead
201
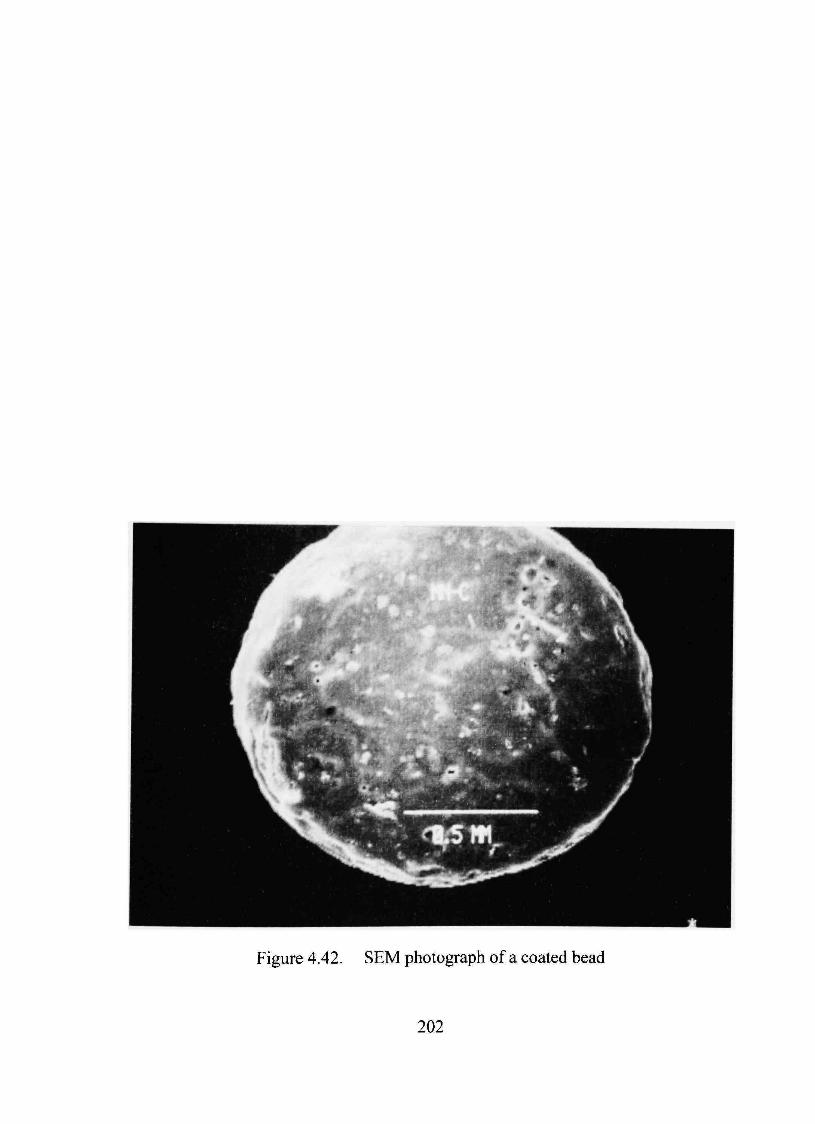
Figure 4.42. SEM photograph of a coated bead
202
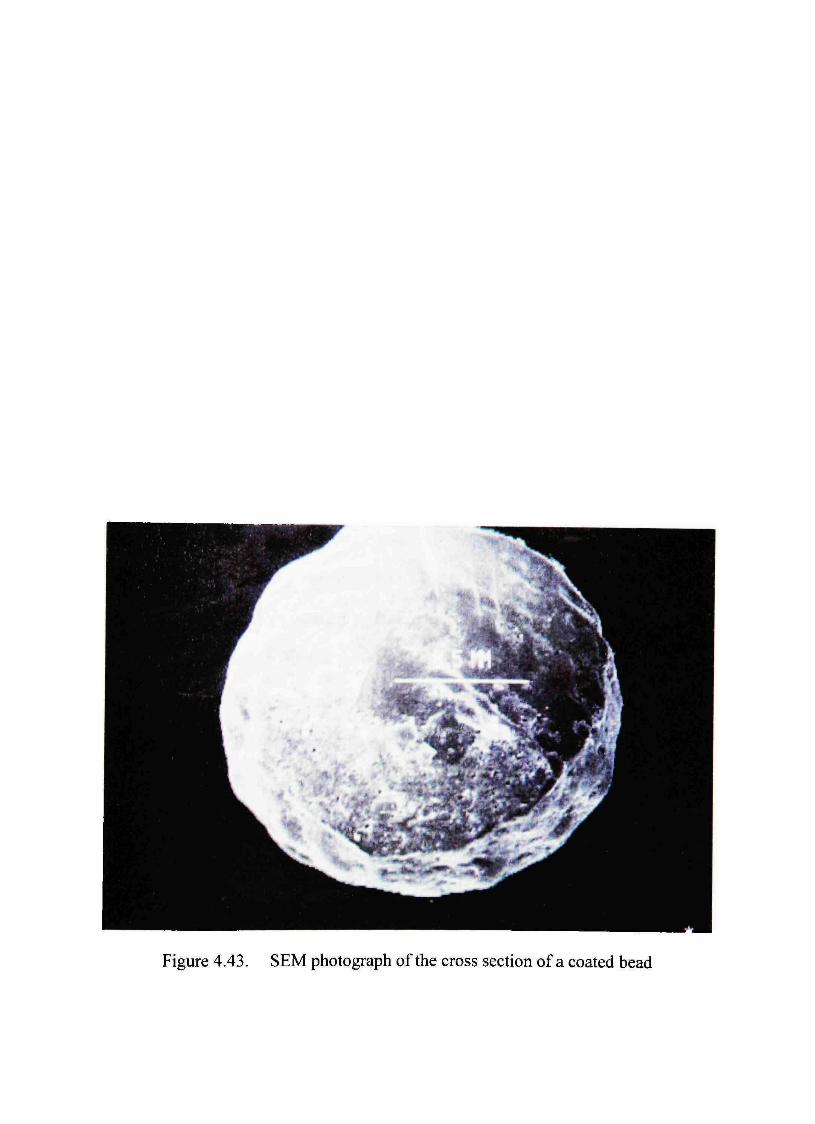
Figure 4.43. SEM photograph of the cross section of a coated bead
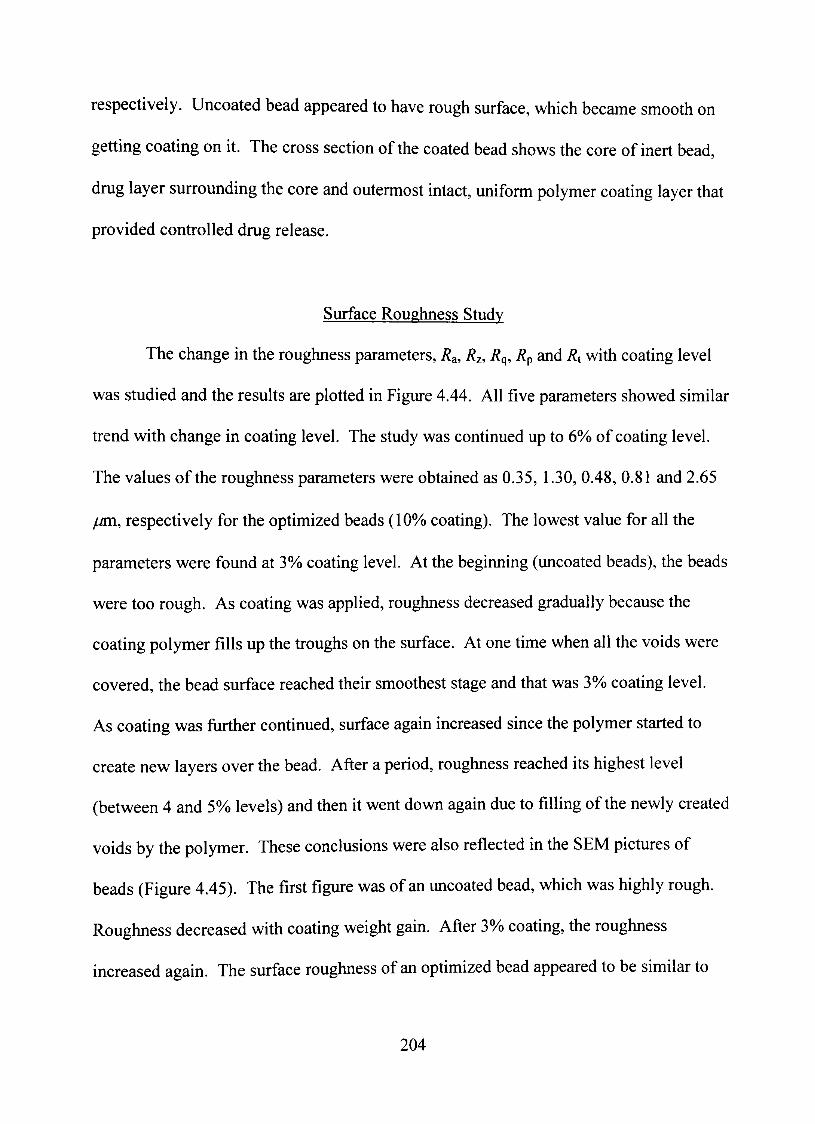
respectively. Uncoated bead appeared to have rough surface, which became smooth on
getting coating on h. The cross section of the coated bead shows the core of inert bead,
drug layer surrounding the core and outermost intact, uniform polymer coating layer that
provided controlled dmg release.
Surface Roughness Studv
The change in the roughness parameters, R^, R^, Rq, Rp and Rt with coating level
was studied and the results are plotted in Figure 4.44. AII five parameters showed similar
trend with change in coating level. The study was continued up to 6%o of coating level.
The values of the roughness parameters were obtained as 0.35, 1.30, 0.48, 0.81 and 2.65
jum, respectively for the optimized beads (10% coating). The lowest value for all the
parameters were found at 3%» coating level. At the beginning (uncoated beads), the beads
were too rough. As coating was applied, roughness decreased gradually because the
coating polymer fills up the troughs on the surface. At one time when all the voids were
covered, the bead surface reached their smoothest stage and that was 3%) coating level.
As coating was ftirther continued, surface again increased since the polymer started to
create new layers over the bead. After a period, roughness reached its highest level
(between 4 and 5% levels) and then it went down again due to fiUing of the newly created
voids by the polymer. These conclusions were also reflected in the SEM pictures of
beads (Figure 4.45). The first figure was of an uncoated bead, which was highly rough.
Roughness decreased with coating weight gain. After 3%> coating, the roughness
increased again. The surface roughness of an optimized bead appeared to be similar to
204
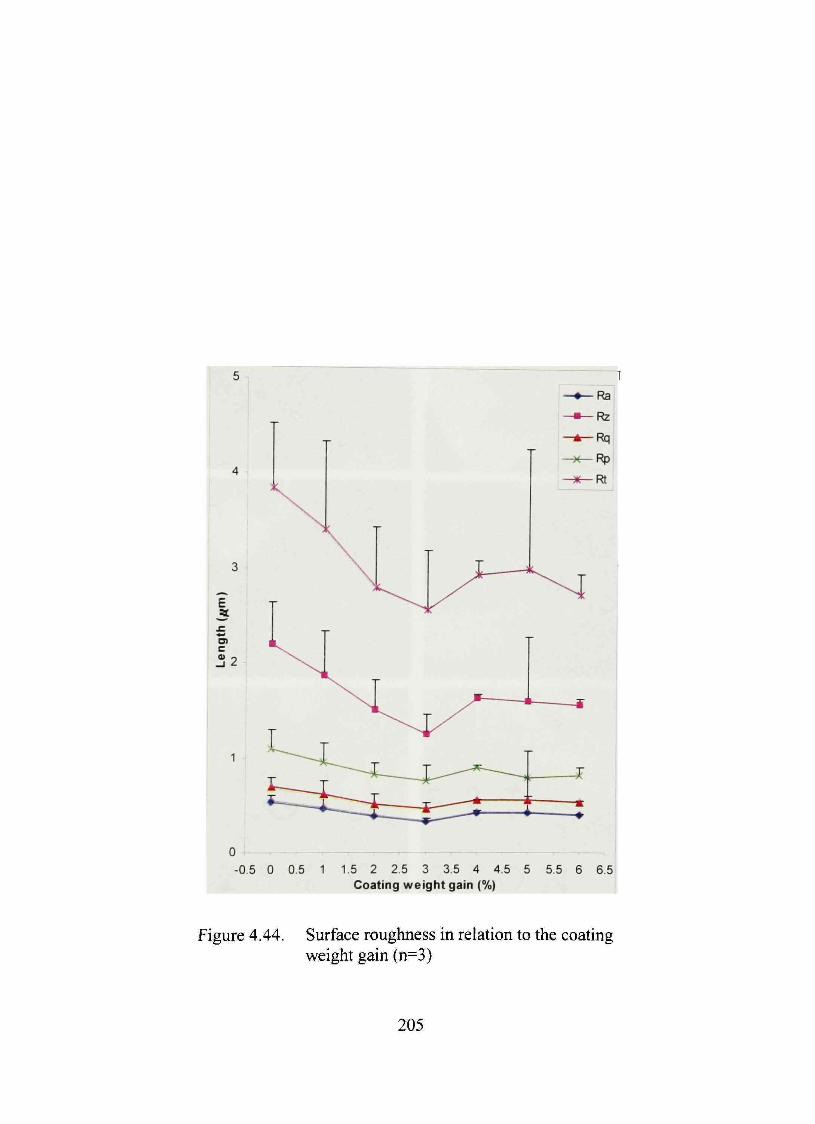
E
O) c ii2
i • • • 1
> —•— í
X
^
RaJ
Rz
Rq
Rp
Rt
0 -•0.5 0 0.5 1 1.5 2 2.5 3 3.5 4 4.5 5 5.5 6 6.5
Coating weíght gain (%)
Figure 4.44. Surface roughness in relation to the coating weight gain (n=3)
205
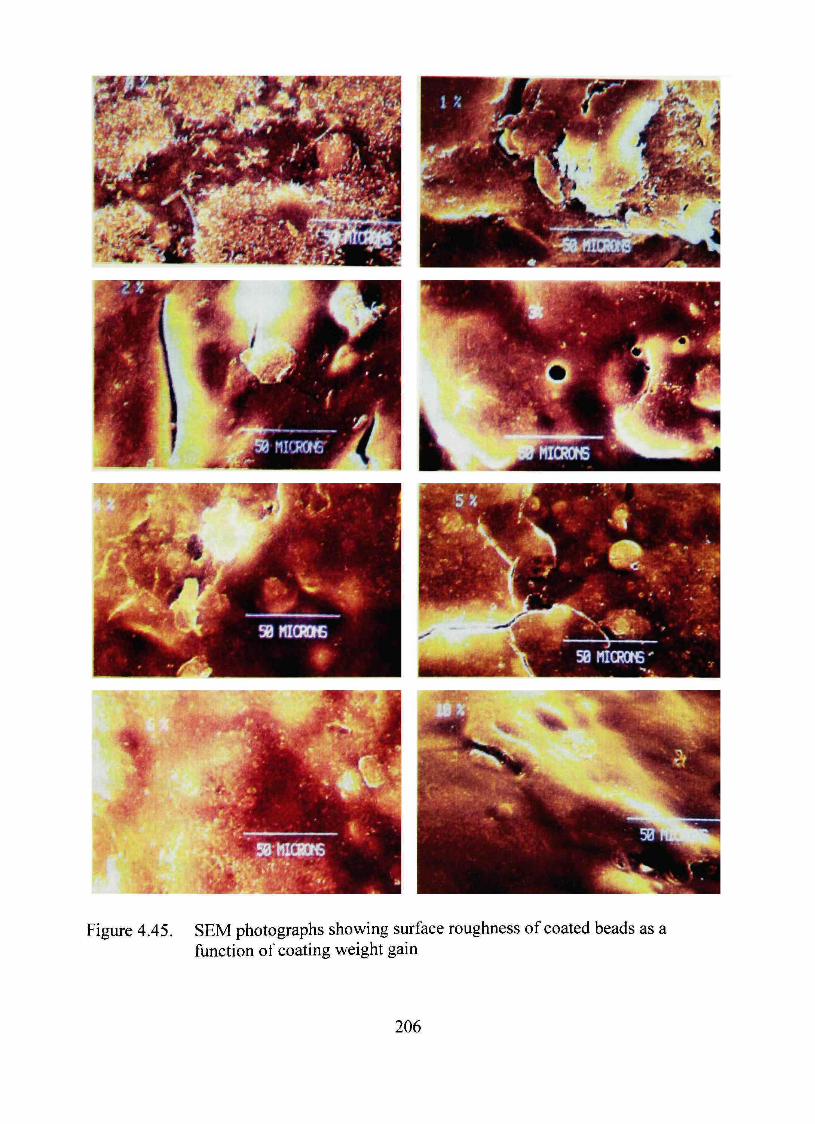
Figure 4.45. SEM photographs showing surface roughness of coated beads as a fiinction of coating weight gain
206
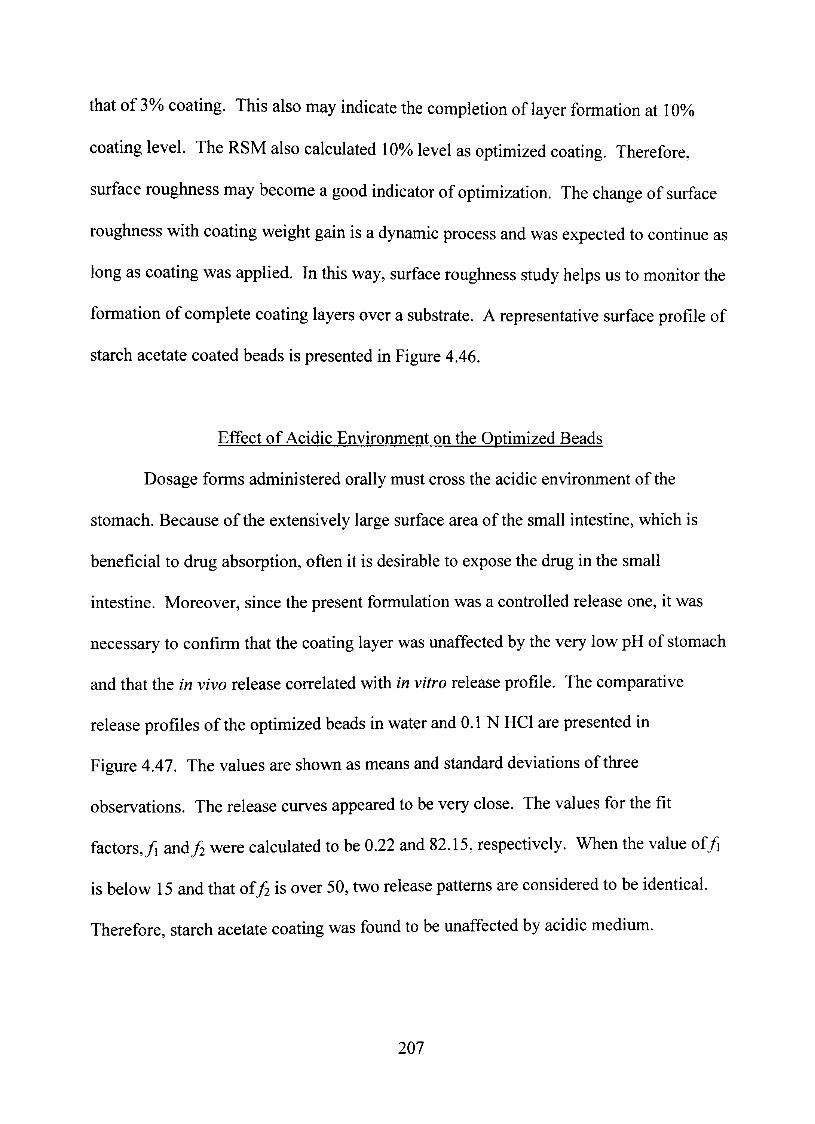
that of 3% coating. This also may indicate the completion of layer formation at 10%
coating level. The RSM also calculated 10% level as optimized coating. Therefore,
surface roughness may become a good indicator of optimization. The change of surface
roughness with coating weight gain is a dynamic process and was expected to continue as
long as coating was applied. In this way, surface roughness study helps us to monitor the
formation of complete coating layers over a substrate. A representative surface profile of
starch acetate coated beads is presented in Figure 4.46.
Effect of Acidic Environment on the Optimized Beads
Dosage forms administered orally must cross the acidic envirorunent of the
stomach. Because of the extensively large surface area of the small intestine, which is
beneficial to drug absorption, often it is desirable to expose the dmg in the small
intestine. Moreover, since the present formulation was a controlled release one, it was
necessary to confirm that the coating layer was unaffected by the very low pH of stomach
and that the in vivo release correlated with in vitro release profile. The comparative
release profíles of tiie optimized beads in water and 0.1 N HCl are presented in
Figure 4.47. The values are shown as means and standard deviations of three
observations. The release curves appeared to be very close. The values for the fit
factors,/ a n d / were calculated to be 0.22 and 82.15, respectively. When the value of/
is below 15 and that of/i is over 50, two release pattems are considered to be identical.
Therefore, starch acetate coating was found to be unaffected by acidic medium.
207
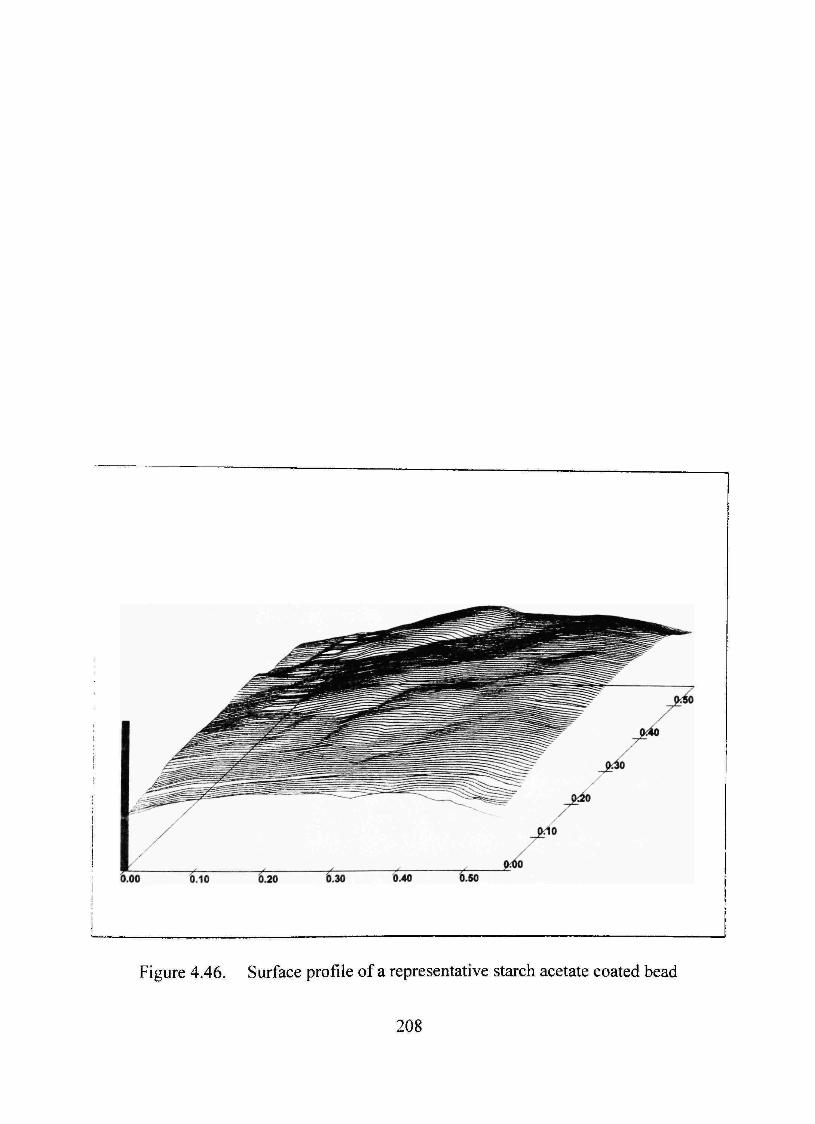
0.10 0.20
Figure 4.46. Surface profile of a representative starch acetate coated bead
208
100
90
80
70
0)
> l 6 0
E
Iso 0) (A
m _Qí
0)40 Oi 3
30
20
-©—In water
-•-- At pH 1 2
10
04-6 8
Time (h) 10 12
Figure 4.47. Release of dyphylline from coated beads in acidic medium (n=3)
209
Effect of Amvlase on the Optimized Beads
Dyphylline release from the optimized coated beads in phosphate buffer in
presence or absence of a-amylase is compared in Figure 4.48. The values are presented
as means and standard deviations of three observations. The curves looked similar in
most places and t h e / a n d / values were found to be 2.50 and 76.89, respectively. This
means that the carbohydrate splitting enzyme, a-amylase could not alter the release
profile to a great extent. Unlike starch, which is degraded to smaller components in the
intestine by amylase, the starch derivative was almost unaffected. Probably the
esterification changed the polymer overall stmcture that it was not affected by the
enzyme. It was shown before that the solubility of starch acetate is dramatically different
from starch. Since starch acetate was almost completely insoluble in water, amylase
could not reach the appropriate site of its action (ûr-l,4-glucosidic linkage) on the
polymer molecules and hence, the polymer was not degraded.
Considering all the previous studies, h could be concluded that the prepared
dyphylline loaded optimized bead coated with starch acetate had desired in vitro release
profile and the correlations suggested that in could be used for in vivo animal studies.
In Vivo Studv
The analysis of the rat plasma samples was performed using a standard curve of
the dmg in plasma. Representative chromatograms of both blank plasma and plasma
containing the dmg and the intemal standard are shown in Figure 4.49. The retention
times were about 6 and 8 minutes for the intemal standard and the dmg, respectively.
210
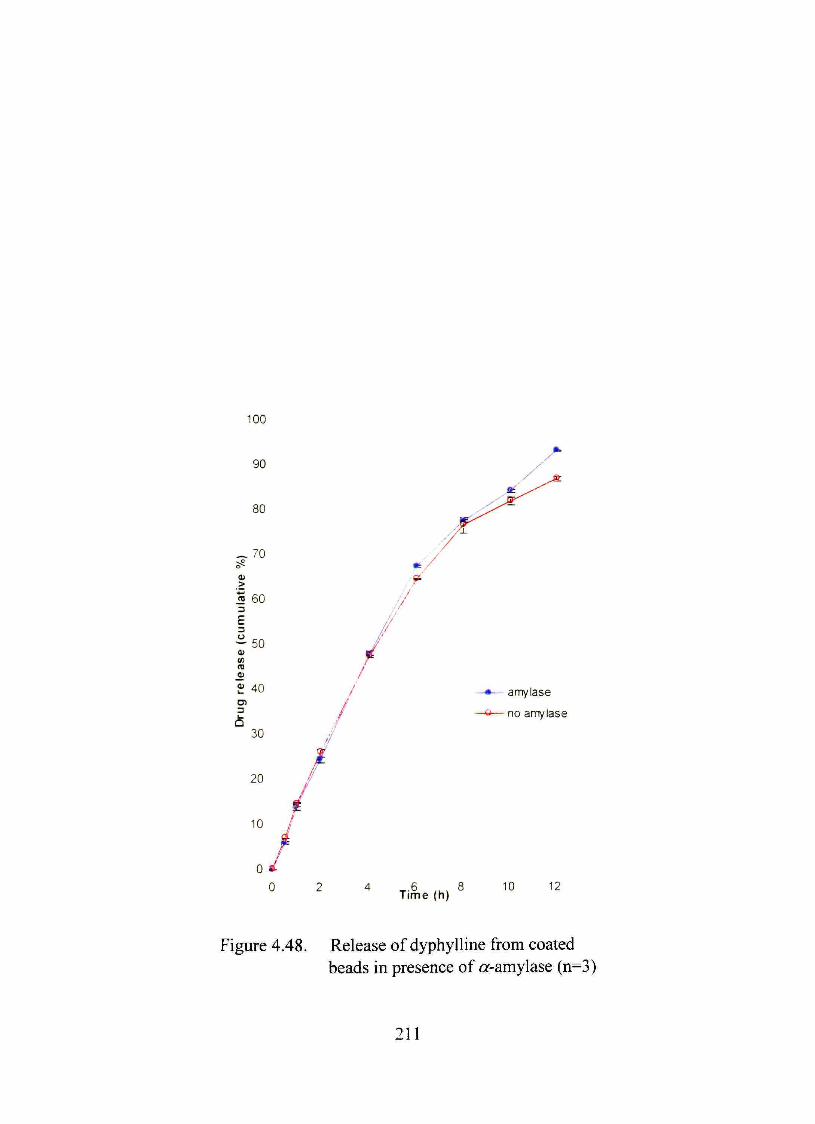
100
90
80
^ 70
0)
_> S 60
E
^ 5 0 01 (fí (0
e 40 •— amylase
«— no amylase
Time (h) 10 12
Figure 4.48. Release of dyphylline from coated beads in presence of a-amylase (n=3)
211
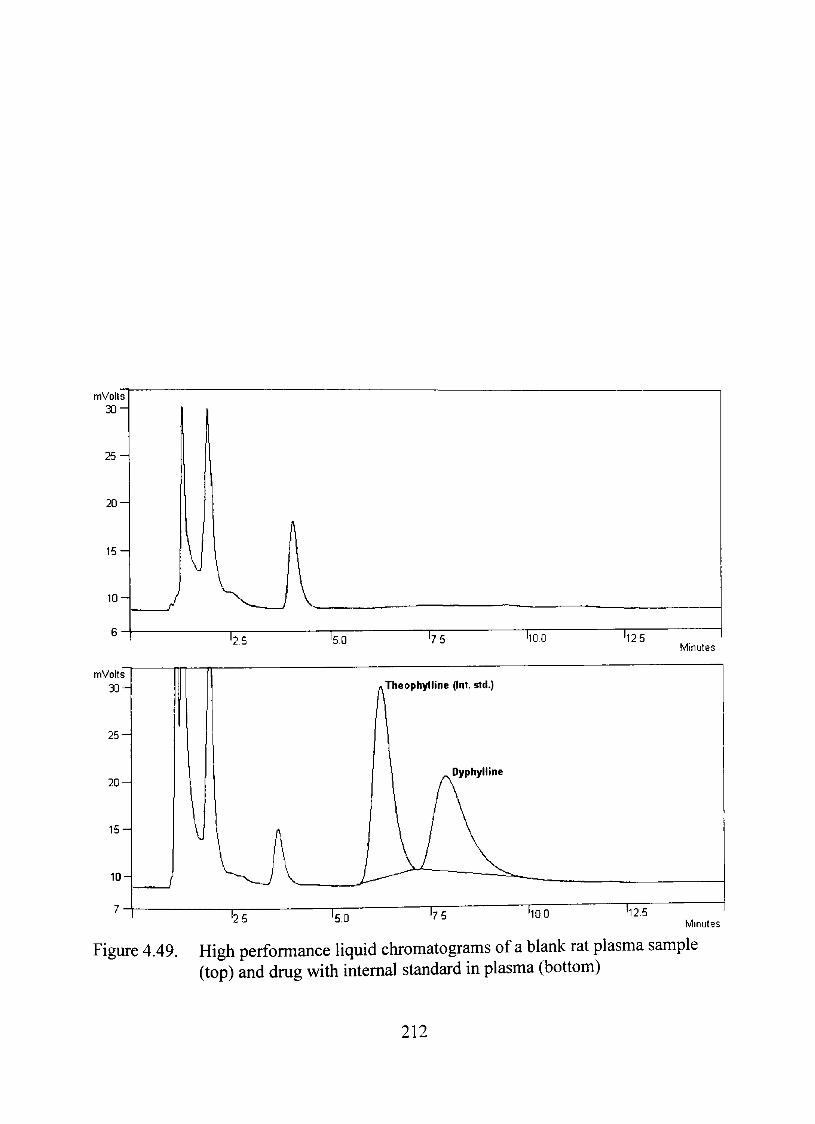
mVolts 3 H
25
20
1 5 -
Figure 4.49.
'2 5
V
'5,0
'75
Theophylllne (fnt. std.)
ho.
Dyphylline
'7 5 '10 0
'12 5 Minutes
h25 Minutes
High performance liquid chromatograms of a blank rat plasma sample (top) and drug with intemal standard in plasma (bottom)
212
are Plasma profiles of drug obtained from powder and the optimized formulation
presented in Figure 4.50. Table 4.17 contains the pharmacokinetic parameters of those
two products. The maximum plasma concentration (C^^) for the control was obtained at
1 hr (T„,ax) for all rats. Since blood was not withdrawn before 1 h, the Tmax could be even
less. This was expected due to high solubility of the dmg in water as well as its rapid
absorption. The obtained mean Cmax was about 11.10 //g/ml. Those values were 4 h
(L„ax) and 5.70 /ig/ml (C^ax) ft)r the optimized formulation. Since the controlled dmg
delivery system releases dmg slowly, the maximum concentration comes later and also it
comes lower than regular values. Fifty percent of the dmg was released in vitro in more
than 4 h (Table 4.13), therefore, it was very unlikely that the maximum concentration
would be obtained at around 1 h, similar to the powder formulation.
The A UCo^u of the optimized formulation was lower (about 73%) than that of the
control. However, the difference was not significant (p=0.064). This decrease was not
unexpected since, bioavailability or the extent of absorption of a highly soluble and
highly permeable dmg cannot always be improved with a single dose of a controlled
release product. Similar type of findings was obtained by Simons et al. (1977) in human.
Bioavailability of a sustained release product was found to be 68% of that of regular
tablets. However, the present study had not been conducted to increase the
bioavailability of dyphylline. The objective was to maintain a steady level of the dmg in
plasma for longer period of time. Figure 4.49 clearly reveals that in case of the powdered
dmg, the plasma level quickly reached the peak and dropped dovm fast, whereas. for the
controlled release product, Cntax was reached slowly and following the C^ox, plasma level
213
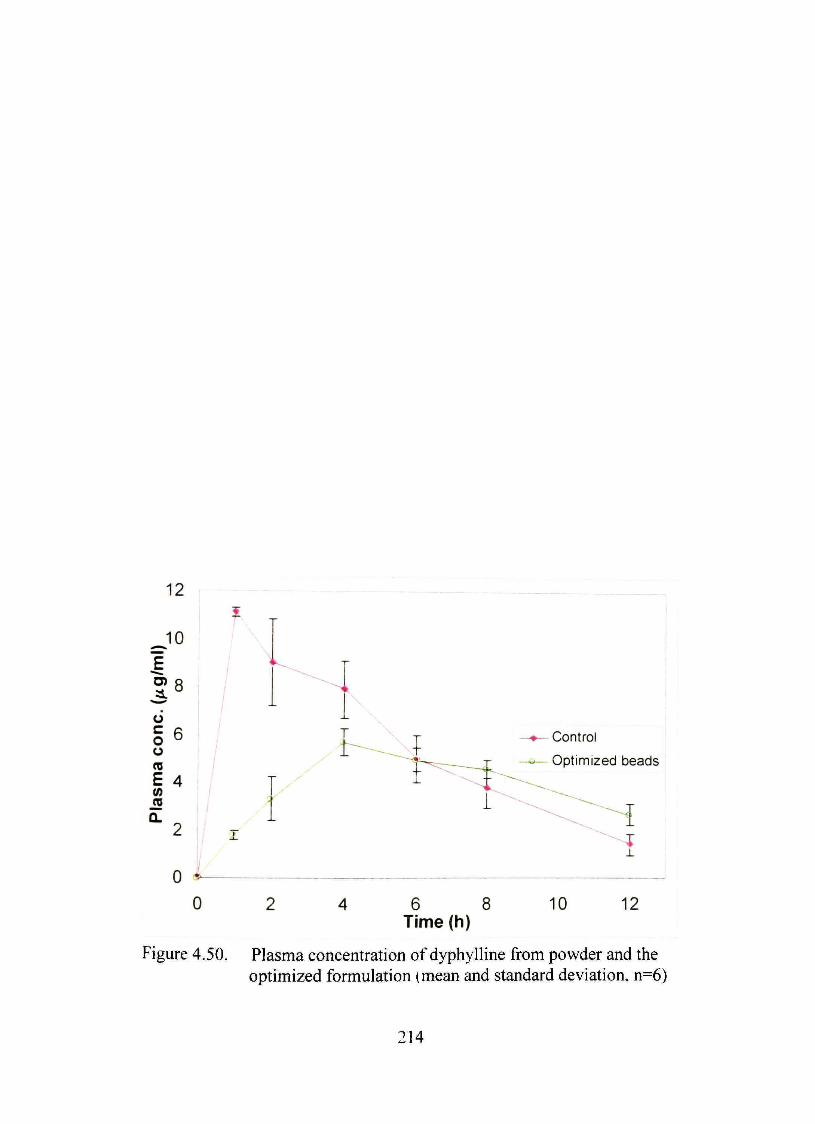
12
10
^ 8
u §6 o ns E 4 co
JS • ^ 2
0 *-
0
f V
\
•«— Control
^ ^ Optimized beads
/
6 8 Time (h)
10 12
Figure 4.50. Plasma concentration of dyphylline from powder and the optimized formulation (mean and standard deviation, n=6)
214
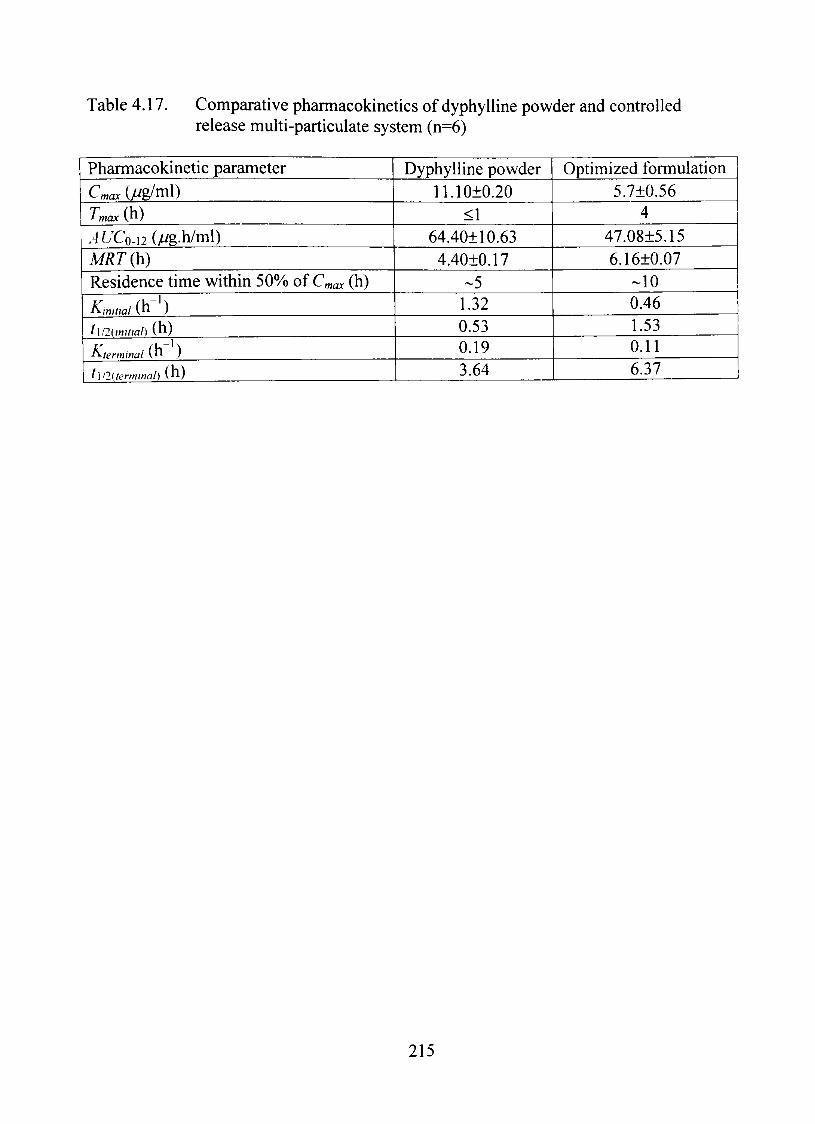
Table 4.17. Comparative pharmacokinetics of dyphylline powder and controlled release multi-particulate system (n=6)
Pharmacokinetic parameter
C„,ax (>"g/ml) Tmax (h) .46'Co-i2(/"g.h/ml) MRT(h) Residence time within 50% of Cmax (h)
K,„,i,al (h ) t\l2(,n,l,al) (h )
t^terminal (,n )
t\l2{tenmnal) ( h )
Dyphylline powder 11.10±0.20
<1 64.40±10.63
4.40±0.17 ~5 1.32 0.53 0.19 3.64
Optimized formulation 5.7±0.56
4 47.08±5.15 6.16±0.07
-10 0.46 1.53 0.11 6.37
215
decreased slowly, maintaining a steadier level. When the bead formulation was
administered, plasma level remained within 50% of the peak concentration (--5.55 //g/ml)
for about lOh. On the other hand, this value was only 5 h for the powdered dmg. Steady
plasma level of the controlled release product would be more evident from the mean
residence (MRT) value. It represents the average residence of each dmg molecule within
the body. The M7?rsignificantiy increased (p=7.17x10"^) when the optimized controlled
release product was administered. This proved the more retention of the dmg from the
bead formulation wdthin the body. MRTwas calculated using Equation 4.5. AUMCo-]2^
the area under the first moment curve was obtained by constmcting a plot of
concentration multiplied by time versus time and calculating the area under it. AUC is
called the area under the zero moment curve.
MRT^^^ (4.5, AUC
The rate constants and the half lives of involved pharmacokinetic processes are
also shown in Table 4.17.
From the results in can be concluded that for therapeutic purpose, a higher dose of
the optimized formulation should be administered, which will maintain a reasonable
plasma concentration of dmg for a much longer time, compared to the conventional
dosage forms.
216
CHAPTER V
CONCLUSIONS AND SUGGESTIONS FOR FURTHER STUDIES
Conclusions
The performed studies can be concluded in the following paragraphs.
Starch acetate was synthesized using paste disintegration method followed by
acetylation. Native com starch with 25% amylose was the most suitable starting material
to obtain high dS starch acetate. The method showed good yield. Synthesized starch
acetate ftiIfíUed the required properties in FTIR, X-ray and molecular mass analysis.
Starch acetate exhibited a pseudoplastic flow behavior in chloroform. It tended to be
Newtonian system at low polymer concentration. Starch acetate did not show surface
active property in chloroform.
Starch acetate produced good free films, especially with triacetin and triethyl
citrate. Mechanical properties and the glass transition temperature of the films could be
controlled by plasticizer concentrations of 30 to 100%. Tritium diffusion through the
films was dependent on the plasticizer concentration. The low permeability coefficient
indicated controUed release property of the polymer.
The model drug, dyphylline was found to be compatible with dmg loading
ingredients. These dmg loaded beads were used in the screening and optimization
designs.
Coating weight gain, plasticizer concentration and curing temperature were
observed to be the three most signifícant formulation and process variables that affected
217
overall drug release from the coated beads. Optimization by both RSM and ANN
produced formulation (10%) coating weight gain, 55% triacetin and 45 °C curing
temperature) that showed a fírst order release. Both the models analyzed and predicted
the data well (R^ above %).
The optimized formulation provided a stable product as indicated by thermal, X-
ray and FTIR analyses.
The surface roughness of the coated beads could be used as an indication of fílm
completion.
Dmg release from the optimized beads was unchanged in the presence of acidic
media or carbohydrate splitting enzyme, ûf-amylase.
In vivo study in rats showed that the formulation yielded sustained delivery of the
dmg compared to the control.
Suggestions for Further Studies
Multi-particulate bead formulations with anionic and cationic dmgs can be
prepared and dmg release can be studied and compared.
An aqueous based dispersion can be prepared from starch acetate and used to
obtain controlled release drug delivery systems.
Prospect of starch acetate as coating agent in gastrointestinal therapeutic systems
can be investigated.
After a complete preclinical study, human bioavailability study may be
performed.
218
BIBLIOGRAPHY
Agatonovic-Kustrin, S., Beresford, R. (2000). Basic concepts of artificial neural network (ANN) modeling and its application in pharmaceutical research. J Pharm Biomed Anal, 22. 717-727.
Akers, M.J. (1976). Preformulation testing of solid oral dosage form dmgs. Can J Pharm Sci, 11, 1-10.
Alhamami, O.M.O. (2003). Effects of oils and pharmaceutical excipients on the bioavailability of ampicillin orally administered, different oily and aqueous suspensions in rabbit. Dmg Dev Ind Pharm, 29, 51-60.
Anderson, J.M., Kim, S.W. (1984). Recent Advances in Dmg Deliverv Svstems. Plenum, New York, NY.
Anderson, V.L.. McLean, R.A. (1974). Design of Experiments: A Realistic Approach. Marcel Dekker, Inc, New York, NY.
Banker, G.S. (1966). Film coating theory and practice. J Pharm Sci. 55, 81-89.
Baro, M., Sanchez, E., Delgado, A., Perera, A., Evora, C. (2002). In vitro- in vivo characterization of gentamicin bone implants. J Control ReK 83, 353-364.
BASF technical information (2001).
Biliaderis, C.G. (1991). The stmcture and interactions of starch with food constituents. Canadian J Physiol Pharmacol 69, 60-78.
Bodmeier, R., Guo, X., Paeratakul, O. (1997). Process and formulation factors affecting the dmg release from pellets coated with the ethylcellulose pseudolatex Aquacoat. In: McGinity, J.W. (Ed.), Aqueous Polymeric Coating for Pharmaceutical Dosage Forms, Marcel Dekker, Inc, New York, NY. pp. 55-80.
Bodmeier, R., Paeratakul, O. (1994). The effect of curing on dmg release and morphological properties of ethylcellulose pseudolatex-coated beads. Dmg Dev IndPhann, 20, 1517-1533.
Bohidar, N.R., Bavitz, J.F., Shiromani, P.K. (1986). Formula optimization for a multiple potency system with uniform tablet weight. Dmg Dev Ind Pharm, 12. 1503-1510.
219
Bolton, S. (1997). Pharmaceutical Statistics: Practical and Clinical Applications. Marcel Dekker, Inc, New York, NY.
Box, G.E.P. (1957). Evolutionary operation: A method for increasing industrial productivity. Applied Statistics. 6, 81-101,
Box, G.E.P., Behnken, D.W. (1960). Some new three level designs for the study of quantitative variables. Technometrics. 2, 455-475.
Box, G.E.P., Draper, N.R. (1969). Evolutionary operation. A statistical method for process improvement. John Wiley and Sons, Inc, New York, NY.
Box, G.E.P., Draper, N.R. (1987). Empirical Model Building and Response Surfaces. John Wiley and Sons, Inc, New York, NY.
Box, G.E.P., Hunter, W.G., Hunter, J.S. (1978a). An introduction to design, data analysis and model building. In: Statistics for Experiments, John Wiley and Sons, Inc, New York, NY, pp. 374-418.
Box, G.E.P., Hunter, W.G., Hunter, J.S. (1978b). Design with more than one blocking variable. In: Statistics for Experiments. John Wiley and Sons, Inc, New York, NY. pp. 245-280.
Box, G.E.P., Wilson, K.B. (1951). On the experimental attainment of optimum conditions. J Roval Statistical Society, 13, 1-45.
Boyer, R.F. (1949). The compatibility, efficiency and permanence of plasticizers. J Applied Phvsics. 20, 540-552.
Brookfield digital viscometer model DV-E operating instmctions manual, No. m/98-350-D0902, Brookfield Engineering Laboratories. Inc. Mariboro, MA.
Butier. J., Cumming, L, Brown, J., Wilding, L, Devane, J.G. (1998). A novel multiunit controlled-release system, Pharm TechnoK 22, 122-138.
Castile, J.D., Taylor, K.M., Buckton, G. (1999). High senshivity differential scanning calorimetry study of the interaction between poloxamers and dimyristoylphosphatidylcholine and dipalmitoylphosphatidylcholine liposomes. Int J Pharm. 182,101-110.
Chen, Y.. McCaU, T.W., Baichwal, A.R., Meyer, M.C. (1999). The application of an artificial neural network and pharmacokinetic simulations in the esign of controUed-release dosage forms. J Control Rel 59-33-41.
220
Chien, Y.W. (1982). Novel Dms Deliverv Svstems: Fundamentals, Developmental Concepts and Biomedical Assessments. Marcel Dekker, New York, NY.
Davis, S.S. (1986). Evaluation of the gastrointestinal transh of pharmaceutical dosage forms using the technique to gamma scintigraphy. STP Pharma Pratiques, 2, 1015-1022.
Dawoodbhai, S., Suryanarayanan, E.R., Woodmff, C.W., Rhodes, C.T. (1991). Optimization of tablet formulations containing talc Dmg Dev Ind Pharm. 17, 1343-1371.
Deasy, P.B. (1984). Microencapsulation and Related Dmg Processes. Marcel and Dekker, Inc, New York, NY.
Dressman, J.B., Palsson B.O., Ozturk, A, Ozturk, S (1994). Mechanisms of release from coated pellets. In: Ghebre-Sellassie, I. (Ed.). Microparticulate Oral Dmg Delivery. Marcel Dekker, Inc, New York, NY, 285-306.
Drucker, R. (2001). Dmg Delivery Technologies: Innovations and Market Challenges. PJB Publications Ltd.
Ebube, N.K., Owusu-Ababio, G., Adeyeye, C.M. (2000). Preformation studies and characterization of the physicochemical properties of amorphous polymers using artificial neural networks. Int J Pharm, 196, 27-35.
EMEA (The European Agencv for the Evaluation of Medicinal Products) (1998). Diprophylline, summary report. Committee for Veterinary Medicinal Products, London, England, April.
Eskilson, C. (1985). Controlled release by microencapsulation. Manufacturing Chemist. 56, 33-39.
FDA (1995). Guidance for industry: immediate release solid oral dosage forms; scale-up and post-approval changes: chemistry, manufacturing and controls, in vitro dissolution testing and in vivo bioequivalence documentation. Center for Dmg Evaluation and Research, Rockville, MD.
FDA (1997a). Guidance for industry: dissolution testing of immediate release solid oral dosage forms. Center for Dmg Evaluation and Research, Rockville, MD.
FDA (1997b). Guidance for industry: extended release solid oral dosage forms; development, evaluation and application of in vitro/ in vivo correlations. Center for Dmg Evaluation and Research, Rockville, MD.
221
FDA (1997c). Guidance for industry: modified release solid oral dosage forms; scale-up and post-approval changes: chemistry, manufacturing and controls, in vitro dissolution testing and in vivo bioequivalence documentation. Center for Dmg Evaluation and Research, Rockville, MD.
Felton, L.A., McGinity, J.W. (1999). Adhesion of polymeric films to pharmaceutical solids. Eur J Pharm Biopharm. 47, 3-14.
Fonner, D.E., Jr., Buck, J.R., Banker, G.S. (1970). Mathematical optimization techniques in dmg product design and process analysis. J Pharm Sci. 1970, 59, 1587-1596.
Ford, J.L., Timmins, P. (1989). Pharmaceutical Thermal Analvsis: Techniques and Applications. Ellis Horwood Limited, New York, NY, pp. 238-247.
Frohoff-Hulsmann, M.A., Schmitz, A., Lippold, B.C. (1999) Aqueous ethylcellulose dispersions containing plasticizers of different water solubility and hydroxypropyl methyl cellulose as coating material for diffusion pellets. Part I. Int J Pharm, 177, 69-82.
Gao. J.Z, Jain, A., Motherram, R., Gray, D.B., Hussain, M.A. (2002). Fluid bed granulation of a poorly soluble, low density, micronized dmg: comparison with high shear granulation. Int J Pharm, 237, 1-14.
Giammona, G., Carlisi, B., Cavallaro, G., Donato, I., Liveri, V.T. (1990). Calorimetric investigation of the interaction between a,yS-poIy(N-hydroxyethyI)-DL-aspartame and surfactants. Int J Pharm, 64, 239-242.
Gohel, M.C., Gopi, M.R., Shah, A., Momin, S.R., Gandhi, K.B. (1994). Application of simplex analysis for development of dispersible tablets of cyproheptadiene hydrochloride. Indian J Pharm Sci, 56, 24-27.
Gohel, M.C., Patel, T.P., Bariya, S.H. (2003). Studies in preparation and evaluation of pH-independent sustained-release matrix tablets of verapamil HCI using directly compressible Eudragits. Pharm Dev Technol, 8, 323-333.
Goodhart, F.W., Harris, M.R., Murthy, K.S., Nesbitt, R.O. (1984). An evaluation of aqueous film forming dispersions for controlled release. Pharm Tech. 8, 64-71.
Guo, J.H. (1994). An investigation into the formation of plasticizer channels in plasticized polymer film. Dmg Dev Ind Pharm. 20, 1883-1893.
222
Gumy, R., Buri, P., Sucker, H., Guitard, P., Leuenberger, H. (1977). Relation and development of controlled release medications using methacrylate films 2. Study using orthogonal analysis of the factors affecting diffiision across a planar film. Pharmaceutica Acta Helvetiae 52, 175-181.
Hanson, G.R. (1995). Respiratory dmgs. In: Gennaro, A.R. (Ed.), Remington: The Science and Practice of Pharmacy. Mack Publishing Co., Easton, PA, pp. 971-980.
Henrist, D., Lefebvre, R.A., Remon, J.P. (1999). Bioavailability of starch based hot stage extmsion formulations. Int J Pharm, 187, 185-191.
Henry, C.M. (2000). Special delivery: altemative methods for delivering drugs improve performance, convenience and patient compliance. Chem Eng News, 78, 49-65.
Hermann, J., Remon, J.P. (1989). Modified starches as hydrophilic matrices for controUed oral delivery. 11. In-vitro dmg release evaluation of thermally modified starches. Int J Pharm, 56, 51-70.
Hermann, J., Remon, J.P. (1990). Modified starches as hydrophilic matrices for controlled oral delivery. III. Evaluation of sustained release of theophylline formulation based on thermal modified starch matrices in dogs. Int J Pharm, 63, 201-205.
Hincal, A.A., Kas, H.S. (1994). Preparation of micropellets by spray congealing. In: Ghebre-Sellassie, I. (Ed.), Multi-particulate Oral Dmg Deliverv, Marcel Dekker, Inc, New York, pp. 17-34
Hixson, A.W., Crowell, J.H. (1931). Dependence of reaction velocity upon surface and agitation: I. Theoretical considerations. Ind Eng Chem. 23, 923-931.
http://anka.livstek.Ith.se:2080/microscopv/f-starch.htm
http://www.foodproductdesign.com/archive/1996/0196CS.html
http://www.lsbu.ac.uk/water/hvsta.html
Immergut, E.H., Mark, H.F. (1965). Principles of plasticization. In: Gould, R.F. (Ed.),
Plasticization and Plasticizer Process. John Wiley and Sons, Inc. New York, NY. 1-25.
Jian-Hwa, G. (1994). A theoretical and experimental study of additive effects of physical aging and antiplasticization on the water permeability of polymer film coatings. J Pharm Sci, 83, 447-449.
223
Johnson, A.D.. Anderson, V.L., Peck, G.E. (1990). Statistical approach for the development of an oral controlled-release matrix tablet. Pharm Res, 7, 1092-1097.
Kamachi, A.A., Dehon, R.A., Khan, M.A. (1995). Plackett-Burman screening of micromatrices with polymer mixtures for controUed dmg delivery. Pharmazie, 50,550-553.
Kermani, F., Findlay, G. (2001). Novel drug delivery technologies: a prospective from the pharmaceutical industry. Am Pharm Outsourcing, Jan/Feb, 22-29.
Kester, M.B., Saccar, C.L., Mansmann, H.C. Jr. (1987). Microassay for the simultaneous determination of theophylline and dyphylline in serum by high-performance Hquid chromatography. J Chromatographv. 416, 91-97.
Keutz, S.S., Sweely, J.S., Stout, W.J. (1965). Plasticizers for mbber and related polymers. In: Bmins, P.F. (Ed.), Plasticizer Technologv, Reinhold Inc, New York, NY, pp. 21-185.
Khan, M.A., lyer, B.V., Cirelh, R.A., Vasavada, R.C. (1984). In vitro release of salicylic acid from lanolin-alcohoIs-EC films, J Pharm Sci, 73, 302-305.
Khan, M.A., Kamachi, A.A., Singh, S.K., Sastry, S.V., Kislalioglu, S.M., Bolton, S. (1995). Controlled release coprecipitates: formulation considerations. J Control Rel 37, 131-141.
Khan, M.A., Sastry, S.V., Vaithiyahngam, S.R., Agarwal, V., Nazzal, S., Reddy, I.K. (2000). Captopril gastrointestinal therapeutic system coated with cellulose acetate pseudolatex: evaluation of main effects of several formulation variability. Int J Pharm, 193, 147-156.
Knoch, A. (1994). Cryopelletization. In: Ghebre-Sellassie, I. (Ed.), Microparticulate Oral Dmg Deliverv, Marcel Dekker, Inc, New York, NY, 35-50.
Korhonen, O., Pohja, S., Peltonen, S., Suihko, E., Vidgren, M., Paronen, P., Ketolainen, J. (2002). Effects of physical properties for starch acetate powders on tabletting. AAPS PharmSci Tech, 3, article 34.
Korhonen, O., Raatikainen, P., Harjunen, P., Nakari, J., Suihko, E., Peltonen, S., Vidgren, M., Paronen, P. (2000). Starch acetates- multifunctional direct compression excipients. PharmRes, 17, 1138-1143.
Krogars, K., Heinaemaeki, J., Karjalainen, M., Niskanen, A., Ylimusi, J. (2003). Enhanced stability of mbbery amylase-rich maize starch films plasticized with a combination of sorbitol and glycerol. Int J Pharm, 251, 205-208.
224
Kruger, L.H., Rutenberg, M.W. (1967). Production and uses of starch acetates. In: Whistler, R.L., Paschall, E.F. (Eds.), Starch: Chemistrv and Technologv. Academic Press, New York, 389-401.
Kyroudis, A., Markantoonis, S.L., Beckett, A.H. (1989). Effect of food on the movement of pellets in gastrointestinal tract. Pharmaceutisch Weekblad- Scientific Edition. 11,44-49.
Lehmann, K., Bossler, N.M., Dreher, D. (1978). Controlled dmg release from small particles encapsulated with acrylic resins. In: Kostelink, R.J. (Ed.). Midland Macromolecular Monographs. Gordon and Breach Science Publishers, pp. 146-265.
Lehmann, K., Dreher, D. (1981). Coating of tablets and small particles with acrylic resins by fluidized-bed technology. Int J Pharm Tech Prod Manufacture. 2. 31-45.
Lever, A.E., Rhys, J.A. (1968). The properties and testing of plastic materials. Temple Press Books, London, England.
Lewis, G.A., Mathieu, D., Phan-Tan-Luu, R. (1999). Pharmaceutical Experimental Design. Marcel Dekker, Inc, New York, NY.
Li. S.F., Lin, S.S.. Daggy, B.P., Mirchandani, H.L., Chien, Y.W. (2003). Effect of HPMC and carbopol on the release and floating properties of gastric floating dmg delivery system using factorial design. Int J Pharm, 253, 13-22.
Li, V.H.K., Lee, V.H.L., Robinson, J.R. (1987). Influence of dmg properties and routes of dmg administration on the design of sustained and controlled release systems. In: Robinson, J.R., Lee, V.H.L. (Eds.). ControUed Dmg Delivery Fundamentals and Applications, Marcel Dekker, Inc, New York, NY. 3-94.
Lippold, B.C.. Lippold, B.H.. Sutter, B.K., Gunder, W. (1990). Properties of aqueous, plasticizer-containing ethyl cellulose dispersions and prepared films in respect to the production of oral extended release formulations. Dmg Dev Ind Pharm. 16, 1725-1747.
Lorck, C.A., Gmnenberg, P.C. Junger, H., Laicher. A. (1997). Influence of process parameters on sustained release theophylline pellets coated with aqueous polymer dispersions and organic solvent based polymer solutions. Eur J Pharm Biopharm, 43, 149-157.
Lordi, N.G. (1986). Sustained release dosage forms. In: Lachman, L., Liberman, H.A., Kanig, I.L. (Eds.), the Theory and Practice of Industrial Pharmacy, Lea and Febiger, Philadelphia, PA, pp. 430-456.
225
Lyne, C.W., Johnston, H.G. (1981). The selection of pelletisers. Powder Technol. 29 211-216.
Makee, I.K., Herbst, W. (1962). Tablet disintegrants. US Patent 3.034.911.
Mark, A.M.. Mehltretter, C.L. (1974). Process for making starch triacetates. US Patent 3,795,670.
Martin, A. (1993). Physical Pharmacv. Lea and Febiger, Philadelphia, PA.
Mclean, R.A., Anderson, V.L. (1966). Extreme vertices design of mixture experiments. Technometrics. 8, 447-454.
Mehta, A.M., Jones, D.M. (1985). Coated Pellets under the microscope. Pharma Tech, 9. 52-60.
Mehta, A.M., Valuzza, M.I., Abele, S.E. (1986). Evaluation of fluid-bed processes for enteric coating systems. Pharm Tech, 1986, 10, 46-56.
Monkhouse, D.C., Van Campen, L. (1984). Solid state reactions- theoretical and experimental aspects. Dmg Dev Ind Pharmacv, 10, 1175-1276.
Montgomery, D.C. (1991). Design and Analvsis of Experiments. John Wiley and Sons, Inc, New York, NY.
Moore, J.W., Flanner, H.H. (1996). Mathematical comparison of dissolution profiles. Pharm Technol, 20, 64-74.
Mullen, J.W., Pacsu, E (1942). Starch studies- preparation and properties of starch trimesters. Ind Eng Chem, 34, 1209-1217.
Murray, J. (1992). X-Stat", Version 2.0: Statístical Experimental Design, Data Analvsis and Nonlinear Optimization. John Wiley and Sons, Inc, New York, NY.
Nadkami, P.D., Kildsig, D.O., Kramer, P.A., Banker, G.S. (1975). Effect of surface roughness and coating solvent on film adhesion to tablets. J Pharm Sci, 64, 1554-1557.
Nakano, M., Nakazono, N., Inotsume, N. (1987). Preparation and evaluation of sustained release tablets prepared with a-starch. Chem Pharm Bull, 35, 4346-4350.
226
Nazzal, S., Nutan, M., Palamakula, A., Shah, R., Zaghloul, A.A., Khan, M.A. (2002) Optimization of a self-nanoemulsified tablet dosage form of Ubiquinone using response surface methodology: effect of formulation ingredients. Int J Pham, 240, 103-114.
Ogawa, K., Hirai, L, Shimasaki, C , Yoshimura, T., Ono, S., Rengakuji, S., Nakamura, Y., Yamazaki, I. (1999). Simple determination method of degree of substitution for starch acetate. Bull Chem Soc Jpn, 72, 2785-2790.
Parikh, D.M. (1991). Airflow in batch fluid-bed processing. Pharm Tech, 15. 100-110.
PDR (Physicians' Desk Reference). (2002). Medical Economics Company, Inc, Montvale.
Peat, S., Whelan, W.J., Thomas, G.J. (1952). Evidence of multiple branching in waxy maize starch. J Chem Soc 4546-4548.
Peppas, N.A. (1995). Mathematical models for controlled release kinetics. In: Langer, R., Wise, D. (Eds.), Medical Application of ControIIed Release Technology: Applications and Evaluations, vol. II., CRS Press, Boca Raton, FL, pp. 169-187.
Perthometer Concept® manual. Cincinnati, OH.
Plackett, R.L., Burman, J.P. (1946). The design of optimum multifactorial experiments. Biometrika, 33, 305-325.
Pohja, S.. Suihko, E., Vidgren, M., Paronen, P., Ketolainen, J. (2004). Starch acetate as a tablet matrix for sustained dmg release. J Control Rel, 94, 293-302.
Rahmouni, M., Chouinard, F., Nekka, F., Lenaerts, V., Leroux, J.C (2001). Enzymatic degradation of cross-linked high amylase starch tablets and its effect on in vitro release of sodium diclofenac Eur J Pharm Biopharm, 51, 191-198.
Ripley, B.D. (1996). Pattem Recognitíon and Neural Networks. Cambridge University Press, Cambridge, England.
Robinson, N.J., Gross, G.M., Lontz, R.J. (1968). An apparatus and method for coating of solid particles. J Pharm Sci, 57, 1983-1987.
Rowe, R.C (1984). Materials used in the film coating of oral dosage forms. In: Florence, A.T. (Ed.), Materials Used in Pharmaceutical Formulation, Blackwell Scientific Publications, Oxford, England, pp. 1-36.
227
Rowe, R.C (1978). The effect of some formulation and process variables on the surface roughness of film coated tablets. J PharmPharmacol. 30, 669-672.
Sakellariou, P., Row, R.C, White, E.F.T. (1985). The thermo-mechanical properties and glass transition temperatures of some cellulose derivatives used in film coating Int J Pharm. 27, 267-277.
Sam, T. (1985). Oral sustained release drug delivery: pellets or tablets. Pharmacv Intemational. 11, 265-266.
Sastry, S.V., Wilber, W., Reddy. I.K., Khan, M.A. (1998). Aqueous based polymeric dispersion: preparation and characterization of cellulose acetate pseudolatex. I n y Pharm, 165, 175-189.
Schiermeier, S., Schmidt, P.C (2002). Fast dispersible ibuprofen tablets. Eur J Pharm Sci, 15,295-305.
Sears, J.K., Darby, J.R. (1982). Mechanism of plasticizer action. In: the Technology of Plasticizers, John Wiley and Sons, Inc, New York, NY, 35-74.
Serajuddin, A.T., Thakur, A.B., Ghoshal, R.N.. Fakes, M.G., Varia, S.A. (1999). Selection of solid dosage form composition through dmg-excipient compatibility testing. J Pharm Sci, 88, 696-704.
Shivakumar, H.N., Suresh, S., Venkataram, S. (2002). Design and evaluation of a multiparticulate system for chronotherapeutic delivery of diclofenac sodium. Indian J Pharm Sci, 64, 133-137.
Short, R.W.P., Verbanac, F. (1978). Starch suitable for direct compression of tablets. US Patents 3,622,677 and 4,072,535.
Simons, K.J., Simons, E.R., Bierman, C.W. (1977). Bioavailability of a sustained-release dyphylline formulation. J Clin Pharmacol, 17, 237-242.
Simons, K.J., Simons, E.R. (1979). Urinary excretion of dyphylline in humans. J Pharm Sci,68, 1327-1329.
Singh, S.K., Dodge, J., Durrani M.J., Khan, M.A. (1995). Optimization and characterization of controlled release pellets coated with an experimental latex: I. Anionic dmg. Int J Pharm, 125, 243-255.
Sinko, C.M., Amidon, G.L. (1989). Plasticizer-induced changes in the mechanical rate of response of film coatings: approach to quantitating plasticizer effectiveness. Int J Pharm, 55, 247-256.
228
Strea-I® operation manual. Niro Incorporated, Columbia, MD.
Suryanarayanan, R. (1995). X-ray powder diffractometry. In: Swarbrick, J. (Ed.), Physical Characterization of Pharmaceutical Solids. Marcel Dekker Wilmington DE,pp. 187-221. '
Takayama, K., Imaizumi, H., Nambu, N., Nagai, T. (1985). Mathematical optimization of formulation of indomethacin/ polyvinylpyrrolidone/ methyl cellulose solid dispersion by the sequential unconstrained minimization technique. Chem Pharm Bull, 33, 292-300.
Tarvainen, M., Peltonen, S., Mikkonen, H., Elovaara, M., Tuunainen, M., Paronen, P., Ketolainen, J., Sutinen, R. (2004). Aqueous starch acetate dispersion as a novel coating material for controlled release products. J Control Rel, 96, 179-191.
Tarvainen, M., Sutinen, R., Peltonen, S., Tiihonen, P., Paronen, P. (2002). Starch acetate-a novel film-forming polymer for pharmaceutical coatings. J Pharm Sci, 91. 282-289.
Tmbiano, P.C, Somerville, N.J. (1983). Low swelling starches as tablet disintegrants. US Patent 4,369,308.
Tuovinen, L., Peltonen, S., Jarvinen, K. (2003). Dmg release from starch-acetate films. J ControlRel 91. 345-354.
USP (United States Pharmacopeia) 24, National Formularv 19 (2000). National Publishing, Philadelphia, PA, pp. 2231-2232.
Vaithiyalingam, S., Khan, M. (2002). Optimization and characterization of controUed release multi-particulate beads formulated with a customized cellulose acetate butyrate dispersion. Int J Pharm, 234, 179-193.
Vaithiyalingam, S., Nutan, M., Reddy, L, Khan, M. (2002). Preparation and characterization of a customized cellulose acetate butyrate dispersion for controlled dmg delivery. J Pharm Sci, 91, 1512-1522.
Vaithiyalingam, S., Zaghloul, A.A., Reddy, I.K., Khan, M.A. (2000). Artifícial neural network and simplex optimization for mixing of aqueous-coated beads to obtain controlled release formulations. Pharm Tech, June, 60-72.
Van Aerde, P., Remon, J.P. (1988). In-vitro evaluation of modified starches as matrices for sustained release dosage forms. Int J Pharm, 45, 145-152.
229
van Weeren, R., Gibboni, D.J. (2003). Barrier packaging as an integral part of dmg delivery. Dmg Deliverv Technology, 3, article 52.
Verma, P.K., Garg, S. (2001). Current status of drug delivery technologies and future directions. Pharm Tech, 25, 1-14.
Wang, D.P., Yang, M.C, Wong, C.Y. (1997). Formulation development of oral controUed release pellets of diclofenac sodium. Dmg Dev Ind Pharm, 23, 1013-1017.
Wang, S., Cui, F., Yonezawa, Y., Sunada, H. (2003). Preparation and evaluation of high drug content particles. Drug Dev Ind Pharm, 29, 1109-1118.
Wolff, I.A., Olds, D.W., Hilbert, G.E. (1951). The acetylation of com starch, amylase, amylopectin. J Am Chem Soc, 73, 346-349.
Wurster, D.E. (1949). Method for applying coatings to edible tablets or the like. US Patent 2,648,609.
Wurster, D.E. (1959). Air-suspension technique of coating dmg particles, preliminary report. J Am Pharm Asso, 48, 451-454.
Yamaguchi, Y., Sugibayashi, K„ Takeda, T., Morimoto, Y. (1995). Release of clonidine hydrochloride from pressure-sensitive adhesive matrices prepared by emulsion-type acrylate polymers. Chem Pharm Bull, 43, 1807-1809.
Zhang, G., Schwartz, J.B., Schnaare, R.L. (1991). Bead coating I. Change in release kinetics (and mechanism) due to coating level. Pharm Res, 8, 331-335.
Zupan, J., Gasteiger, J. (1992). Neural networks: a new method for solving chemical problems or just a passing phase? Anal Chim Acta, 248, 1-30.
Zurada, J.M. (1992). Introduction to Artificial Neural Svstem. PWS Publishing Company, Boston, MA.
230