dissertation chauner | supervisor: prof. dr. torsten ...file/... · technology-derived services...
TRANSCRIPT

Technology-Derived ServicesConception, Acceptance, and Business Impact
D I S S E R T A T I O N
of the University of St.Gallen,
School of Management,
Economics, Law, Social Sciences
and International Affairs
to obtain the title of
Doctor of Philosophy in Management
submitted by
Christian Hauner
from
Germany
Approved on the application of
Prof. Dr. Torsten Tomczak
and
Prof. Dr. Andreas Herrmann
Dissertation no. 4404
Rosch-Buch, Schesslitz 2015

The University of St.Gallen, School of Management, Economics, Law, Social Sciences and In-
ternational Affairs hereby consents to the printing of the present dissertation, without hereby
expressing any opinion on the views herein expressed.
St.Gallen, May 19, 2015
The President:
Prof. Dr. Thomas Bieger

Fur meine Familie
Maci, Sonja, Helmut, Nici, Alex, Gitta, Karl und Alex


Vorwort
Die Promotion an der Universitat St.Gallen war fur mich eine ganz besondere Erfahrung. Die
vorliegende Dissertation ist das Ergebnis dieser unglaublich spannenden und lehrreichen Zeit.
Gerne mochte ich denjenigen Menschen danken, die mich hierbei begleitet und unterstutzt
haben.
In erster Linie mochte ich meinem Doktorvater, Prof. Dr. Torsten Tomczak danken. Seine
personliche und fachliche Unterstutzung haben das Gelingen dieser Dissertation uberhaupt erst
moglich gemacht. Weiterhin mochte ich meinem Ko-Referenten Prof. Dr. Andreas Herrmann
danken, der mich als akademischer Mentor beim Entstehen dieser Arbeit intensiv begleitet hat.
Danken mochte ich auch meinen Kollegen an der Forschungsstelle fur Customer Insight: Dr.
Lucas Beck, Dr. des Emanuel de Bellis, Dennis Esch, Dr. Christian Hildebrand, Dr. Marcel
Mazur, Jessica Mueller-Stewens und Maik Walter. Ganz besonderen Dank mochte ich in diesem
Zusammenhang Dr. Tobias Schlager aussprechen, der stets ein offenes Ohr fur mich hatte und
mir jederzeit mit Rat und Tat zur Seite stand.
Außerordentlicher Dank gilt einem ganz besonderen Menschen: Meiner Freundin, Marcella
Grohmann. Sie ist immer fur mich da und gibt mir immer Ruckhalt, besonders in schwierigen
Zeiten. Ich bin sehr froh, diesen einzigartigen Menschen gefunden zu haben.
Der großte Dank gilt meiner Mutter, Sonja Hauner, meinem Vater, Helmut Hauner, und meiner
Schwester, Nicole Hauner. Ihr unerschutterlicher Glaube in meine Fahigkeiten, ihre grenzen-
lose Unterstutzung und ihre unermessliche Liebe haben mir immer wieder Kraft gegeben, meine
Ziele zu verfolgen und meine Traume zu verwirklichen. Ich bin sehr stolz, diese besonderen
Menschen als Eltern und Schwester zu haben.


Abstract
This thesis introduces a new type of services, Technology-Derived Services (TDS). TDS are in-
telligent products with an innate IT-based capability to autonomously operate and are therefore
providing value directly to the customer without any necessary interaction during the value cre-
ation process of its user or its manufacturer. From a customer’s point of view, two distinct fields
of application arise: employing TDS in an object-related or in a person-related context. Despite
their rapid growth on the market, TDS have not drawn academia’s attention yet. To address
this issue, this thesis comes up with a new acceptance model for TDS, which was derived from
literature reviews on technology and service acceptance. Results of two studies give empirical
evidence for the validity and reliability of new measurements, namely anticipated temporal dis-
charge, perceived service safety, and perceived controllability as well as the nomologic validity
of the proposed acceptance model for TDS. When TDS are applied in an object-related context,
customers’ attitude towards using the TDS is positively influenced by their anticipated temporal
discharge and their perceived controllability. In contrast, when TDS are applied in a person-
related context, the positive effect of perceived controllability on customers’ attitude towards
using TDS is mediated by perceived service safety. Anticipated temporal discharge has also a
positive effect on customers’ attitude towards using TDS in a person-related context. Study 3
examines customers’ evaluation of TDS in comparison to conventional products and services.
The results show that TDS are generally perceived as providing lower quality than conventional
services and products. Nevertheless, customers are aware of the advantage of TDS, namely
time saving, as they anticipate the same temporal discharge for TDS compared to conventional
services and higher temporal discharge compared to conventional products. Finally, results also
reveal that customers’ attitude towards TDS is positively influenced by anticipated quality and
anticipated temporal discharge. To sum up, the author contributes to research by conceptualiz-
ing TDS, establishing a new acceptance model for TDS, and providing a theoretical framework
to compare customers’ evaluations of TDS with conventional products and services. Finally,
the thesis comes up with first managerial implications for TDS and provides a future research
agenda in the field of TDS.

Zusammenfassung
Die vorliegende Arbeit befasst sich mit einer neuen Art von Services, den Technology-Derived
Services (TDS). TDS basieren auf Produkten, die aufgrund von IT-basierten Funktionalitaten
in der Lage sind, autonom zu operieren und somit dem Kunden direkten Nutzen stiften. Dabei
ist wahrend der Leistungserbringung keine Interaktion des Kunden oder des Herstellers mehr
notwendig. Aus Kundensicht konnen TDS in objekt-bezogenen oder in personen-bezogenen
Anwendungen eingesetzt werden. Entgegen des immer schneller werdenden Marktwachstums,
wurden TDS in der bisherigen Forschung noch nicht naher untersucht. Um diese Lucke zu
schliessen, wird ein Akzeptanzmodell fur TDS, basierend auf bisherigen Erkenntnissen zur
Technologie- und Service-Akzeptanz, erarbeitet. Die Ergebnisse zweier Studien bestatigen die
Validitat und Reliabilitat der neu eingefuhrten Skalen erwartete Zeitersparnis, wahrgenommene
Kontrollierbarkeit und wahrgenommene Service-Sicherheit und die nomologische Validitat des
abgeleiteten Akzeptanzmodells fur TDS. Bei objekt-bezogenen Anwendungen wird die Ein-
stellung gegenuber der Nutzung von TDS positiv von der erwarteten Zeitersparnis und der
wahrgenommenen Kontrollierbarkeit beeinflusst. Im Gegensatz dazu wird bei personen- be-
zogenen Anwendungen der positive Einfluss von wahrgenommener Kontrollierbarkeit auf die
Einstellung gegenuber der Nutzung von TDS durch die wahrgenommene Service-Sicherheit
mediiert. Die erwartete Zeitersparnis hat auch bei personen-bezogenen Anwendungen einen
positiven Einfluss auf die Einstellung gegenuber der Nutzung von TDS. In einer weiteren Studie
werden TDS mit bestehenden, konventionellen Produkten und Services verglichen. Die Ergeb-
nisse der Studie zeigen dabei, dass Konsumenten die Qualitat von TDS im Vergleich zu konven-
tionellen Produkten und Services generell negativer bewerten. Die erwartete Zeitersparnis wird
von Kunden bei TDS und konventionellen Services als gleichwertig angesehen. Im Vergleich
zu konventionellen Produkten nehmen Kunden eine signifikant hohere Zeitersparnis bei TDS
wahr. Die Einstellung der Kunden gegenuber TDS wird positiv von der erwarteten Zeiterspar-
nis sowie der wahrgenommenen Qualitat beeinflusst. Die vorliegende Arbeit leistet mit einem
neuen Akzeptanzmodell fur TDS, einem neuen theoretischen Rahmen zur Vergleichbarkeit von
TDS mit konventionellen Services und Produkten sowie einer Research-Agenda einen wis-
senschaftlichen Beitrag und leitet entsprechende Handlungsempfehlungen fur die Praxis ab.

Contents
Contents
List of Tables . . . . . . . . . . . . . . . . . . . . . . . . . . . . . . . . . . III
List of Figures . . . . . . . . . . . . . . . . . . . . . . . . . . . . . . . . . V
List of Abbreviations . . . . . . . . . . . . . . . . . . . . . . . . . . . . . . VI
1 Introduction. . . . . . . . . . . . . . . . . . . . . . . . . . . . . . . . . 11.1 Problem Setting . . . . . . . . . . . . . . . . . . . . . . . . . . . . . 1
1.2 Research Questions . . . . . . . . . . . . . . . . . . . . . . . . . . . 2
1.3 Structure of the Dissertation. . . . . . . . . . . . . . . . . . . . . . . . 3
2 Technology-Derived Services: Blurring the distinction between products andservices . . . . . . . . . . . . . . . . . . . . . . . . . . . . . . . . . . . 52.1 Products . . . . . . . . . . . . . . . . . . . . . . . . . . . . . . . . 5
2.1.1 Product Types . . . . . . . . . . . . . . . . . . . . . . . . . . 6
2.1.2 Intelligent, autonomous operating products: Services included . . . . . 8
2.2 Services . . . . . . . . . . . . . . . . . . . . . . . . . . . . . . . . 9
2.2.1 Service transition: The Next Level . . . . . . . . . . . . . . . . . 10
2.2.2 Technology-Derived Services: A New Type of Service Innovation and
Definition . . . . . . . . . . . . . . . . . . . . . . . . . . . . 11
3 Advancing towards a New Service Classification . . . . . . . . . . . . . . . . 133.1 Service-Provision: Assisted or Derived . . . . . . . . . . . . . . . . . . . 13
3.2 Service-Relatedness: Human or Object . . . . . . . . . . . . . . . . . . . 15
4 Literature Review on Technology and Service Acceptance . . . . . . . . . . . 174.1 Technology Acceptance . . . . . . . . . . . . . . . . . . . . . . . . . 17
4.1.1 Models for Technology Acceptance . . . . . . . . . . . . . . . . . 17
4.1.2 Shortcomings in the light of Technology-Derived Services . . . . . . . 20
I

Contents
4.2 Service Acceptance . . . . . . . . . . . . . . . . . . . . . . . . . . . 21
4.2.1 Evaluation of Services . . . . . . . . . . . . . . . . . . . . . . . 21
4.2.2 Drawbacks of Evaluation for Technology-Derived Services. . . . . . . 23
5 Assessing the Acceptance of Technology-Derived Services . . . . . . . . . . . 245.1 Conceptualizing the Acceptance Model for Technology-Derived Services. . . . 24
5.1.1 Attitude towards using the TDS . . . . . . . . . . . . . . . . . . . 25
5.1.2 Anticipated Temporal Discharge . . . . . . . . . . . . . . . . . . 25
5.1.3 Perceived Service Safety . . . . . . . . . . . . . . . . . . . . . . 26
5.1.4 Perceived Controllability . . . . . . . . . . . . . . . . . . . . . . 28
5.2 Empirical Evaluation of the Acceptance Model for Technology-Derived Ser-
vices . . . . . . . . . . . . . . . . . . . . . . . . . . . . . . . . . . 31
5.2.1 Study 1: New Construct Validation . . . . . . . . . . . . . . . . . 31
5.2.1.1 Data Collection and Measurement . . . . . . . . . . . . . . 31
5.2.1.2 Results . . . . . . . . . . . . . . . . . . . . . . . . . . . . . 33
5.2.1.3 Discussion . . . . . . . . . . . . . . . . . . . . . . . . . . . 38
5.2.2 Study 2: Validation of the Acceptance Model for TDS . . . . . . . . . 40
5.2.2.1 Data Collection and Measurement . . . . . . . . . . . . . . 40
5.2.2.2 Results . . . . . . . . . . . . . . . . . . . . . . . . . . . . . 40
5.2.2.3 Discussion . . . . . . . . . . . . . . . . . . . . . . . . . . . 47
6 Business Impact of Technology-Derived Services . . . . . . . . . . . . . . . . 496.1 Theoretical Background and Hypotheses . . . . . . . . . . . . . . . . . . 49
6.2 Study 3: Effects of TDS on classic product and service businesses . . . . . . . 52
6.2.1 Design, Procedure, and Data Collection . . . . . . . . . . . . . . . 52
6.2.2 Measures. . . . . . . . . . . . . . . . . . . . . . . . . . . . . 52
6.2.3 Results. . . . . . . . . . . . . . . . . . . . . . . . . . . . . . 57
6.2.4 Discussion . . . . . . . . . . . . . . . . . . . . . . . . . . . . 66
7 Overall Discussion . . . . . . . . . . . . . . . . . . . . . . . . . . . . . . 697.1 Theoretical Implications . . . . . . . . . . . . . . . . . . . . . . . . . 70
7.2 Managerial Implications . . . . . . . . . . . . . . . . . . . . . . . . . 73
7.3 Limitations . . . . . . . . . . . . . . . . . . . . . . . . . . . . . . . 76
7.4 Future Research Agenda . . . . . . . . . . . . . . . . . . . . . . . . . 77
8 Conclusion . . . . . . . . . . . . . . . . . . . . . . . . . . . . . . . . . 81
II

List of Tables
List of Tables
5.1 Anticipated Temporal Discharge . . . . . . . . . . . . . . . . . . . . . . . . . 26
5.2 Perceived Service Safety . . . . . . . . . . . . . . . . . . . . . . . . . . . . . 27
5.3 Perceived Controllability . . . . . . . . . . . . . . . . . . . . . . . . . . . . . 29
5.4 Rotated Factor Loadings . . . . . . . . . . . . . . . . . . . . . . . . . . . . . 34
5.5 Final item set . . . . . . . . . . . . . . . . . . . . . . . . . . . . . . . . . . . 35
5.6 Unidimensionality for all scales . . . . . . . . . . . . . . . . . . . . . . . . . 36
5.7 Convergent Validity and Reliability Assessment Study 1 . . . . . . . . . . . . 37
5.8 Correlation Matrix for Discriminant Validity Assessment Study 2 . . . . . . . . 37
5.9 Convergent Validity and Reliability Assessment Study 2 . . . . . . . . . . . . 43
5.10 Correlation Matrix for Discriminant Validity Assessment Study 2 . . . . . . . . 44
5.11 Measurement invariance tests Study 2 . . . . . . . . . . . . . . . . . . . . . . 44
5.12 Structural Models Estimation Study 2 . . . . . . . . . . . . . . . . . . . . . . 45
III

List of Figures
List of Figures
1.1 Structure of the thesis . . . . . . . . . . . . . . . . . . . . . . . . . . . . . . . 4
3.1 Expansion of technology’s role in customer interaction (Own representation
based on Froehle & Roth, 2004) . . . . . . . . . . . . . . . . . . . . . . . . . 14
3.2 New Service-Classification . . . . . . . . . . . . . . . . . . . . . . . . . . . . 16
4.1 Technology Acceptance Model 3 (Own representation based on Venkatesh &
Bala, 2008) . . . . . . . . . . . . . . . . . . . . . . . . . . . . . . . . . . . . 19
4.2 Unified Theory of Acceptance and Use of Technology 2 (Own representation
based on Venkatesh, Thong, & Xu, 2012) . . . . . . . . . . . . . . . . . . . . 20
5.1 Acceptance Model for Technology-Derived Services . . . . . . . . . . . . . . 30
5.2 Scree plot for the initial item set . . . . . . . . . . . . . . . . . . . . . . . . . 35
5.3 Stimuli: Object related TDS . . . . . . . . . . . . . . . . . . . . . . . . . . . 41
5.4 Stimuli: Person related TDS . . . . . . . . . . . . . . . . . . . . . . . . . . . 41
5.5 Results of the Multi-group Structural Equation Model (SEM) . . . . . . . . . . 46
6.1 Stimuli: TDS as product . . . . . . . . . . . . . . . . . . . . . . . . . . . . . 54
6.2 Stimuli: TDS as a service . . . . . . . . . . . . . . . . . . . . . . . . . . . . . 54
6.3 Stimuli: Advanced product as product . . . . . . . . . . . . . . . . . . . . . . 55
6.4 Stimuli: Advanced product as a service . . . . . . . . . . . . . . . . . . . . . 55
6.5 Manipulation check type of offer (detailed) . . . . . . . . . . . . . . . . . . . 57
6.6 Manipulation check type of object . . . . . . . . . . . . . . . . . . . . . . . . 58
6.7 Manipulation check type of object . . . . . . . . . . . . . . . . . . . . . . . . 58
6.8 Interaction plot for anticipated temporal discharge . . . . . . . . . . . . . . . . 59
6.9 Diagnosis plot for analysis of covariance (DV: anticipated temporal discharge) . 59
6.10 Main effect of object type on anticipated quality . . . . . . . . . . . . . . . . . 61
6.11 Diagnosis plot for analysis of covariance (DV: anticipated quality) . . . . . . . 61
6.12 Results of the moderated mediation analysis Study 3 . . . . . . . . . . . . . . 63
IV
List of Figures
6.13 Interaction effect of type and offer on consumers’ attitude towards the offer . . 64
6.14 Diagnosis plot for analysis of covariance (DV: attitude towards the offer) . . . . 64
6.15 Main effect of type of offer on relative willingness to pay . . . . . . . . . . . . 65
6.16 Diagnosis plot for analysis of covariance (DV: relative willingness to pay) . . . 65
V

List of Abbreviations
List of Abbreviations
ATM Automated Teller Machine
B2B Business-to-Business
B2C Business-to-Consumers
CFA Confirmatory Factor Analysis
CMV Common Method Variance
EFA Exploratory Factor Analysis
FA Factor Analysis
High-Tech High-Technology
IT information technology
R&D Research & Development
SDL Service-Dominant Logic
SEM Structural Equation Model
SST Self-Service Technologies
TAM Technology Acceptance Model
TDS Technology-Derived Services
TRA Theory of Reasoned Action
UTAUT Unified Theory of Acceptance and Use of Technology
WOM Word of Mouth
VI

1 Introduction
1Introduction
There are an endless number of things to
discover about robotics. A lot of it is just
too fantastic for people to believe.
Daniel H. Wilson
1.1 Problem Setting
Recently, so-called intelligent products have entered the market place. These products are
characterized by their capability to autonomously and directly deliver value to the customer.
Equipped with latest information technology (IT), they are capable of collecting, processing,
and producing information. Therefore, intelligent products can operate autonomously and in-
dependently (S. A. Rijsdijk & Hultink, 2009) and “overtake daily activities and concerns from
their user” (S. Rijsdijk, Hultkin, & Diamantopoulos, 2007, p.342). Thus, facilitated by techno-
logical sophistication, their core benefit is to provide value for customers autonomously.
Just to give some examples of already available intelligent products, one could think of
Husqvarna’s autonomous mowers called Automowers or Samsung’s vacuum-robots. Going one
step ahead of time, Research & Development (R&D) departments of Mercedes-Benz, BMW,
and AUDI have first trucks and cars capable of autonomously finding their way from place A
to destination B. Going even further, Honda recently presented their latest version of ASIMO,
a humanoid robot which could have major impacts for example in the health-care system in
the future. These examples also demonstrate that depending on the application context, the
intelligent products either do not involve humans or do involve humans in their provision of
value.
Furthermore, the projected business impact of these new technologies is nothing short of be-
ing one of the eight trillion-dollar trends of the future (Harris, Schwedel, & Kim, 2011). Buera
1

1 Introduction
and Kaboski (2012) found that the excessive growth-rate in the service sector, rising from 50%
in 1950s close to 80% in the 21st century, has been propelled by more specialized and therefore
higher-skilled and higher paid workers. As the workers then were faced with their respective
opportunity costs for specific tasks, they decided to use more and more services. However,
the above mentioned new technologies could have a significant impact on less complex ser-
vices. That is, human service employees in this service industries could possibly be replaced
by technology. Hence, industrialization of services could take place in the future (Gautschi &
Ravichandran, 2006).
However, despite any experts’ appraisals, it is customers’ acceptance that determines whether
a new technology turns into a success-story or turns out to be a white elephant. The same applies
for autonomously operating intelligent products, even though their major advantage is glaring,
namely time saving. Therefore, this thesis aims at giving a new classification for this new and
emerging type of services derived by technologies and providing first insights on customers’
acceptance of this new type of services.
1.2 Research Questions
This thesis aims to gain insights into customers’ acceptance of intelligent products capable of
providing this new type of service and its potential business impact. Therefore, the presented
thesis (a) introduces this new type of services, (b) derives a new acceptance model based on
newly established constructs for this new type of services and (c) assesses customers’ perception
of these intelligent products capable of providing this new type of services in the context of
classic products and classic services. Thus, the author strives to give answers on the following
research questions:
Research Question 1:
What are the key characteristics of this new type of services that differ from existing
services?
Research Question 2:
What dimensions influence customers’ acceptance of these new services, and how
does the application context of these new services (person-related vs. object-related)
affect customers’ acceptance?
Research Question 3:
What characteristics of this new type of services determine its market success, com-
pared to its conventional counterparts?
2

1 Introduction
1.3 Structure of the Dissertation
The remainder of this thesis is structured as the following: Chapter 2 introduces the new type
of services which is the central aspect of this thesis. Thereby, the underlying products are dis-
cussed, followed by a review of the current service domain and the introduction of the new
service type. Based on that, chapter 3 comes up with a new service classification. To gain first
insights on customers’ acceptance of this new service types, chapter 4 draws on both streams
of literature, namely technology acceptance and service acceptance. Building on these find-
ings, a new acceptance model is proposed and empirically validated in chapter 5. To shed first
light on the business impact of this new type of services, chapter 6 employs an experimental
design. Finally, chapter 7 derives theoretical and managerial implications from the results pre-
sented in the previous chapters and provides a research agenda on this topic. Chapter 8 provides
a general conclusion of customers’ acceptance of this new type of services and its impact on
the established products and service businesses. Figure 1.1 provides an overview of all chapters.
3

1 Introduction
1. Introduction Problem Setting and Research Questions
2. Technology-Derived Services Blurring the distinction between products and services
3. Advancing towards a New Service Classification Service-Provision (Assisted or Derived) and Service-Relatedness (Human or Object)
4. Literature Review on Technology and Service Acceptance Models for Technology Acceptance and Evaluation of Services
7. Overall Discussion Theoretical and Managerial Implications, Limitations, and Future Research Agenda
5. Assessing the Acceptance of Technology-Derived Services
6. Business Impact of Technology-Derived Services
Study 1 (EFA & CFA)
New Construct
Validation
Study 2 (SEM)
Validation of the
Acceptance Model for TDS
Discussion Discussion
Study 3 (Experiment)
Impact of TDS on classic product and
service businesses
8. Conclusion
What dimensions influence customers’ acceptance of these new services, and how does the application context of these new services affect customers’ acceptance?
What characteristics of this new type of services determine its market success, compared to its conventional counterparts?
Figure 1.1: Structure of the thesis
4

2 Technology-Derived Services: Blurring the distinction between products and services
2
Technology-Derived Services:Blurring the distinction betweenproducts and services
Mercedes Benz’s Mercedes me, BMW’s Connected Drive, or Audi’s Audi connect are just
some recent examples, where manufacturing companies extend their product range by addi-
tional services. This phenomenon is known as servitization (Vandermerwe & Rada, 1988) and
describes that classic industrial companies provide services in addition to their product range.
At the same time, service industries try to increase their service productivity by the application
of high-tech instead of employees (R. Rust & Huang, 2012). To give some examples, think
of a self-check in kiosks at airports, online-banking applications, or apple pay. At the 2015’s
international consumer electronics show, members of the board of management of Daimler AG
were autonomously chauffeured to the event by Mercedes’s concept car F015. To that point, the
following questions arise: Is this intelligent product a mean for some taxi companies to increase
their productivity, because the self-driving F015 does not require a human chauffeur, or is this
intelligent product meant as an additional service to the basic car? In short: This intelligent
product seems to vanish the apparent distinction between services and products.
2.1 Products
Typically, when consumers talk about products, the correct term is goods, manufactured goods,
or physical goods (e.g. R. T. Rust & Huang, 2014). As the mean of products is to fulfill
customers’ needs, products in general comprise goods and services (Kotler, Keller, & Blieml,
2007). However, products in the marketing context are exclusively associated with physical ob-
jects, which can be purchased (Homburg & Krohmer, 2006). This terminology is also echoed
5

2 Technology-Derived Services: Blurring the distinction between products and services
in the literature on “new product development” (e.g., Olson, Walker, & Ruekert, 1995) or on
“product innovation” (e.g. De Luca & Atuahene-Gima, 2007). Moreover, products are typically
described by attributes like design (e.g. Bloch, 2011; Landwehr, Wentzel, & Herrmann, 2013;
Talke, Salomo, Wieringa, & Lutz, 2009), quality (e.g. Golder, Mitra, & Moorman, 2012),
and innovativeness, for example in terms of product originality (e.g. Moldovan, Goldenberg, &
Chattopadhyay, 2011), product usefulness (e.g. Dahl, Chattopadhyay, & Gorn, 1999; Henard
& Szymanski, 2001), or product superiority (e.g. S. Rijsdijk, Langerak, & Hultkin, 2011).
Especially in the product innovation context, research is about High-Technology (High-Tech)
products, which are in general distinct from other durable goods in terms of production (Mel-
drum, 1995), the requirement of science and technology (Rubera & Kirca, 2012), and most
importantly their impact on consumer choice decisions (Erden, Keane, Oncu, & Strebel, 2005).
2.1.1 Product Types
Following Han, Chung, and Sohn (2009), with the accelerated ascent of technological innova-
tions, two basic types of products are fostered: convergent and dedicated products. While con-
vergent products are primarily concerned with customers’ convenience by providing as many
functions as possible with one product, dedicated products address consumers’ interest in pure
performance by focusing on one core feature (Han et al., 2009). To illustrate this differentia-
tion, one may think of Apple’s MacBook, which covers a wide range of functions like making
video-calls, watching movies, playing videogames, or conducting research. In contrary, Miele’s
vacuum cleaner is solely designed to maximize its cleaning-power, and thus optimized for its
core function.
Having a closer look on convergent products, Gill (2008) points out that the basic mean of
a convergent product is either utilitarian or hedonic (Voss, Spangenberg, & Grohmann, 2003).
Furthermore, it turned out that adding hedonic, incongruent features to an utilitarian base-
product results in higher customer satisfaction compared to utilitarian add-on features. But
when the base-product is hedonic in nature, adding congruent, i.e. hedonic features results in
higher customer satisfaction in comparison to utilitarian add-on features (Gill, 2008). In line
with this stream of literature, Bertini, Ofek, and Ariely (2009) found that alignable add-on fea-
tures, notwithstanding whether these add-on features are hedonic or utilitarian in nature, lead
to decreased value perception of the base product. In contrast, non-alignable add-on features
increase the perceived value of the base product. These effects were moderated by the amount
of relevant information on the product at question and customers’ product expectation Bertini
et al. (2009). That is, product information on the one hand diminishes the aforementioned main
effects. On the other hand, alignable attributes which meet customers expectation significantly
6

2 Technology-Derived Services: Blurring the distinction between products and services
decrease their product evaluation, whereas unexpected non-alignable attributes significantly in-
crease customers’ product evaluation (Bertini et al., 2009).
However, there seems to be a threshold for convergent products with respect to a reason-
able number of functional means. As Thompson, Hamilton, and Rust (2005) argue, consumers
are more attracted by a highly functional product prior to its first use, while consumers’ con-
cern during and after initial usage of the product shifts towards ease of use, which is lower by
nature for high-complex compared to simple convergent products. Correspondingly, customer
satisfaction is highest for products with a moderate number of capabilities (Thompson et al.,
2005). Nevertheless, several research investigations confirmed that consumers still have great
difficulties in properly estimating their real usage behavior before the purchase and therefore
prefer high-capable convergent products (e.g. Thompson et al., 2005). An easy remedy for this
paradox was suggested by Goodman and Irmark (2013), namely usage estimation prior to the
product purchase. Throughout five studies the authors showed that when participants had to
indicate their usage of each provided feature within the next week, they changed their purchase
preference to moderate-complex products, stated higher satisfaction as well as recommendation
intention (Goodman & Irmark, 2013). Although, a different approach by Thompson and Nor-
ton (2011) suggests that customers choosing high-complex products also gain social utility as
they are perceived to be more innovative. In line with Thompson et al. (2005) their findings
reversed when customers’ anticipated usage was asked for.
To shed light on the antecedents of these high-capable products, Lukas, Whitwell, and Heide
(2013) investigated the impact of organizational culture on the so-called “product capability
overprovision” (Lukas et al., 2013, p.1) in a Business-to-Business (B2B) context. Drawing on
the idea of the Competing Values Framework (Quinn & Rohrbaugh, 1983), the authors found
that two of the four originally proposed values, namely adhocracy, clan, hierarchy, and market
(Deshpande, Farley, & Webster Jr., 1993), contribute to the above mentioned discrepancy of
required and provided product capabilities. In particular, adhocracy and market cultures turned
out to have significant impact on firms’ overshooting of customer demands.
Besides this company based differentiation of product types, current literature also focuses
on customer’s perspective of product types. In specific, the technological identity of an object
arises from the assignment of agentive functions, which “are imposed on entities in pursuit of
the practical interests of” (Faulkner, 2009, p.443) customers. Accordingly, two distinct types of
assignments are present in our daily lives: different functional assignments to the same techni-
cal object and so-called nested assignments. Giving an example for the former type, one could
think of using a pan for cooking or as a drum. Nested assignments are characterized by starting
in a broad product category, which, in turn, is narrowed down by successively specializing the
7

2 Technology-Derived Services: Blurring the distinction between products and services
technological object (Faulkner, 2009). To give an example, one could think of garden tools
as the product category, lawn mowers as a sub-category and finally Husqvarna’s Automower
as a special product within the sub-category. Further, Choi and Fishbach (2011) found that
customers often differentiate for themselves, whether a choice is instrumental or experiential
in nature. Thereby, the differentiation between these two choice types is that for the latter one
the customer has no specific goal in mind, whereas instrumental choices are due to meet prior
known requirements for a specific task (Choi & Fishbach, 2011).
2.1.2 Intelligent, autonomous operating products: Services included
Product innovations occur in three different stages of extant, namely incremental innovations,
really new products, or radical innovations (Garcia & Calantone, 2002). While incremental
innovations are described by targeting existing customers with enhanced product capabilities
based on established technologies, really new products either aim at new customer segments, or
are built on new technologies. In the case of radical innovations, a company tries to attract new
customers with the introduction of new technologies (Garcia & Calantone, 2002). Regardless
of the specific type of an innovation, successful firms have to focus on innovations, “the pro-
cess of bringing new products and services to market” (Hauser, Tellis, & Griffin, 2006, p.687).
That is, because firms’ long-term value is largely dependent on new product introductions, in
specific customers’ expeditious acceptance of newly launched products (Pauwels, Silva-Risso,
& Hanssens, 2004). Hauser et al. (2006) identified several fields of innovation management,
namely customer response to innovation, organizations and innovation, strategic market entry,
prescriptions for product development, and outcomes from innovation. Accordingly, the central
focus of this dissertation is on customer response to innovations.
Being more precise, the focus of this thesis is on autonomous operating products. These
products represent the top range of so-called intelligent products (e.g. S. Rijsdijk et al., 2007).
Given their ability of collecting, processing, and producing information, these products are able
to operate autonomously, and independently (S. A. Rijsdijk & Hultink, 2009). Corresponding
to these capabilities, prior literature suggests several dimensions for a products’ intelligence,
which are autonomy, adaptability, reactivity, multi-functionality, ability to cooperate, humanlike
interaction, and personality (S. A. Rijsdijk & Hultink, 2009). Accordingly, depending on the
implemented IT-based capabilities, intelligent products either provide assistance to customers
or “overtake daily activities and concerns from their user” fully autonomously (S. Rijsdijk et al.,
2007, p.342). Especially the latter ones are characterized by being capable of delivering value
8

2 Technology-Derived Services: Blurring the distinction between products and services
autonomously and directly to the customer. The author refers to this specific type of services as
Technology-Derived Services (TDS). For the sake of simplicity, the author uses the term TDS
as a abbreviation for intelligent products capable of providing TDS mostly in the remainder in
the thesis.
As TDS are able to provide direct value to their owners, they perfectly match the latest
definition of services (R. T. Rust & Huang, 2014), notwithstanding they are physical goods.
Therefore, the service strategy of service transformation (Huang & Rust, 2013), which states
that services become more and more product-like as a consequence of the wide IT application to
enhance service-productivity, is just one side of a coin. The other side of the coin are intelligent,
autonomously operating products, heavily equipped with latest IT and therefore capable of
directly deliver value to consumers. Nevertheless, both the product evolution and the service
evolution directly contribute to the fact “that [IT] eventually blurs the distinction between goods
and services” (Huang & Rust, 2013, p.257).
The emergence of these TDS also aligns with recent work of Cusumano, Kahl, and Suarez
(2015) on product-related service strategies, which basically differentiates between smoothing,
adapting, and substituting services. In specific, TDS suit the classification of adapting services,
which are characterized as “significantly expand the functionality of a product or help the cus-
tomer develop significant new uses or adapt the product to novel conditions” (Cusumano et al.,
2015, p.563).
2.2 Services
“Service is any direct provision or co-creation of value between a provider and a customer”
(R. T. Rust & Huang, 2014, p.2). Thereby, most services have personal intense, jointly pro-
duction of value by user and provider, and intangibility in common (Anderson, Fornell, & Rust,
1997). However, while the latter two aspects still hold, the typical personal intense, which
allows for customized services at the expense of delivering constant quality (Anderson et al.,
1997), has changed over the last decade. As service businesses strive for higher productiv-
ity, technologies in the form of automated systems are nowadays often used instead of labor-
based services (R. Rust & Huang, 2012). Prominent examples of these automated systems
are telephone customer services, or self-services, like self-check-ins on airports or Automated
Teller Machine (ATM)s (e.g. Meuter, Bitner, Ostrom, & Brown, 2005). Additionally, the in-
creased use of automated-systems also results in lowered heterogeneity of the service provision
that “some services can be very homogeneous.” (Correa, Ellram, Scavarda, & Cooper, 2007,
p.450). Hence, the mutual dependence of services and High-Tech products increases, empha-
9

2 Technology-Derived Services: Blurring the distinction between products and services
sizing Greenfield’s (2002) notion that “no services can be produced without a prior investment
in capital goods” (Greenfield, 2002, p.20).
2.2.1 Service transition: The Next Level
With the beginning of servitization, i.e. companies from both services and goods industries
start providing bundles of products and services (Vandermerwe & Rada, 1988), the idea came
up that “services dominate this era” (Vandermerwe & Rada, 1988, p.316). A broad stream
of literature evolved on either service transitions, where services are provided in addition to
an existing product range, (Fang, Palmatier, & Steenkamp, 2008; Lusch, Vargo, & O’Brien,
2007; Ulaga & Reinartz, 2011) or pricing of these hybrid offerings(Guiltinan, 1987; Hanson
& Martin, 1990). Having in mind the aforementioned research of Gill (2008) and Bertini et
al. (2009), investigating the effects of product features and add-on features on products’ market
success, servitization appears to be an analogous phenomenon, except that services and no
physical goods are added to a base product.
Going even further, Vargo and Lusch (2004) came up with the paradigm of a Service-
Dominant Logic (SDL), which underlies the rational of “value in use” (Vargo & Lusch, 2004,
p.7). Hence, value is always a co-creation attained by customers, (Lusch & Vargo, 2006) using
any provided operand resource, for example a laptop or a simple knife (e.g. Barrutia & Gilsanz,
2012).
However, drawing on the idea of value in use, there seems to be a new type of products
where the consistent understanding of the aforementioned value creation has some shortcom-
ings. Specifically, TDS (see chapter 2.1.2) are capable of providing value without any necessary
interaction of the customer. Following the fundamentals of servitization and service transition,
one could conclude that this new type of products has the so-called additional services incor-
porated and consequently the capability to provide total solutions fully autonomously. Thus,
solely the product creates value for the customer independently from any external factors.
Moreover, thinking about prominent drawbacks of services, namely inseparability, intangi-
bility, perishability (e.g. Correa et al., 2007; Gadrey, 2000), with the ascent of TDS services
become tangible and storable, as the autonomous operating product is a physical object. With
respect to the inseparability of services, a more complex approach is necessary in the context of
TDS. The basic meaning of inseparability states that production and consumption of services
take place at the same time (Berry, Seiders, & Grewal, 2002). This fact is also implied in the
SDL, where “the consumer is always involved in the production of value” (Vargo & Lusch,
2004, p.11) and therefore is seen as a co-producer (Prahalad & Ramaswamy, 2000).
However, this strict definition of service inseparability is at question when following Keh and
10

2 Technology-Derived Services: Blurring the distinction between products and services
Pang (2010), who argue that services can in fact be separated in either time or spatial distance or
in both dimensions. To give an example, one could think of a gardener taking care of your lawn
while you are at work. Further, this service separation has significant impacts on customers’
perception of service convenience and risk perception (Keh & Pang, 2010). Moreover, the eval-
uation of services often depends not merely on the output, but on the process itself, irrespective
whether the customer is involved in the process or is not (Gronroos, 1998). This understanding
of a multi-stage service evaluation is also echoed in more recent literature (Golder, Mitra, &
Moorman, 2012). In the light of TDS, services can be provided in both presence or absence
of the customer, even though the customer is never involved in the process. To conclude, servi-
tization has changed in such way that some firms nowadays not only provide product-related
additional services, like it is the case for BMW’s Connected Drive. With the accelerated advent
of TDS today’s manufacturing companies also provide product-innate services, e.g. intelligent,
autonomous lawn mowers.
Adapting on the distinction of relieving and enabling services processes (Normann, 2001),
TDS are able to relief their customers from certain tasks, for example trimming the lawn or
driving the car. This is also the case for classic services, where a gardener takes care of trim-
ming the lawn or a chauffeur drives her or his passengers to a given destination. Therefore,
TDS enable their users to focus on other tasks, while executing the primary task, trimming the
lawn or navigating the car (Lusch, Vargo, & Tanniru, 2010). In contrast, add-on services are
mostly concerned to increase customers’ task performance (Lusch et al., 2010). To give an
example, one could think of BMW’s Connected Drive feature Real Time Traffic Information,
which allows its users to avoid traffic jams and therefore exaggerate users’ trip efficiency.
2.2.2 Technology-Derived Services: A New Type of Service Innovationand Definition
Service Innovation TDS
To that extant one could question, whether these new TDS meet the requirements of a ser-
vice innovation. In general, a service innovation is “a new or enhanced intangible offering
that involves the firm’s performance of a task/ activity intended to benefit customers” (Dotzel,
Shankar, & Berry, 2013, p.259). Examples of recent literature on service innovations are dif-
ferentiated in internet-enabled versus people-enabled service innovations (Dotzel et al., 2013).
In contrast, TDS are enabled by intelligent products, built to autonomously perform tasks which
generate value for consumers. Thus, the author first concludes that TDS fulfill the prerequisites
of service innovations, although based on intelligent products. Second, he expands the present
11

2 Technology-Derived Services: Blurring the distinction between products and services
differentiation of service innovations by adding TDS.
Definition of TDS
Summing up the previously outlined new and distinct characteristics of TDS, one can conclude
that TDS are intelligent products with an innate IT-based capability to autonomously operate
and therefore providing value directly to the customer without any necessary interaction during
the value creation process of its user or its manufacturer. Furthermore, as TDS are tangible
products, transfer of ownership can take place in contrary to classic services.
12

3 Advancing towards a New Service Classification
3Advancing towards a New Service Classifi-cation
A broad stream of literature has addressed various aspects of services within the last decades
(e.g. Berry et al., 2002; Hui, Thakor, & Gill, 1998; Leclerc, Schmitt, & Dube, 1995; Parasur-
aman, Zeithaml, & Berry, 1988; Wentzel, Tomczak, & Henkel, 2014). Especially technology-
assisted services like Self-Service Technologies (SST) or remote-services have raised the atten-
tion of academics since the last decade (e.g. Buttgen, Schumann, & Ates, 2012; Meuter et al.,
2005; R. Rust & Huang, 2012; R. T. Rust & Huang, 2014; Wunderlich, von Wangenheim, &
Bitner, 2012). However, the considerable body of literature on services has not taken TDS and
their unique characteristics for customers into account. Therefore, this thesis provides a new
service classification based on service-provision and service-relatedness.
3.1 Service-Provision: Assisted or Derived
In the light of remote-services, Paluch and Blut (2013) clearly point out that literature already
addressed the issue of new service provisions (e.g. Moeller, 2008). Nevertheless, research has
not considered customers’ perceptions of the latest service provision, TDS, yet. Consequently,
the currently used classifications fall short in capturing TDS correctly, as they lack of either an
appropriate technological dimension or a technological dimension at all.
Moreover, TDS expand the proposed five fundamental forms of customers’ interaction with
technologies during the service process, presented by Froehle and Roth (2004). Intelligent
products capable of providing TDS operate autonomously, hence they do not require any inter-
action of the customer or the provider during the service process. Consequently, TDS represent
a sixth form of interaction in the field of technology infused services: NO customer or provider
interaction. Figure 3.1 illustrates the expanded form of technology infused service provision
(Froehle & Roth, 2004).
13

3 Advancing towards a New Service Classification
Technology
Service Customer
Service Rep
Technology
Service Customer
Service Rep
Technology
Service Customer
Service Rep
Modes of “Face-to-Face“
Customer Contact
A. Technology-Free Customer Contact
B. Technology-Assisted Customer Contact
C. Technology-Facilitated Customer Contact
Technology
Service Customer
Service Rep
Technology
Service Customer
Service Rep
D. Technology-Mediated Customer Contact
E. Technology-Generated Customer Contact
(Self-Service)
Modes of “Face-to-Screen“
Customer Contact
Mode of “NO“
Customer Contact
Technology
Service Customer
Service Rep
F. Technology-Derived Services No Customer Contact
Figure 3.1: Expansion of technology’s role in customer interaction (Own representation based on
Froehle & Roth, 2004)
14

3 Advancing towards a New Service Classification
The most mature and most extensively investigated form of service provision are technology-
assisted services. Thereby, technology-assisted services range from relying hardly on technical
equipment up to the extant that services heavily rely on technologies (e.g. Bolton & Saxena-
Iyver, 2009; R. Rust & Huang, 2012). In addition, so-called SST have attracted researchers’
attention during the last decade (eg. Collier & Kimes, 2012; Meuter et al., 2005; Meuter,
Ostrom, Roundtree, & Bitner, 2000). Indicative for SST is that the customer her-/ or himself
is part of the service process and therefore is coincident with the value in use paradigm. As
a consequence, Wunderlich et al. (2012), who are also investigating remote-services, derived
a differentiation of services by focusing on the activities of a user and a provider during the
service-process. Moreover, as technological improvements accelerate these days, particularly
in the field of IT, it seems reasonable to differentiate services on the degree to which they are
enabled by technology or on “the extent to which technology is utilized in the creation and
delivery of the service” (Bolton & Saxena-Iyver, 2009, p.91). That is, service classification
can also be attained based on the technological sophistication and the activity of both user and
provider within the service process. However, as already outlined above, the author argues
that the technological differentiation should be refined to cover the full range of nowadays
services. In specific, with the advent of TDS, theory does not provide a clear categorization
for this new type of services, despite their major market impact in the future (Harris et al.,
2011). Accordingly, the author suggests a new dimension, namely service provision, which
discriminates services as the following: Technology-Assisted Services and Technology-Derived
Services. Thereby, the technology-assisted services still require human interactions, provided
by either the customer her-/ or himself or the service providing company. As an example,
one could think of getting a haircut or using an ATM. In contrast, TDS operate completely
autonomous, except for initializing or very rarely applied maintenance, like it is the case for
Husqvarna’s Automower.
3.2 Service-Relatedness: Human or Object
Besides this refinement of the technological dimension of service types there is yet another
dimension, which may be crucial for customer’s service acceptance. Drawing on Lovelock
and Gummerson (2004), services can be differentiated whether physical acts are exerted on
customer’s bodies or on owned objects. For illustration of that distinction, one could of cleaning
windows of a skyscraper or mowing the lawn of a customer versus getting a fitness check-up, a
taxi-ride or a surgery. Although Keh and Pang (2010) refer to this service distinction, no deeper
investigation on customers’ acceptance of different types of service provisions for object-related
15

3 Advancing towards a New Service Classification
versus person-related services was carried out. Consequently, the author address this gap by
specifying this differentiation of service types as service relatedness. That is, if services are
exercised on customers’ bodies it is referred to as person-related services. In contrast, if services
are exerted on physical objects, these are object-related services. In combination with the above
described refinement, the author provides a new service-classification based on the dimensions
service provision and service relatedness, see figure 3.2.
New$Service$Classifica/on$
techno
logy*assisted/
services/
techno
logy*derived/
services/
person*related/object*related/
Assistance)
Experience)
service'relatedness''
service'provision'
…focus/of/the/disserta8on/
Figure 3.2: New Service-Classification
16

4 Literature Review on Technology and Service Acceptance
4Literature Review onTechnology and Service Acceptance
As the previous chapters show, TDS, for instance self-driving cars, can be classified either as
products or as services. To account for both types of offerings, the author provides a literature
review on technology acceptance and service acceptance. In doing so, the author identifies
possible deficiencies of the existing acceptance literature with regard to customers’ acceptance
of intelligent products capable of providing TDS.
4.1 Technology Acceptance
This section gives an overview of the latest theoretical insights regarding the acceptance of
innovations from a customer’s point of view. In accordance, the most reasonable and established
conceptual models from both services and products marketing are briefly introduced, drawbacks
in the light of TDS are outlined, and suitable predictors for the adoption of TDS are identified.
4.1.1 Models for Technology Acceptance
Two of the most recent models, which aim at giving a holistic understanding of customers’
adoption of technology are the Technology Acceptance Model (TAM) 3 of Venkatesh and Bala
(2008) as well as the Unified Theory of Acceptance and Use of Technology (UTAUT) 2 pro-
posed by Venkatesh, Thong, and Xu (2012).
TAM The idea of TAM 3 is to better understand IT adoption in an organizational context
(Venkatesh & Bala, 2008). The TAM 3 is the latest version of the fundamental TAM, which was
officially introduced by F. Davis (1989). The TAM is a specific form of the more generic Theory
of Reasoned Action (TRA) (Fishbein & Ajzen, 1975) and aimed at predicting customers’ use
17

4 Literature Review on Technology and Service Acceptance
of IT devices (F. Davis, Bagozzi, & Warshaw, 1989). The core of the model is still the same for
the TAM 3, namely the effect of perceived ease of use and perceived usefulness on behavioral
intention (Venkatesh & Bala, 2008). Thereby, the construct perceived ease of use tries to
measure “the degree to which a person believes that using a particular system would be free of
effort” (F. Davis, 1989, p.320), whereas the construct perceived usefulness aims at measuring
“the degree to which a person believes that using a particular system would enhance his or her
job performance” (F. Davis, 1989, p.320).
Additionally, Venkatesh (2000) incorporated Behavioral Decision Theory into the TAM by
including the anchor and adjustment heuristic. In specific, the anchors for perceived ease of use
were computer self-efficacy, perception of external control, computer anxiety, and computer
playfulness (Venkatesh, 2000). The constructs associated with adjustments were perceived
enjoyment as well as objective usability (Venkatesh, 2000). Therefore, this extended model
was able to account for the effects of customers’ individual differences regarding general beliefs
and experiences on perceived ease of use (Venkatesh, 2000).
As the TAM was introduced to better understand the adoption of IT in an organizational con-
text, the latest version.TAM 3, also includes profession related constructs, namely image, job
relevance, output quality, and result demonstrability (Venkatesh & Bala, 2008). Furthermore,
as already proposed in the TAM 2 (Venkatesh & Davis, 2000), the TAM3 also accounts for the
effects of subjective norm, i.e. a “person’s perception that most people who are important to
him think he should or should not perform the behavior in question” (Fishbein & Ajzen, 1975,
p.320). Figure 4.1 shows the proposed research model of TAM 3 with its core constructs and
their relations.
UTAUT Based on a comparative analysis of eight technology acceptance models, Venkatesh,
Morris, Davis, and Davis (2003) came up with the UTAUT. Thereby, they identified and com-
bined the most influential predictors for employees’ behavioral intention and use behavior in
one model, the UTAUT. In addition, Venkatesh et al. (2003) included four moderators in the
model, age, gender, experience, and voluntariness of use. In specific, the empirical evaluation
of the UTAUT gave evidence that both age and gender moderate the effects of performance
expectancy, effort expectancy, and social influence on behavioral intention, whereas only age
moderates the effect of facilitating conditions on use behavior. Further, consumers’ experience
was shown to moderate the effect of effort expectancy and social influence on the behavioral
intention as well as the effect of facilitating conditions on use behavior. Finally, the empiri-
cal validation of the UTAUT revealed that voluntariness of use moderates the effect of social
influence on behavioral intention (Venkatesh et al., 2003).
18

4 Literature Review on Technology and Service Acceptance
Experience Voluntariness
Subjective Norm
Image
Job Relevance
Output Quality
Result Demonstrability
Computer Self-efficacy
Computer Playfulness
Computer Anxiety
Perceptions of External Control
Objective Usability
Perceived Enjoyment
Anchor
Adjustment
Perceived Usefulness
Behavioral Intention Use Behavior
Perceived Ease of Use
Technology Acceptance Model (TAM)
Figure 4.1: Technology Acceptance Model 3 (Own representation based on Venkatesh & Bala, 2008)
To further refine the UTAUT especially for the “consumer use context” (Venkatesh et al.,
2012, p.158), Venkatesh et al. (2012) included three additional constructs in the model, namely
hedonic motivation, price value, and habit, while omitting the originally included moderator
voluntariness of use. The authors referred to this new model as UTAUT 2 (see Figure 4.2).
Prior literature defined the dimension hedonic in various contexts (e.g. Arnold & Reynolds,
2003; Gill, 2008; Yim, Chan, & Lam, 2012) as “resulting from sensations derived from the
experience of using products” (Voss et al., 2003, p. 310). Accordingly, Nysveen, Pedersen, and
Thorbjønsen (2005) found that perceived enjoyment, one facet of hedonic values (Yim et al.,
2012), has greater impact on experiential behavioral intentions than on goal-directed behavioral
intentions. As the UTAUT 2 aims at better understanding technology acceptance in consumers’
daily lives, Venkatesh et al. (2012) incorporated this construct into their original UTAUT model
to cover “the fun a consumer has in using the product” (Arnold & Reynolds, 2003, p.78).
As the UTAUT 2 shifts from an organizational context to a consumer context, price value
plays an important role, because the customer has to pay the price for a service or a product him-
or herself. Drawing on Zeithaml (1988), consumers perceive value as the “overall assessment
of the utility of a product based on perceptions of what is received and what is given” (Zeithaml,
1988, p.14). Recent literature also shows that the two distinct consumer perceptions of price,
19

4 Literature Review on Technology and Service Acceptance
Performance Expectancy 1
Effort Expectancy 2
Hedonic Motivation
Social Influence 3
Facilitating Conditions 4
Price Value
Habit
Behavioral Intention Use Behavior
Age Gender Experience
Notes: 1. Moderated by age and gender 2. Moderated by age, gender, and
experience. 3. Moderated by age, gender, and
experience. 4. Effect on use behavior is
moderated by age and experience. 5. New relationships are shown as
darker lines.
Figure 4.2: Unified Theory of Acceptance and Use of Technology 2 (Own representation based on
Venkatesh, Thong, & Xu, 2012)
either as a quality indicator or as a sacrifice (Leavitt, 1954), depends on temporal construal
such that consumers’ focus is more on sacrifice when the purchase is imminent (Bornemann
& Homburg, 2011). Accordingly, the construct price value adds an important and realistic
determinant of consumers’ decision making to the UTAUT.
Finally, literature has shown that habitual activities, characterized as the predicted future
behavior based on previous behavior (Venkatesh, Morris, & Ackerman, 2000), significantly
influence consumers’ prospective use of technology (Kim & Malhotra, 2005).
4.1.2 Shortcomings in the light of Technology-Derived Services
To sum it up, literature on behavioral intention and usage intention of new technologies pro-
vides a thorough understanding of the relevant constructs for customers’ technology acceptance.
Nevertheless, most of researchers’ effort was dedicated to gain insights into IT acceptance in
an organizational context, except Venkatesh et al.’s (2012) adoption of consumer specific con-
structs within the UTAUT. However, with the presence of TDS, the author proposes that there
are distinct constructs, which are more suitable to explain customers’ acceptance of this new
services as the above described models emerged in the light of IT acceptance. This proposition
20

4 Literature Review on Technology and Service Acceptance
also aligns with Schepers and Wetzels (2007) finding that the predictive power of the constructs
included in their model is significantly dependent on the technology at question. This point will
be further developed in Chapter 5.1.
4.2 Service Acceptance
4.2.1 Evaluation of Services
Literature has focused on several constructs in the context of service evaluation. Prior work in
academia revealed that service quality, service value, and service satisfaction have significant
direct and indirect effects on behavioral intention (Barrutia & Gilsanz, 2012; Brady et al.,
2005; Cronin Jr., Brady, & Hult, 2000), which is strong indicator for Word of Mouth (WOM),
customer loyalty, cross-selling, and ultimately price-premium acceptance (Zeithaml, Berry, &
Parasuraman, 1996).
Service Quality
Especially service quality was and still is of major interest in academia (eg. Bolton & Drew,
1991; Brady & Cronin Jr., 2001; Golder et al., 2012; Parasuraman et al., 1988; Sivakumar,
Li, & Dong, 2014; Zeithaml et al., 1996). In general, service quality can either be described as
consumers’ reconciliation of expected service performance and actual performance (Bolton &
Drew, 1991) or understood as a higher-order formative construct based on the latent constructs
interaction quality, physical environment quality, and outcome quality, which are reflected in a
total of nine variables (Brady & Cronin Jr., 2001).
In addition, Sivakumar, Li, and Dong (2014) explored how the occurrence of service failure
effects customers’ perception of service quality depending on different temporal dimensions.
As nowadays competitive business environment is often associated with cost-cuttings and is
therefore more prone to service failures, the more important it is for service companies to con-
trol the occurrence of service failures and the corresponding exaggerated customer satisfaction
(Sivakumar et al., 2014).
Moreover, since the increasing use of technology for service provision to encounter the chal-
lenge of service productivity (R. Rust & Huang, 2012), literature has also addressed the ques-
tion how this exaggerating implementation of technology within the service process affects
consumers’ perception of service quality and therefore consumers’ behavioral intention (Dab-
holkar, 1996).
21

4 Literature Review on Technology and Service Acceptance
Service Value
Besides the service quality, customers also make judgments on the service value, i.e. their
consideration of gains and sacrifices arising from the service at question (Zeithaml, 1988).
Mathwick, Mahotra, and Rogdon (2001) referred to service value also as “consumer return on
invest” (Mathwick et al., 2001, p.41). Thereby, the investment is not limited to monetary as-
pects, as prior literature already states (eg. Zeithaml, 1988), but also encompasses temporal and
effort aspects (Berry et al., 2002). In addition, prior research also proposed a hierarchical order
of values, such that value is derived by goals and purposes, situational usage consequences, or
attributes and performance of a product (Woodruff, 1997).
Since the introduction of the SDL by Vargo and Lusch (2004), literature on service value also
investigated how to increase perceived value given that the customer is an operand resource
in the value creation process. Therefore, current research identified a key-driver of customer
value, namely self-efficacy (van Beuningen, de Ruyter, & Wetzels, 2011). In specific, it turned
out that exaggerated customer self-efficacy, caused by the service, positively contributes the
perceived service value. Furthermore, Barrutia and Gilsanz (2012) give empirical evidence,
that value perception is influenced in a positive way by both perceived service quality and
customer experience, whereas the corresponding interaction effect has a negative impact on
value perception. Having in mind that customer self-efficacy results out of gained experiences
(Gist & Mitchell, 1992), these findings confirmed the ones of van Beuningen et al. (2011) and
indicate that quality perception is even a stronger predictor for value perception.
Service Satisfaction
Following Woodruff (1997), customers’ service satisfaction contributes to “the feelings in re-
sponse to evaluations of one ore more use experiences” (Woodruff, 1997, p.143). Thereby,
evaluation means customers’ comparison of the actual outcome and their expected outcome of
an employed service (Dotzel et al., 2013). Further, Lam, Shankar, and Murthy (2004) point
out that satisfaction has either a specific mean for a single experience or an overall long-term
character.
Especially for understanding customers’ acceptance of TDS, literature already provides em-
pirical evidence that satisfaction with a technology-assisted service can be increased for service
processes which take less time and are more personalized (Collier & Kimes, 2012). Further,
whenever customers are part of the value creation in a service context, recent literature also
stresses the necessity of hedonic aspects during the service process as a means to exaggerate
service satisfaction (Yim et al., 2012).
22

4 Literature Review on Technology and Service Acceptance
Behavioral Intention
Although the aforementioned constructs were conceptualized, operationalized, and empirically
investigated in a service context, the main goal was the same as it was in a technology accep-
tance context: deepen the understanding of behavioral intentions of customers, namely WOM,
loyalty, cross-selling, and price-premium. This fact is also echoed in most recent literature,
which suggests a so-called value-satisfaction-behavioral intentions chain in the service context
(Barrutia & Gilsanz, 2012).
4.2.2 Drawbacks of Evaluation for Technology-Derived Services
As literature on service acceptance aims at identifying reasonable ways how to influence cus-
tomers’ behavioral and usage behavior, it has to take technology-assisted services and their
distinct characteristics more and more into account. Nevertheless, it still lacks to address the
emerging market of TDS. Being more precise, since TDS are not dependent on any customer
interaction, i.e. the consumer is no longer seen as an operand resource as it was the case in
the light of the SDL paradigm, research on customers’ contribution to service evaluation falls
short although technology specific constructs were already considered (e.g. Barrutia & Gilsanz,
2012; Buttgen et al., 2012; Collier & Kimes, 2012; Meuter et al., 2005; van Beuningen et
al., 2011).
In addition, the above mentioned constructs service quality, service value, and service sat-
isfaction arise in three distinct temporal stages, i.e. during the pre-purchase phase, the service
encounter, and the post-purchase phase (e.g. Bradley & Sparks, 2002). Since this paper strives
to shed light on customers’ acceptance of TDS, the author focuses on the pre-purchase phase.
During this phase, customers are typically concerned with their perception of risks associated
with the service and the corresponding service attributes, e.g. their perceived service quality.
While literature already provides several findings for various service attributes like social utility
(e.g. Nysveen et al., 2005) or convenience (e.g. Collier & Kimes, 2012), conceptual models on
behavioral intentions in the service context still lack to incorporate risk perception adequately,
although recent literature clearly points at this issue (Wunderlich et al., 2012).
23

5 Assessing the Acceptance of Technology-Derived Services
5Assessing the Acceptance ofTechnology-Derived Services
By recapping both the shortcomings of technology acceptance models and the drawbacks of
service acceptance research, it turned out that literature either misses to account for TDS spe-
cific characteristics or has neglected this new type of services at all. To address this gap, the
author provides a new acceptance model for TDS in the Business-to-Consumers (B2C) con-
text. Thereby, new TDS specific constructs are derived and their relations with respect to the
acceptance of TDS are hypothesized.
5.1 Conceptualizing the Acceptance Model for
Technology-Derived Services
Since literature has not addressed TDS, yet they are in the market for a while, it is no sur-
prise that acceptance models for technology and services still lack of appropriate predictors.
To resolve this gap, the following section derives new constructs, which are suitable for cap-
turing the new and distinct characteristics of TDS. In specific, the author proposes that an-ticipated temporal discharge, perceived controllability, and perceived service safety have
significant effects on customers’ acceptance of TDS. To assess customers’ acceptance of TDS
in the model, the author incorporates attitude towards using the TDS, as this is a reliable in-
dication of customers’ future intentions (e.g. Nysveen et al., 2005). Finally, the relations of the
aforementioned constructs within the acceptance model for TDS are hypothesized.
24

5 Assessing the Acceptance of Technology-Derived Services
5.1.1 Attitude towards using the TDS
The model comprises consumers’ attitude towards making use of a TDS as an indicator of the
acceptance of TDS. This aligns with both research streams on technology and service accep-
tance (e.g. Curran, Meuter, & Surprenant, 2003; Dabholkar & Bagozzi, 2002; F. Davis, 1989;
Nysveen et al., 2005; Wunderlich et al., 2012).
Despite the broad body of literature on technology and service acceptance, there is still a
lack of accurate constructs to fully understand the acceptance of TDS. Therefore, the author
introduces three new predictors in the following sections.
5.1.2 Anticipated Temporal Discharge
Since the distinction of TDS is to provide direct value to customers without any additional
operand resource, the major advantage of these products is obvious: saving time. When tak-
ing a closer look on crucial constructs of previous acceptance models, namely performance
expectancy and perceived usefulness (e.g. Venkatesh & Bala, 2008; Venkatesh et al., 2012),
some of the empirically tested items are closely linked to time saving. In specific, participants
were asked to indicate whether the technology at hand increases their performance and pro-
ductivity (Venkatesh et al., 2012) or help them to accomplish a task more quickly (Venkatesh
& Bala, 2008). However, none of the related constructs clearly accounts for perceived time
saving.
This is in line with Kleijnen, de Ruyter, and Wetzels (2007) finding that time utilities directly
contribute to consumers’ value perception of services, as time is perishable and not storable for
later use (Okada & Hoch, 2004). Therefore, time is “it is the scarce resource” (Leclerc et al.,
1995, p.110). Moreover, as consumers strive to spend more and more time in the so-called
third space, that is time spent in leisure or retail environment (Hourahine & Howard, 2004),
value perception of time-saving products will increase in the future. Accordingly, services
allowing for polychronic use of time, i.e. carrying out different tasks at the same time (Cotte,
Ratneshwar, & Mick, 2004; Feldman & Hornik, 1981), will be favored by customers more
and more. Therefore, a new construct is proposed to properly address the unique time-saving
capability of TDS, namely anticipated temporal discharge.
In line with the aforementioned reasoning, the author proposes the following hypothesis:
H1: Anticipated temporal discharge of TDS has a positive effect on consumers’
attention towards using the TDS.
25

5 Assessing the Acceptance of Technology-Derived Services
The author suggest the following items to represent the perceived temporal discharge con-
struct (see table 5.1):
Table 5.1: Anticipated Temporal Discharge
New Con-struct
Items Explanation
Anticipated
Temporal
Discharge
Using the system increases my overall produc-
tivity
The degree to which an
individual attributes time
savings to the use of TDS
Using TDS allows me to reallocate my time to
other activities
Using TDS saves me time
Using TDS let me focus on other tasks
I find TDS effective*(* indicates that the item is adopted from Venkatesh, Morris, Davis, and Davis (2003))
5.1.3 Perceived Service Safety
As prior literature demonstrates, services in general are perceived to be riskier than products
(Mitchell & Greatorex, 1993; Murray & Schlacter, 1990). Therefore, the author proposes
that perceived service safety, which is a positive manifestation of perceived physical risk, is a
relevant determinant of customers’ acceptance of TDS.
In general, consumers’ risk perception comprises different dimensions of risk, which con-
tribute to the overall risk perception. In specific, the overall risk perception is defined by social
risk, psychological risk, performance risk, financial risk, and physical risk, which was sug-
gested and empirically tested by Jacoby and Kaplan (1972). Further, Kaplan, Szybillo, and
Jacoby (1974) showed that the overall risk perception of customers is best predicted by their
indicated performance risk, whereas physical risk has the least predictive power for the overall
risk perception. Drawing on these findings, Brooker (1984) added time-loss as a new dimen-
sion of consumers’ risk perception to the originally proposed five dimensions. The results were
twofold as they revealed that the newly included dimension time-loss has the second highest
loading on consumers’ overall risk perception.They also confirmed that performance risk is the
strongest predictor for the overall risk perception. Rethinking the established constructs per-
formance expectancy (Venkatesh et al., 2003) and perceived usefulness (Venkatesh & Bala,
2008), it is worth noting that these two constructs reflect the aforementioned dimensions of
26

5 Assessing the Acceptance of Technology-Derived Services
risk, i.e. performance risk and time-loss. Nevertheless, the authors termed the corresponding
items as gains. It is worth noting that Venkatesh et al. (2003) and Venkatesh and Bala (2008)
also use the aforementioned dimensions of risk, i.e. time-loss and performance risk, but frame
it positively as performance expectancy and perceived usefulness.
However, with regard to TDS it is at question, whether these findings still hold. In specific,
the author doubts that physical risk still has the lowest predictive power for the overall risk
perception, which was the case in prior research (Brooker, 1984). Especially in a person-related
context (e.g. an autonomous driving car) the author proposes that the physical dimension of
perceived risk gains significant attention. This is substantiated by prior literature, which states
that physical risk perception is significantly higher for services compared to products in any
case (Murray & Schlacter, 1990). To adequately capture this issue in the acceptance model for
TDS, the author suggests the new construct of perceived service safety, representing an reversed
equivalent to physical risk (cf. Venkatesh et al., 2003). Since a myriad of research shows that
risk perceptions have a significant effect on customers’ attitudinal and behavioral responses
(e.g. De Ruyter, Wetzels, & Kleijnen, 2001; Im, Kim, & Han, 2008; Meuter et al., 2005), the
author proposes for TDS applied in a person-related context that:
H2: When TDS are applied in a person-related context, perceived service safety has
a positive effect on consumers’ attitude towards using the TDS.
The following items are proposed to reflect customers’ perceived service safety (see table
5.2):
Table 5.2: Perceived Service Safety
New Con-struct
Items Explanation
Perceived
Service Safety
The TDS gives me the feeling of being safe The degree to which an
individual perceives the
service process to be safe
with respect to potential
physical damages
Using TDS increases my safety
I would recommend TDS for safety reasons
I have no safety concerns using the TDS
I am relaxed while making use of TDS(items are author’s own proposition)
27

5 Assessing the Acceptance of Technology-Derived Services
5.1.4 Perceived Controllability
In general, customers’ control over any process and the respective outcomes can be distin-
guished into their perception of control and their motivation for control (Burger, 1984). Thereby,
the latter one is associated with customers’ desire of control over a process (e.g. Law, Logan, &
Baron, 1994; Wortman & Brehm, 1975), whereas perception of control is linked to Rotter’s
(1966) locus of control. In the light of the acceptance of TDS the author focuses on customers’
perception of control.
Drawing on the idea of internal and external control over outcomes (Rotter, 1966), Bradley
and Sparks (2002) conceptualized the so-called service locus of control, which is primarily
concerned with consumers’ expectation (Shapiro Jr., Schwartz, & Astin, 1996) of control over
a service. Thereby, locus of control focuses on events in the future rather than on retrospective
causalities (Bradley & Sparks, 2002). In accordance, recent literature clearly points out the
importance of customers’ perception of control over the service process in technology-assisted
service contexts (Wunderlich et al., 2012). More precise, it turns out that an interview-partner
stresses that “control plays a very important role.” (Wunderlich et al., 2012, p.11). In line
with that, Meuter, Ostrom, Bitner, and Roundtree (2003) give empirical evidence that perceived
control over the service process leads to increased service quality perceptions. These findings
were also echoed by Collier and Sherrell (2010).
Intelligent products capable of delivering TDS are designed to operate without any required
customer-interaction during the service process. That is, the customer is no longer an interactive
part in the value-creation process. However, this fact results in a decrease of customers’ belief
to be able to control the service process (e.g. Shapiro Jr. et al., 1996). As an example, one
might think of an automated lawn mower which operates even when its owner is not at home.
Especially when TDS can be provided spatially distant to their users, that is when TDS are
object-related, perceived controllability has a positive effect on customers’ attitude towards
using the TDS. Therefore, the author proposes the following hypothesis:
H3a: When TDS are applied in an object-related context, perceived controllability
has a direct positive effect on customers’ attitude towards using the TDS.
In case of person-related TDS, where no spatial separation is possible, the author follows an-
other reasoning. Prior research has shown that a lack of process transparency over an operating
service encounter in persona leads to exaggerated risk perceptions (Wunderlich et al., 2012).
Since in case of a TDS the service provider’s employee is totally replaced by an intelligent prod-
uct providing the TDS, customer’s perceived lack of process transparency, i.e. controllability
28

5 Assessing the Acceptance of Technology-Derived Services
of the service process, might be increased. In line with that, the author hypothesizes that per-
ceived controllability has a positive effect on perceived service safety. Drawing on the previous
hypothesis H2, stating that in case of a person-related TDS perceived service safety has a direct
effect on customer’s attitude towards using the TDS, the author proposes a mediated effect of
perceived controllability on attitude towards using the TDS:
H3b: When TDS are applied in a person-related context, the positive effect of per-
ceived controllability on customers’ attitude towards using the TDS is mediated by
consumers’ perceived service safety.
The following items are proposed to represent the construct of controllability (see table 5.3):
Table 5.3: Perceived Controllability
AdaptedConstruct
Items Explanation
Perceived
Controllability
The TDS gives me the feeling of being in con-
trol*
The degree to which anindividual believes tocommand and exert powerover the process of a TDS(Collier & Sherrell, 2010)
The TDS allows the customer to be in charge*
While employing TDS, I feel decisive*
This TDS gives me more control over the ser-
vice process*(* indicates that the item is adapted from Collier and Sherrell (2010))
Based on the proposed predictors above and their hypothesized effects on consumers’ atti-
tude towards using a TDS, figure 5.1 presents the acceptance model of TDS.
29

5 Assessing the Acceptance of Technology-Derived Services
Anticipated Tem
poral D
ischarge
Perceived C
ontrollability
Perceived Service Safety
Attitude tow
ards using the TD
S
Application C
ontext: Person-related / O
bject-related
bold: new predictors
dotted: moderator
H1 :$+$$
H2 :$+$$
H3a :$+$$
H3b :$+$$
(+)$
(,)$
Figure5.1:A
cceptanceM
odelforTechnology-Derived
Services
30

5 Assessing the Acceptance of Technology-Derived Services
5.2 Empirical Evaluation of the
Acceptance Model for Technology-Derived Services
To test the hypothesized acceptance model for TDS, which also includes the validation of the
newly proposed and adapted constructs, two surveys were carried out. Study 1 covers the
empirical evaluation of the new constructs, which comprises several types of a Factor Analysis
(FA) on the proposed items. Study 2 is employed to assess the empirical validation of the
proposed acceptance model for TDS. As the model contains a mediation path, the applied SEM
assures for highest estimation performance compared to regression based mediation analyses
(e.g. Iacobucci, Saldanha, & Deng, 2007; Zhao, Lynch Jr., & Chen, 2010). All analyses were
run in the lavaan! (lavaan!) package (version 0.5-16) for R (version 3.1.1).
5.2.1 Study 1: New Construct Validation
The purpose of study 1 is to gain confidence in the empirical validity of the newly proposed
constructs presented in the light of the acceptance model for TDS. Therefore, a Confirmatory
Factor Analysis (CFA) was carried out, which is the most appropriate empirical analysis for
testing a hypothesized item-factor structure (e.g. Russell, 2002). As prior academic work
demonstrates, engaging an Exploratory Factor Analysis (EFA) prior to the CFA is a reasonable
way to identify improper items of new or adapted constructs (Sethi & Iqbal, 2008).
5.2.1.1 Data Collection and Measurement
Data Collection
Participants for study 1 were required via Amazon Mechanical Turk (mturk). As prior litera-
ture already stated, mturk is a reasonable source for collecting data in a scientific environment
(e.g. Berinsky, Huber, & Lenz, 2012; Buhrmester, Kwang, & Gosling, 2011), which is also
echoed in its wide usage in recent academic work (e.g. D. Davis & Herr, 2014; Giebelhausen,
Robinson, Siriani, & Brady, 2014; Goodman & Irmark, 2013; May & Monga, 2014).
A total of 210 participants (108 men) completed the survey with an average age of 34 years
(agemin=19 years; agemax=72 years). The educational level of the sample is as following: 55,8%
of the participants have earned a bachelor’s degree or higher, 26,2% have graduated form col-
lege and 18% were in comprehensive school or have no graduation.
Measurement
After a short welcome and introduction phase, participants were randomly assigned to one
31

5 Assessing the Acceptance of Technology-Derived Services
of three innovations, which were subsequently evaluated in the remainder of the study. The
three innovations were an autonomous vacuum cleaner, an app-controlled remote-parking of a
vehicle, and an autonomous driving car. To ensure that participants properly understood the
presented innovations, each innovation was provided with a short video-clip showing its func-
tionality in addition to a picture of the innovation and a short description containing key facts
of the innovation. Since the study aims to provide empirical validation of the new constructs
employed in the acceptance model for TDS rather than carrying out an experiment, possible
confounding effects caused by the video-clips were negligible.
Participants’ evaluation of the innovations were measured by using the newly proposed con-
structs, which were introduced in section 5.1, namely anticipated temporal discharge, perceived
controllability, and perceived service safety. All items were measured on a seven-point Likert
scale. The respective anchors were ”fully disagree” and ”fully agree”.
32

5 Assessing the Acceptance of Technology-Derived Services
5.2.1.2 Results
Prior to the CFA, an EFA is applied to identify possible improper items, which were proposed
for the new and adapted constructs. Thereby, both types of EFA principal axis analysis and
principal component analysis are used.
EFA
Principal component analysis derives the factor extraction by analyzing a correlation matrix,
as the communalities for all items are constrained to be 1.0, i.e. it is deemed that all variance
is captured by the extracted factors. In contrast, the principal axis analysis extracts the factors
based on a covariance-matrix, since the communalities are not constrained. Thus, the starting
values for the communalities are estimated by using the squared multiple correlation between
one item and the other items in the measurement-set. Therefore, the factor loadings are typically
lower for principal axis analysis than for principal component analysis by definition, because
the communalities are higher for the latter ones (Russell, 2002).
The appropriateness of the data for conducting a FA was also verified. In specific, the
Kaiser-Meyer-Olkin (KMO) value (0.89) indicates a very good distinction and reliability of
the extracted factors (Field, Miles, & Field, 2012).
Results from both the principal component analysis, and the principal axis analysis confirm
the proposed item-factor structure, whereas the factor-loadings of some items where not satis-
fying (see table 5.4 for details). The proposed number of factors represented by the new and
adapted items was also verified by applying a Screeplot analysis, see figure 5.2. Besides the vi-
sual representation, figure 5.2 contains graphical illustrations of additional numerical analyses,
which all suggest an optimal number of three factors.
Based on the presented results of the FA, the following items are dismissed for the remain-
ing analyses and will not be used in further studies: PSS4, PSS5, and PC3. Although the factor
loading for ATD5 is above the threshold of .7 in principal component analysis, the more de-
manding principal axis analysis rejects item ATD5. Thus, item ATD5 will also be removed for
further analyses. Table 5.5 summarizes the final items used in the remainder of this thesis.
Finally, comparing the values of the correlation matrices’ determinants of the initial item set
(4.61 ∗ 10−7) with the final item set (2.15 ∗ 10−5) reveals that the latter one also satisfies the
advised threshold (> 1.0 ∗ 10−5) for excluding multicollinearity (Joireman, Shaffer, Balliet, &
Strathman, 2012).
CFA
The final item set was further analyzed by applying a CFA. First, to confirm the unidimen-
33

5 Assessing the Acceptance of Technology-Derived Services
Table 5.4: Rotated Factor Loadings
PCA PAA
Items ATD PC PSS ATD PC PSS
ATD1 0.84 0.29 0.25 0.82 0.29 0.26
ATD2 0.90 0.24 0.18 0.90 0.23 0.19
ATD3 0.84 0.27 0.18 0.81 0.28 0.20
ATD4 0.91 0.20 0.16 0.90 0.19 0.17
ATD5 0.72 0.21 0.39 0.67 0.24 0.37
PSS1 0.30 0.29 0.83 0.31 0.30 0.80
PSS2 0.23 0.23 0.88 0.24 0.25 0.83
PSS3 0.21 0.27 0.88 0.22 0.28 0.85
PSS4 0.43 0.57 0.11 0.41 0.47 0.19
PSS5 0.62 0.41 0.42 0.59 0.4 0.42
PC1 0.19 0.89 0.24 0.21 0.88 0.24
PC2 0.24 0.86 0.25 0.26 0.84 0.25
PC3 0.33 0.66 0.41 0.35 0.62 0.39
PC4 0.24 0.85 0.24 0.26 0.82 0.25
Note. N=210; Factor loadings for both analyses after factor-rotation (varimax)
sionality of each construct demonstrated in the EFA, three single-factor models were analyzed.
The respective fit statistics are listed in table 5.6 and verify the unidimensionality of the new
constructs.
Finally, standardized parameter estimates, average variance extracted (AVE), composite re-
liability, and discriminant validity were also analyzed by using a CFA containing all ten items.
Table 5.7 shows the standardized loadings for the items, the composite reliability and the AVE
for the constructs. All factor loadings are significant and range from 0.859 (lowest) to 0.964
(highest). Since each construct’s CR value is > 0.7, construct reliability is given (cf. Bagozzi
& Yi, 1988). The recommended threshold value of > 0.5 for the AVE by Fornell and Larcker
(1981) was also exceeded by all factors. Hence, the analysis confirmed the proposed convergent
validity for all three constructs.
34
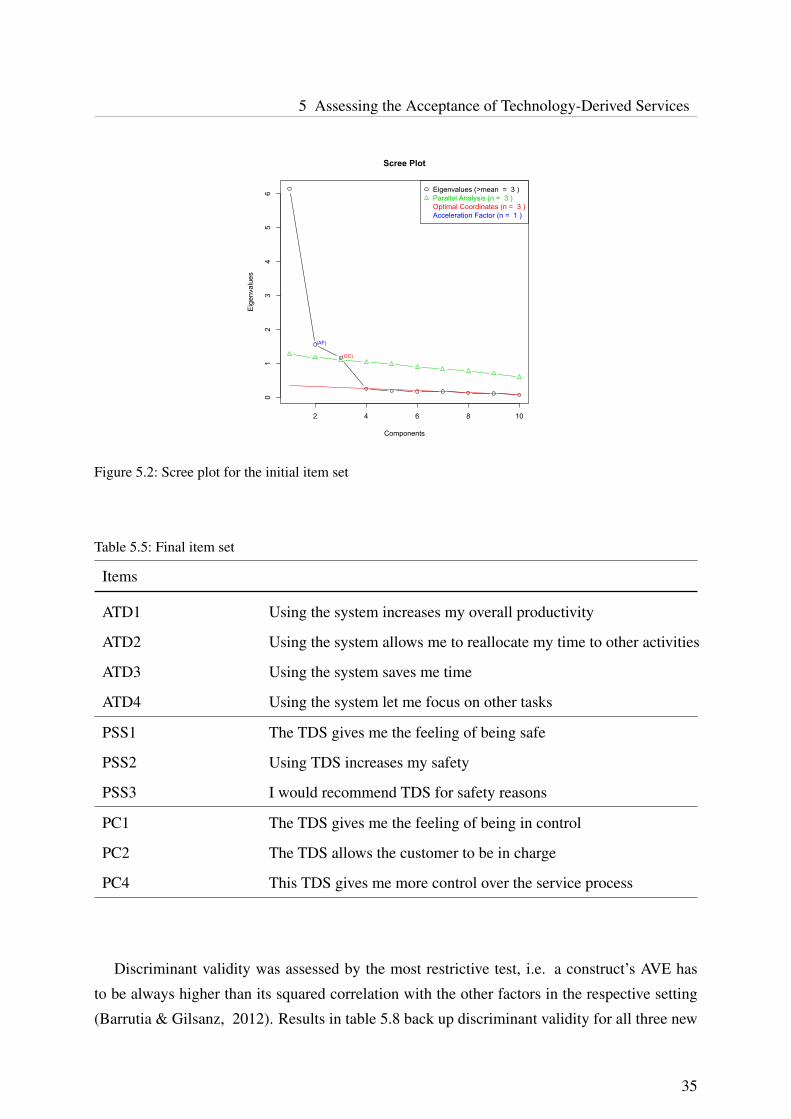
5 Assessing the Acceptance of Technology-Derived Services
2 4 6 8 10
01
23
45
6
Scree Plot
Components
Eigenvalues
Eigenvalues (>mean = 3 )Parallel Analysis (n = 3 )Optimal Coordinates (n = 3 )Acceleration Factor (n = 1 )
(OC)
(AF)
Figure 5.2: Scree plot for the initial item set
Table 5.5: Final item set
Items
ATD1 Using the system increases my overall productivity
ATD2 Using the system allows me to reallocate my time to other activities
ATD3 Using the system saves me time
ATD4 Using the system let me focus on other tasks
PSS1 The TDS gives me the feeling of being safe
PSS2 Using TDS increases my safety
PSS3 I would recommend TDS for safety reasons
PC1 The TDS gives me the feeling of being in control
PC2 The TDS allows the customer to be in charge
PC4 This TDS gives me more control over the service process
Discriminant validity was assessed by the most restrictive test, i.e. a construct’s AVE has
to be always higher than its squared correlation with the other factors in the respective setting
(Barrutia & Gilsanz, 2012). Results in table 5.8 back up discriminant validity for all three new
35

5 Assessing the Acceptance of Technology-Derived Services
Table 5.6: Unidimensionality for all scales
# Items χ2 d.f. p RMSEA GFI NNFI CFI
Anticipated temporal dis-
charge
4 0.09 2 0.98 0.00 1.00 1.00 1.00
Perceived service safety 3 0.05 1 0.83 0.00 1.00 1.00 1.00
Perceived controllability 3 2.97 1 0.08 0.07 0.99 0.98 0.99Note. RMSEA = root mean square error of approximation; GFI = Goodness of Fit Index; NNFI =
non-normed fit index; CFI = comparative fit index; As a model with a single-factor and three indicators
is just identified, i.e. model’s df =0, the loadings of the latter two indicators of the affected constructs are
constrained to be equal (cf. S. Rijsdijk et al., 2007)
constructs.
In terms of model fit, all fit indexes satisfied the proposed thresholds (L. Hu & Bentler,
1999), suggesting a good model fit. In specific, χ2(32) = 38.793, comparative fit index (CFI) =
0.996, Tucker-Lewis index (TLI) = 0.995, and root mean square error of approximation (RM-
SEA) = 0.032. See also table 5.7.
36
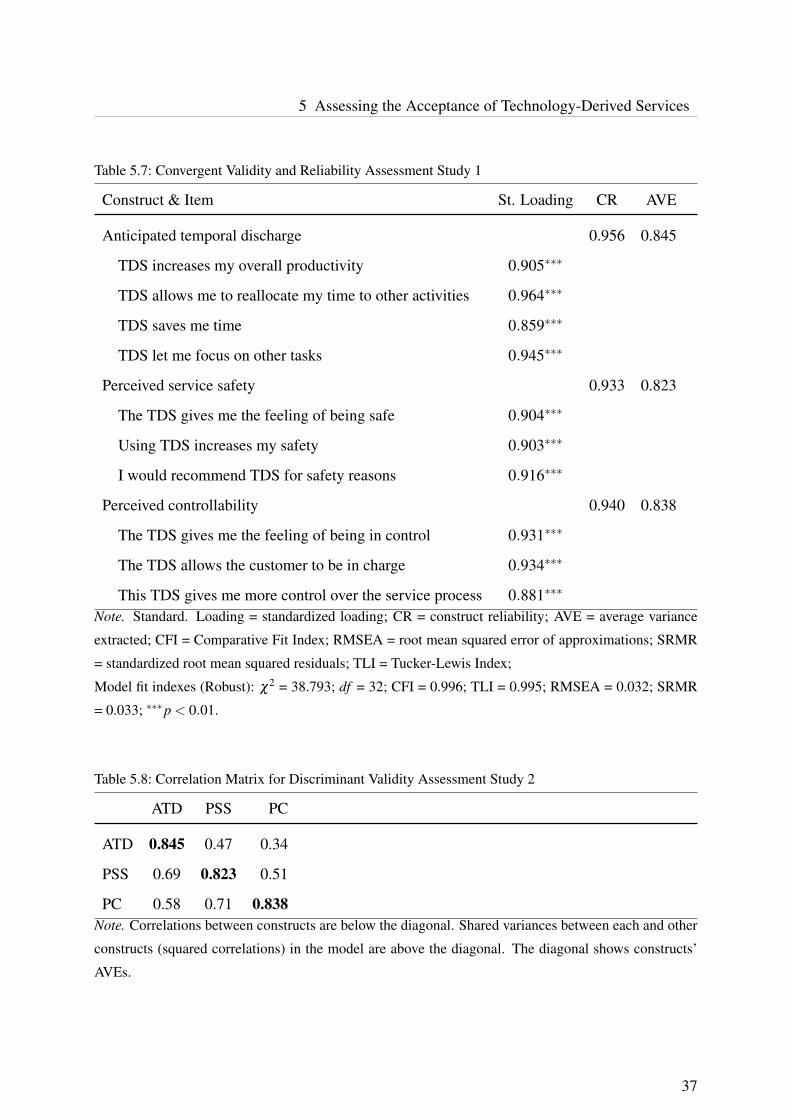
5 Assessing the Acceptance of Technology-Derived Services
Table 5.7: Convergent Validity and Reliability Assessment Study 1
Construct & Item St. Loading CR AVE
Anticipated temporal discharge 0.956 0.845
TDS increases my overall productivity 0.905∗∗∗
TDS allows me to reallocate my time to other activities 0.964∗∗∗
TDS saves me time 0.859∗∗∗
TDS let me focus on other tasks 0.945∗∗∗
Perceived service safety 0.933 0.823
The TDS gives me the feeling of being safe 0.904∗∗∗
Using TDS increases my safety 0.903∗∗∗
I would recommend TDS for safety reasons 0.916∗∗∗
Perceived controllability 0.940 0.838
The TDS gives me the feeling of being in control 0.931∗∗∗
The TDS allows the customer to be in charge 0.934∗∗∗
This TDS gives me more control over the service process 0.881∗∗∗
Note. Standard. Loading = standardized loading; CR = construct reliability; AVE = average variance
extracted; CFI = Comparative Fit Index; RMSEA = root mean squared error of approximations; SRMR
= standardized root mean squared residuals; TLI = Tucker-Lewis Index;
Model fit indexes (Robust): χ2 = 38.793; df = 32; CFI = 0.996; TLI = 0.995; RMSEA = 0.032; SRMR
= 0.033; ∗∗∗p < 0.01.
Table 5.8: Correlation Matrix for Discriminant Validity Assessment Study 2
ATD PSS PC
ATD 0.845 0.47 0.34
PSS 0.69 0.823 0.51
PC 0.58 0.71 0.838Note. Correlations between constructs are below the diagonal. Shared variances between each and other
constructs (squared correlations) in the model are above the diagonal. The diagonal shows constructs’
AVEs.
37

5 Assessing the Acceptance of Technology-Derived Services
5.2.1.3 Discussion
As of now, research can not provide academics and managers alike with suitable constructs to
measure the key dimensions regarding the emerging phenomenon of intelligent products capa-
ble of delivering TDS, like for instance self-driving cars, or automated lawn mowers. Therefore,
study 1 provides an empirical evidence for the reliability and validity of the newly proposed
constructs, namely anticipated temporal discharge, perceived service safety, and perceived con-
trollability. Accordingly, theoretical and managerial implications are provided in the following.
Theoretical Contribution
Building on a review of two literature streams, regarding technology acceptance and service
acceptance, the author identifies a lack of constructs that are suitable to describe customers’
acceptance of intelligent products capable of providing TDS. To resolve this issue, the author
proposes three new constructs, which reflect the key characteristics of TDS: anticipated tempo-
ral discharge, perceived service safety, and perceived controllability.
First, prior literature provided no appropriate construct to measure customers’ anticipated
temporal discharge, that is customers’ expectancy of time saving when making use of a TDS.
Since time saving is the key benefit of TDS for customers, e.g. getting your lawn trimmed
while being at work or preparing a presentation while getting chauffeured to your next meeting
in your self-driving car, a construct accounting for that fact was necessary. Therefore the author
proposes a five-item scale to operationalize customers’ anticipated temporal discharge. After
a scale-purification, the author demonstrated that the remaining four items meet all required
conditions to be considered as valid and reliable. Hence, the author contributes to the literature
of technology and service acceptance by adding a new distinct scale to measure the degree to
which an individual attributes time savings to the use of a TDS.
Second, despite the notion of physical risk in prior literature (e.g. Jacoby & Kaplan, 1972;
Kaplan et al., 1974), none of the most recent academic works on technology acceptance or ser-
vice acceptance incorporated this construct in their research models (e.g. Barrutia & Gilsanz,
2012; Venkatesh & Bala, 2008; Venkatesh et al., 2012; Wunderlich et al., 2012). Given
the fact that TDS are also applied in a person-related context, like it is the case for a customer
getting chauffeured in a self-driving car, the above mentioned research models fall short of ad-
dressing customers’ perceived service safety. To meet this issue, the author proposes a five-item
scale to measure this construct. Scale-purification suggested to dismiss two items. The remain-
ing three items gave proof to be valid and reliable. Thus, by providing an empirically tested
38

5 Assessing the Acceptance of Technology-Derived Services
scale to account for the degree to which an individual perceives the service process to be safe
with respect to potential physical damages the author contributes to the existing literature on
technology acceptance and service acceptance.
Third, the author adapts on an existing scale to provide an accurate measure for customers’
perceived controllability of a TDS (Collier & Sherrell, 2010). The scale is meant to cap-
ture customers’ perceived controllability of the service process when applying a TDS. The
aforementioned adapted four-item scale (cf. Collier & Sherrell, 2010) was administered to ex-
ploratory factor analyses for purification. The remaining three items proved to be valid and
reliable. Therefore, the author contributes to the existing literature on technology acceptance
and service acceptance by offering an optimized construct that helps to assess the degree to
which an individual believes to command and exert power over the process of a TDS (cf. Col-
lier & Sherrell, 2010).
Managerial Implication
Since more and more companies provide intelligent products capable of delivering TDS, it is
about time to provide managers with appropriate measurements for customers’ evaluation of
their offerings. Given these newly proposed constructs, managers now have scales at hand to
assess customers’ evaluation of the unique characteristics of TDS. Their application seems par-
ticularly useful for areas like new product development and market research. In the latter field
of application it can help to anticipate customers’ needs in order to exaggerate evaluations of
the unique characteristics of TDS. Within the new product development, the proposed scales
can help to identify an optimal design of intelligent products capable of providing TDS with
respect to customers’ evaluation.
Limitations and Future Research Directions
The author derived the proposed items for all three constructs based on a literature review (e.g.
Voss et al., 2003) and gave empirical proof for their validity and reliability (e.g. Batra, Ahuvia,
& Bagozzi, 2012). Nevertheless, the present study has some shortcomings. Recent academic
work states that large numbers of participants are not a necessity to perform structural equation
models (Iacobucci, 2010). However, this only holds true in case of established constructs, used
in a structural equations model (cf. Bearden, Sharma, & Teel, 1982). As the goal of this study
was to establish empirical validity and reliability, the sample size of 210 participants may be a
limitation of this study. Further research could apply the proposed scales on a wider range of
TDS to assess criterion validity of each of the new scales.
39
5 Assessing the Acceptance of Technology-Derived Services
5.2.2 Study 2: Validation of the Acceptance Model for TDS
In Study 2 the nomological validity of the core acceptance model for TDS is tested. There-
fore, the hypothesized paths are evaluated by applying a SEM. In specific, after evaluating the
measurement model via a CFA, the structural model is then assessed by running a SEM.
5.2.2.1 Data Collection and Measurement
Data Collection
Participants for study 2 were required by an online panel (mturk). For issues concerning the
adequacy of online panels for data collection please revise chapter 5.2.1.1.
A total of 347 participants (171 men) completed the survey with an average age of 36 years
(agemin=18 years; agemax=74 years). The educational level of the sample is as following: as
49% of the participants have earned a bachelor’s degree or higher, 28% have graduated form
college and 23% were in comprehensive school or have no graduation.
Measurement
Participants were randomly assigned to one of two innovations after a short welcome page. The
two innovations were an autonomous vacuum cleaner, and an autonomous driving car. Each
innovation was presented with a picture of the innovation and a description of the innovation’s
function. Because the two innovations represent both types of applications for TDS, that is an
object related TDS (vacuum cleaner) and a person related TDS (car) context, it is an optimal
design to empirically test validity of the acceptance model for TDS. Figures figure 5.3 and 5.4
show both stimuli.
Participants’ evaluation of the innovation was measured by using the newly proposed con-
structs, which were introduced in section 5.1, namely anticipated temporal discharge, perceived
controllability, and perceived service safety. All items were measured on a seven-point Lik-
ert scale. The respective anchors were ”fully disagree” and ”fully agree”. Participants’ atti-
tude towards using the TDS was assessed with four 7-point bi-polar items proposed by Dab-
holkar and Bagozzi (2002), namely bad/good, unpleasant/pleasant, harmful/beneficial, unfa-
vorable/favorable.
5.2.2.2 Results
This section captures the empirical validation of both the newly proposed constructs as well as
the hypothesized acceptance model for TDS. Whereas the employed measurement model eval-
40

5 Assessing the Acceptance of Technology-Derived Services
Figure 5.3: Stimuli: Object related TDS
Figure 5.4: Stimuli: Person related TDS
41
5 Assessing the Acceptance of Technology-Derived Services
uates the factor structure of the constructs by running a CFA, the subsequent SEM is applied
for testing the nomological validity of the acceptance model for TDS. All analyses are run in
the lavaan package (version 0.5-16) for R (version 3.1.1).
Measurement Model
Table 5.9 contains the results of the CFA. Thereby, the standardized loadings clearly indi-
cate unidimensionality of the constructs, as all loadings are significant (std.loadingmin = .850).
For each construct the corresponding composite reliability (CRmin = .939) exceeds the recom-
mended threshold of .7 (Bagozzi & Yi, 1988) and the average variance extracted (AV Emin =
.798) satisfies the condition for convergent validity established by Fornell and Larcker (1981).
Discriminant validity was assessed by the most restrictive test, i.e. a construct’s AVE has to be
higher than its squared correlation with the other factors in the respective setting (e.g. Barrutia
& Gilsanz, 2012; Fornell & Larcker, 1981). Results in table 5.10 back up discriminant validity
for all three new constructs. Finally, measurement invariance was assessed. Following Cheung
and Rensvold (1999), data satisfies the conditions for metric invariance, because there are no
significant differences between the configural model and the restricted model, where loadings
are constrained to be equal across groups. This is the prerequisite for comparing regression
slopes in a multi-group analysis.(cf. Chen, 2007). Corresponding results are presented in table
5.11.
Structural Model
Table 5.12 shows the results of the multiple-group analysis of the structural model and the
respective fit indexes. To account for the small sample size, fit indexes were derived by applying
the Satorra-Bentler scaling corrections (e.g. L. Hu & Bentler, 1999; Satorra & Bentler, 1994).
All indexes give proof of a reasonable model fit (e.g. Bagozzi & Yi, 1988, 2012; L. Hu &
Bentler, 1999; Iacobucci, 2010). That is, χ2144 = 207.440, CFI = 0.984, TLI = 0.979, RMSEA
= 0.050, and SRMR = 0.040. Hence, all indexes are below the recommended thresholds or
exceed the desired fit indexes. Figure 5.5 visualizes the results of the multi-group analysis.
To test the hypotheses, a multiple-group analysis was carried out, since it is capable of
accounting for moderating effects of categorical variables (e.g. Bagozzi & Yi, 2012). The
corresponding results confirm all of the proposed hypotheses (see table 5.12). Particularly,
the conditional indirect effect of participants’ perceived controllability on participants’ attitude
towards using the TDS is significant for person-related TDS only (H3b). Consequently, the
effect of participants’ perceived service safety on attitude towards using the TDS was only true
in case of a person-related application of the TDS, i.e. H2 was confirmed. In contrast, the direct
42

5 Assessing the Acceptance of Technology-Derived Services
Table 5.9: Convergent Validity and Reliability Assessment Study 2
Construct & Item St. Loading CR AVE
Attitude towards using the innovation 0.940 0.798
bad / good 0.921∗∗∗
unpleasant / pleasant 0.850∗∗∗
harmful / beneficial 0.876∗∗∗
unfavorable / favorable 0.924∗∗∗
Anticipated temporal discharge 0.961 0.860
TDS increases my overall productivity 0.926∗∗∗
TDS allows me to reallocate my time to other activities 0.944∗∗∗
TDS saves me time 0.897∗∗∗
TDS let me focus on other tasks 0.941∗∗∗
Perceived service safety 0.946 0.853
The TDS gives me the feeling of being safe 0.904∗∗∗
Using TDS increases my safety 0.938∗∗∗
I would recommend TDS for safety reasons 0.928∗∗∗
Perceived controllability 0.939 0.853
The TDS gives me the feeling of being in control 0.908∗∗∗
The TDS allows the customer to be in charge 0.950∗∗∗
This TDS gives me more control over the service process 0.884∗∗∗
Note. Standard. Loading = standardized loading; CR = construct reliability; AVE = average variance
extracted; CFI = Comparative Fit Index; RMSEA = root mean squared error of approximations; SRMR
= standardized root mean squared residuals; TLI = Tucker-Lewis Index;
Model fit indexes (Robust): χ2 = 164.947; df = 71; CFI = 0.983; TLI = 0.978; RMSEA = 0.062; SRMR
= 0.038; ∗∗∗p < 0.01.
effect of perceived control on attitude towards using the TDS is valid for object-related TDS
(H3a) only.
Following Paternoster, Brame, Mazerolle, and Piquero (1998) the proposed moderation ef-
fects of application type on perceived control and on perceived service safety were confirmed
by applying the subsequent equation, z = b1−b2√(SE2
b1+SE2
b2). Here, the indexes represent the differ-
43

5 Assessing the Acceptance of Technology-Derived Services
Table 5.10: Correlation Matrix for Discriminant Validity Assessment Study 2
ATD PSS PC ATI
ATD .860 0.211 0.408 0.407
PSS 0.459 .853 0.467 0.387
PC 0.639 0.684 .836 0.354
ATI 0.638 0.622 0.595 .798Note. Correlations between constructs are below the diagonal. Shared variances between each and other
constructs (squared correlations) in the model are above the diagonal. The diagonal shows constructs’
AVEs.
Table 5.11: Measurement invariance tests Study 2
χ2 df p CFI RMSEA BIC
Model 1: configural invariance
263.145 142 .000 .978 .070 13732.983
Model 2: weak invariance (equal loadings across groups)
275.578 152 .000 .977 .068 13686.923
Model 1 compared to Model 2
∆χ2 ∆ df ∆ p ∆ CFI
12.432 10.000 .257 .000Note.
ent slopes and the respective standard errors for the two groups, i.e. object-related context (b1)
and person-related context (b2). Results revealed that the slopes for the two groups were sig-
nificantly different for both perceived control, t(343) = 2.869, p < 0.01, and perceived service
safety, t(343) = 7.448, p < 0.01. Hence, hypotheses H3a and H3b are supported.
Finally, effects of the Common Method Variance (CMV), first discussed by D. Campbell and
Fiske (1959), are addressed. CMV deals with the problem of measuring independent constructs
and dependent constructs with the same method, here the same questionnaire (cf. Podsakoff,
MacKenzie, & Podsakoff, 2012). A post-hoc test following Haman’s single factor test (e.g.
Noordhoff, Kyriakopoulos, Moorman, Pauwels, & Dellaert, 2011) indicates that there could
possibly be some effect of CMV, as the proportion of the explained variance by the single fac-
tor is at the threshold of .5, although no majority of the variance is explained by a single factor
44

5 Assessing the Acceptance of Technology-Derived Services
and this parsimonious model is more likely to reveal CMV (Chang, Van Witteloostuijn, & Eden,
2010).
Table 5.12: Structural Models Estimation Study 2
Hypothesis & Effects Core Model
Person Related Context Object Related Context
Estimate Est. / SE p Value Estimate Est. / SE p Value
Direct Effects
ATD →ATI
.318∗∗∗ 5.916 .000 .433∗∗∗ 5.343 .000
PC→ PSS .769∗∗∗ 9.774 .000 .581∗∗∗ 7.195 .000
PSS →ATI
.558∗∗∗ 8.848 .000 −.023 −.489 .625
PC→ ATI −.068 −.968 .333 .195∗∗∗ 3.368 .001
Indirect Effect
PC→ ATI .429∗∗∗ 6.246 .000 −.013 −.488 .625
R2ATI .681 .558
PSS .478 .340
Note. Standard. Loading = standardized loading; CR = construct reliability; AVE = average variance
extracted; CFI = Comparative Fit Index; RMSEA = root mean squared error of approximations; SRMR
= standardized root mean squared residuals; TLI = Tucker-Lewis Index;
Model fit indexes (Robust): χ2 = 207.440; df = 144; CFI = 0.984; TLI = 0.979; RMSEA = 0.050; SRMR
= 0.040.
45

5 Assessing the Acceptance of Technology-Derived Services
Anticipated Temporal Discharge
Perceived Controllability
Perceived Service Safety
Attitude towards using the TDS
.318***&&
.558***&
(.068&n.s.&
.769***&&
Person-related
Object-related
Anticipated Temporal Discharge
Perceived Controllability
Perceived Service Safety
Attitude towards using the TDS
.433***%%
&.023%n.s.%
.195***%
.581***%%
Figure 5.5: Results of the Multi-group SEM
46

5 Assessing the Acceptance of Technology-Derived Services
5.2.2.3 Discussion
Theoretical Contribution
The goal of study 2 was to provide empirical evidence for the nomological validity of the pro-
posed acceptance model for TDS. Since the corresponding results confirmed the proposed
hypotheses, the nomological validity of the proposed acceptance model is approved. Addition-
ally, the results gave further evidence for the empirical validity and reliability of the proposed
scales anticipated temporal discharge, perceived service safety, and perceived controllability.
The author presents the first acceptance model for TDS that comprises the new TDS specific
constructs. Since current technology acceptance models and service acceptance models have
drawbacks with respect to the new characteristics of TDS (see chapter 4), the author provides
an initial solution to resolve this issue. Although the proposed model for the acceptance of TDS
focused only on the respective key dimensions, namely anticipated temporal discharge, per-
ceived service safety, and perceived controllability, the model explains a reasonable proportion
of participants’ attitude towards using the presented TDS. In the person-related condition (the
autonomous driving car) the model accounted for 68.1% of the variance of participants’ attitude
towards using the TDS and in the object-related condition (the autonomous vacuum cleaner) the
model explained 55.8% of the variance of participants’ attitude towards using the TDS.
Managerial Implication
In combination with the newly proposed constructs, managers now are provided with a tool
for a holistic assessment of customers’ acceptance of any TDS, as the model can be applied to
evaluate customers’ acceptance of TDS in both a person-related context and an object-related
context.
The model allows managers not only to determine which design characteristics of a TDS in-
fluence anticipated temporal discharge, perceived service safety, and perceived controllability,
but also to assess the overall impact of a design change on customers’ attitude towards using
the TDS.
Limitations and Future Research Directions
The presented acceptance model for TDS strives for parsimony. Although the model achieved
good explanatory power, the author still proposes to identify and incorporate further constructs.
Drawing on the beginnings of the TAM (F. Davis, 1989) and its evolution until the latest ver-
sion, the so-called TAM 3 (Venkatesh & Bala, 2008), the author stresses to identify further
constructs either by revising prior literature or by conducting qualitative research to uncover
further drivers for the acceptance of TDS. The author also proposes that implementing indi-
47

5 Assessing the Acceptance of Technology-Derived Services
vidual predispositions as moderators into the model could further reveal interesting insights
on customers’ acceptance of TDS (e.g. Devaraj, Easley, & Crant, 2008). In specific, future
research could investigate how individuals’ regulatory focus (Higgins, 1997) or motivation
for control (Burger, 1984; Wortman & Brehm, 1975) moderates the proposed effects of the
acceptance model for TDS.
48

6 Business Impact of Technology-Derived Services
6Business Impact ofTechnology-Derived Services
Besides the proposed Acceptance Model for TDS, which was introduced in chapter 5, the author
strives to provide first insights on how this new type of services could possibly affect established
business models in the following. The hypothesized effects are examined in an experimental
setting provided in this chapter.
6.1 Theoretical Background and Hypotheses
Advancements in technology have not only lead to more standardized, technology-based ser-
vices (e.g. R. Rust & Huang, 2012), but also to more autonomous, smart products (e.g. S. Rijs-
dijk et al., 2007; S. A. Rijsdijk & Hultink, 2009). These products deliver services to their users
without further active input and hence increasingly blur the distinction between products and
services (Huang & Rust, 2013). While much research has been conducted to understand how
individuals perceive and respond to an increasing technology-based service delivery (Meuter et
al., 2005, 2000), much less research attention has been paid to individuals’ attitude and inten-
tion towards increasingly autonomous products providing TDS. However, as firms have started
to introduce intelligent products capable of delivering TDS which affect consumers’ daily lives
(e.g., autonomous lawn mowers, vacuum cleaners, parking assistance), it is important to under-
stand if, why and when consumers would prefer such TDS over their conventional counterparts.
TDS are characterized by their autonomous completion of a task. In comparison to conven-
tional products, intelligent products providing TDS do not need any further input from the user
other than the push of a power button. Everything else, like the mowing of a lawn or vacuuming
of an apartment, is left up to the engaged intelligent product. Hence, users’ required efforts to
accomplish a task are lowered, i.e. they gain more free time, which is measured by anticipated
49

6 Business Impact of Technology-Derived Services
temporal discharge. Likewise, users gain more free time when signing up for a conventional
service, such as getting their apartment vacuumed or their lawn trimmed by a housekeeper or a
gardener. Hence, users are likely to experience freed up time in both cases, TDS and conven-
tional services. Thus, the author proposes the following hypotheses:
H4a: Customers’ anticipated temporal discharge is higher for an intelligent product
delivering TDS compared to a conventional product.
H4b: Customers’ anticipated temporal discharge of an intelligent product deliver-
ing TDS is equivalent to a conventional service.
This gain of leisure time, however, takes its toll. TDS will gain more and more importance
in the future, but first academics and managers alike have to come up with solutions for current
challenges, which are hypothesized below. Unlike in the case of conventional products that rely
on users’ input when completing a task (e.g. Lusch & Vargo, 2006; Vargo & Lusch, 2004), an
intelligent product providing TDS does no longer require user’s input for the service process,
given its autonomy. However, prior research has shown that individuals generally overestimate
the quality of their own work or perceive outcomes better, the more self they are able to put into
the process. This effect has been termed as the IKEA effect (Mochon, Norton, & Ariely, 2012),
or the I-made-it-myself effect (e.g. Troye & Supphellen, 2012). Transferring these findings to
the realm of TDS, one can propose that consumers may anticipate minor process quality of
intelligent products delivering TDS compared to conventional products due to the lack of own
input. Hence, the author proposes the following hypothesis:
H5a: Customers’ anticipated process quality of intelligent products capable of pro-
viding TDS is lower than for conventional products.
Prior academic work has shown that service providers can increase their efficiency by im-
plementing more automation to their service processes at the cost of lower perceived process
quality (e.g. Anderson et al., 1997). In line with that, R. Rust and Huang (2012) clearly stress
the point that “at a given level of technology, less labor intensity in service decreases service
quality”(p. 49). Therefore, one can conclude that customers may anticipate a lowered process
quality for TDS in comparison to a regular service delivery, since an intelligent product capable
of delivering TDS embodies a fully automated service representative. Thus, the author proposes
the following hypothesis:
H5b: Customers’ anticipated process quality is lower for TDS than for conventional
services.
50

6 Business Impact of Technology-Derived Services
Drawing on Cronin Jr and Taylor’s (1992) reasoning that service quality in the end is an
attitude, the author conceptualizes the effect of object type () and anticipated temporal discharge
on customers’ attitude towards the TDS as the following:
Customers’ perceived service quality has been conceptualized as a multi-dimensional con-
struct in various academic works (cf. Brady & Cronin Jr., 2001). Nevertheless, these concepts
have in common that service quality is basically determined by two factors, process quality and
outcome quality (e.g. Barrutia & Gilsanz, 2012; Surprenant & Solomon, 1987). Whereas the
latter one addresses the general objective of subscribing to a service agreement (e.g. getting
the lawn trimmed and therefore freeing up time) the former one is linked to the degree of how
well the service was provided (i.e., how well is the lawn trimmed) (cf. Sivakumar et al., 2014;
Smith, Bolton, & Wagner, 1999). Adapting on the service dominant logic and its paradigm of
value in use (Vargo & Lusch, 2004), users also have a focal objective in mind when buying
a product and are also concerned with product’s ability to increase their process quality (e.g.
F. Davis, 1989; Venkatesh & Bala, 2008; Venkatesh et al., 2012). Hence, it seems reasonable
to apply the aforementioned dual evaluation process of services also in a product context.
Since users’ main objective is freeing up time for other activities when leaving work for
the intelligent product delivering TDS, customers’ outcome quality is determined by their an-
ticipated temporal discharge. Likewise, process quality is determined on how well the user
“expects” (Dabholkar, 1996) the intelligent product delivering the TDS to fulfill the assigned
task. In other words, process quality is represented by anticipated quality of the delivered TDS.
Therefore, the author proposes:
H6: The effect of type of object (classic product vs. intelligent product capable
of delivering TDS) on customers’ attitude towards the object is mediated by cus-
tomers’ anticipated quality.
As already hypothesized that customers’ anticipated temporal discharge of an intelligent
product capable of delivering TDS is moderated by the offer type (product vs. service), the
author proposes the following hypothesis:
H7a: In a product context, the effect of type of object (classic product vs. intel-
ligent product capable of delivering TDS) on customers’ attitude is mediated by
anticipated temporal discharge.
H7b: In a service context, the effect of type of object (classic product vs. intelli-
gent product capable of delivering TDS) on customers’ attitude is not mediated by
anticipated temporal discharge.
51

6 Business Impact of Technology-Derived Services
6.2 Study 3: Effects of TDS on classic product and service
businesses
6.2.1 Design, Procedure, and Data Collection
Study Design and Procedure
Study 3 used a 2 (type of offer: product vs. service) x 2 (object type: classic product vs. in-
telligent product capable of delivering TDS) between-subjects design to test hypotheses H4a,
through H7b. After a short welcome page, an instructional manipulation check (cf. Oppen-
heimer, Meyvis, & Davidenko, 2009), and having answered questions concerning their predis-
positions, participants were randomly assigned to one of the four conditions. Each condition
was edited like a consumer report, presenting the stimulus with a picture and a description of the
core features as well as the respective order process. Once participants have read the consumer
report, they rated their attitude towards the described stimuli. They also evaluated the stimulus
with respect to the newly proposed scale anticipated temporal discharge (see chapter 5.1). Af-
terwards, they filled out the manipulation checks. Since the stimuli contained no momentarily
priming effects, there is no concern about the position of the manipulation checks after the core
dependent variables (cf. Fuchs, Schreier, & van Osselaer, 2015; Goodman & Irmark, 2013).
Finally, participants’ demographics were recorded.
Data Collection
Participants for study 3 were recruited by an online panel (mturk). For issues concerning the
adequacy of online panels for data collection, please revise chapter 5.2.1.1. A total of 163
participants (57 men) completed the survey with an average age of 37 years (agemin=18 years;
agemax=71 years). The educational level of the sample is as following: 42% of the participants
have earned a bachelor’s degree or higher, 34% have graduated form college and 24% were in
comprehensive school or have no graduation.
6.2.2 Measures
Independent Variables
Both manipulations type of offer, namely type of offer (product vs. service) and object type
(classic vs. intelligent product capable of delivering TDS), were incorporated in a fictitious con-
sumer report. Figures 6.1 - 6.4 show the corresponding original stimuli. Offer type was firstly
manipulated using the headline, i.e. “Smart House-Keeping Products for you!” vs. “Smart
52

6 Business Impact of Technology-Derived Services
House-Keeping Services for you!”. Secondly, offers’ specifications and the according order
processes were respectively adjusted whether it is about a service or a product. Finally, the type
of offer (service vs. product) was written in bold fonts at the beginning of the specifications and
the beginning of the order process to positively influence participants’ process fluency of the
stimulus (cf. Novemsky, Dhar, Schwarz, & Simonson, 2007; Shen, Jiang, & Adaval, 2010;
Tsai & McGill, 2011).
Object type was manipulated by a visual representation of the vacuum cleaner, i.e. a picture
of a regular vacuum cleaner for the “classic” condition and a self-made digital mock of an au-
tonomous vacuum cleaner for the “TDS” condition. In addition, the description part of the con-
sumer report clearly pointed out that the offer is about a “cutting edge vacuum cleaner” (classic
condition) versus a “cutting edge autonomous vacuum cleaner” (TDS condition). Lastly, object
type was also manipulated at the beginning of the order process. That is, the offer was written
in bold fonts, “IT Clean’s Smart Vacuum Cleaner” for the classic condition and “IT Clean’s
Autonomous Vacuum Cleaner” for the TDS condition.
Dependent Variables
Anticipated temporal discharge was assessed by applying the newly proposed four items, see
chapter 5.1 (α = .96). Anticipated quality was assessed on a 7-point bipolar scale, adapted from
the scale suggested by Suri and Monroe (2003) (α = .91). Participants’ attitude towards the
offer was assessed with five bi-polar items on 7-point scales. The item pairs were bad/good, un-
pleasant/pleasant, harmful/beneficial, unfavorable/favorable, unfair/fair (α = .90) (cf. Bansal,
Taylor, & James, 2005; M. C. Campbell, 2007; Dabholkar & Bagozzi, 2002; Sinclair &
Irani, 2005). To allow for a comparable measurement of participants’ willingness to pay due
to the fact that the conditions comprise products and services, the relative willingness to pay
was recorded by a single-item scale. In specific, participants were asked “How much more
or less are you willing to pay for IT Clean’s smart/ autonomous vacuum cleaner // IT Clean’s
autonomous/ smart house-keeping service compared to a conventional vacuum cleaner/ house-
keeping service”. The scale had a range from -100% to +100%.
Manipulation Checks
To check for manipulation of type of offer, participants answered a single-item. They were
asked to indicate how they perceived the offer (“For me, IT Clean is more of a. . . product (1)
- service (7)”). Manipulation of object type (classic vs. intelligent product capable of deliver-
ing TDS) was assessed by asking two items. Item one was adapted from the autonomy scale
53

6 Business Impact of Technology-Derived Services
Figure 6.1: Stimuli: TDS as product
Figure 6.2: Stimuli: TDS as a service
presented by S. Rijsdijk et al. (2007) (“IT Clean does things by itself.”). Item two asked for
participants perception of required human interaction during the operating process of IT Clean
54

6 Business Impact of Technology-Derived Services
Figure 6.3: Stimuli: Advanced product as product
Figure 6.4: Stimuli: Advanced product as a service
on a bi-polar scale (“I would say that IT Clean. . . requires human interaction while operating(1)
- does not require human interaction while operating (7)”).
55

6 Business Impact of Technology-Derived Services
Covariates
The questionnaire incorporated extraneous variables to account for the respective variance. Fol-
lowing Parasuraman (2000), the author recorded consumers’ innovativeness, which is defined
as a predisposition to be interested in and to seek for new products or brands (e.g. Goldsmith
& Hofacker, 1991; Steenkamp, ter Hofstede, & Wedel, 1999). Participants’ innovativeness
was assessed with the scale presented by Bruner II and Kumar (2007) (α = .95). As the re-
search object deals with high-technology, it seems reasonable to incorporate participants’ age
as a covariate in the analysis (e.g. Ma, Yang, & Mourali, 2014). Finally, participants’ prior
experiences with offers like the presented ones were assessed with one item (“Have you had
already experience with a smart product (offer type product)/ smart service (offer type service)
like IT Clean within the last three years?”).
56

6 Business Impact of Technology-Derived Services
6.2.3 Results
Manipulation ChecksThe expected manipulation of service vs. product was approved, as participants in the service
condition systematically rated the offer on a product (1) to service (7) scale higher than did par-
ticipants in the product condition, MProduct = 2.61,MService = 4.64,F(1,161) = 49.2, p < .001.
The sequentially rejective Bonferroni test (cf. Holm, 1979) also confirmed, that participants in
the service condition significantly perceived the intelligent product capable of providing TDS
more as a service than did participants in the product condition (MProduct = 3.00,MService =
3.99, t(81) =−2.11, p < .05).
Also, the manipulation of classic vs. intelligent product capable of providing TDS was con-
firmed, since participants in the classic condition significantly rated the object’s ability to do
things by itself lower than did participants in the intelligence condition (MClassic = 4.03,MIntelligence =
5.88,F(1,161) = 62.5, p< .001). Finally, participants perceived the objects’ capability to oper-
ate without human interaction systematically higher than did participants in the classic condition
(MClassic = 3.08,MIntelligence = 5.52,F(1,161) = 85.4, p < .001). Results of the manipulation
checks are presented in figures 6.5 - 6.7.
Product Service
Type
For m
e IT
Cle
an is
mor
e of
a p
rodu
ct (1
) - s
ervi
ce (7
)
12
34
56
7
ClassicIntelligent
Figure 6.5: Manipulation check type of offer (detailed)
57

6 Business Impact of Technology-Derived Services
Classic Intelligent
Type
It do
es th
ings
by
itsel
f
12
34
56
7
Figure 6.6: Manipulation check type of object
Classic Intelligent
Type
Ope
rate
s w
ithou
t hum
an in
tera
ctio
n
12
34
56
7Figure 6.7: Manipulation check type of object
58

6 Business Impact of Technology-Derived Services
Hypothesis testing
Anticipated temporal discharge was analyzed by a 2 x 2 analysis of covariance (ANCOVA).
Participants’ previous experience with smart products/ services had an insignificant effect on an-
ticipated temporal discharge. In contrast, participants’ innovativeness (F(1,155) = 7.7.39, p <
.01) and age (F(1,155) = 10.33, p < .01) had a significant effect on anticipated temporal
discharge. Object type had a marginal significant main effect on anticipated temporal dis-
charge, MClassic = 4.85,MIntelligence = 5.26,F(1,155) = 3.82, p = .0525). The main effect
of offer had a significant effect on anticipated temporal discharge, MProduct = 4.76,MService =
5.36,F(1,155) = 7.46, p < .01. Further, analysis revealed a significant interaction effect of ob-
ject type (classic vs. intelligent product capable of delivering TDS) and type of offer (product vs.
service), MClassProd = 4.28,MIntelProd = 5.26,MClassServ = 5.47,MIntelServ = 5.26,F(1,155) =
10.26, p < .01 on participants’ anticipated temporal discharge, see figure 6.8.
Product Service
Type
Ant
icip
ated
tem
pora
l dis
char
ge
12
34
56
7
ClassicIntelligent
Figure 6.8: Interaction plot for anticipated
temporal discharge
3.0 3.5 4.0 4.5 5.0 5.5 6.0
-4-2
02
Fitted values
Residuals
Residuals vs Fitted
72
43291
-2 -1 0 1 2
-3-2
-10
12
Theoretical Quantiles
Sta
ndar
dize
d re
sidu
als
Normal Q-Q
72
432258
3.0 3.5 4.0 4.5 5.0 5.5 6.0
0.0
0.5
1.0
1.5
Fitted values
Standardized residuals
Scale-Location72
432258
0.00 0.04 0.08 0.12
-4-3
-2-1
01
2
Leverage
Sta
ndar
dize
d re
sidu
als
Cook's distance
Residuals vs Leverage
72
432258
Figure 6.9: Diagnosis plot for analysis of
covariance (DV: anticipated temporal
discharge)
Diagnostic plots indicate that anticipated temporal discharge does not follow normality (see
figure 6.9). To resolve this issue, the Box-Andersen Test was applied on the factorial model only
(cf. Box & Andersen, 1955). Results confirmed that type of offer has a significant effect on par-
ticipants’ anticipated temporal discharge, F(1,159) = 6.73, p < 0.01. The significant interac-
tion effect of object type and type of offer was also confirmed, F(1,159) = 7.01, p < 0.01. Ad-
ditional tests for homogeneity of variance affirmed the visual tendency that variances are equal
59

6 Business Impact of Technology-Derived Services
across groups (FProductType(1,161) = 2.21, p = .14;FApplicationContext(1,161) = 1.89, p = .17).
To account for independence of covariates and the treatment groups (cf. Miller & Chap-
man, 2001), analyses of variance demonstrated that participants’ age and innovativeness did
not significantly differ between groups (age: MClassProd = 36.1,MIntelProd = 39.0,MClassServ =
34.8,MIntelServ = 37.6,F(3,158) = 0.9, p= .44; innovativeness: MClassProd = 4.14,MIntelProd =
3.49,MClassServ = 3.75,MIntelServ = 3.64, F(3,158) = 1.08, p = .36). A χ2 test also confirmed
that participants’ prior experience with intelligent products capable of delivering TDS, χ2(3) =
4.13, p = 0.248 did not significantly differ between groups.
Finally, testing for homogeneity of regression slopes (e.g. Alexander & DeShon, 1994)
it shows that none of the additionally included interaction terms had a significant effect on
participants’ anticipated temporal discharge. Therefore, homogeneity of regression slopes is
confirmed. Hence, hypotheses H4a and H4b are confirmed.
To analyze the effect of object type and type of offer on participants’ anticipated process
quality a 2 x 2 analysis of covariance was employed. None of the covariates, age, prior ex-
perience, and user innovativeness had a significant effect on anticipated quality. Importantly,
object type had a significant main effect on anticipated quality, MClassic = 5.46,MIntelligence =
4.81,F(1,155) = 11.32, p < .001 (see figure 6.10). The main effect of type of offer had no sig-
nificant effect on anticipated quality, MProduct = 5.21,MService = 5.05,F(1,155)= 0.56, p= .46.
The analysis also revealed an insignificant interaction effect of object type (classic vs. intelli-
gent product capable of providing TDS) and type of offer (product vs. service), F(1,155) =
.32, p = .57, on participants’ anticipated outcome quality.
The respective diagnostic plots indicate that normality is satisfied, but homogeneity of vari-
ance may not be fulfilled (see figure 6.11). Additional tests for homogeneity of variance af-
firmed the visual tendency that variances are not equal across groups. In specific, Levene’s
Test for homogeneity of variance shows that the variance between the object type conditions is
not equal, FOb jectType(1,161) = 3.95, p < .05, whereas conditions of type of offer have equal
variances, FTypeo f O f f er(1,161) = 1.89, p = .17. To account for this issue, the Brown-Forsythe
test statistic is applied (cf. Brown & Forsythe, 1974). Results confirmed the significant main
effect of object type on anticipated quality (F1,159 = 4.63, p < .05). An additionally carried
out robustified F-Test further confirmed the significant main effect of object type on anticipated
quality (F1,161 = 9.25, p < .05).
Homogeneity of regression slopes (e.g. Alexander & DeShon, 1994) was approved, since
60

6 Business Impact of Technology-Derived Services
Product Service
Type
Ant
icip
ated
Out
com
e Q
ualit
y
12
34
56
7
ClassicIntelligent
Figure 6.10: Main effect of object type on
anticipated quality
4.4 4.6 4.8 5.0 5.2 5.4 5.6 5.8
-3-2
-10
12
3
Fitted values
Residuals
Residuals vs Fitted
4469429
-2 -1 0 1 2
-2-1
01
2
Theoretical Quantiles
Sta
ndar
dize
d re
sidu
als
Normal Q-Q
4462994
4.4 4.6 4.8 5.0 5.2 5.4 5.6 5.8
0.0
0.5
1.0
1.5
Fitted valuesStandardized residuals
Scale-Location446
29 94
0.00 0.04 0.08 0.12
-3-2
-10
12
Leverage
Sta
ndar
dize
d re
sidu
als
Cook's distance
Residuals vs Leverage
65440
29
Figure 6.11: Diagnosis plot for analysis of
covariance (DV: anticipated quality)
none of the additionally included interaction terms had a significant effect on participants’ an-
ticipated temporal discharge. Thus, hypotheses H5a and H5b are accepted.
61

6 Business Impact of Technology-Derived Services
To test hypotheses H6, H7a, and H7b, a moderated mediation analysis was carried out (cf.
Muller, Judd, & Yzerbyt, 2005; Preacher, Rucker, & Hayes, 2007). Model 7 of the PROCESS
macro is most appropriate, as it allows for a multiple mediation with moderated effects from
the experimental stimuli on the mediators (Hayes, 2012). Thereby, three multiple regression
models were applied, that is two mediator models and the dependent variable model. The first
mediator model analyzed the effect of object type, type of offer, and the interaction effect of
object type x type of offer on anticipated process quality. As expected, only object type had a
significant effect on anticipated process quality (b = −.544, t = −2.029, p < .05). The second
mediator model analyzed the effect of object type, type of offer, and the interaction effect object
type x type of offer on anticipated temporal discharge. Results confirmed that the interaction
has a significant effect on anticipated temporal discharge, b = −1.202, t = −2.645, p < .01.
Also, object type (b = .989, t = 3.083, p < .01) and type of offer (b = 1.194, t = 3.695, p < .01)
have a significant effect on anticipated temporal discharge. Finally, the dependent variable
model regressed participants’ attitude towards the offer on anticipated temporal discharge, an-
ticipated process quality, customers’ age and customers’ innovativeness. As proposed, par-
ticipants’ attitude towards the offer is predicted by anticipated process quality (b = .743, t =
19.597, p < .01) and anticipated temporal discharge (b = .107, t = 3.371, p < .01). In con-
trast, product type (b = −.046, t = −.216, p = .594) and both covariates participants’ age
(b = .003, t = .758, p = .450) and participants’ innovativeness (b = .040, t = 1.679, p = .095)
have no significant effect on participants’ attitude towards the offer. Notably, the achieved
model fit is good , since R2 = .81. Further, the model employed a bootstrap with 10.000 draws
for the analysis of the conditional indirect effects. As hypothesized, the effect of product type
(classic vs. intelligent product capable of providing TDS) on participants’ attitude towards the
offer was moderated by anticipated process quality in both product context and service con-
text (95%CIProduct : −.778,−.018;95%CIService : −.951,−.125). The according value for the
index of moderated mediation further revealed that there is no significant difference between
the indirect effect in a product context compared to a service context (95%CI : −.688, .410).
Thus, hypothesis H6 is accepted. Anticipated temporal discharge mediated the effect of ob-
ject type (classic vs. intelligent product capable of providing TDS) on attitude only in the
product condition (95%CI : .030, .228). Contrary, in the service condition the effect of object
type on attitude towards the offer mediated by anticipated temporal discharge is not signifi-
cant (95%CI : −.113, .033). The results of the so-called index of moderated mediation post
procedure affirmed that the indirect effect of product type on participants’ attitude is signifi-
cantly different from each other (95%CI : −.300,−.026). Hence, hypotheses H7a and H7b are
accepted. Figure 6.12 summarizes the results of the process analysis.
62

6 Business Impact of Technology-Derived Services
Object'type'
(classic'vs.'intelligent)'
Applica5
on'con
text'
(produ
ct'vs.'se
rvice)'
An5cipated
'tempo
ral'
discharge'
An5cipated
'quality'
A>tude
'towards'th
e'off
er'
.990**
prod
uct'
.743*** '
G.212
'n.s. se
rvice''
G.544
* '
.107*** '
.046'n.s.' '
Figu
re6.
12:R
esul
tsof
the
mod
erat
edm
edia
tion
anal
ysis
Stud
y3
63

6 Business Impact of Technology-Derived Services
Further Results
Besides the results of the moderated mediation, the author further conducted a 2 x 2 AN-
COVA to analyze participants’ attitude towards the offer. None of the covariates had a signif-
icant effect on consumers’ attitude towards the offer, but users’ innovativeness (F(1,155) =
7.12, p < .01). Type of object had a significant main effect on attitude towards the offer,
MClassic = 5.41,MIntelligence = 4.99,F(1,155) = 6.35, p < .0128. However, the main effect of
offer was insignificant, MProduct = 5.29, MService = 5.10, F(1,155) = 1.22, p > .27. Further,
it revealed a significant interaction effect of type (classic vs intelligent) and offer (product vs
service), MClassProd = 5.36,MIntelProd = 5.22,MClassServ = 5.45,MIntelServ = 4.77,F(1,155) =
3.93, p < .05 on participants’ attitude, see figure 6.13.
Product Service
Type
Attitude
12
34
56
7
ClassicIntelligent
Figure 6.13: Interaction effect of type and offer
on consumers’ attitude towards the
offer
4.5 5.0 5.5 6.0
-3-2
-10
12
Fitted values
Residuals
Residuals vs Fitted
39073 278
-2 -1 0 1 2
-2-1
01
2
Theoretical QuantilesS
tand
ardi
zed
resi
dual
s
Normal Q-Q
39073278
4.5 5.0 5.5 6.0
0.0
0.5
1.0
1.5
Fitted values
Standardized residuals
Scale-Location39073 278
0.00 0.04 0.08 0.12
-3-2
-10
12
Leverage
Sta
ndar
dize
d re
sidu
als
Cook's distance
Residuals vs Leverage
390
65
217
Figure 6.14: Diagnosis plot for analysis of
covariance (DV: attitude towards the
offer)
The respective diagnostic plots indicate that normality is satisfied, but homogeneity of vari-
ance may not be fulfilled (see figure 6.14). Additional tests for homogeneity of variance af-
firmed the visual tendency that variances are not equal across groups. In specific, Levene’s
Test for homogeneity of variance shows that the variance between the object type conditions
is not equal, FOb jectType(1,161) = 5.8, p < .05, whereas conditions of type of offer have equal
variances, FTypeo f O f f er(1,161) = 3.76, p > .05. To account for this issue, the Brown-Forsythe
test statistic is applied (cf. Brown & Forsythe, 1974). Results did not confirm the significant
main effect of object type on anticipated quality (F1,159 = .34, p > .05). An additionally carried
out robustified F-Test revealed a marginal significant main effect of object type on anticipated
quality (F1,161 = 3.57, p < .1) as well as a marginal significant interaction effect of type of offer
64

6 Business Impact of Technology-Derived Services
and object type (F1,161 = 3.26, p < .1).
Finally, to gain first exploratory insights into customers’ willingness to pay in the light of
TDS, the author conducted a 2 (classic vs. intelligent product capable of providing TDS)
x 2 (product vs. service) ANCOVA. Results show a significant main effect of type of of-
fer, MProduct = 25.13%, MService = −5.19%,F(1,155) = 27.77, p < .001 (see figure 6.15).
In contrast, object type (MClassic = 13.61%, MIntelligent = 6.63%,F(1,155) = 1.43, p > .23)
and the interaction effect of type of offer and object type (MClassProd = 29.52%, MIntelProd =
20.52%,MClassServ = −3.97%,MIntelServ = −6.27%,F(1,155) = 0.23, p > .63) had insignifi-
cant effects on participants’ relative willingness to pay. Also, none of the covariates age, prior
experience, and innovativeness had a significant effect on relative willingness to pay.
Product Service
Type
Rel
ativ
e W
illin
gnes
s to
Pay
-10
010
2030
Figure 6.15: Main effect of type of offer on
relative willingness to pay
-10 0 10 20 30 40
-100
-50
050
100
Fitted values
Residuals
Residuals vs Fitted
16529
181
-2 -1 0 1 2-3
-2-1
01
23
Theoretical Quantiles
Sta
ndar
dize
d re
sidu
als
Normal Q-Q
16529
181
-10 0 10 20 30 40
0.0
0.5
1.0
1.5
Fitted values
Standardized residuals
Scale-Location16529181
0.00 0.04 0.08 0.12
-3-2
-10
12
3
Leverage
Sta
ndar
dize
d re
sidu
als
Cook's distance
Residuals vs Leverage
210
29165
Figure 6.16: Diagnosis plot for analysis of
covariance (DV: relative willingness
to pay)
Diagnostic plots indicate that not all model premises are satisfied. That is, figure 6.16 re-
veals that relative willingness to pay does not follow normality. To resolve this issue, the Box-
Andersen Test was applied on the factorial model only (cf. Box & Andersen, 1955). Results
confirmed that type of offer has a significant effect on participants’ relative willingness to pay,
F(1,160) = 27.46, p < 0.01.
Homogeneity of regression slopes (e.g. Alexander & DeShon, 1994) was approved, because
none of the additionally included interaction terms had a significant effect on participants’ rel-
ative willingness to pay.
65

6 Business Impact of Technology-Derived Services
6.2.4 Discussion
Theoretical Contribution
As the name implies, intelligent products capable of providing TDS “blur[s] the distinction
between goods and services” (p.257 Huang & Rust, 2013). Thus, these intelligent products can
either be sold as common products or can be offered as a new type of services.
Therefore, study 3 provides first insights into customers’ evaluation of intelligent products
capable of providing TDS compared to classic products and classic services. As hypothesized,
the positive effect of anticipated temporal discharge was seen as a gain in the product condition
only. In the service condition, participants evaluated anticipated temporal discharge for the
classic condition and the TDS condition equally.
The hypothesized negative effect of intelligent products delivering TDS on customers’ per-
ceived quality was confirmed for both the product condition and the service condition. Both
the mediated effect of type of object (classic vs. intelligent product capable of delivering TDS)
by anticipated quality on customers’ attitude towards the offer and the conditional indirect ef-
fect of type of object (classic vs. intelligent product capable of delivering TDS) by anticipated
temporal discharge on customers’ attitude towards the offer were confirmed.
Notably, the manipulation check of offer type (product vs. service) revealed that the intel-
ligent product capable of delivering TDS somehow underlines the notion of Huang and Rust
(2013). That is, although the manipulation of offer type (product vs. service) was confirmed,
participants in the product condition perceived the intelligent product significantly higher as a
service than did participants rating the classic product. The exact opposite is true for the service
condition, where participants perceived the intelligent product capable of delivering TDS more
as a product compared to participants rating their perception towards a classic service.
Managerial Implication
Results of the study have several implications for practitioners. It turned out that the focal ad-
vantage of intelligent products capable of providing TDS, namely time saving, is rewarded in
a product context only. Therefore, intelligent products capable of providing TDS may be more
successfully promoted in a product context than in a service context. Further, the study reveals
that customers’ evaluation of anticipated process quality of an intelligent product capable of
providing TDS is systematically rated lower than for their classic counterparts, irrespectively
whether the offer type is a service or a product. Hence, managers should derive solutions how to
exaggerate customers’ anticipated process quality of intelligent products capable of TDS. This
issue is even more serious from a service business perspective. The study reveals that in case of
66

6 Business Impact of Technology-Derived Services
a service context customers’ attitude towards the offer is primarily determined by their antici-
pated quality. Thus, when managers are thinking about replacing human service employees by
intelligent products capable of providing TDS, e.g. replacing some gardeners by autonomous
lawn mowers, in order to increase their productivity (R. Rust & Huang, 2012), customers’ low-
ered anticipated quality should be resolved first.
Limitations and Further Research Directions
The current study may suffer from several limitations. The presented stimuli, classic and au-
tonomous vacuum cleaners, are already available in the market for a while, hence these products
are common for participants. Therefore, it is at question whether the presented findings are also
applicable to intelligent products capable of providing TDS, which will be launched in the fu-
ture. Further, the study examines customers’ evaluation of TDS in an object-related context.
Given that TDS are also applied in a person-related context, like in the case of an self-driving
car, the author proposes to verify the findings presented in this study in this context.
Further research could also investigate how customers’ perception of services is affected,
when autonomous products are not used for private use but applied by an external party con-
tracted to deliver the task at hand. Given that intelligent products capable of delivering TDS
are taking over its owner’s effort to complete a task, one could ask how this affects customers’
perception of fairness when a third party provides a TDS. The question could be, how does the
fact that an intelligent product capable of delivering TDS lowers the service provider’s effort
affect customers’ perception of this service compared to a conventional provided service? For
instance, customers preference for an autonomous lawn mower may be lower when it does not
free up the customers’ own labor, but that of a gardener.
Additionally, intelligent products cover a wide range of tasks which can either be object-
related, e.g. vacuuming the floor, or person-related, such as the parking of a car. Especially
in the latter application context, the aspect of control becomes critical when considering con-
sumers’ acceptance of and preference for intelligent products. Given the users’ personal in-
volvement, person-related tasks may pose a high (perceived) personal (physical) risk and may
hence be considered rather critical. More precisely, consumers would probably expect a higher
quality when using conventional products by themselves and should not be willing to give up
their own control when tasks are critical to the self.
Furthermore, literature on SST proposes that customers always attribute service outcomes
internally, notwithstanding they were successful or not, because consumers can improve their
67

6 Business Impact of Technology-Derived Services
self-efficacy in the light of SST (Duval & Silvia, 2002). Since there is no customer input
required in the case of TDS, an investigation on how service failures are attributed and an
exploration of possible resolutions of this issue would be of great value for companies.
68

7 Overall Discussion
7Overall Discussion
First and foremost the thesis introduces a new type of services, TDS. TDS are provided by
intelligent products, which operate completely autonomously and therefore do not require any
human interaction for the service provision. Further, these new services can be applied in
an object-related context, e.g. for cleaning up an apartment or for trimming the lawn, and
in a person-related context, e.g. getting chauffeured by google’s self-driving cabs. However,
these two distinct application-contexts differ with regard to customers’ acceptance of this ser-
vice type. As an example, one could think of applying an automated lawn mower and getting
chauffeured with a self-driving car like the F015 from Mercedes-Benz. In the former setting,
customers are primarily concerned how much time they can save when applying such an au-
tonomous lawn mower. In contrast, when customers are being chauffeured by self-driving cars
in the near future, their primary concern might be their perceived service safety of that specific
TDS, because they are directly involved in the process in case of an accident. The arising the-
oretical and managerial implication as well as the limitations of this thesis are discussed in the
following. Finally, a research agenda is provided, suggesting promising future research direc-
tions in the light of TDS.
69

7 Overall Discussion
7.1 Theoretical Implications
Despite their existence on the market, academia has still not addressed TDS. Although prior
literature has already investigated the underlying intelligent products (e.g. S. Rijsdijk et al.,
2007), yet from a strict product view. Since intelligent, autonomous products operate without
any required interaction of humans, they have the capability of directly providing value to their
users, i.e. providing TDS. Hence, the author provides an initial definition and conceptualiza-
tion of TDS, as the following: TDS are intelligent products with an innate IT-based capability
to autonomously operate and are therefore providing value directly to the customer without any
necessary interaction during the value creation process of its user or its manufacturer. Further,
the author suggests a new service classification, whereupon services are distinguished by their
field of application, namely person-related and object-related, and the degree of technical infu-
sion (Froehle & Roth, 2004). Therefore, the thesis contributes to research by conceptualizing
this new type of services and providing a new service classification. In doing so, the author
contributes to the “vitality of the marketing discipline” (MacInnis, 2011, p.136).
Prior research investigated customers’ acceptance of products within the literature stream
of technology acceptance (e.g. F. Davis, 1989; Venkatesh et al., 2012). At the same time,
academics explored customers’ acceptance of various kinds of services, like SST (Meuter et
al., 2005), technology-infused services (e.g. Giebelhausen et al., 2014), or electronic services
(Barrutia & Gilsanz, 2012). However, none of these two literature streams, technology and
service acceptance, has realized the accelerated rise of intelligent products capable of deliver-
ing TDS. Given that TDS do not require any human interaction during the service process and
are applied in object-related or person-related contexts, the established constructs and models
for customer acceptance of technologies or services do not accurately capture the key drivers
of customers’ acceptance for TDS, namely anticipated temporal discharge, perceived service
safety, and perceived controllability. To address this issue, the thesis derives new measure-
ments for all three key drivers of customers’ acceptance of TDS. Thus, the author contributes
to research by providing first empirically tested measurements to assess customers’ anticipated
temporal discharge, perceived service safety, and perceived controllability of TDS.
Based on the new measurements, the author hypothesizes a new acceptance model for TDS,
which also takes the diverse application contexts of TDS (i.e. object-related or person-related)
into account. This very parsimonious model already explains about 60 percent of the variance
of customers’ attitude towards using a TDS in an object-related context and even about 70
70

7 Overall Discussion
percent of the variance of customers’ attitude towards using a TDS in an person-related con-
text. Accordingly, the author suggests that the derived new measurements represent the key
dimensions for the acceptance of TDS, namely time saving, controllability, and physical risk
perception. Although the model explains a majority of customers’ acceptance of TDS, there
is still room for improvement. In specific, implementing customers’ individual predispositions
as moderators in the model could reveal further insights into their acceptance of TDS. This
newly proposed model for the acceptance of TDS provides researchers with the first appropri-
ate framework to understand customers’ acceptance of TDS as well as with a promising starting
point for further investigations in the light of TDS. Compared to the prominent, existing frame-
works regarding the assessment of customers’ acceptance of technology, i.e. the TAM and the
UTAUT, the proposed acceptance model for TDS is not meant to be applied in an IT-context.
On the contrary: it is the first framework to investigate customers’ acceptance of intelligent
products capable of providing TDS that exert physical acts on either objects (object-related) or
persons (person-related).
Additionally, this thesis also reveals that the mechanism of customers’ acceptance of TDS
differs depending on the application context. When TDS are applied in a person-related con-
text, for example a self-driving car, customers’ acceptance is positively influenced by their
anticipated temporal discharge. Furthermore, the positive effect of perceived controllability on
customers’ acceptance is mediated by their perceived service safety. This indirect effect further
highlights the importance of the new dimension perceived service safety, which is not included
in existing frameworks, to explain technology acceptance of customers. In contrast, when TDS
are applied in an object-related context, anticipated temporal discharge and perceived controlla-
bility have a positive, direct effect on customers’ acceptance of TDS, whereas perceived service
safety does not affect customers’ acceptance of TDS. As a consequence, the model proofs to be
suitable to assess customers’ acceptance of TDS, notwithstanding their application context, i.e.
person-related or object-related.
Moreover, the author sheds first light on customers’ evaluation of TDS compared to conven-
tional products and conventional services in an object-related context. When TDS are compared
to the latter ones, the findings show that customers anticipate the same temporal discharge, i.e.
time saving, as for conventional services. However, customers anticipate a lower quality for
TDS compared to conventional services. This is also true when TDS are compared to classic
products. Nevertheless, customers anticipate higher temporal discharge for TDS than for classic
products.
71
7 Overall Discussion
Furthermore, drawing on the paradigm of SDL and prior research on service quality, the au-
thor provides a theoretical framework, which allows for comparing TDS in the product domain
as well as in the service domain. In specific, the framework states that the evaluation of a prod-
uct or a service with respect to its value in use is determined by customers’ anticipated temporal
discharge, i.e. time saving, and anticipated quality, i.e. process quality. Corresponding findings
indicate that both determinants have a positive effect on customers’ attitude towards the prod-
uct or service at question. Considering the fact that TDS are associated with lower anticipated
process quality and that customers’ anticipated temporal discharge is beneficial in a product
comparison only, customers’ attitude towards TDS is lower in a service comparison and about
equal in a product comparison.
To sum up, the thesis contributes to research by expanding the existing literature on cus-
tomers’ acceptance of technology and services by the acceptance model for TDS and its as-
sociated measurements. Further, it draws attention on the difference between person-related
and object-related applications of TDS. Finally, it provides a theoretical framework to assess
customers’ evaluation of TDS in comparison to conventional products and services. Thus, the
findings open up new and promising alleys for future research, which are further discussed in
chapter 7.4.
72

7 Overall Discussion
7.2 Managerial Implications
Google’s self-driving cab, Mercedes’s self-driving prototype F015, introduced at the interna-
tional consumer electronics show in Las Vegas 2015, or Audi’s RS7 piloted driving concept
provide evidence that companies worldwide are working on intelligent products capable of pro-
viding TDS. The increasing number of TDS, also in the form of automated lawn mowers or
automated vacuum cleaners, underlines the importance of this new type of services. Therefore,
this thesis provides first guidelines for managers how to increase customers’ acceptance of TDS
and which steps have to be taken in order to surpass customers’ evaluation of classic products
and services.
Since anticipated temporal discharge, i.e. time saving, is the focal advantage of TDS irre-
spectively their application context (person-related or object-related), managers are well advised
to clearly promote this point. This could be achieved in several ways. One option could be to
point at the absolute time “saved”, when making use of a TDS. Another strategy could be to
draw comparisons like trimming the lawn or reading a book while getting the lawn trimmed
by TDS. Addressing customers’ opportunity costs, when performing the task for themselves,
could also benefit customers’ attention regarding anticipated temporal discharge.
Managers should also thoroughly consider how they can increase customers’ perceived con-
trollability of a TDS. Especially in a person-related application, this is a key issue, since per-
ceived controllability positively influences customers’ perceived service safety. To create the
impression of controllability, managers have several options at hand. Product design is one of
them. Thereby, managers could decide to provide TDS with characteristic control features as
known from conventional products or service. To give an example, one could think of a steering
wheel and pedals in a self-driving car. Another approach could be to inform customers across
multiple communication channels, how the service process works in detail when employing a
TDS. Thereby, companies offer process transparency to their customers.
Perceived service safety is particularly important for person-related usage of TDS. As al-
ready outlined, increased perceived controllability leads to exaggerated perceptions of service
safety. Therefore, managers should strongly draw their attention to strategies aiming at increas-
ing customers’ perception of the controllability of their TDS. Aside from that, managers should
also promote free product trials to their customers, accompanied by qualified employees ex-
plaining the function of their TDS. Managers could also think of initializing an international
73

7 Overall Discussion
standard, which independently monitors and evaluates the capabilities of their TDS. To give an
example of such a standard, one could think of the European New Car Assignment Programme
(ENCAP) applied in the automotive industry.
As the acceptance model for TDS shows, the above mentioned key drivers play together in
a holistic mechanism. Therefore, managers should strive for an optimal adaption of measures
to enhance all three key drivers in the light of person-related TDS applications and optimally
coordinate actions to increase customers’ perceived controllability and anticipated temporal dis-
charge in the case of object-related applications of TDS.
Given the acceptance model for TDS and its measurements for the key drivers of customers’
acceptance of TDS, managers now have a first tool at hand that they can use in their R&D
departments to identify promising product designs with regard to increased customer accep-
tance of their TDS. Thereby, the main criteria managers should focus on are perceived process
quality, perceived controllability, and perceived service safety. The former one is especially
important in case of object-related applications of TDS, as today’s customers still doubt the
process quality of intelligent products capable of providing TDS.
Besides the internal approach to identify reasonable solutions to enhance customers’ ac-
ceptance of TDS, managers should also be aware of a new promising external approach. As
intelligent products capable of providing TDS generate massive data, this “database” of actual
usage could also reveal further insights. This idea somehow follows the reasoning of the so-
called Internet of Things. At this point it is worth noting that although the customer is taken out
of the service process, companies might get more information about their usage and possible
issues regarding TDS in the field than ever before. To give an example, one could think of
TESLA’s electric car Model S, which is regularly provided with software-updates by TESLA
and transfers usage data back to the company. Despite the fact that there is no customer in-
teraction necessary, the company has the opportunity to implement little design changes of an
assistant system and gets almost immediate feedback of its customers in the form of real usage
data to evaluate the effectiveness of their update. Hence, managers are well advised to consider
both internal and external approaches to enhance customers’ acceptance of TDS in the future.
From a more general perspective, managers should also question, how the new phenomenon
of TDS could possibly affect current business models. To give an example, one could think of
self-driving taxis. Once customers’ acceptance of using this type of TDS is well established, it
74

7 Overall Discussion
is at question, how this affects the car-sharing market or the conventional taxi market. Further-
more, service companies working in a field with lower task complexity, for instance trimming
the lawn or vacuuming the gym, could possibly think of employing intelligent products capable
of providing TDS in addition to their human workforce. However, replacing human workforce
by TDS nowadays might be a wrong decision, as customers anticipate a lower process quality
for TDS than for conventional services.
Finally, managers from manufacturing companies should also consider their current product
range, when their intelligent products capable of providing TDS are applied in a person-related
context. As customers’ time is freed up during the service process, managers may want to pro-
vide their customers with further services or product features during that phase. As an example,
one could think of a person being chauffeured from home to work in her or his self-driving
car. For that case, managers should identify, which features or services might be of great value
for their customers. Therefore, the author points out some avenues for future research within
chapter 7.4.
75

7 Overall Discussion
7.3 Limitations
Throughout the thesis, the author conducted several studies to empirically verify the proposed
measurements and the derived hypotheses according to the acceptance model of TDS and the
theoretical framework for the comparison of TDS with conventional products and services. Spe-
cific limitations for each of these studies were already given in chapters 5.2.1.3 (study 1), 5.2.2.3
(study 2), and 6.2.4 (study 3). Nevertheless, the author provides further general limitations in
the following.
As all three studies were conducted in an online setting, the findings may fall short with
respect to eternal validity. Therefore, future research could carry out a field study, like it could
possibly be done in the previous describe case of TESLA (see chapter 7.2), in order to give
evidence for the external validity of the presented findings.
The focal objective of intelligent products capable of providing TDS is to replace customers’
required interaction to fulfill a specific task. Nevertheless, situations may arise in which cus-
tomers’ goals are more satisfied by conventional products or conventional services.The question
is, are consumers striving to experience aesthetic or sensory pleasure, joy, and fun (Hirschman
& Holbrook, 1982) or it they are they focusing on auxiliary benefits to accomplish functional
and practical tasks (Strahilevitz & Myers, 1998). These two distinct types of goals, namely he-
donic and utilitarian (Wertenbroch & Dhar, 2000), will also affect customers’ attitudes towards
autonomous products.
As outlined in the introduction, this new type of services is supposed to have an impact on
less skill-demanding service sectors. Therefore, drawing on the service pyramid of Parasur-
aman (e.g. 2000) even more services shift from a employee-customer relationship towards a
technology-customer relationship. Hence, the author suggests that TDS will also have major
impacts in the context of B2B. Especially the close connection with the customer might be
heavily reduced due to the lack of personal stuff. In addition, R. T. Rust and Huang (2014)
mention that the classic understanding of customer-company exchange will change, such that
it becomes more dynamic. Thereby, TDS could make a remarkable contribution, as they could
provide data on customers’ real usage-patterns. However, this could not be investigated in the
present thesis.
76

7 Overall Discussion
7.4 Future Research Agenda
This thesis provides first academic work on the phenomenon of intelligent products capable of
providing TDS in the light of customers’ acceptance and evaluation in comparison to conven-
tional products and services. Nevertheless, there is still plenty of room for further research.
Especially in the light of TDS, it seems reasonable not to consider only product specifications
but also to consider consumers’ personal characteristics as means of predictors for innovation
adoption in future research (e.g. Billeter, Kalra, & Loewenstein, 2011).
Initial Propositions
Current findings provide evidence that consumers’ self construal effects their adoption behavior
for really new products (Ma, Yang, & Mourali, 2014). In specific, really new products are
more likely to be adopted by consumers high in self construal, whereas consumers low in self
construal prefer incremental new products. Nevertheless, these effects are dependent on product
specific cues like degree of popularity or scarcity, causing the main effect to be altered or even
to be reversed (Ma et al., 2014). Furthermore, literature further investigated the effects of
consumers’ personal status on their adoption behavior of innovations (Y. Hu & Van den Bulte,
2014). Thereby, it turned out that middle status consumers are most likely to adopt innovations
earlier than both low and high status consumers but in each case without being prone to social
cues (Y. Hu & Van den Bulte, 2014). Nevertheless, this only holds true for products which are
perceived being capable to enhance consumers’ current social status. Given that TDS can be
seen as really new products, the author suggests that both social status and self-construal jointly
affect customers’ acceptance of TDS.
Proposition P1: Customers of middle (low or high) social status, adopt TDS earlier
(later) when they are high (low) in self-construal.
When thinking of van Osselaer and Janiszewski’s (2012) consumer choice model, one could
ask if there are goal-related situations in which consumers benefit from TDS more or less. In
specific, Alderson’s (1957) idea of consummatory and instrumental motivated consumption be-
havior states that customers’ instrumentally driven purchase decisions are primarily concerned
with the auxiliary benefits of a product for a given task. This aligns with Choi and Fishbach’s
(2011) idea of instrumental or experiential consumer choices. Since the major distinction of
TDS to any other services is the autonomous completion of tasks, instrumentally motivated
customers are proposed to have a greater tendency towards the acceptance of TDS than experi-
ential motivated customers. Therefore, the author proposes:
77

7 Overall Discussion
Proposition P2: The more instrumentally (experientially) motivated customers are,
the more (less) favorable consumers evaluate TDS.
Moreover, literature states that perceived capability is the main predictor for customers’
product evaluation before the initial usage, whereas most attention is paid to perceived usabil-
ity after customers’ first application of the product (Thompson et al., 2005). According to
Hamilton and Thompson (2007), the change in evaluation priorities is due to different mental
construals evoked by direct or indirect experience with the product. That is, the more concrete a
customer’s idea of a product and therefore the lower the construal level, the more the customer
is concerned with the product’s ease of use (Hamilton & Thompson, 2007). To conclude, the
capabilities of TDS are limited these days, as most of them are dedicated products like a lawn
mower. At the same time, customers’ convenience in terms of time saving is largely increased,
Therefore, the author proposes the following:
Proposition P3: Consumers will have a more (less) favorable perception of TDS,
when these are represented in more (less) detail, as customers’ attention is drawn
from capability to usability (usability to capability).
Besides the empirical evidence of risk perception and its dimensions, literature also provides
a broad body of research on how to handle risk perception in the context of technology accep-
tance. To begin, it is notable to point out Cohen’s (2002) concern “that consumers may not
adequately comprehend the benefits and risks of using such highly technical products” (Cohen,
2002, p.172). At first sight, it seems obvious how to deal with benefits and risks, i.e. gains
and losses, when thinking about Tversky and Kahnemann’s (1981) so-called “Asian disease
problem”. They show, that customers become more risk seeking when choices are framed as
losses, while customers exhibit a clear tendency towards risk aversion when choices are framed
as gains. Although this experiment deals with customers’ lives, participants where not really
anxious as it was just a study. However, when customers perceive a certain risk that their health
could actually be threatened by consuming TDS and therefore give rise to customers’ anxiety
of using this technology, research has shown that a combination of perceived risk and fear leads
to exaggerated pessimistic risk estimates (Lerner & Keltner, 2001).
First results from previous research on how to deal with consumers’ risk perception in a
communications context state that framing losses in that context leads to a general increase in
risk aversion, whereas concentrating on gains leads to risk aversion against threats which are
constantly present (Cox, Cox, & Zimet, 2006).
78

7 Overall Discussion
Therefore it seems reasonable to conclude:
Proposition P4: Information on potential risk arising from TDS negatively corre-
lates with consumers’ perceived service safety.
Further, Fischer, Volckner, and Sattler (2010) point out that a brand’s central function is
consumers’ risk reduction prior to a purchase decision. Specifically, consumers try to compen-
sate lacking post-usage information by relying on long-term reputation of the brand at question
(Fischer et al., 2010). Since TDS are not common yet, the author hypothesizes that the brand
of a company, which offers TDS, effects consumers’ perceived service safety. That is:
Proposition P5: TDS provided by companies with a strong brand will be evaluated
higher in terms of perceived service safety than TDS provided by companies with a
weaker brand.
In addition, Gurhan-Canli and Batra (2004) emphasized that it is firms’ innovativeness and
trustworthiness that has a positive effect on high-risk consumer decisions. Therefore, the author
further proposes:
Proposition P5a: TDS provided by companies with high reputation regarding inno-
vation and high trustworthiness are evaluated higher than provided by companies
that are low in both dimensions.
Since new products often involve not only a single company producing all the required com-
ponents but a whole supplier network, as it is for instance the case in the automotive industry,
it is questionable whether to make use of the so-called ingredient branding strategy (Kaushik
& Keller, 2002). Thereby, the rational behind is to decide if a newly introduced product fea-
ture should be co- or self-branded. Giving an example, one could think of General Motors and
AUDI as two well known car manufacturers. However, these two companies significantly dif-
fer in terms of liability, especially due to recent product-recalls of General Motors. Therefore,
in the light of TDS it is at question which of the two previously mentioned strategies is more
reasonable, i.e. co- or self-branding of an automated highway-pilot. Drawing on Gurhan-Canli
and Batra’s (2004) notion that a company’s trustworthiness positively contributes to consumers’
decisions in a high-risk context, the author proposes:
Proposition P6: In the case of high (low) brand image, self-branding (co-branding)
of product features enabling the base product to provide TDS is positively corre-
lated with customers’ acceptance of this TDS.
79

7 Overall Discussion
Future Research Direction
Besides this communicative approach to decrease technological risk perception, Fagan, Neill,
and Wooldridge (2003) found that experience with new technologies, e.g. computers, consid-
erably alleviates usage anxiety. On a more individual level, it also turned out that consumers’
willingness to try out latest technological applications is a significant determinant of reduced
technological anxiety (Thatcher & Perrewe, 2002).
In line with the above mentioned questions arising with respect to customers’ perceived ser-
vice safety, academia could further investigate, whether customers have different perceptions of
service safety in the case that they use their own car capable of autonomously driving compared
to the case that they use a self-driving taxi.
Furthermore, future research could also address the question, how task complexity, e.g. trim-
ming the lawn or navigating a car, and environmental complexity, for instance one’s garden or
downtown Manhattan, influence customers’ perceived service safety and perceived controlla-
bility.
80

8 Conclusion
8Conclusion
With the advent of intelligent products like autonomous lawn mowers or self-driving cars, a
new kind of services has emerged in the marketplace, TDS. TDS are intelligent products with
an innate IT-based capability to autonomously operate and are therefore providing value di-
rectly to the customer without any necessary interaction during the value creation process of
its user or its manufacturer. Despite the broad stream of literature on technology acceptance
and service acceptance, research has not addressed the phenomenon of TDS yet. Therefore,
the author provides new measurements to capture the key dimensions influencing customers’
acceptance of TDS, namely anticipated temporal discharge, perceived controllability, and per-
ceived service safety. Results of study 1 confirmed the validity and reliability of the proposed
measurements. Based on these measurements, the author hypothesized a new acceptance model
for TDS. Results of Study 2 verified the proposed acceptance model. In specific, when TDS
are applied in an object-related context, like it is the case for an autonomous lawn mower, an-
ticipated temporal discharge and perceived controllability have a positive effect on customers’
attitude towards using the TDS. When TDS are applied in a person-related context, anticipated
temporal discharge has a positive effect on customers’ attitude towards using the TDS, whereas
the positive effect of perceived controllability on customers’ attitude towards using the TDS
is mediated by perceived service safety. Building on a newly proposed theoretical framework,
which allows for comparing TDS with conventional products and services, study 3 shows that
customers’ attitude towards TDS is determined by customers’ anticipated temporal discharge
and anticipated quality. In the case of a product comparison, TDS are associated with higher
anticipated temporal discharge and lower anticipated quality than a conventional product. In the
case of a service comparison, customers anticipate the same temporal discharge for TDS as for
conventional services, while their anticipated quality is lower than for conventional services.
Drawing on these results, implications for practitioners as well as for academics are derived.
Although this thesis gives first insights into customers’ acceptance of TDS and their evaluation
compared to conventional products and services, avenues for future research are pointed out.
81

References
References
Alderson, W. (1957). Marketing behavior and executive action. Homewood, IL: Irwin.
Alexander, R. A., & DeShon, R. P. (1994). Effect of error variance heterogeneity on the power
of tests for regression slope differences. Psychological Bulletin, 115(2), 308.
Anderson, E., Fornell, C., & Rust, R. (1997). Customer satisfaction, productivity, and prof-
itability: Differences between goods and services. Marketing Science, 16(2), 129-145.
Arnold, M., & Reynolds, K. (2003). Hedonic shopping motivations. Journal of Retailing,
79(2), 77-95.
Bagozzi, R., & Yi, Y. (1988). On the evaluation of structural equation models. Journal of the
Academy of Marketing Science, 16(1), 74-94.
Bagozzi, R., & Yi, Y. (2012). Specification, evaluation, and interpretation of structural equation
models. Journal of the Academy of Marketing Science, 40(1), 8-34.
Bansal, H. S., Taylor, S. F., & James, Y. S. (2005). “Migrating” to new service providers: To-
ward a unifying framework of consumers’ switching behaviors. Journal of the Academy
of Marketing Science, 33(1), 96–115.
Barrutia, J., & Gilsanz, A. (2012). Electronic service quality and value: Do consumer
knowledge-related resources matter? Journal of Service Research, 16(2), 231-246.
Batra, R., Ahuvia, A., & Bagozzi, R. P. (2012). Brand love. Journal of Marketing, 76(2), 1–16.
Bearden, W. O., Sharma, S., & Teel, J. E. (1982). Sample size effects on chi square and other
statistics used in evaluating causal models. Journal of Marketing Research, 425–430.
Berinsky, A., Huber, G., & Lenz, G. (2012). Evaluating online labor markets for experimental
research: Amazon.com’s mechanical turk. Political Analysis, 20(3), 351-368.
Berry, L., Seiders, K., & Grewal, D. (2002). Understanding service convenience. Journal of
Marketing, 66(7), 1-17.
Bertini, M., Ofek, E., & Ariely, D. (2009). The impact of add-on features on consumer product
evaluations. Journal of Consumer Research, 36(1), 17-28.
Billeter, D., Kalra, A., & Loewenstein, G. (2011). Underpredicting learning after initial expe-
rience with a product. Journal of Consumer Research, 37(5), 723-736.
Bloch, P. (2011). Product design and marketing: Reflections after fifteen years. Journal of
82

References
Product Innovation Management, 28(3), 378-380.
Bolton, R. N., & Drew, J. (1991). A multistage model of customers’ assessments of service
quality and value. Journal of Consumer Research, 17(4), 375-384.
Bolton, R. N., & Saxena-Iyver, S. (2009). Interactive services: A framework, synthesis and
research directions. Journal of Interactive Marketing, 23(1), 91-104.
Bornemann, T., & Homburg, C. (2011). Psychological distance and the dual role of price.
Journal of Consumer Research, 38(3), 490-504.
Box, G. E., & Andersen, S. L. (1955). Permutation theory in the derivation of robust criteria
and the study of departures from assumption. Journal of the Royal Statistical Society.
Series B (Methodological), 1–34.
Bradley, G., & Sparks, B. (2002). Service locus of control: Its conceptualization and measure-
ment. Journal of Service Research, 4(4), 312-324.
Brady, M., & Cronin Jr., J. (2001). Some new thoughts on conceptualizing perceived service
quality: A hierarchial approach. Journal of Marketing, 65(3), 34-49.
Brady, M., Knight, G., Cronin Jr., J., Tomas, G., Hult, M., & Keillor, B. (2005). Removing the
contextual lens: A multinational, multi-setting comparison of service evaluation models.
Journal of Retailing, 81(3), 215-230.
Brooker, G. (1984). An assessment of an expanded measure of perceived risk. Advances in
Consumer Research, 11(1), 439-441.
Brown, M. B., & Forsythe, A. B. (1974). Robust tests for the equality of variances. Journal of
the American Statistical Association, 69(346), 364–367.
Bruner II, G., & Kumar, A. (2007). Gadget lovers. Journal of the Academy of Marketing
Science, 35(3), 329-339.
Buera, F., & Kaboski, J. (2012). The rise of the service economy. American Economic Review,
102(6), 2540-2569.
Buhrmester, M., Kwang, T., & Gosling, D. (2011). Amazon’s mechanical turk: A new source
of inexpensive, yet high-quality, data? Perspectives on Psychological Science, 6(1), 3-5.
Burger, J. (1984). Desire for control, locus of control, and proneness to depression. Journal of
Personality, 52(1), 71-89.
Buttgen, M., Schumann, J., & Ates, Z. (2012). Service locus of control and customer copro-
duction: The role of prior service experience and organizational socialization. Journal of
Service Research, 15(2), 166-181.
Campbell, D., & Fiske, D. (1959). Convergent and discriminant validation by the multitrait-
multimethod matrix. Psychological Bulletin, 56(2), 81-105.
Campbell, M. C. (2007). “Says who?!” how the source of price information and affect influence
83

References
perceived price (un) fairness. Journal of Marketing Research, 44(2), 261–271.
Chang, S.-J., Van Witteloostuijn, A., & Eden, L. (2010). From the editors: Common method
variance in international business research. Journal of International Business Studies,
41(2), 178–184.
Chen, F. F. (2007). Sensitivity of goodness of fit indexes to lack of measurement invariance.
Structural Equation Modeling, 14(3), 464–504.
Cheung, G., & Rensvold, R. (1999). Testing factorial invariance across groups: A reconceptu-
alization and proposed new method. Journal of Management, 25(1), 1-27.
Choi, J., & Fishbach, A. (2011). Choice as an end versus a means. Journal of Marketing
Research, 48(3), 544-554.
Cohen, J. (2002). Introductory comments: Direct-to-consumer prescription drug advertising:
Evaluating regulatory policy in the united states and new zealand. Journal of Public
Policy & Marketing, 21(2), 172-173.
Collier, J., & Kimes, S. (2012). Only if it is convenient: Understanding how convenience
influences self-service technology evaluation. Journal of Service Research, 16(1), 39-
51.
Collier, J., & Sherrell, D. (2010). Examining the influence of control and convenience in a
self-service setting. Journal of the Academy of Marketing Science, 38(4), 490-509.
Correa, H., Ellram, L., Scavarda, A., & Cooper, M. (2007). An operations management view of
the serivces and goods offering mix. International Journal of Operations & Production
Management, 27(5), 444-463.
Cotte, J., Ratneshwar, S., & Mick, D. (2004). The time of their lives: Phenomenological
and metaphorical characteristics of consumer timestyles. Journal of Consumer Research,
31(2), 333-345.
Cox, A., Cox, D., & Zimet, G. (2006). Understanding consumer responses to product risk
information. Journal of Marketing, 70(1), 79-91.
Cronin Jr., J., Brady, M., & Hult, G. (2000). Assessing the effects of quality, value, and
customer satisfaction on consumer behavioral intentions in service environments. Journal
of Retailing, 76(2), 193-218.
Cronin Jr, J. J., & Taylor, S. A. (1992). Measuring service quality: a reexamination and
extension. The journal of marketing, 55–68.
Curran, J. M., Meuter, M. L., & Surprenant, C. F. (2003). Intentions to use self-service tech-
nologies: A confluence of multiple attitudes. Journal of Service Research, 5(3), 209–224.
Cusumano, M., Kahl, S., & Suarez, F. (2015). Services, industry evolution, and the competitive
strategies of product firms. Strategic Management Journal, 36(4), 559-575.
84

References
Dabholkar, P. A. (1996). Consumer evaluations of new technology-based self-service options:
an investigation of alternative models of service quality. International Journal of research
in Marketing, 13(1), 29–51.
Dabholkar, P. A., & Bagozzi, R. P. (2002). An attitudinal model of technology-based self-
service: moderating effects of consumer traits and situational factors. Journal of the
Academy of Marketing Science, 30(3), 184–201.
Dahl, D., Chattopadhyay, A., & Gorn, G. (1999). The use of visual mental imagery in new
product design. Journal of Marketing Research, 36(1), 18-28.
Davis, D., & Herr, P. M. (2014). From bye to buy: Homophones as a phonological route to
priming. Journal of Consumer Research, 40(6), 1063-1077.
Davis, F. (1989). Perceived usefulness, perceived ease of use, and user acceptance of informa-
tion technology. MIS Quarterly, 13(3), 319-340.
Davis, F., Bagozzi, R., & Warshaw, P. (1989). User acceptance of computer technology: A
comparision of two theoretical models. Management Science, 35(8), 982-1003.
De Luca, L., & Atuahene-Gima, K. (2007). Market knowledge dimensions and cross-functional
collaboration: Examining the different routs to product innovation performance. Journal
of Marketing, 71(1), 95-112.
De Ruyter, K., Wetzels, M., & Kleijnen, M. (2001). Customer adoption of e-service: an
experimental study. International Journal of Service Industry Management, 12(2), 184–
207.
Deshpande, R., Farley, J., & Webster Jr., F. (1993). Corporate culture, customer orientation, and
innovativeness in japanese firms: A quadrad analysis. Journal of Marketing, 57, 23-27.
Devaraj, S., Easley, R., & Crant, J. (2008). How does personality matter? relating the five-factor
model to technology acceptance and use. Information Systems Research, 19(1), 93-105.
Dotzel, T., Shankar, V., & Berry, L. (2013). Service innovativeness and firm value. Journal of
Marketing Research, 50(2), 259-276.
Duval, T., & Silvia, P. (2002). Self-awareness, probability of improvements, and the self-serving
bias. Journal of Personality and Social Psychology, 82(1), 49-61.
Erden, T., Keane, M., Oncu, T., & Strebel, J. (2005). Learning about computers: An analysis of
information search and technology choice. Quantitative Marketing and Economics, 3(3),
207-246.
Fagan, M., Neill, S., & Wooldridge, B. (2003). An empirical investigation into the relation-
ship between computer self-efficacy, anxiety, experience, support and usage. Journal of
Computer Information Systems, 44(2), 95-104.
Fang, E., Palmatier, R., & Steenkamp, J.-B. E. (2008). Effect of service transition strategies on
85

References
firm value. Journal of Marketing, 72(5), 1-14.
Faulkner, J., P. anf Runde. (2009). On the identity of technological objects and user innovations
in function. Academy of Management Review, 34(3), 442-462.
Feldman, L., & Hornik, J. (1981). The use of time: An integrated conceptual model. Journal
of Consumer Research, 7(4), 407-419.
Field, A., Miles, J., & Field, Z. (2012). Discovering statistics using r. London: Sage Publica-
tions.
Fischer, M., Volckner, F., & Sattler, H. (2010). How important are brands? a cross-category,
cross-country study. Journal of Marketing Research, 47(5), 823-839.
Fishbein, M., & Ajzen, I. (1975). Belief, attitude, intention and behavior: An introduction to
theory and research. MA: Addison-Wesley.
Fornell, C., & Larcker, D. (1981). Evaluating structural equation models with unobservable
variables and measurement error. Journal of Marketing Research, 18(1), 39-50.
Froehle, C. M., & Roth, A. V. (2004). New measurement scales for evaluating perceptions of the
technology-mediated customer service experience. Journal of Operations Management,
22(1), 1–21.
Fuchs, C., Schreier, M., & van Osselaer, S. (2015). The handmade effect: What’s love got to
do with it? Journal of Marketing, 79(2), in press.
Gadrey, J. (2000). The characterization of goods and services: An alternative approach. Review
of Income and Wealth, 46(3), 369-387.
Garcia, R., & Calantone, R. (2002). A critical look at technological innovation typology and
innovativeness terminology: a literature review. Journal of Product Innovation Manage-
ment, 19(2), 110-132.
Gautschi, D., & Ravichandran, T. (2006). Industrialization of services: an agenda for a scientific
management approach to services. In Conference on service sciences, management, and
engineering. Palisades, NY.
Giebelhausen, M., Robinson, S., Siriani, N., & Brady, M. (2014). Touch versus tech: When
technology functions as a barrier or a benefit to service encounters. Journal of Marketing,
78(4), 113-124.
Gill, T. (2008). Convergent products: What functionalities add more value to the base? Journal
of Marketing, 72(2), 46-62.
Gist, M., & Mitchell, T. (1992). Self-efficacy: A theoretical analysis of its determinants and
malleability. Academy of Management Review, 17(2), 183-211.
Golder, N., Mitra, D., & Moorman, C. (2012). What is quality? an integrative framework of
process and states. Journal of Marketing, 76(4), 1-23.
86

References
Goldsmith, R., & Hofacker, C. (1991). Measuring consumer innovativeness. Journal of the
Academy of Marketing Science, 19(3), 209-221.
Goodman, J., & Irmark, C. (2013). Having versus consuming: Failure to estimate usage
frequency makes consumers prefer multifeature products. Journal of Marketing Research,
50(1), 44-54.
Greenfield, H. (2002). A note on the goods/services dichotomy. The Service Industries Journal,
22(4), 19-21.
Gronroos, C. (1998). Marketing services: the case of a missing product. Journal of Business &
Industrial Marketing, 13(4/5), 322-338.
Guiltinan, J. (1987). The price bundeling of services: A normative framework. Journal of
Marketing, 51, 74-85.
Gurhan-Canli, Z., & Batra, R. (2004). When corporate image affects product evaluations: The
moderating role of perceived risk. Journal of Marketing Research, 41(2), 197-205.
Hamilton, R., & Thompson, D. (2007). Is there a substitute for direct experience? comparing
consumers’ preferences after direct and indirect product experience. Journal of Consumer
Research, 34(4), 546-555.
Han, J., Chung, S., & Sohn, Y. (2009). Technologically convergence: When do consumers
prefer convergent products to dedicated products? Journal of Marketing, 73(9), 97-108.
Hanson, W., & Martin, R. (1990). Optimal bundle pricing. Management Science, 36(2), 155-
174.
Harris, K., Schwedel, A., & Kim, A. (2011). The great eight. trillion-dollar growth trends to
2020. New York and Dallas: Bain & Company.
Hauser, J., Tellis, G., & Griffin, A. (2006). Research on innovation: A review and agenda for
marketing science. Marketing Science, 25(6), 687-717.
Hayes, A. F. (2012). Process: A versatile computational tool for observed variable mediation,
moderation, and conditional process modeling.
Henard, D., & Szymanski, D. (2001). Why some new products are more successful than others.
Journal of Marketing Research, 38(3), 362-375.
Higgins, E. T. (1997). Beyond pleasure and pain. American psychologist, 52(12), 1280.
Hirschman, E. C., & Holbrook, M. B. (1982). Hedonic consumption: emerging concepts,
methods and propositions. The Journal of Marketing, 92–101.
Holm, S. (1979). A simple sequentially rejective multiple test procedure. Scandinavian journal
of statistics, 65–70.
Homburg, C., & Krohmer, H. (2006). Marketingmanagement. Wiesbaden: Gabler.
Hourahine, B., & Howard, M. (2004). Money on the move: Opportunities for financial service
87

References
providers in the ‘third space’. Journal of Financial Services Marketing, 9(1), 57-67.
Hu, L., & Bentler, M. (1999). Cutoff criteria for fit indexes in covariance structure analysis:
Conventional criteria versus new alternatives. Structural Equation Modeling: A Multidis-
ciplinary Journal, 6(1), 1-55.
Hu, Y., & Van den Bulte, C. (2014). Nonmonotonic status effects in new product adoption.
Marketing Science, 33(4), 509-533.
Huang, M.-H., & Rust, R. (2013). It-related service: A multidisciplinary perspective. Journal
of Service Research, 16(3), 251-258.
Hui, M., Thakor, M., & Gill, R. (1998). The effect of delay type and service stage on consumers’
reactions to waiting. Journal of Consumer Research, 24(4), 469-480.
Iacobucci, D. (2010). Structural equations modeling: Fit indices, sample size and advanced
topics. Journal of Consumer Psychology, 20(1), 90-98.
Iacobucci, D., Saldanha, N., & Deng, X. (2007). A meditation on mediation: Evidence that
structural equations models perform better than regressions. Journal of Consumer Psy-
chology, 17(2), 140-154.
Im, I., Kim, Y., & Han, H.-J. (2008). The effects of perceived risk and technology type on
users’ acceptance of technologies. Information & Management, 45(1), 1–9.
Jacoby, J., & Kaplan, L. (1972). The components of perceived risk. Advances in Consumer
Research, 3(3), 382-383.
Joireman, J., Shaffer, M., Balliet, D., & Strathman, A. (2012). Promotion orientation explains
why future-oriented people exercise and eat healthy: Evidence from the two-factor con-
sideration of future consequences-14 scale. Personality and Social Psychology Bulletin,
38(10), 1272-1287.
Kaplan, L., Szybillo, G., & Jacoby, J. (1974). Components of perceived risk in product pur-
chase: A cross-validation. Journal of Applied Psychology, 59(3), 287-291.
Kaushik, K., & Keller, K. (2002). The effects of ingredient branding strategies on host brand
extendibility. Journal of Marketing, 66(1), 73-93.
Keh, H., & Pang, J. (2010). Customer reactions to service separation. Journal of Marketing,
74(2), 55-70.
Kim, S., & Malhotra, N. (2005). A longitudinal model of continued is use: An integrative view
of four mechanisms underlying postadoption phenomena. Management Science, 51(5),
741-755.
Kleijnen, M., de Ruyter, K., & Wetzels, M. (2007). An assessment of value creation in mobile
service delivery and the moderating role of time consciousness. Journal of Retailing,
83(1), 33-46.
88

References
Kotler, P., Keller, K., & Blieml, F. (2007). Marketing management. Munich: Pearson Studium.
Lam, S., Shankar, V., & Murthy, M. (2004). Customer value, satisfaction, loyalty, and swithcing
costs: An illustration from a business-to-business service ntext. Journal of the Academy
of Marketing Science, 32(3), 292-311.
Landwehr, J. R., Wentzel, D., & Herrmann, A. (2013). Product design for the long run: con-
sumer responses to typical and atypical designs at different stages of exposure. Journal
of Marketing, 77(5), 92–107.
Law, A., Logan, H., & Baron, R. (1994). Desire for control, felt control, and stress inoculation
training during dental treatment. Journal of Personality and Social Psychology, 67(5),
926-936.
Leavitt, H. (1954). A note on some experimental findings about the meaning of price. The
Journal of Business, 27(3), 205-210.
Leclerc, F., Schmitt, B., & Dube, L. (1995). Waiting time and decision making: Is time like
money. Journal of Consumer Research, 22(1), 110-119.
Lerner, J., & Keltner, D. (2001). Fear, anger, and risk. Journal of Personality and Social
Psychology, 81(1), 146-159.
Lovelock, C., & Gummerson, E. (2004). Whither services marketing?: In search of a new
paradigm and fresh perspectives. Journal of Service Research, 7(1), 20-41.
Lukas, B., Whitwell, G., & Heide, J. (2013). Why do customers get more than they need? how
organizational culture shapes product capability decisions. Journal of Marketing, 77(1),
1-12.
Lusch, R., & Vargo, S. (2006). Service-dominant logic: reactions, reflections and refinements.
Marketing Theory, 6(3), 281-288.
Lusch, R., Vargo, S., & O’Brien, M. (2007). Competing through service: Insights from service-
dominant logic. Journal of Retailing, 83(1), 5-18.
Lusch, R., Vargo, S., & Tanniru, M. (2010). Service, value networks and learning. Journal of
the Academy of Marketing Science, 38(1), 19-31.
Ma, Z., Yang, Z., & Mourali, M. (2014). Consumer adoption of new products: Independent
versus interdependent self-perspectives. Journal of Marketing, 78(2), 101-117.
MacInnis, D. J. (2011). A framework for conceptual contributions in marketing. Journal of
Marketing, 75(4), 136–154.
Mathwick, C., Mahotra, N., & Rogdon, E. (2001). Experiental value: conceptualization, mea-
surement and application in the catalog and internet shopping environment. Journal of
Retailing, 77(1), 39-56.
May, F., & Monga, A. (2014). When time has a will of its own, the powerless don’t have
89

References
the will to wait: Antropomorphism of time can decrease patience. Journal of Consumer
Research, 40(5), 924-942.
Meldrum, M. (1995). Marketing high-tech products: the emerging themes. European Journal
of Marketing, 29(10), 45-48.
Meuter, M., Bitner, M., Ostrom, A., & Brown, S. (2005). Choosing among alternative service
delivery modes: An investigation of customer trial of self-service technology. Journal of
Marketing, 69(2), 61-83.
Meuter, M., Ostrom, A., Bitner, M., & Roundtree, R. (2003). The influence of technology
anxiety on consumer use and experiences with self-services technologies. Journal of
Business Research, 56(11), 899-906.
Meuter, M., Ostrom, A., Roundtree, R., & Bitner, M. (2000). Self-service technologies: Un-
derstanding customer satisfaction with technology-based service encounters. Journal of
Marketing, 64(3), 50-64.
Miller, G. A., & Chapman, J. P. (2001). Misunderstanding analysis of covariance. Journal of
abnormal psychology, 110(1), 40.
Mitchell, V.-W., & Greatorex, M. (1993). Risk perception and reduction in the purchase of
consumer services. The Service Industries Journal, 13(4), 179-200.
Mochon, D., Norton, M. I., & Ariely, D. (2012). Bolstering and restoring feelings of compe-
tence via the ikea effect. International Journal of Research in Marketing, 29(4), 363–369.
Moeller, S. (2008). Customer integration - a key to an implementation perspective of service
provision. Journal of Service Research, 11(2), 197-210.
Moldovan, S., Goldenberg, J., & Chattopadhyay, A. (2011). The different roles of product orig-
inality and usefulness in generating word-of-mouth. International Journal of Research in
Marketing, 28(2), 109-119.
Muller, D., Judd, C. M., & Yzerbyt, V. Y. (2005). When moderation is mediated and mediation
is moderated. Journal of personality and social psychology, 89(6), 852.
Murray, K., & Schlacter, J. (1990). The impact of services versus goods on consumers’ as-
sessment of perceived risk and variability. Journal of the Academy of Marketing Science,
18(1), 51-65.
Noordhoff, C., Kyriakopoulos, K., Moorman, C., Pauwels, P., & Dellaert, B. (2011). The
bright side and dark side of embedded ties in business-to-business innovation. Journal of
Marketing, 75(5), 34–52.
Normann, R. (2001). Reframing business: when the map changes the landscape. Chichester:
Wiley.
Novemsky, N., Dhar, R., Schwarz, N., & Simonson, I. (2007). Preference fluency in choice.
90

References
Journal of Marketing Research, 44(3), 347–356.
Nysveen, H., Pedersen, P., & Thorbjønsen, H. (2005). Intentions to use mobile services:
Antecedetns and cross-service comparison. Journal of the Academy of Marketing Science,
33(3), 330-346.
Okada, E., & Hoch, S. (2004). Spending time versus spending money. Journal of Consumer
Research, 31(2), 313-323.
Olson, E., Walker, O., & Ruekert, R. (1995). Organizing for effective new product development:
The moderating role of product innovativeness. Journal of Marketing, 59(1), 48-62.
Oppenheimer, D. M., Meyvis, T., & Davidenko, N. (2009). Instructional manipulation checks:
Detecting satisficing to increase statistical power. Journal of Experimental Social Psy-
chology, 45(4), 867–872.
Paluch, S., & Blut, M. (2013). Service separation and customer satisfaction: Assessing the
service separation/customer integration paradox. Journal of Service Research, 16(3),
415-427.
Parasuraman, A. (2000). Technology readiness index (tri): A multiple-item scale to measure
readiness to embrace new technologies. Journal of Service Research, 2(4), 307-320.
Parasuraman, A., Zeithaml, V., & Berry, L. (1988). Servqual: A multiple-item scale for mea-
suring consumer perceptions of service quality. Journal of Retailing, 64(1), 12-40.
Paternoster, R., Brame, R., Mazerolle, P., & Piquero, A. (1998). Using the correct statistical
test for the equality of regression coefficients. Criminology, 36(4), 859–866.
Pauwels, K., Silva-Risso, S., J. Srinivasan, & Hanssens, D. (2004). New products, sales promo-
tions, and firm value: The case of the automobile industry. Journal of Marketing, 68(4),
142-156.
Podsakoff, P., MacKenzie, S., & Podsakoff, N. (2012). Sources of method bias in social science
and recommendations on how to control it. Annual Review of Psychology, 63, 539-569.
Prahalad, C., & Ramaswamy, V. (2000). Co-opting customer competence. Harvard Business
Review, 78(1), 79-87.
Preacher, K. J., Rucker, D. D., & Hayes, A. F. (2007). Addressing moderated mediation
hypotheses: Theory, methods, and prescriptions. Multivariate behavioral research, 42(1),
185–227.
Quinn, R., & Rohrbaugh, J. (1983). A spatial model of effectiveness criteria: Towards a
competing values approach to organizational analysis. Management Science, 29(3), 363-
377.
Rijsdijk, S., Hultkin, E., & Diamantopoulos, A. (2007). Product intelligence: its conceptual-
ization, measurement and impact on consumer satisfaction. Journal of the Academy of
91

References
Marketing Science, 35(3), 340-356.
Rijsdijk, S., Langerak, F., & Hultkin, E. (2011). Understanding a two-sided coin: Antecedents
and consequences of a decomposed product advantage. Journal of Product Innovation
Management, 28(1), 33-47.
Rijsdijk, S. A., & Hultink, E. J. (2009). How today’s consumers perceive tomorrow’s smart
products*. Journal of Product Innovation Management, 26(1), 24–42.
Rotter, J. (1966). Generalized expectancies for internal versus external control of reinforcement.
Psychological Monographs: General and Applied, 80(1), 1-28.
Rubera, G., & Kirca, A. (2012). Firm innovativeness and its performance outcomes: A meta-
analytic review and theoretical integration. Journal of Marketing, 76(3), 130-147.
Russell, D. (2002). In search of underlying dimensions: The use (and abuse) of factor analysis
in personality and social psychology bulletin. Personality and Social Psychology Bulletin,
28(12), 1629-1646.
Rust, R., & Huang, M.-H. (2012). Optimizing service productivity. Journal of Marketing,
76(2), 47-66.
Rust, R. T., & Huang, M.-H. (2014). The service revolution and the transformation of marketing
science. Marketing Science, 33(2), 206–221.
Satorra, A., & Bentler, P. M. (1994). Latent variabes analysis: Applications for developmental
research. In A. von Eye & C. Clogg (Eds.), (p. 399-419). Thousand Oaks, CA: Sage
Publications.
Schepers, J., & Wetzels, M. (2007). A meta-analysis of the technology acceptance model: In-
vestigationg subjecitve norm and moderation effects. Information & Management, 44(1),
90-103.
Sethi, R., & Iqbal, Z. (2008). Stage-gate controls, learning failure, and adverse effect on novel
new products. Journal of Marketing, 72(1), 118-134.
Shapiro Jr., D., Schwartz, C., & Astin, J. (1996). Controlling ourselves, controlling our world:
Psychology’s role in understanding positive and negative consequences of seeking and
gaining control. American Psychologist, 51(12), 1213-1230.
Shen, H., Jiang, Y., & Adaval, R. (2010). Contrast and assimilation effects of processing
fluency. Journal of Consumer Research, 36(5), 876–889.
Sinclair, J., & Irani, T. (2005). Advocacy advertising for biotechnology: The effect of public
accountability on corporate trust and attitude toward the ad. Journal of Advertising, 34(3),
59–73.
Sivakumar, K., Li, M., & Dong, B. (2014). Service quality: The impact of frequency, timing,
proximity, and sequence of failures and delights. Journal of Marketing, 78(1), 41-58.
92

References
Smith, A. K., Bolton, R. N., & Wagner, J. (1999). A model of customer satisfaction with service
encounters involving failure and recovery. Journal of marketing research, 36, 356–372.
Steenkamp, J.-B. E., ter Hofstede, F., & Wedel, M. (1999). A cross-national investigation into
the individual and national cultural antecedents of consumer innovativeness. Journal of
Marketing, 63(2), 55-69.
Strahilevitz, M. A., & Myers, J. (1998). Donations to charity as purchase incentives: How
well they work may depend on what you are trying to sell. Journal of consumer research,
24(4), 434.
Suri, R., & Monroe, K. B. (2003). The effects of time constraints on consumers’ judgments of
prices and products. Journal of consumer research, 30(1), 92–104.
Surprenant, C. F., & Solomon, M. R. (1987). Predictability and personalization in the service
encounter. the Journal of Marketing, 51(2), 86–96.
Talke, K., Salomo, S., Wieringa, J., & Lutz, A. (2009). What about design newness? investigat-
ing the relevance of a neglected dimension of product innovativeness. Journal of Product
Innovation Management, 26(6), 601-615.
Thatcher, J., & Perrewe, P. (2002). An empirical examination of individual traits as antecedents
to computer anxiety and computer self-efficacy. MIS Quarterly, 26(4), 381-396.
Thompson, D., Hamilton, R., & Rust, R. (2005). Feature fatigue: When product capabilities
become too much of a good thing. Journal of Marketing Research, 42(4), 431-442.
Thompson, D., & Norton, M. (2011). The social utility of feature creep. Journal of Marketing
Research, 48(3), 555-565.
Troye, S. V., & Supphellen, M. (2012). Consumer participation in coproduction:“i made it
myself” effects on consumers’ sensory perceptions and evaluations of outcome and input
product. Journal of Marketing, 76(2), 33–46.
Tsai, C. I., & McGill, A. L. (2011). No pain, no gain? how fluency and construal level affect
consumer confidence. Journal of Consumer Research, 37(5), 807–821.
Tversky, A., & Kahnemann, D. (1981). The framing of decisions and the psychology of choice.
Science, 211(4481), 453-458.
Ulaga, W., & Reinartz, W. (2011). Hybrid offerings: How manufacturing firms combine goods
and services successfully. Journal of Marketing, 75(6), 5-23.
van Beuningen, J., de Ruyter, K., & Wetzels, M. (2011). The power of self-efficacy change
during service provision: Making your customers feel better about themselves pays off.
Journal of Service Research, 14(1), 108-125.
Vandermerwe, S., & Rada, J. (1988). Servitization of business: Adding value by adding ser-
vices. European Management Journal, 6(4), 314-324.
93

References
van Osselaer, S., & Janiszewski, C. (2012). A goal-based model of product evaluation and
choice. Journal of Consumer Research, 39(2), 260-292.
Vargo, S., & Lusch, R. (2004). Evolving to a new dominant logic for marketing. Journal of
Marketing, 68(1), 1-17.
Venkatesh, V. (2000). Determinants of perceived ease of use: Integrating control, intrinsic
motivation, and emotion into the technology acceptance model. Information Systems
Research, 11(4), 342-365.
Venkatesh, V., & Bala, H. (2008). Technology acceptance model 3 and a research agenda on
interventions. Decision Science, 39(2), 273-315.
Venkatesh, V., & Davis, F. (2000). A theoretical extension of the technology acceptance model:
Four longitudinal field studies. Management Science, 46(2), 186-204.
Venkatesh, V., Morris, M., & Ackerman, P. (2000). A longitudinal field investigation of gender
differences in individual technology adoption decision-making processes. Organizational
Behavior and Human Decision Processes, 83(1), 33-60.
Venkatesh, V., Morris, M., Davis, G., & Davis, F. (2003). User acceptance of information
technology: Toward a unified view. MIS Quarterly, 27(3), 425-478.
Venkatesh, V., Thong, J. Y., & Xu, X. (2012). Consumer acceptance and use of information
technology: Extending the unified theory of acceptance and use of technology. MIS
Quarterly, 36(1), 157-178.
Voss, K., Spangenberg, E., & Grohmann, B. (2003). Measuring the hedonic and utilitarian
dimensions of consumer attitude. Journal of Marketing Research, 40(3), 310-320.
Wentzel, D., Tomczak, T., & Henkel, S. (2014). Can friends also become customers? the impact
of employee referral programs on referral likelihood. Journal of Service Research, 17(2),
119–133.
Wertenbroch, K., & Dhar, R. (2000). Consumer choice between hedonic and utilitarian goods.
Journal of Marketing Research, 37(1), 60-71.
Woodruff, R. (1997). Customer value: The next source for competitive advantage. Journal of
the Academy of Marketing Science, 25(2), 139-153.
Wortman, G., & Brehm, J. (1975). Responses to uncontrollable outcomes: An integration of
reactance theory and the lerned helplesness model. In L. Berkowitz (Ed.), Advances in
experimental social psychology (Vol. 8). New York: Academic Press.
Wunderlich, N., von Wangenheim, F., & Bitner, M. (2012). High tech and high touch: A frame-
work for understanding user attitudes and behaviors related to smart interactive services.
Journal of Service Research, 16(1), 3-20.
Yim, C., Chan, K., & Lam, S. S. (2012). Do customers and employees enjoy service par-
94

References
ticipation? synergistic effects of self- and other-efficacy. Journal of Marketing, 76(6),
121-140.
Zeithaml, V. (1988). Consumer perceptions of price, quality, and value: A means-end model
and synthesis of evidence. Journal of Marketing, 52(3), 2-22.
Zeithaml, V., Berry, L., & Parasuraman, A. (1996). The behavioral consequences of service
quality. Journal of Marketing, 60(2), 31-46.
Zhao, X., Lynch Jr., J., & Chen, Q. (2010). Reconsidering baron and kenny: Myths and truths
about mediation analysis. Journal of Consumer Research, 37(2), 197-206.
95

Curriculum Vitae
Curriculum Vitae
Name Christian Hauner
Date of Birth 21st of February 1985 in Landshut, Germany
Education2012 - 2015 University of St.Gallen, Switzerland
Doctoral Candidate in Business Administration
2012 University of Michigan, USA
Summer School in Quantitative Research Methods
2009 - 2012 Technische Universitat Munchen, Germany
Master Studies in Industrial Engineering
2005 - 2009 University of applied Sciences Landshut, Germany
Diploma Studies in Mechanical Engineering
2005 Hans-Leinberger-Gymansium Landshut, Germany
Abitur
Working Experience2012 - 2015 Center for Customer Insight, University of St.Gallen, Switzerland
Research Associate and Project Leader
2011 Technische Universitat Munchen, Germany
Student assistant at the Department of Service and Technology Marketing
and at the Department of Automotive Engineering
2009 BMW Group, Munich, Germany
Diploma thesis
2008 - 2009 BMW Manufacturing Co., LLC, Spartanburg, USA
Internship
2008 Audi AG, Ingolstadt, Germany
Working student
2007 BMW Group, Munich, Germany
Working student
2006 BMW Group, Munich, Germany
Internship
96

Curriculum Vitae
2006 E.ON Bayern AG, Landshut, Germany
Working Student
2005 Fa. Franz Ostermaier, Landshut, Germany
Internship
97