dispersion modelling firth of clyde (delft-3d)
TRANSCRIPT

Dispersion modelling Firth of Clyde (Delft - 3 D )
Deposition modelling in the Firth of Clyde
Dawnfresh Farming Ltd
Assignment Number: L300558 - S01 Document Number: L - 300558 - S01 - REPT - 001
Xodus Group Cheapside House , 138 Cheapside London , UK , EC2V 6BJ T +44 (0)207 246 2990 E [email protected] www.xodusgroup .com

Dispersion modelling Firth of Clyde (Delft-3D) – Deposition modelling in the Firth of Clyde Assignment Number: L300558-S01 Document Number: L-300558-S01-REPT-001
Deposition modelling in the Firth of Clyde
L300558-S01
Client: Dawnfresh Farming Ltd
Document Type: Report
Document Number: L-300558-S01-REPT-001
A01 07/07/2020 Issued for Use PB AM AM -
R01 06/07/2020 Issued for Review PB AM AM -
Rev Date Description Issued By Checked
By Approved
By Client
Approval
ii

Dispersion modelling Firth of Clyde (Delft-3D) – Deposition modelling in the Firth of Clyde Assignment Number: L300558-S01 Document Number: L-300558-S01-REPT-001
CONTENTS
1 INTRODUCTION 4
1.1 Overview 4
1.2 Objectives 4
2 MODELLING 4
2.1 Model Inputs 6 2.1.1 Feed scenario model details 6
2.1.2 Faeces scenario model details 7
2.1.3 Bath treatment scenario model inputs 7
2.1.4 Wind Scenarios 7
2.1.5 Year-long Scenarios 7
3 RESULTS 9
3.1 Feed and faeces deposition – short duration (SP-NP-SP) scenarios 9 3.1.1 Greater Cumbrae 9
3.1.2 Isle of Little Cumbrae 10
3.1.3 South Bute 11
3.1.4 Mean mass of deposited material 12
3.1.5 Discussion 13
3.2 Feed and faeces deposition – yearly scenarios 13 3.2.1 Greater Cumbrae 13
3.2.2 Isle of Little Cumbrae 14
3.2.3 South Bute 15
3.2.4 Mean mass of deposited material – yearly models 16
3.3 Bath treatments – Neap and Spring tide model runs 16 3.3.1 Greater Cumbrae - Azamethiphos 17
3.3.2 Greater Cumbrae - Cypermethrin 21
3.3.3 Greater Cumbrae - Deltamethrin 25
3.3.4 Isle of Little Cumbrae - Cypermethrin 29
3.3.5 Isle of Little Cumbrae - Deltamethrin 35
3.3.6 South Bute - Azamethiphos 41
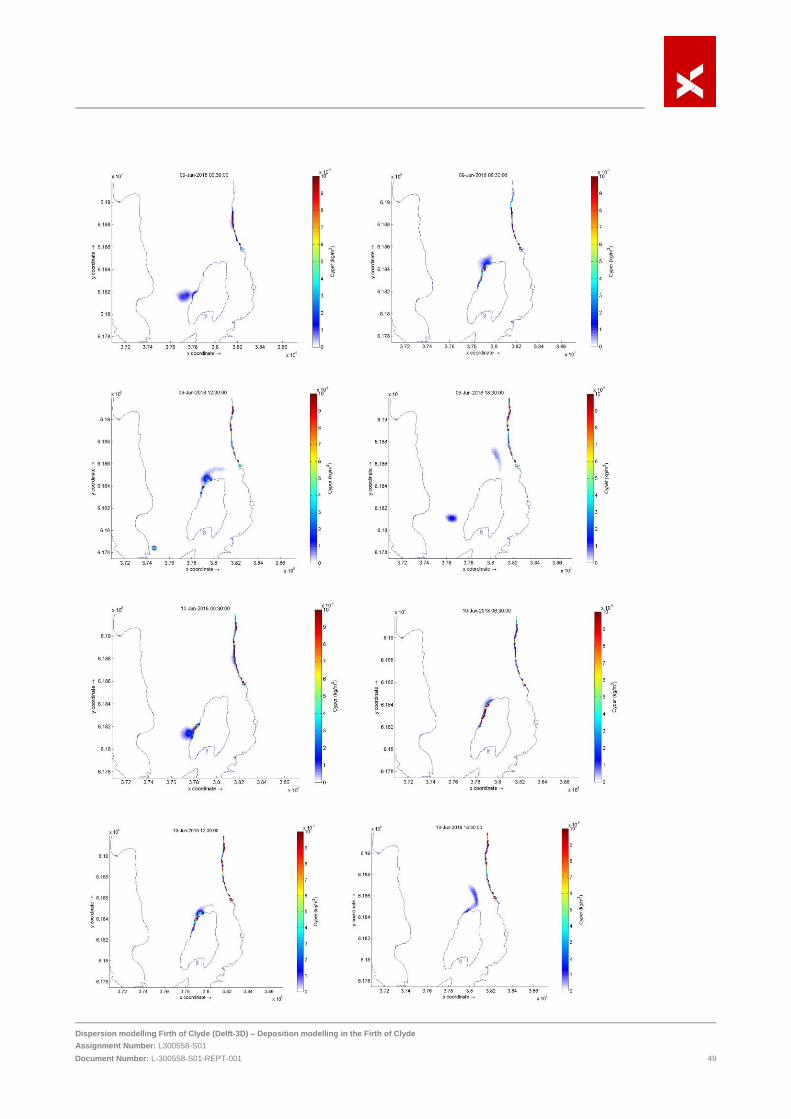
3.3.7 South Bute – Cypermethrin 48
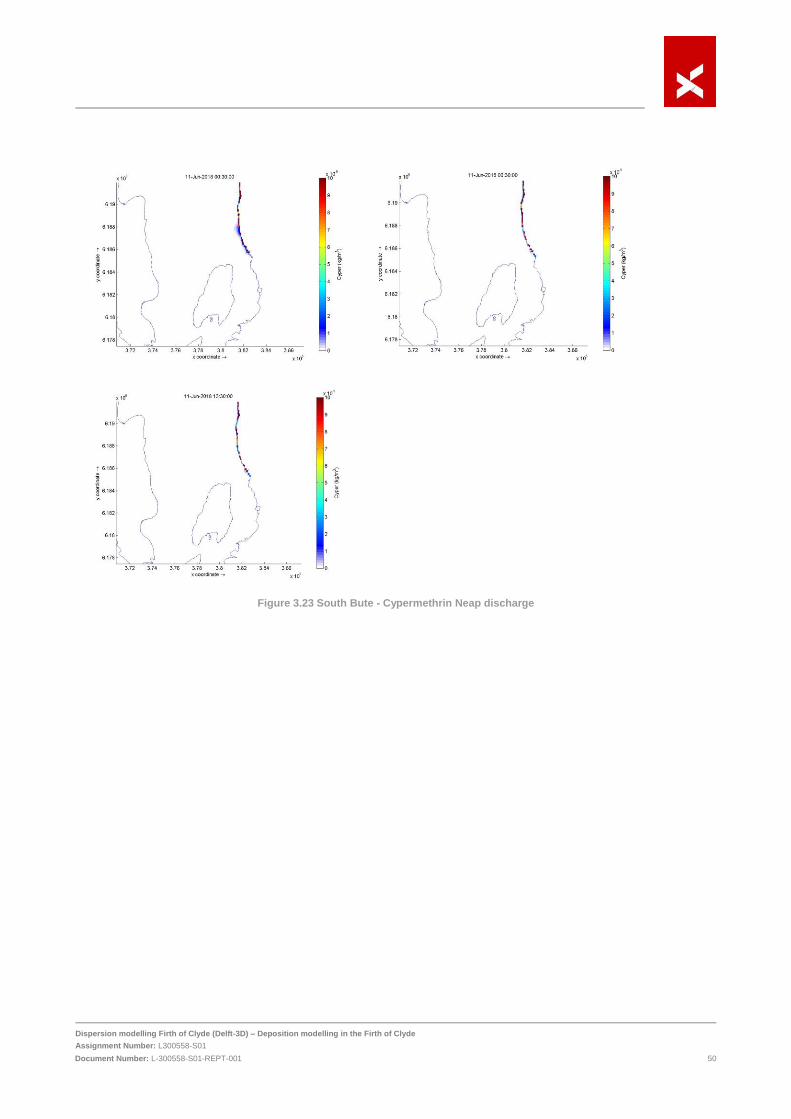
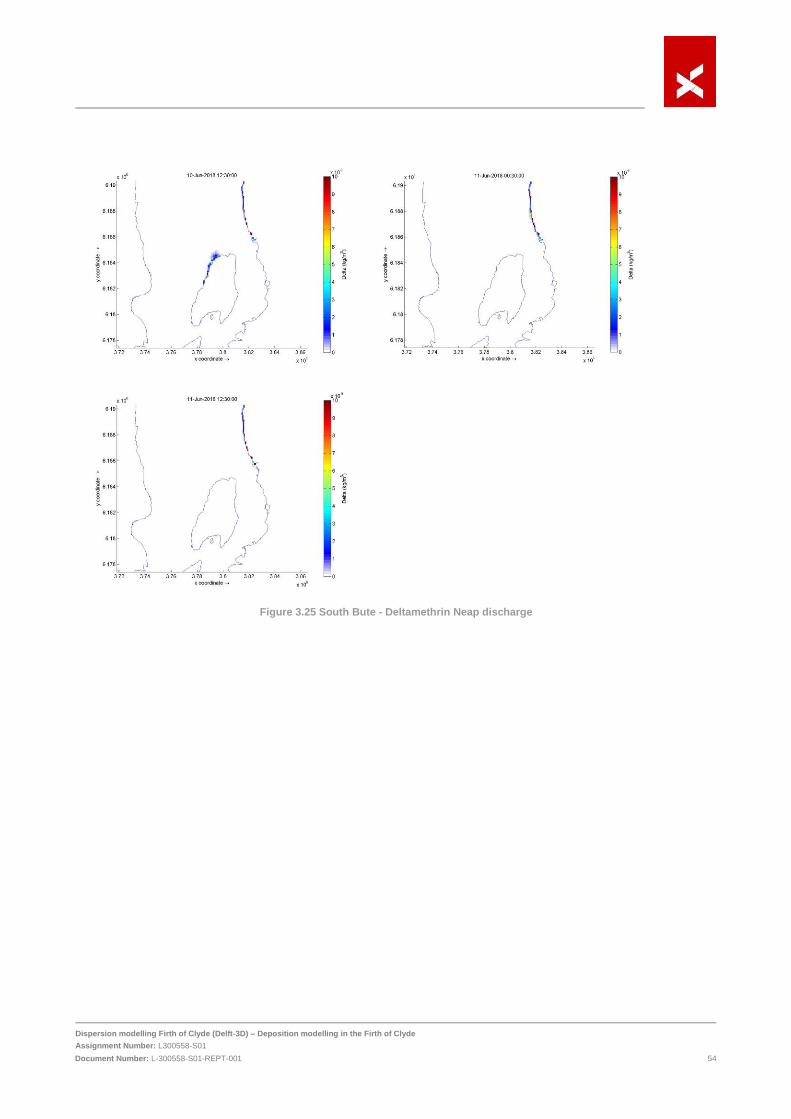
3.3.8 South Bute – Deltamethrin 53
4 CONCLUSIONS 56
4.1 Greater Cumbrae 56
4.2 Isle of Little Cumbrae 57
4.3 South Bute 57
5 REFERENCES 58
iii

Dispersion modelling Firth of Clyde (Delft-3D) – Deposition modelling in the Firth of Clyde Assignment Number: L300558-S01 Document Number: L-300558-S01-REPT-001 4
1 INTRODUCTION The tidal range in the inner Firth is relatively small at about 1.6 m for mean neap tides and 3.0 m for mean
spring tides (UK Hydrographic Office, 2020). The tidal velocities are also weak, in the range 0.1 - 1.1 kts
(Millport). This results in small tidal excursions (i.e. the distance water travels during a tide), typically about 3.6
to 3.8 km on a spring tide at Little Cumbrae. The area is sheltered from the prevailing south-westerly winds by
Northern Ireland, the Kintyre Peninsula, and the Isle of Arran.
1.1 Overview
The Scottish Environment Protection Agency (SEPA) promotes the use of the AUTODEPOMOD and BathAuto
modelling to evaluate deposition of waste from sea cages and the impact of infeed and bath applications of
veterinary medicinal products as part of the aquaculture site licence applications.
However, it is acknowledged by SEPA, and demonstrated by site surveys, that for some sites with higher
biomass loading in high energy locations the standard modelling does not sufficiently predict the deposition in
the far-field and is unable to model cumulative impacts. Therefore, Dawnfresh Farming Ltd. (Dawnfresh)
commissioned Xodus Group (Xodus) to develop a Delft3D hydrodynamic model for their aquaculture sites in
the Firth of Clyde. The model more accurately predicts and assesses deposition within high energy
environments and therefore is better at determining the maximum biomass that sites are capable of supporting
without adversely impacting the benthic environment. In addition, the model can be used to simulate fish
medicine release at multiple sites to determine whether a combined impact may result from such an activity.
The model was developed by Coastal Science Ltd who were subcontracted by Xodus through an established working partnership, due to their previous modelling experience within the Firth of Clyde. Details of the model development, calibration and validation have previously been reported to SEPA (Xodus, 2020).
1.2 Objectives
The objective of the present study is to use the Delft3D model to simulate the fate of fish faeces, waste feed
and bath medicines at three Dawnfresh aquaculture sites in the Firth of Clyde: > Great Cumbrae;
> Isle of Little Cumbrae; and
> South Bute
The key aims of the study were to investigate:
> To what extent may any of the sites cause appreciable impacts at other sites;
> To what extent may the sites, individually or in combination, cause appreciable impacts in the wider
marine environment; and
> To what extent are the SSSIs and PMFs situated in proximity to the proposed sites impacted by the
discharges.
2 MODELLING The D-PART module of Delft3D simulates transport and simple water quality processes by means of a particle
tracking method using the (2 or 3-dimensional) flow data from the D-FLOW hydrodynamic module. The tracks
are followed in three dimensions over time, whereby a dynamic concentration distribution is obtained by
calculating the mass of particles in the model grid cells.
The processes are assumed to be deterministic except for a random displacement of the particle at each time
step. The particle tracking method is based on a random-walk method since the simulated behaviour is
stochastic and the number of particles is finite.

Dispersion modelling Firth of Clyde (Delft-3D) – Deposition modelling in the Firth of Clyde Assignment Number: L300558-S01 Document Number: L-300558-S01-REPT-001 5
Particle tracking allows water quality processes to be described in a detailed spatial pattern, resolving sub grid
concentration distributions. Delft3D-PART is best suited for studies over the mid-field range (200 m to 15 km)
of instantaneous or continuous releases, simulation of an effluent plume and modelling of the transport of
substances such as salt, bacteria, dye, oil, Biological Oxygen Demand (BOD), or other conservative or
decaying chemical substances following first-order kinetics.
The simulations were set up to consider each scenario and each farm location separately. The faeces and
feed scenarios were modelled for a period covering a Spring – Neap – Spring (SP-NP-SP) tidal cycle, both
with and without wind conditions applied, resulting in a total of 12 SP-NP-SP simulations as described in Table
2.1.
It was decided that the decision to run in-combination dicharge models (i.e. Greater Cumbrae + Isle of Little
Cumbrae + South Bute) would be based on the results of the indicidual discharges.
Table 2.1 Modelled feed and faeces discharge scenarios
Location Substance Modelled duration
Great Cumbrae Faeces SP-NP-SP
Great Cumbrae Feed waste SP-NP-SP
Isle of Little Cumbrae Faeces SP-NP-SP
Isle of Little Cumbrae Feed waste SP-NP-SP
South Bute Faeces SP-NP-SP
South Bute Feed waste SP-NP-SP
Great Cumbrae Faeces SP-NP-SP (No Wind)
Great Cumbrae Feed waste SP-NP-SP (No Wind)
Isle of Little Cumbrae Faeces SP-NP-SP (No Wind)
Isle of Little Cumbrae Feed waste SP-NP-SP (No Wind)
South Bute Faeces SP-NP-SP (No Wind)
South Bute Feed waste SP-NP-SP (No Wind)
The modelled bath treatment scenarios are shown in Table 2.2. These considered the spring and neap tidal
cycles separately, resulting in 18 simulations. Further details of the model inputs are provided in Section 2.1

Dispersion modelling Firth of Clyde (Delft-3D) – Deposition modelling in the Firth of Clyde Assignment Number: L300558-S01 Document Number: L-300558-S01-REPT-001 6
Table 2.2 Modelled bath treatment scenarios
Location Substance Modelled duration
Great Cumbrae Azamethiphos Neap tide
Great Cumbrae Azamethiphos Spring tide
Great Cumbrae Cypermethrin Neap tide
Great Cumbrae Cypermethrin Spring tide
Great Cumbrae Deltamethrin Neap tide
Great Cumbrae Deltamethrin Spring tide
Isle of Little Cumbrae Azamethiphos Neap tide
Isle of Little Cumbrae Azamethiphos Spring tide
Isle of Little Cumbrae Cypermethrin Neap tide
Isle of Little Cumbrae Cypermethrin Spring tide
Isle of Little Cumbrae Deltamethrin Neap tide
Isle of Little Cumbrae Deltamethrin Spring tide
Bute Azamethiphos Neap tide
Bute Azamethiphos Spring tide
Bute Cypermethrin Neap tide
Bute Cypermethrin Spring tide
Bute Deltamethrin Neap tide
Bute Deltamethrin Spring tide
2.1 Model Inputs
Details of the modelled farm setups are provided below.
Table 2.3 Modelled aquaculture site locations and layouts - dicharge locations
Site Name Site group centre position Number of
Cages
Cage Circumference
(m)
Cage group
configuration Net Depth
(m) E N
Great Cumbrae 218162.2 654944.0
10 120 2 x 5
16
Isle of Little Cumbrae 214484.1 652622.4 14
South Bute 211692.6 653363.5 16
2.1.1 Feed scenario model details Table 2.4 Modelled feed details
Site Name Concentration
(kg/m3) Release rate
(m3/s) Release duration Particle settling velocity*
(m/s)
Great Cumbrae 16.59
0.001 1 hr per day 0.035
Isle of Little Cumbrae 13.27
South Bute 16.59
* Values provided within the draft SEPA, 2020

Dispersion modelling Firth of Clyde (Delft-3D) – Deposition modelling in the Firth of Clyde Assignment Number: L300558-S01 Document Number: L-300558-S01-REPT-001 7
2.1.2 Faeces scenario model details Table 2.5 Modelled faeces discharges
Site Name Concentration
(kg/m3) Release rate
(m3/s)
Release duration Particle settling
velocity*
(m/s)
Great Cumbrae 3.456
0.001 Continuous 0.009
Isle of
Little
Cumbrae 2.765
South Bute 3.456
* Values provided within the draft SEPA, 2020
2.1.3 Bath treatment scenario model inputs Table 2.6 Modelled bath treatment regimes
Site Name Treatment Dosage (g)
Schedule
Great Cumbrae Azamethiphos 206.30 1 pen per day 10 days
Cypermethrin 138.44 Dosage suitable for 10 pens but treatment over 3 days
Deltamethrin 51.92 Dosage suitable for 10 pens but treatment over 3 days
Isle of Little Cumbrae Cypermethrin 69.22 Dosage suitable for 5 pens carried out over 3 days
Deltamethrin 25.96 Dosage suitable for 5 pens carried out over 3 days
South Bute Azamethiphos 217.76 1 pen per day 10 days
Cypermethrin 124.88 Dosage suitable for 10 pens but treatment over 3 days
Deltamethrin 46.83 Dosage suitable for 10 pens but treatment over 3 days
2.1.4 Wind Scenarios All the Neap-Spring-Neap simulations described in Table 2.1 were repeated with wind applied in both the
hydrodynamic (D-FLOW) and D-PART simulations. The wind was set to 7 m/s from 214° (southwesterly), with
wind drag coefficients defined on a site-specific basis in accordance with the values determined and presented
in the Hydrodynamic Calibration report.
2.1.5 Year-long Scenarios All the Neap-Spring-Neap simulations described were repeated for a full year, in order to aid an understanding
of the long-term waste patterns on the bed. The hydrodynamics were run for the full year (as opposed to the
neap-spring-neap database being rewound and repeated in the D-PART simulation) It should be noted that in
order to keep simulation times manageable, the D-PART timestep had to be increased from 1 minute to 30
minutes. The effect of this change is that particles were released by the model in larger simultaneous

Dispersion modelling Firth of Clyde (Delft-3D) – Deposition modelling in the Firth of Clyde Assignment Number: L300558-S01 Document Number: L-300558-S01-REPT-001 8
quantities, thus reducing the accuracy of the modelled settling and sedimentation / resuspension processes.
Year-long models were not conduicted for the bath treatment scnearios (Table 2.2).
The year-long scenarios were all modelled with monthly varying wind data, based on yearly averages for
Glasgow Airport for the period November 2000 – May 2020 (Windfinder, 2020).
Table 2.7 Wind speed averages and direction (Wavefinder, 2020)
Month Wind Speed (kts)
Wind Speed
(m/s) Dominant Wind Direction
January 10 5.14 Southwest (SW)
February 9 4.63 Southwest (SW)
March 10 5.14 West-Southwest (WSW)
April 10 5.14 West-Southwest (WSW)
May 10 5.14 Southwest (SW)
June 9 4.63 West-Southwest (WSW)
July 8 4.12 West-Southwest (WSW)
August 9 4.63 West-Southwest (WSW)
September 9 4.63 Southwest (SW)
October 9 4.63 Southwest (SW)
November 8 4.12 Southwest (SW)
December 9 4.63 Southwest (SW)

Dispersion modelling Firth of Clyde (Delft-3D) – Deposition modelling in the Firth of Clyde Assignment Number: L300558-S01 Document Number: L-300558-S01-REPT-001 9
3 RESULTS Model results are presented for each aquaculture site for the following models:
> Feed and Faeces deposition – short duration model runs (SP-NP-SP)
> Feed and Faeces deposition – yearly model runs
> Bath treatment chemical (Azamethiphos, Cypermethrin and Deltamethrin) dispersion – Neap tidal
period
> Bath treatment chemical (Azamethiphos, Cypermethrin and Deltamethrin) dispersion – Spring tidal
period
3.1 Feed and faeces deposition – short duration (SP-NP-SP) scenarios.
The outputs from the feed and faeces models have been combined to present the total seabed deposition. The
results are presented in this section for the final model timestep (day 21), thereby providing the maximum
deposited material.
3.1.1 Greater Cumbrae
The maximum deposited material (feed and faeces) after 21-days are shown in Figure 3.1 and Figure 3.2, for
the wind and no wind scenarios respectively. These indicate that the maximum predicted deposition is
approximately 0.8 kg/m2 and, as expected, is located under the cages. The deposited mass reduces rapidly
with distance from the cages, under the influence of the localised currents.
It should be noted that the inclusion of the wind within the model results in minimal variations in the deposition
pattern and negligible influence on the maximum deposited mass.
Figure 3.1 Deposited material at Greater Cumbrae after 21 days - Wind applied. The red contour depicts the predicted 20g
contour.

Dispersion modelling Firth of Clyde (Delft-3D) – Deposition modelling in the Firth of Clyde Assignment Number: L300558-S01 Document Number: L-300558-S01-REPT-001 10
Figure 3.2 Deposited material at Greater Cumbrae after 21 days – No wind applied
3.1.2 Isle of Little Cumbrae
The maximum deposited material (feed and faeces) after 21-days are shown in Figure 3.3 and Figure 3.4, for
the wind and no wind scenarios respectively. These indicate that the maximum predicted deposition is
approximately 0.8 kg/m2. The deposited mass reduces rapidly with distance from the cages, under the
influence of the localised currents.
The maximum mass deposited is not influenced by the inclusion of wind data, however its inclusion does
influence the extents of the deposition contours.

Dispersion modelling Firth of Clyde (Delft-3D) – Deposition modelling in the Firth of Clyde Assignment Number: L300558-S01 Document Number: L-300558-S01-REPT-001 11
Figure 3.3 Deposited material at Little Cumbrae after 21-days - Wind applied. The red contour depicts the predicted 20g
contour.
Figure 3.4 Deposited material at Little Cumbrae after 21-days – No wind applied. The red contour depicts the predicted 20g
contour.
3.1.3 South Bute
The maximum deposited material (feed and faeces) after 21-days are shown in Figure 3.5 and Figure 3.6, for
the wind and no wind scenarios respectively. These indicate that the maximum predicted mass deposited is
approximately 0.8 kg/m2. The deposited mass reduces rapidly with distance from the cages, under the
influence of the localised currents. The inclusion of the wind data is shown as influencing the westerly extent

Dispersion modelling Firth of Clyde (Delft-3D) – Deposition modelling in the Firth of Clyde Assignment Number: L300558-S01 Document Number: L-300558-S01-REPT-001 12
of the deposit contours above 0.1kg/m2. The figures would suggest that the model results are also influenced
by the bathymetry at this location.
Figure 3.5 Deposited material at Bute after 21-days - Wind applied. The red contour depicts the predicted 20g contour.
Figure 3.6 Deposited material at Bute after 21-days - Wind applied. The red contour depicts the predicted 20g contour.
3.1.4 Mean mass of deposited material
Figure 3.7 shows the mean mass of the deposited material during modelling for all three aquaculture sites,
with and without the inclusion of winds. These indicate that the rate of deposition at the Little Cumbrae site is

Dispersion modelling Firth of Clyde (Delft-3D) – Deposition modelling in the Firth of Clyde Assignment Number: L300558-S01 Document Number: L-300558-S01-REPT-001 13
influenced by the inclusion of wind within the model. The mean mass of the deposited material appears similar
at both the Greater and Bute sites with and without the inclusion of wind within the model.
Figure 3.7 Mean mass of deposited material throughout the modelling period for wind (left) and no wind (right) scenarios.
3.1.5 Discussion
The modelling indicates that at all three sites the maximum predicted deposited mass is approximately 0.8
kg/m2, with the maxima between located either under or between the cages. The deposition patterns are all
influenced by the prevailing currents to some extent, with the Greater Cumbrae site showing the greatest
current alignment at the higher contour levels. However, in all cases, the deposited mass decreases rapidly
with distance from the cage locations.
All the modelled sites show some degree of sensitivity to the inclusion of wind data, with the Little Cumbrae
site showing the greatest variation in terms of the mean mass deposition throughout the modelled period.
3.2 Feed and faeces deposition – yearly scenarios.
Figures 3.8 – 3.10 show the predicted deposited material for Greater Cumbrae, Isle of Little Cumbrae and
South Bute respectively, after 390 days (the end of the model run period). These indicate that the maximum
mass of deposited material does not exceed 25 kg/m2. However, it is important to note that the model doesn’t
include processes such as decay and biodegradation. Therefore, once a particle has been deposited it will
remain in-situ and subsequent discharges will add to the mass. Hence the model outputs represent an extreme
estimation of the potential deposited mass.
3.2.1 Greater Cumbrae
Figure 3.8 shows the predicted deposited mass of feed and faeces at Greater Cumbrae after 390-days (end
of model run); down to the 0.01 kg/m2 contour. The deposits are predicted to have a maximum mass of
approximately 25 kg/m2; located under and between the landward cages. As with the shorter (SP-NP-SP runs)
the deposited mass quickly reduces with distance from the cages and the contours are strongly aligned with
the predominant currents. The mean mass of the deposited material is predicted to be reach a mass of
approximately 0.35 kg/m2 at day 390 (Section 3.2.4).

Dispersion modelling Firth of Clyde (Delft-3D) – Deposition modelling in the Firth of Clyde Assignment Number: L300558-S01 Document Number: L-300558-S01-REPT-001 14
Figure 3.8 Predicted deposited mass of feed and faeces at Greater Cumbrae - yearly scenario. The red contour depicts the
predicted 20 g contour.
3.2.2 Isle of Little Cumbrae
Figure 3.9 shows the predicted deposited mass of feed and faeces at Greater Cumbrae after 390-days (end
of model run); down to the 0.05 kg/m2 contour. The deposits are predicted to have a maximum mass of
approximately 28 kg/m2; located in small patches under some of the cages. The mean mass of the deposited
material is predicted to have a maximum of approximately 0.27 kg/m2 (Section 3.2.4).

Dispersion modelling Firth of Clyde (Delft-3D) – Deposition modelling in the Firth of Clyde Assignment Number: L300558-S01 Document Number: L-300558-S01-REPT-001 15
Figure 3.9 Predicted deposited mass of feed and faeces at Isle of Little Cumbrae - yearly scenario. The red contour depicts the
predicted 20 g contour.
3.2.3 South Bute
Figure 3.9 shows the predicted deposited mass of feed and faeces at Bute after 390-days (end of model run);
down to the 0.05 kg/m2 contour. he deposits are predicted to have a maximum mass of approximately 0.06
kg/m2. The deposited mass decreases rapidly form the cages, with contours greater than 0.05 extending south
from the cage locations. The mean mass of the deposited material is predicted to be reach a mass of
approximately 0.35 kg/m2 at day 390 (Section 3.2.4).
Figure 3.10 Predicted deposited mass of feed and faeces at South Bute - yearly scenario. The red contour depicts the
predicted 20 g contour.

Dispersion modelling Firth of Clyde (Delft-3D) – Deposition modelling in the Firth of Clyde Assignment Number: L300558-S01 Document Number: L-300558-S01-REPT-001 16
3.2.4 Mean mass of deposited material – yearly models
3.3 Bath treatments – Neap and Spring tide model runs
The model results for the chemical dispersion model runs are presented below. In all models the maximum
concentration of approximately 0.0000001 kg/m3 (0.0001 ppm). These densities are generally evident in the
initial releases (7th June 2020 12:30 (Neaps) and 2nd June 2020 0800 (Springs)) and were chemicals are shown
to accumulate at the coastline. However, it should be remembered that in the Delft3D model the particles are

Dispersion modelling Firth of Clyde (Delft-3D) – Deposition modelling in the Firth of Clyde Assignment Number: L300558-S01 Document Number: L-300558-S01-REPT-001 17
not acted upon once they interact with the coastline. This includes processes such as decay and bioturbation,
and therefore the predicted coastal chemical densities should be considered as worst case.
Following the initial release, the chemicals are generally predicted to reduce rapidly (within 1 model timestep
(1 hour)) to densities of less than 0.00000004 kg/m3, on both the Spring and Neap tide.
3.3.1 Greater Cumbrae - Azamethiphos

Dispersion modelling Firth of Clyde (Delft-3D) – Deposition modelling in the Firth of Clyde Assignment Number: L300558-S01 Document Number: L-300558-S01-REPT-001 18
Figure 3.11 Greater Cumbrae - Azamethiphos Neap discharge

Dispersion modelling Firth of Clyde (Delft-3D) – Deposition modelling in the Firth of Clyde Assignment Number: L300558-S01 Document Number: L-300558-S01-REPT-001 19
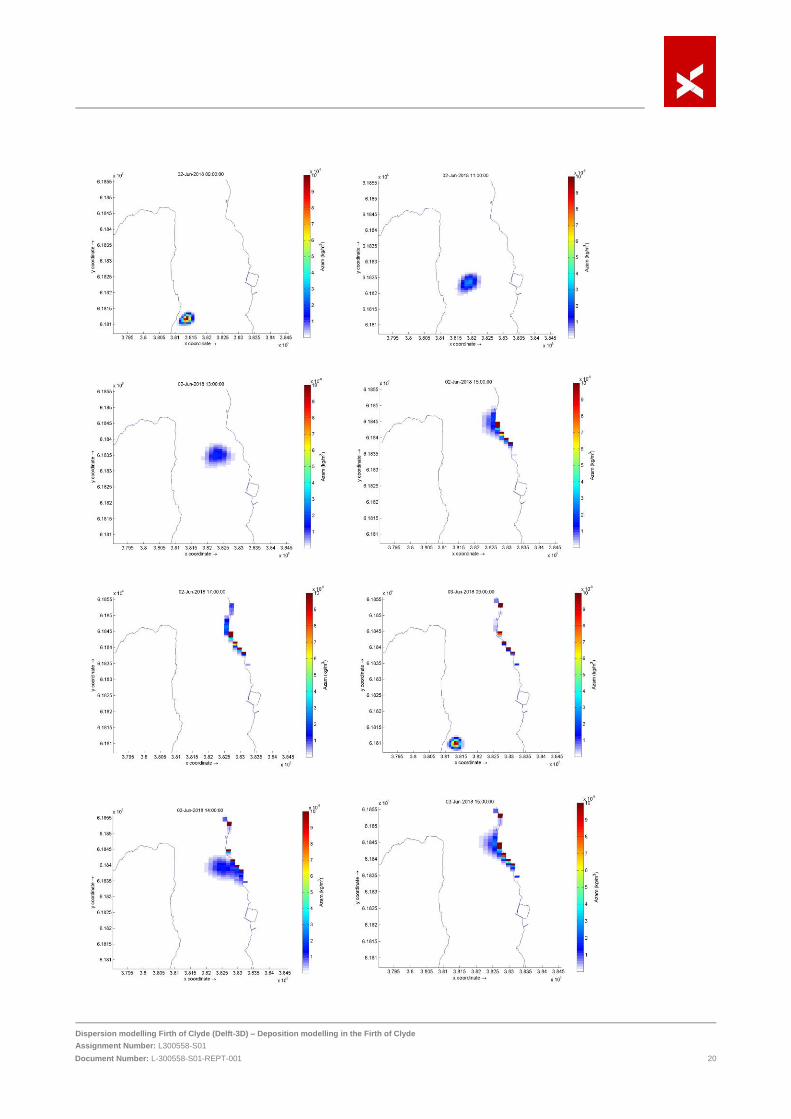
Dispersion modelling Firth of Clyde (Delft-3D) – Deposition modelling in the Firth of Clyde Assignment Number: L300558-S01 Document Number: L-300558-S01-REPT-001 20

Dispersion modelling Firth of Clyde (Delft-3D) – Deposition modelling in the Firth of Clyde Assignment Number: L300558-S01 Document Number: L-300558-S01-REPT-001 21
Figure 3.12 Greater Cumbrae - Azamethiphos Spring discharge
3.3.2 Greater Cumbrae - Cypermethrin

Dispersion modelling Firth of Clyde (Delft-3D) – Deposition modelling in the Firth of Clyde Assignment Number: L300558-S01 Document Number: L-300558-S01-REPT-001 22
Figure 3.13 Greater Cumbrae - Cypermethrin Neap discharge

Dispersion modelling Firth of Clyde (Delft-3D) – Deposition modelling in the Firth of Clyde Assignment Number: L300558-S01 Document Number: L-300558-S01-REPT-001 23
Figure 3.14 Greater Cumbrae - Cypermethrin Spring discharge

Dispersion modelling Firth of Clyde (Delft-3D) – Deposition modelling in the Firth of Clyde Assignment Number: L300558-S01 Document Number: L-300558-S01-REPT-001 24

Dispersion modelling Firth of Clyde (Delft-3D) – Deposition modelling in the Firth of Clyde Assignment Number: L300558-S01 Document Number: L-300558-S01-REPT-001 25
3.3.3 Greater Cumbrae - Deltamethrin

Dispersion modelling Firth of Clyde (Delft-3D) – Deposition modelling in the Firth of Clyde Assignment Number: L300558-S01 Document Number: L-300558-S01-REPT-001 26
Figure 3.15 Greater Cumbrae - Deltamethrin Neap discharge

Dispersion modelling Firth of Clyde (Delft-3D) – Deposition modelling in the Firth of Clyde Assignment Number: L300558-S01 Document Number: L-300558-S01-REPT-001 27

Dispersion modelling Firth of Clyde (Delft-3D) – Deposition modelling in the Firth of Clyde Assignment Number: L300558-S01 Document Number: L-300558-S01-REPT-001 28
Figure 3.16 Greater Cumbrae - Deltamethrin Spring discharge

Dispersion modelling Firth of Clyde (Delft-3D) – Deposition modelling in the Firth of Clyde Assignment Number: L300558-S01 Document Number: L-300558-S01-REPT-001 29
3.3.4 Isle of Little Cumbrae - Cypermethrin

Dispersion modelling Firth of Clyde (Delft-3D) – Deposition modelling in the Firth of Clyde Assignment Number: L300558-S01 Document Number: L-300558-S01-REPT-001 30

Dispersion modelling Firth of Clyde (Delft-3D) – Deposition modelling in the Firth of Clyde Assignment Number: L300558-S01 Document Number: L-300558-S01-REPT-001 31

Dispersion modelling Firth of Clyde (Delft-3D) – Deposition modelling in the Firth of Clyde Assignment Number: L300558-S01 Document Number: L-300558-S01-REPT-001 32
Figure 3.17 Isle of Little Cumbrae - Cypermethrin Neap discharge
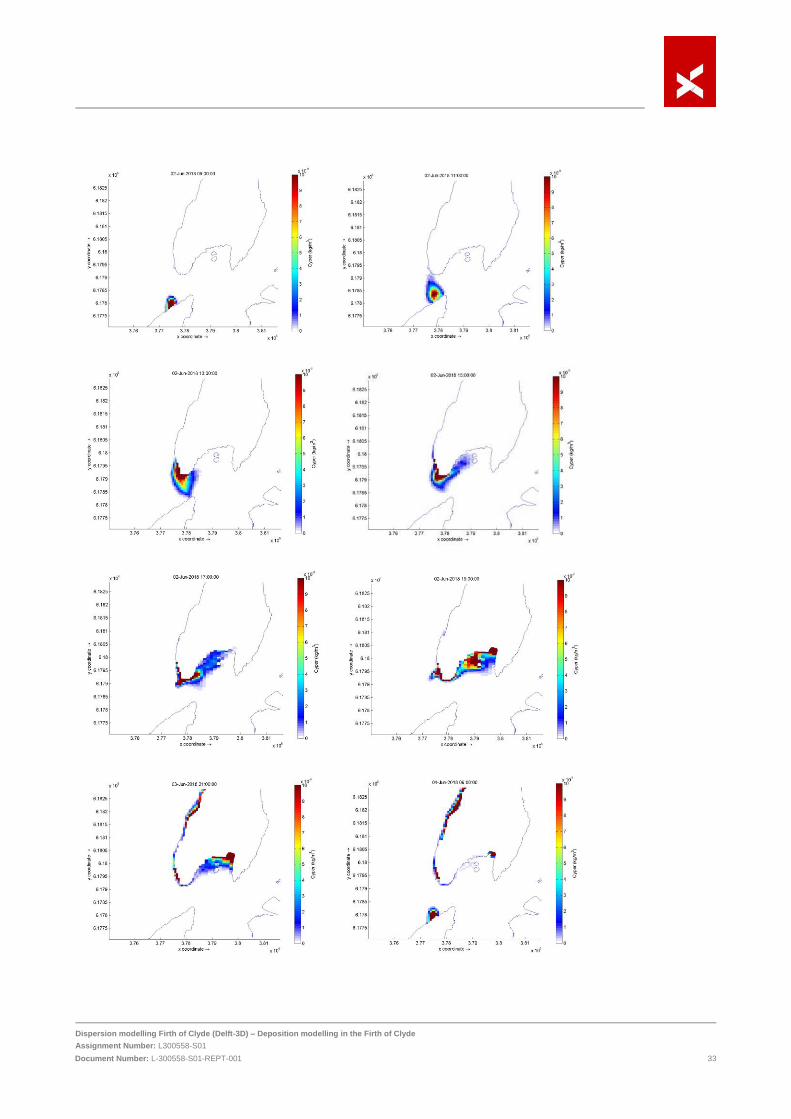
Dispersion modelling Firth of Clyde (Delft-3D) – Deposition modelling in the Firth of Clyde Assignment Number: L300558-S01 Document Number: L-300558-S01-REPT-001 33

Dispersion modelling Firth of Clyde (Delft-3D) – Deposition modelling in the Firth of Clyde Assignment Number: L300558-S01 Document Number: L-300558-S01-REPT-001 34
Figure 3.18 Isle of Little Cumbrae - Cypermethrin Spring discharge

Dispersion modelling Firth of Clyde (Delft-3D) – Deposition modelling in the Firth of Clyde Assignment Number: L300558-S01 Document Number: L-300558-S01-REPT-001 35
3.3.5 Isle of Little Cumbrae - Deltamethrin
Dispersion modelling Firth of Clyde (Delft-3D) – Deposition modelling in the Firth of Clyde Assignment Number: L300558-S01 Document Number: L-300558-S01-REPT-001 36

Dispersion modelling Firth of Clyde (Delft-3D) – Deposition modelling in the Firth of Clyde Assignment Number: L300558-S01 Document Number: L-300558-S01-REPT-001 37
Figure 3.19 Isle of Little Cumbrae - Deltamethrin Neap discharge

Dispersion modelling Firth of Clyde (Delft-3D) – Deposition modelling in the Firth of Clyde Assignment Number: L300558-S01 Document Number: L-300558-S01-REPT-001 38

Dispersion modelling Firth of Clyde (Delft-3D) – Deposition modelling in the Firth of Clyde Assignment Number: L300558-S01 Document Number: L-300558-S01-REPT-001 39

Dispersion modelling Firth of Clyde (Delft-3D) – Deposition modelling in the Firth of Clyde Assignment Number: L300558-S01 Document Number: L-300558-S01-REPT-001 40
Figure 3.20 Isle of Little Cumbrae - Deltamethrin Spring discharge

Dispersion modelling Firth of Clyde (Delft-3D) – Deposition modelling in the Firth of Clyde Assignment Number: L300558-S01 Document Number: L-300558-S01-REPT-001 41
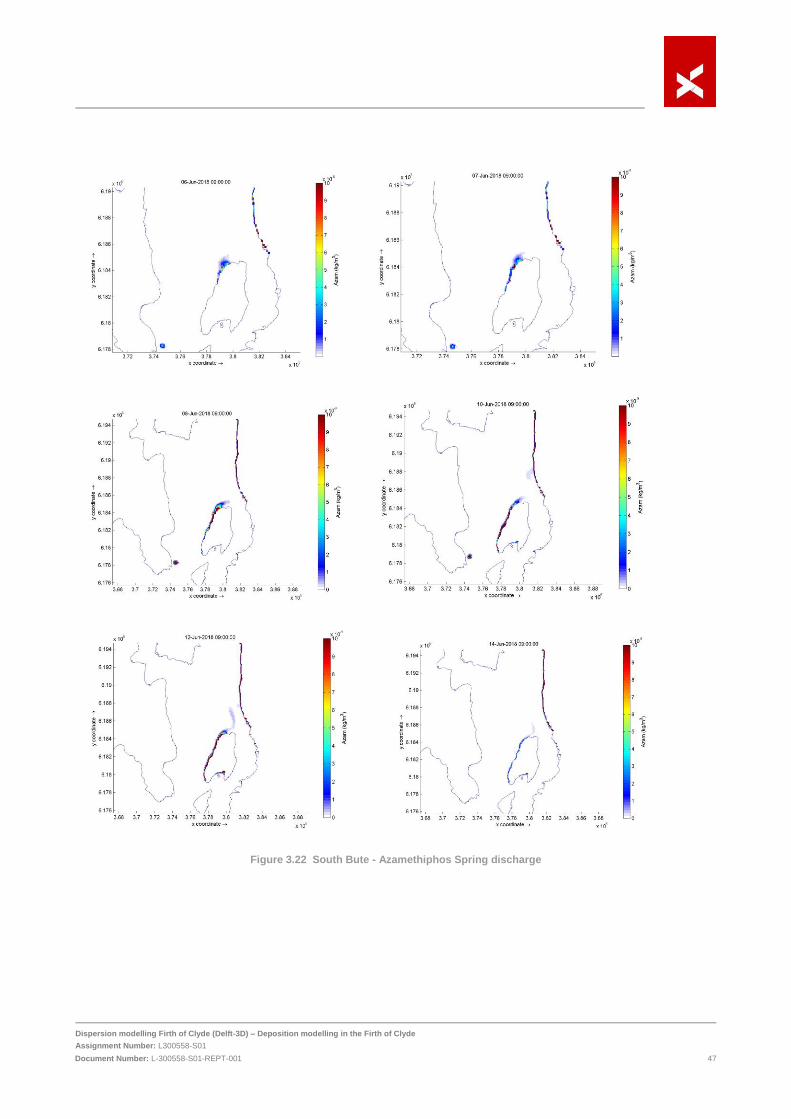
3.3.6 South Bute - Azamethiphos

Dispersion modelling Firth of Clyde (Delft-3D) – Deposition modelling in the Firth of Clyde Assignment Number: L300558-S01 Document Number: L-300558-S01-REPT-001 42

Dispersion modelling Firth of Clyde (Delft-3D) – Deposition modelling in the Firth of Clyde Assignment Number: L300558-S01 Document Number: L-300558-S01-REPT-001 43

Dispersion modelling Firth of Clyde (Delft-3D) – Deposition modelling in the Firth of Clyde Assignment Number: L300558-S01 Document Number: L-300558-S01-REPT-001 44
Figure 3.21 South Bute - Azamethiphos Neap discharge

Dispersion modelling Firth of Clyde (Delft-3D) – Deposition modelling in the Firth of Clyde Assignment Number: L300558-S01 Document Number: L-300558-S01-REPT-001 45

Dispersion modelling Firth of Clyde (Delft-3D) – Deposition modelling in the Firth of Clyde Assignment Number: L300558-S01 Document Number: L-300558-S01-REPT-001 46
Dispersion modelling Firth of Clyde (Delft-3D) – Deposition modelling in the Firth of Clyde Assignment Number: L300558-S01 Document Number: L-300558-S01-REPT-001 47
Figure 3.22 South Bute - Azamethiphos Spring discharge

Dispersion modelling Firth of Clyde (Delft-3D) – Deposition modelling in the Firth of Clyde Assignment Number: L300558-S01 Document Number: L-300558-S01-REPT-001 48
3.3.7 South Bute – Cypermethrin
Dispersion modelling Firth of Clyde (Delft-3D) – Deposition modelling in the Firth of Clyde Assignment Number: L300558-S01 Document Number: L-300558-S01-REPT-001 49
Dispersion modelling Firth of Clyde (Delft-3D) – Deposition modelling in the Firth of Clyde Assignment Number: L300558-S01 Document Number: L-300558-S01-REPT-001 50
Figure 3.23 South Bute - Cypermethrin Neap discharge

Dispersion modelling Firth of Clyde (Delft-3D) – Deposition modelling in the Firth of Clyde Assignment Number: L300558-S01 Document Number: L-300558-S01-REPT-001 51

Dispersion modelling Firth of Clyde (Delft-3D) – Deposition modelling in the Firth of Clyde Assignment Number: L300558-S01 Document Number: L-300558-S01-REPT-001 52
Figure 3.24 South Bute - Cypermethrin Spring discharge

Dispersion modelling Firth of Clyde (Delft-3D) – Deposition modelling in the Firth of Clyde Assignment Number: L300558-S01 Document Number: L-300558-S01-REPT-001 53
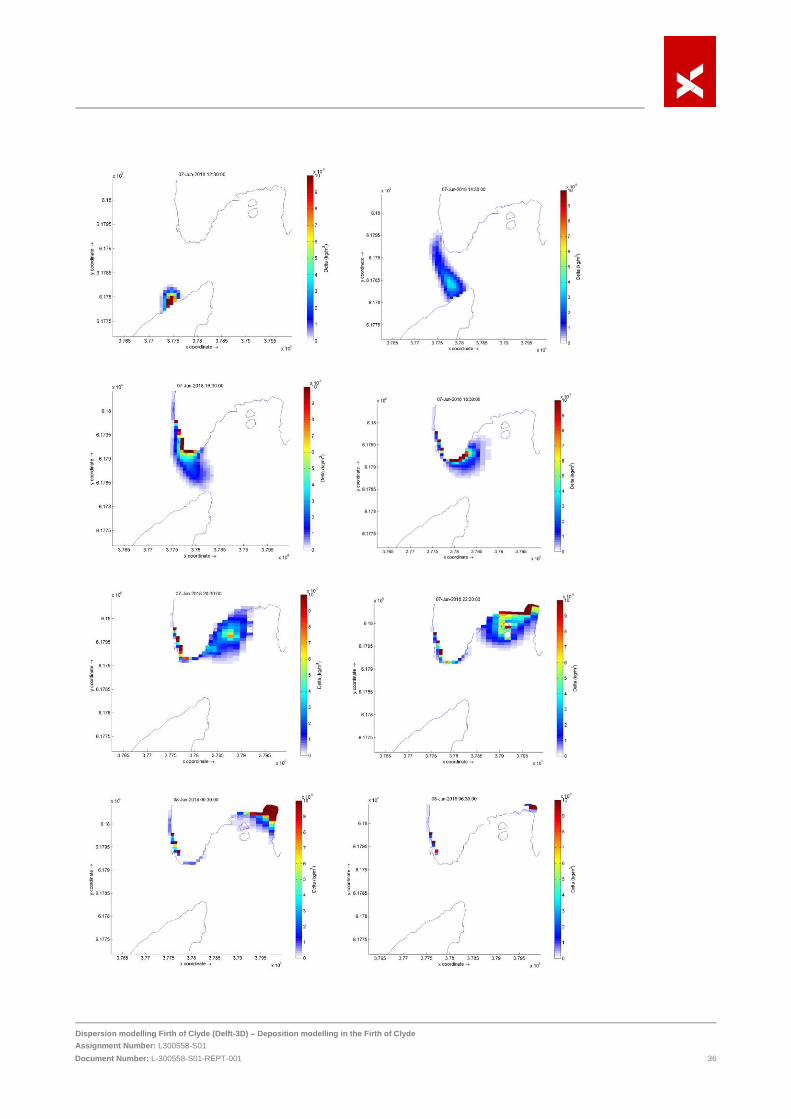
3.3.8 South Bute – Deltamethrin
Dispersion modelling Firth of Clyde (Delft-3D) – Deposition modelling in the Firth of Clyde Assignment Number: L300558-S01 Document Number: L-300558-S01-REPT-001 54
Figure 3.25 South Bute - Deltamethrin Neap discharge

Dispersion modelling Firth of Clyde (Delft-3D) – Deposition modelling in the Firth of Clyde Assignment Number: L300558-S01 Document Number: L-300558-S01-REPT-001 55
Dispersion modelling Firth of Clyde (Delft-3D) – Deposition modelling in the Firth of Clyde Assignment Number: L300558-S01 Document Number: L-300558-S01-REPT-001 56
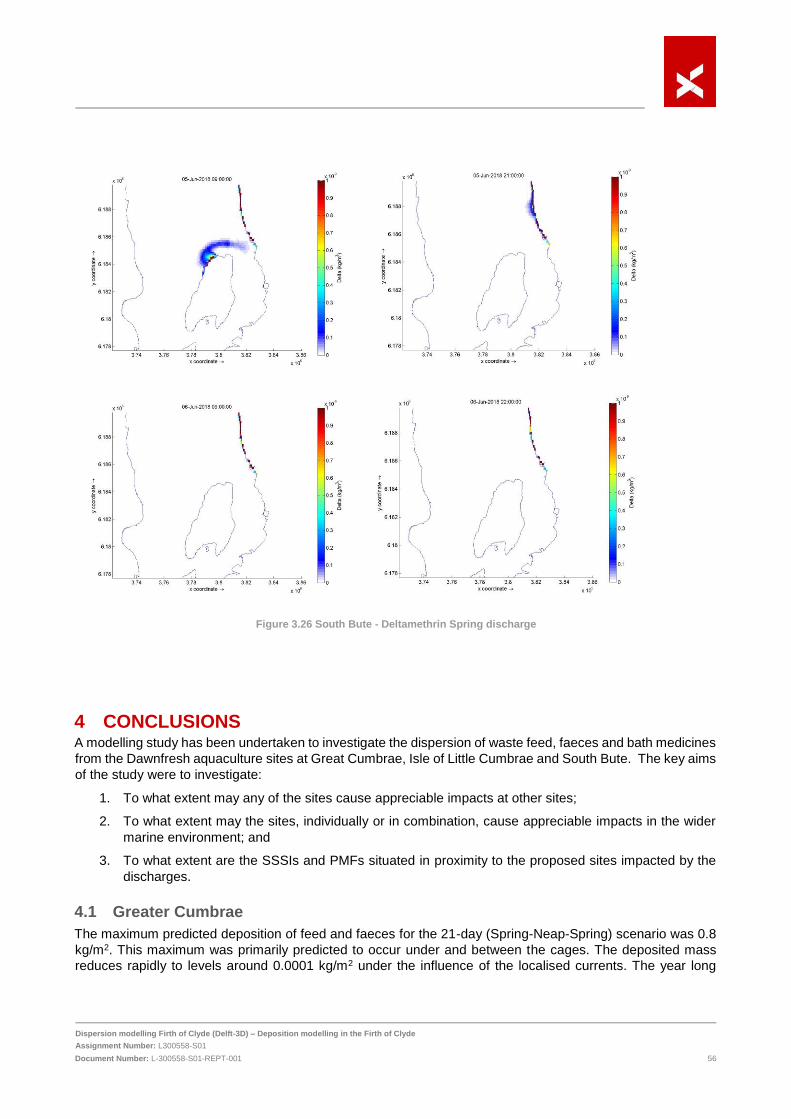
Figure 3.26 South Bute - Deltamethrin Spring discharge
4 CONCLUSIONS A modelling study has been undertaken to investigate the dispersion of waste feed, faeces and bath medicines
from the Dawnfresh aquaculture sites at Great Cumbrae, Isle of Little Cumbrae and South Bute. The key aims
of the study were to investigate:
1. To what extent may any of the sites cause appreciable impacts at other sites;
2. To what extent may the sites, individually or in combination, cause appreciable impacts in the wider
marine environment; and
3. To what extent are the SSSIs and PMFs situated in proximity to the proposed sites impacted by the
discharges.
4.1 Greater Cumbrae
The maximum predicted deposition of feed and faeces for the 21-day (Spring-Neap-Spring) scenario was 0.8
kg/m2. This maximum was primarily predicted to occur under and between the cages. The deposited mass
reduces rapidly to levels around 0.0001 kg/m2 under the influence of the localised currents. The year long

Dispersion modelling Firth of Clyde (Delft-3D) – Deposition modelling in the Firth of Clyde Assignment Number: L300558-S01 Document Number: L-300558-S01-REPT-001 57
model scenario shows a similar deposition pattern, with an increase in the predicted maximum deposition mass
of approximately 25 kg/m2. As with the short scenario the maximum mass is predicted under, and in between,
the cages, with deposited mass decreasing rapidly away from the fish farm.
The chemical medicines are predicted to travel north west in a plume with a concentration of between
0.00000003 kg/m3 and 0.00000004 kg/m3. The chemicals are shown to accumulate on the coastline on and
around Largs. The discharge of azamethiphos are predicted in the vicinity of Priority Marine Feature (PMF):
Fan Mussel site in concentrations of around 0.00000002 kg/m3 during the spring tidal release. The predicted
relative highs in concentration on the coastline are primarily due to particle accumulation, with particles not
being decayed or biodegraded.
It is not predicted that the discharges from the Greater Cumbrae will interact with those from the other sites or
result in depositions at those sites.
4.2 Isle of Little Cumbrae
The maximum predicted deposition of feed and faeces for the 21-day (Spring-Neap-Spring) scenario was
approximately 0.8 kg/m2. This maximum was primarily predicted to occur under the cages, with slightly lower
masses between the cages. The deposited mass reduces rapidly to levels around 0.0001 kg/m2. The lower
mass contours are elongated in the direction of the dominant current in the area. The year-long model shows
a similar deposition pattern, with an increased in the predicted maximum deposition mass of approximately 25
kg/m2. As with the short scenario the maximum mass is predicted under, and between, the cages, with
deposited mass decreasing rapidly away from the fish farm.
The chemical medicines are predicted to travel north and north east west under the influence of the currents.
The chemicals are shown to accumulate on the south and southwestern coastline of Greater Cumbrae. All the
chemical discharges modelled resulted in plumes in the vicinity of Millport and Kames Bay, which is a Site of
Special Scientific Interest (SSSI) due to it being the only example of a shore dominated by sand on Great
Cumbrae. The sands at Kames Bay are constantly wet and even in summer never experience severe drying,
resulting in a high faunal population, including large numbers of the lugworm Arenicola marina and the bivalve
Tellina tenuis (SNH,2000). Therefore, there is a potential for chemicals to impact the fauna within this area.
However, chemical concentrations from both sources are predicted to be very low at this location (maximums
of approximately 0.000000001 kg/m3), and therefore jointly only has the potential to produce a similarly low
total concentration (a potential total maximum concentration of approximately 0.000000002 kg/m3). Due to
these very low concentrations it was not considered necessary to conduct in-combination model runs. It should
also be remembered that the predicted relative highs in concentrations on the coastline are primarily due to
particle accumulation, with particles not being decayed or biodegraded.
The modelling indicates that there is the potential for the bath medicines to interact with treatments form South
Bute along the western coast of Great Cumbrae, if treatments conducted simultaneously. It is not predicted
that the discharges from the Isle of Little Cumbrae will interact with those from Greater Cumbrae.
It is also not predicted that the discharges from the Isle of Little Cumbrae site will result in depositions at either
the Greater Cumbrae or South Bute sites.
4.3 South Bute
The maximum predicted deposition of feed and faeces for the 21-day (Spring-Neap-Spring) scenario was
approximately 0.8 kg/m2. This maximum was primarily predicted to occur under the cages, with dispersion
towards the coast and in the direction of the primary tides. The deposited mass reduces rapidly to levels around
0.0001 kg/m2. The year-long model shows a similar deposition pattern, with an increased in the predicted
maximum deposition mass of approximately 18 kg/m2. As with the short scenario the maximum mass is
predicted under the fish cages with deposited mass decreasing rapidly away from the fish farm. The mean
mass under the cages is approximately 0.35 kg/m2.

Dispersion modelling Firth of Clyde (Delft-3D) – Deposition modelling in the Firth of Clyde Assignment Number: L300558-S01 Document Number: L-300558-S01-REPT-001 58
All the chemical discharges modelled resulted in low concentration plumes in the vicinity of the Largs Coast
Section SSI. This site was designated for its natural geological features: stratigraphy: Non-marine Devonian.
The site comprises of a stretch of intertidal rock exposure, it is considered important for the understanding of
the structure of braided-stream deposits. Therefore, the designation is unlikely to be impacted by the presence
of the bath chemicals. The predicted highs in concentration on the coastline are primarily due to particle
accumulation, with particles not being resuspended or biodegraded.
The modelling indicates that there is the potential for chemical interactions along the western coast of Great
Cumbrae with discharges from the Isle of Cumbrae fish farm site. As discussed in Section 4.2 the maximum
resulting concentration could be up to 0.000000002 kg/m3. It is not predicted that the discharges from the Isle
of South Bute site will result in depositions at either the Greater Cumbrae or Isle of Little Cumbrae sites.
The predicted relative highs in concentrations on the coastline are primarily due to particle accumulation, with
particles not being decayed or biodegraded.
5 REFERENCES
https://www.windfinder.com/windstatistics/glasgow accessed May 2020.
Xodus Group Limited, 2020. Dispersion Modelling Firth of Clyde (Delft3D). Model Calibrations and validation
report. 21st January 2020. Document reference: L-300558-SO1-TECH-001.
Scottish Natural Heritage (SNH), 2000. SSSI Management Statement: Kames Bay SSSI. Document
Reference Number: 825 (15/02/2000).