disparities in regular health care utilisation in europe a life-time analysis sharelife meeting –...
TRANSCRIPT

Disparities in Regular Disparities in Regular Health Care UtilisationHealth Care Utilisation
in Europein Europe
A Life-time AnalysisA Life-time Analysis
SHARELIFE Meeting – Svendborg, (DK) July 20th, 2010
Nicolas Sirven*, Zeynep Or
Institute for Research and Information on Health EconomicsParis, France

1. What do we know?
Regular Health Care utilisation is a public policy matter (prevention, early detection, care) contribute to improved health statusDespite common social security systems in Europe,
disparities in care utilisation across countries are significant
2. What is less well known?
What are dynamics of these disparities?
- How the utilisation of the health care system evolved across generations?
- What contributes more to changing habits? Econ. developt. or health system?
What are the determinants of cross-country differences?
- Few cross-country analysis
- No analysis of individuals’ long term care habits
3. Our contribution
Life-time analysis of individual + system characteristics on people’s behaviour
Comparison of 3 cohorts and 13 European countries over the last 35 years
Introduction
Disparities in Regular Health Care Utilisation in Europe: A Life-time Analysis – Nicolas Sirven & Zeynep Or (2010)

1. SHARE data
Individuals 50+ in 15 European countries (on health, social, economic)
Panel = 2 repeated cross-sections (2004, 2006) + retrospective (2008) Sharelife
2. Selected samplew3 + w1|w2 = 13 countries
Born between ]1925-1955] 3 cohorts: 1925-35 ; 1935-45 ; 1945-1955
“Good understanding of Sharelife questions” = drop 0.6% of the sample
Full rank = 22,814 obs. (12,440 for women only)
3. Dependant variables“Did you ever had regular checks…”
Blood tests, blood pressure, gynaecological, mammogram, vision
Binary: 1 Yes (has started regular checks), 0 No (didn’t star so far)
Data
Disparities in Regular Health Care Utilisation in Europe: A Life-time Analysis – Nicolas Sirven & Zeynep Or (2010)

0%
20%
40%
60%
80%
100%
50 55 60 65 70 75 80+
Age class in 2008-09
Blood Tests
0%
20%
40%
60%
80%
100%
50 55 60 65 70 75 80+
Age class in 2008-09
Blood Pressure Tests
0%
20%
40%
60%
80%
100%
50 55 60 65 70 75 80+
Age class in 2008-09
Vision Tests
0%
20%
40%
60%
80%
100%
50 55 60 65 70 75 80+
Age class in 2008-09
Gynaecological Visits
0%
20%
40%
60%
80%
100%
50 55 60 65 70 75 80+
Age class in 2008-09
Mammograms
Source: SHARELIFE (2008-2009). Calibrated individual weights used.
Frequencies by Euro-Regions and Age Class
Fig. 1: Population Having Regular Health Check-Ups
European Regions: North East Conti. South
Regular Health Care at a Glance
Disparities in Regular Health Care Utilisation in Europe: A Life-time Analysis – Nicolas Sirven & Zeynep Or (2010)
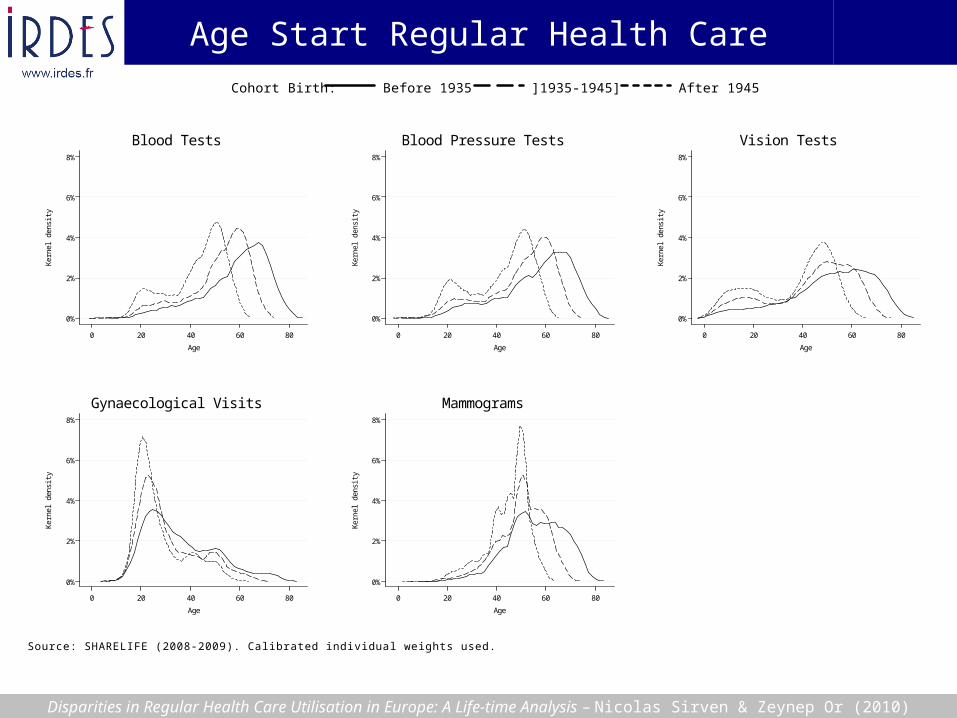
0%
2%
4%
6%
8%
Ker
nel d
ensi
ty
0 20 40 60 80
Age
Blood Tests
0%
2%
4%
6%
8%
Ker
nel d
ensi
ty
0 20 40 60 80
Age
Blood Pressure Tests
0%
2%
4%
6%
8%
Ker
nel d
ensi
ty
0 20 40 60 80
Age
Vision Tests
0%
2%
4%
6%
8%
Ker
nel d
ensi
ty
0 20 40 60 80
Age
Gynaecological Visits
0%
2%
4%
6%
8%
Ker
nel d
ensi
ty
0 20 40 60 80
Age
Mammograms
Source: SHARELIFE (2008-2009). Calibrated individual weights used.
Fig. 3: Age Start Regular Health Check-Ups
Cohort Birth: Before 1935 ]1935-1945] After 1945
Age Start Regular Health Care
Disparities in Regular Health Care Utilisation in Europe: A Life-time Analysis – Nicolas Sirven & Zeynep Or (2010)

Disparities in Regular Health Care Utilisation in Europe: A Life-time Analysis – Nicolas Sirven & Zeynep Or (2010)
Analysing Cohort Effects in a Given Country
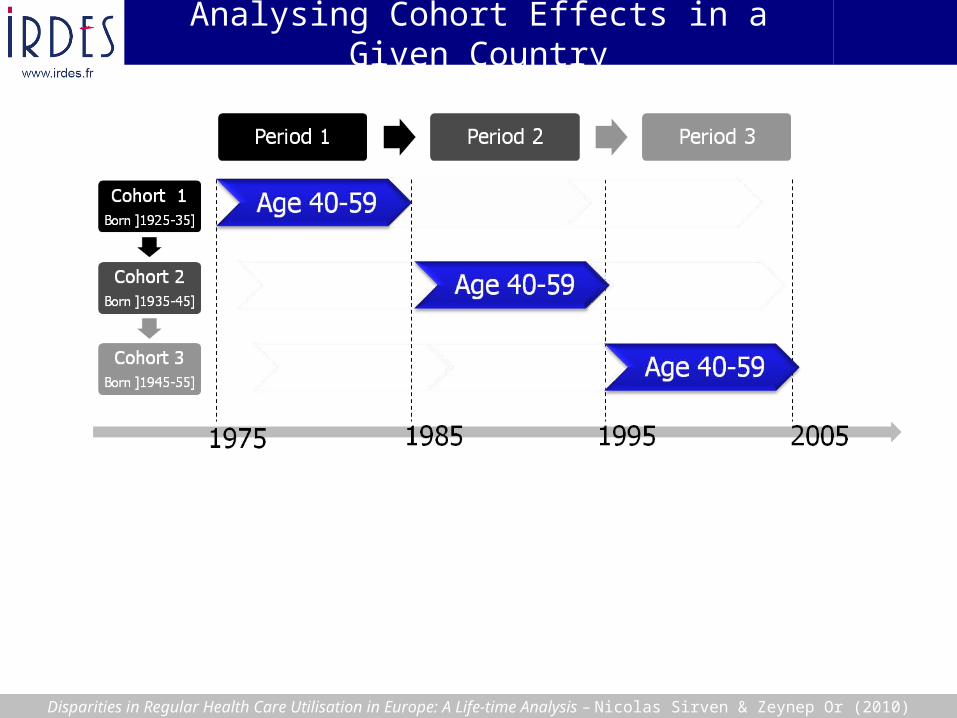
Disparities in Regular Health Care Utilisation in Europe: A Life-time Analysis – Nicolas Sirven & Zeynep Or (2010)
Analysing Cohort Effects in a Given Country
Disparities in Regular Health Care Utilisation in Europe: A Life-time Analysis – Nicolas Sirven & Zeynep Or (2010)
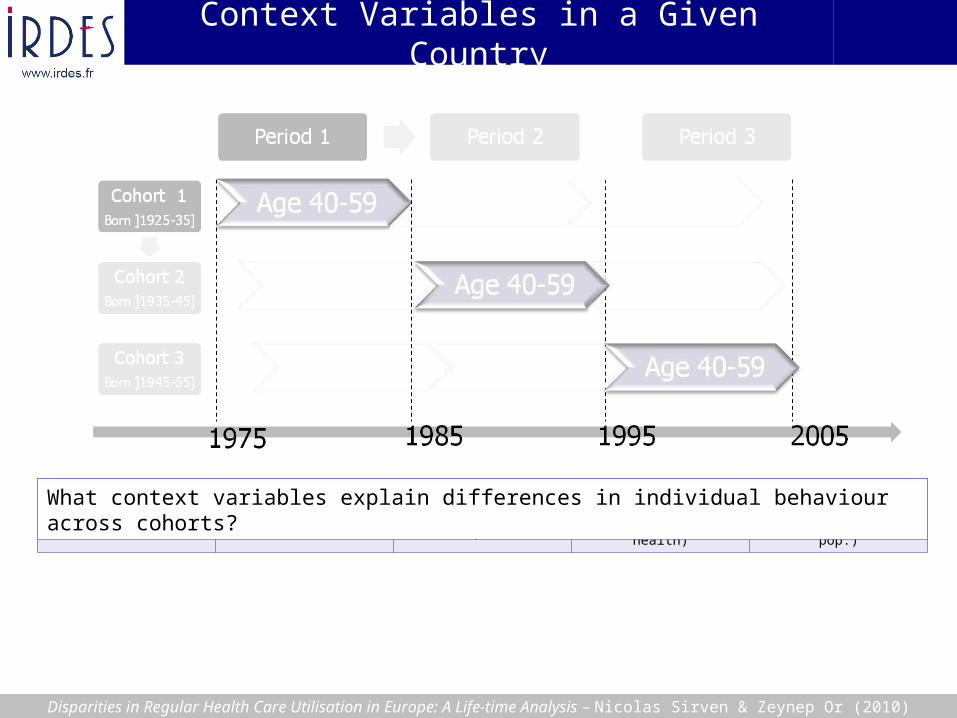
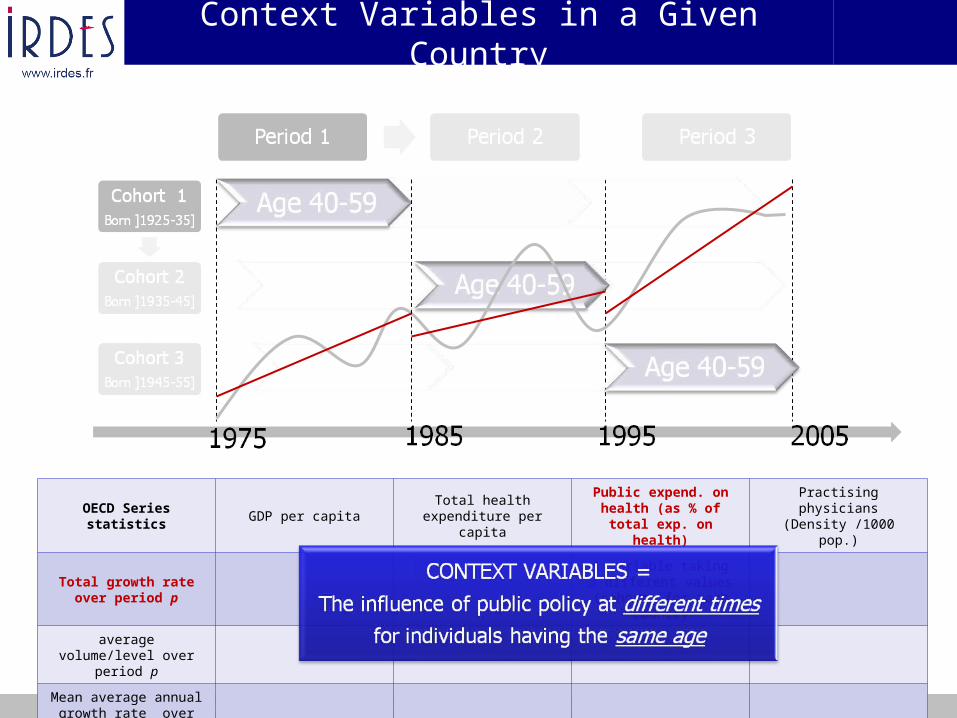
Context Variables in a Given Country
OECD Series statistics
GDP per capitaTotal health
expenditure per capita
Public expend. on health (as % of total
exp. on health)
Practising physicians(Density /1000 pop.)
What context variables explain differences in individual behaviour across cohorts?
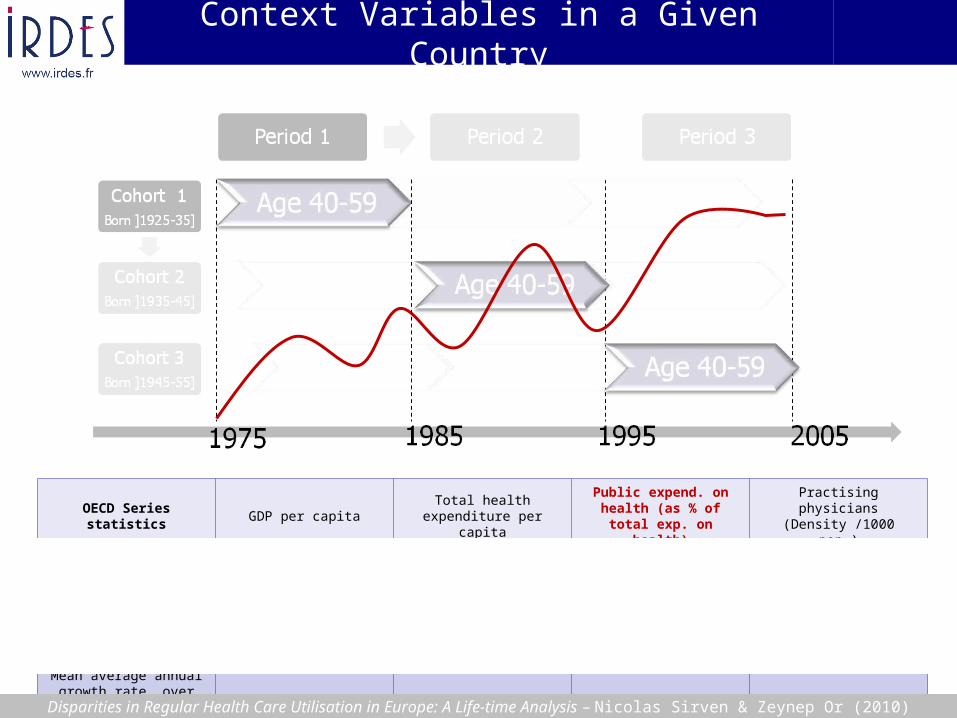
Context Variables in a Given Country
OECD Series statistics
GDP per capitaTotal health
expenditure per capita
Public expend. on health (as % of total
exp. on health)
Practising physicians(Density /1000 pop.)
Total growth rate over period p
average volume/level over period p
Mean average annual growth rate over
period p
Disparities in Regular Health Care Utilisation in Europe: A Life-time Analysis – Nicolas Sirven & Zeynep Or (2010)
Disparities in Regular Health Care Utilisation in Europe: A Life-time Analysis – Nicolas Sirven & Zeynep Or (2010)
Context Variables in a Given Country
OECD Series statistics
GDP per capitaTotal health
expenditure per capita
Public expend. on health (as % of total
exp. on health)
Practising physicians(Density /1000 pop.)
Total growth rate over period p
1 variable taking3 different values (cohort) for each
country
average volume/level over period p
Mean average annual growth rate over
period p
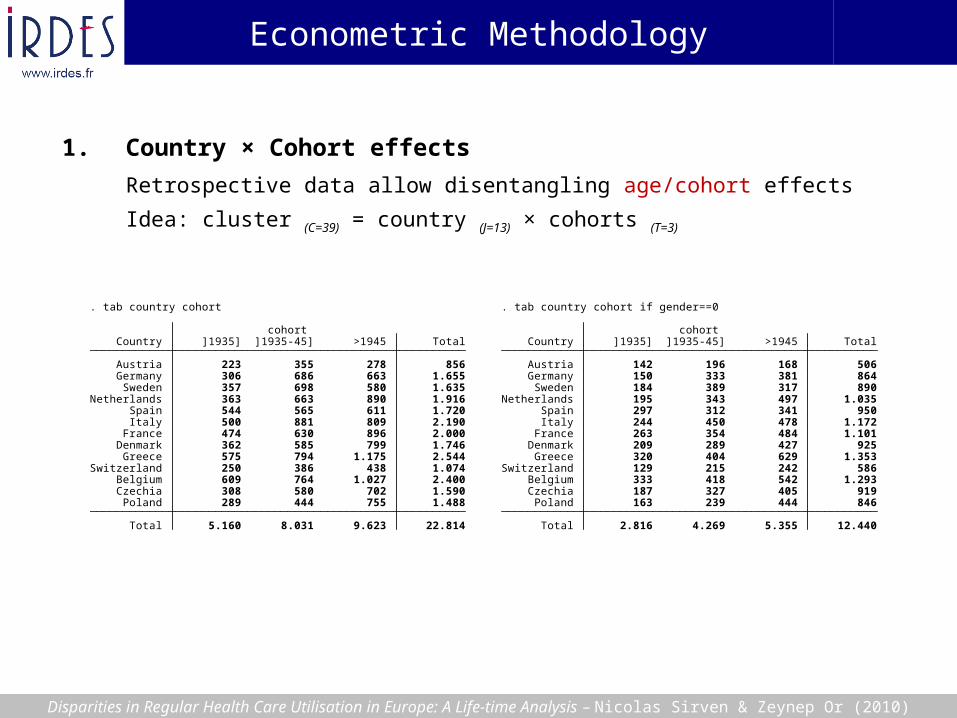
Total 5.160 8.031 9.623 22.814 Poland 289 444 755 1.488 Czechia 308 580 702 1.590 Belgium 609 764 1.027 2.400 Switzerland 250 386 438 1.074 Greece 575 794 1.175 2.544 Denmark 362 585 799 1.746 France 474 630 896 2.000 Italy 500 881 809 2.190 Spain 544 565 611 1.720 Netherlands 363 663 890 1.916 Sweden 357 698 580 1.635 Germany 306 686 663 1.655 Austria 223 355 278 856 Country ]1935] ]1935-45] >1945 Total cohort
. tab country cohort
Econometric Methodology
Disparities in Regular Health Care Utilisation in Europe: A Life-time Analysis – Nicolas Sirven & Zeynep Or (2010)
1. Country × Cohort effects
Retrospective data allow disentangling age/cohort effects
Idea: cluster (C=39) = country (J=13) × cohorts (T=3)
Total 2.816 4.269 5.355 12.440 Poland 163 239 444 846 Czechia 187 327 405 919 Belgium 333 418 542 1.293 Switzerland 129 215 242 586 Greece 320 404 629 1.353 Denmark 209 289 427 925 France 263 354 484 1.101 Italy 244 450 478 1.172 Spain 297 312 341 950 Netherlands 195 343 497 1.035 Sweden 184 389 317 890 Germany 150 333 381 864 Austria 142 196 168 506 Country ]1935] ]1935-45] >1945 Total cohort
. tab country cohort if gender==0

Y*ic = 0c + Xic + eic with
Hyp. 1: 0c = 0 + 0c
Hyp. 2: 0c = 0 + 01 Zc + 0c
Econometric Methodology
Disparities in Regular Health Care Utilisation in Europe: A Life-time Analysis – Nicolas Sirven & Zeynep Or (2010)
1. Country × Cohort effects
Retrospective data allow disentangling age/cohort effects
Idea: cluster (C=39) = country (J=13) × cohorts (T=3)
2. Multilevel Model (parsimonious)
3. Two-Step Multilevel- Gives same results (Coeffs. & S.E.) when comparing with HLM
- Allows more interesting Level 2 specification
4. Variables Set
- Age, gender, education, income, Employment status, ADL, Chronic illnesses (Cancer)
- Initial conditions (Index of comfort, SRH child, Relative School Performance)
+ Context variables (Zc)

Step 1: Individual level regressions 1/2
Disparities in Regular Health Care Utilisation in Europe: A Life-time Analysis – Nicolas Sirven & Zeynep Or (2010)

2/2
Disparities in Regular Health Care Utilisation in Europe: A Life-time Analysis – Nicolas Sirven & Zeynep Or (2010)
Step 1: Individual level regressions

-1-.
50
.51
1.5
coe
ffs.
of
clu
ste
rs f
rom
Lo
git
1 2 3 4 5
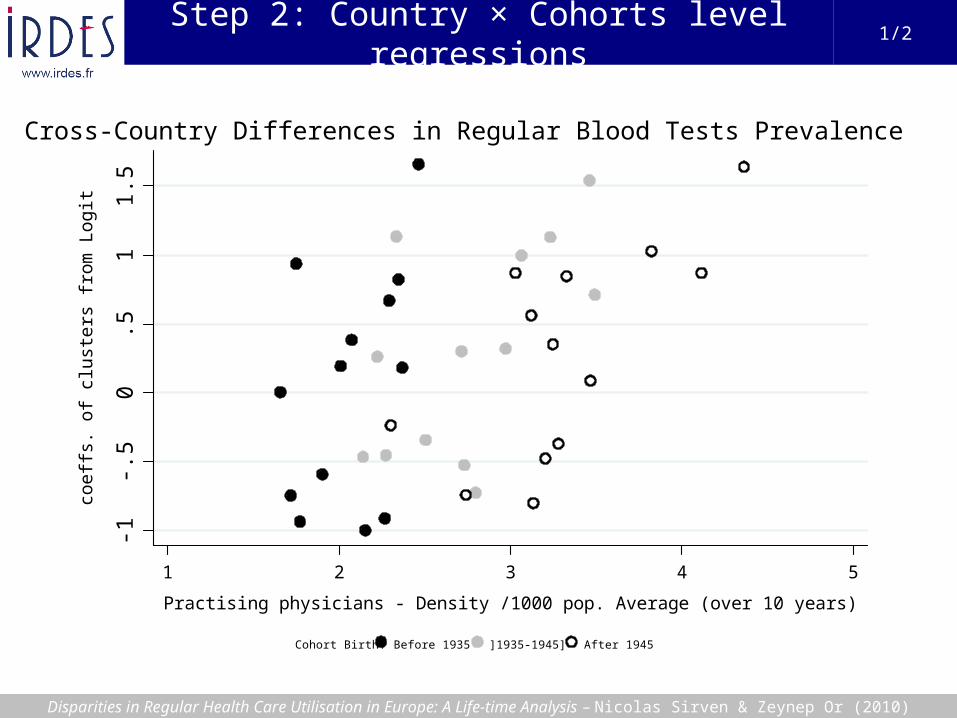
Practising physicians - Density /1000 pop. Average (over 10 years)
Cohort Birth: Before 1935 ]1935-1945] After 1945 Pooled
Cross-Country Differences in Regular Blood Tests Prevalence
Step 2: Country × Cohorts level regressions
1/2
Disparities in Regular Health Care Utilisation in Europe: A Life-time Analysis – Nicolas Sirven & Zeynep Or (2010)
-1-.
50
.51
1.5
coe
ffs.
of
clu
ste
rs f
rom
Lo
git
1 2 3 4 5
Practising physicians - Density /1000 pop. Average (over 10 years)
Cohort Birth: Before 1935 ]1935-1945] After 1945
Cross-Country Differences in Regular Blood Tests Prevalence
Step 2: Country × Cohorts level regressions
1/2
Disparities in Regular Health Care Utilisation in Europe: A Life-time Analysis – Nicolas Sirven & Zeynep Or (2010)

-1-.
50
.51
1.5
coe
ffs.
of
clu
ste
rs f
rom
Lo
git
1 2 3 4 5
Practising physicians - Density /1000 pop. Average (over 10 years)
Cohort Birth: Before 1935 ]1935-1945] After 1945 Pooled
Cross-Country Differences in Regular Blood Tests Prevalence
Step 2: Country × Cohorts level regressions
1/2
Disparities in Regular Health Care Utilisation in Europe: A Life-time Analysis – Nicolas Sirven & Zeynep Or (2010)

Step 2: Country × Cohorts level regressions
2/2
Disparities in Regular Health Care Utilisation in Europe: A Life-time Analysis – Nicolas Sirven & Zeynep Or (2010)
Purge the effect of health policies from economic conditions
Volume effect (no price effects)
1. SummaryAt the individual Level: Health! & Healthy Worker Effect
Education & economic conditions
… but still significant differences between countries & cohorts
Cohort effect: General shift towards more preventive care across generati
Cross-country: Investment in health care matters
- (Time invariant unobserved heterogeneity)
- People in times & places with higher spending in health have more chances to have regular care (Economic growth per se
matters less)
2. Further Work…
Duration analysis of “Age start regular health care”...
Any suggestions? Thank you!
Discussion
Disparities in Regular Health Care Utilisation in Europe: A Life-time Analysis – Nicolas Sirven & Zeynep Or (2010)