disentangling cardiovascular control mechanisms via multivariate modeling techniques: the...
TRANSCRIPT

Disentangling cardiovascular control mechanisms via multivariate modeling techniques:
the “spontaneous” baroreflex
Alberto Porta
Department of Biomedical Sciences for Health Galeazzi Orthopedic Institute
University of MilanMilan, Italy

Focus
Baroreflex is one of the most important regulatory mechanisms and the evaluation of its sensitivity is physiologically and clinically relevant

Baroreflex sensitivity was found helpful in identifying subjects at risk for life-threatening arrhythmias
M.T. La Rovere, Circulation, 103:2072-2077, 2001
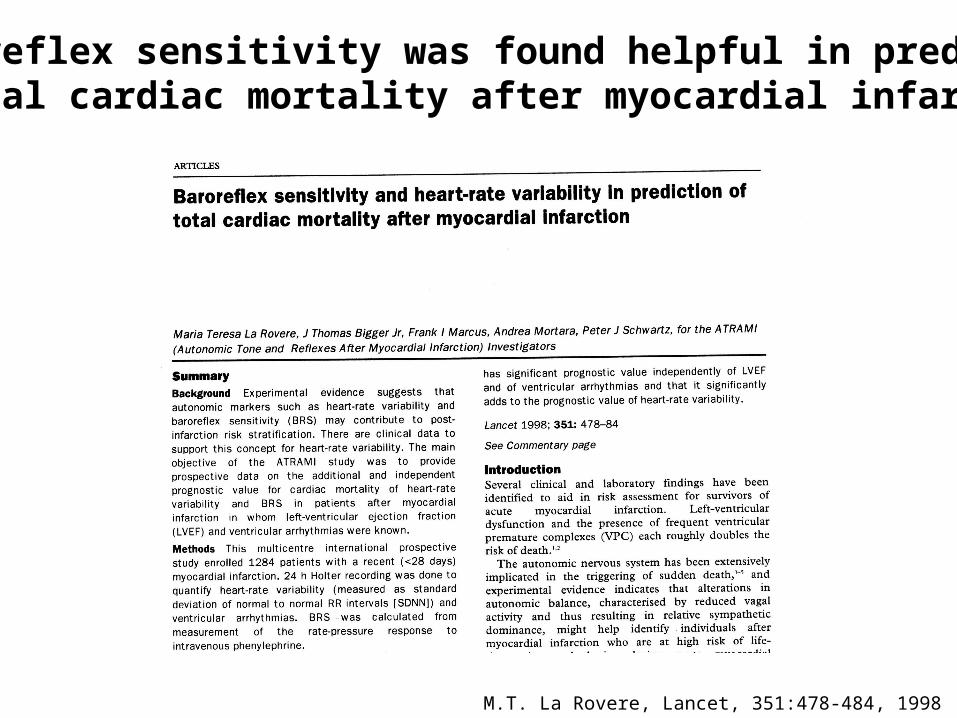
M.T. La Rovere, Lancet, 351:478-484, 1998
Baroreflex sensitivity was found helpful in predicting total cardiac mortality after myocardial infarction

Introduction
The classical assessment of baroreflex sensitivity is based on the administration of a vasoactive drug and on the observation of theevoked heart period changes
Several non invasive methods based on the exploitation of the spontaneous arterial pressure and heart period variabilities have been proposed
Unfortunately, these methods assessing the “spontaneous” baroreflex provide indexes that may be weakly correlated each other and evenin disagreement with the baroreflex sensitivity derived from the “invasive” procedure

Aims
To propose a multivariate approach for the assessment of“spontaneous” baroreflex
To interpret the disagreement among baroreflex sensitivity estimates based on differences among the models underlying each technique

Outline
1) Modeling the baroreflex
2) Method for invasive estimation of the baroreflex sensitivity and its implicit underlying model
3) Traditional methods for the non invasive estimation of the baroreflex sensitivity and their implicit underlying models
4) Model-based methods for the non invasive estimation of the baroreflex sensitivity
5) Comparing invasive and non invasive baroreflex sensitivity estimates (between-class comparison)
6) Comparing non invasive baroreflex sensitivity estimates (within-class comparison)
7) Interpreting the disagreement between baroreflex sensitivity estimates

Operative definition of baroreflex
Baroreflex is a cardiovascular closed loop control mechanism that adjusts heart period (HP) to compensate for arterial pressure (AP) changes
HP-AP interactions HP-SAP interactions

Beat-to-beat SAP and RR measures
SAP(i) RR(i) but not viceversa

Towards a definition of a RR-SAP bivariate model
SAP(i) RR(i)
baroreflex feedback
SAP(i+1)
SAP(i+1) RR(i) DAP(i)
Windkessel effect
Starling effect
mechanical feedforward
RR SAPbaroreflex feedback
mechanical feedforward

RR(i) = f(RRm,SAPn) + uRR(i)
SAP(i) = g(SAPp,RRq) + uSAP(i)
baroreflex feedback
mechanical feedforward
Towards a definition of a RR-SAP bivariate model
with
RRm = |RR(i-1) ... RR(i-m)| 1xmSAPn = |SAP(i-kRR-SAP) ... SAP(i-kRR-SAP-n+1)| 1xn
SAPp = |SAP(i-1) ... SAP(i-p)| 1xpRRq = |RR(i-kSAP-RR) ... SAP(i-kSAP-RR-q+1)| 1xq
and
f(.,.) and g(.,.) two functions (even non linear)uRR and uSAP two noises (even correlated) but additive and independent of RR and SAP series respectively

Bivariate linear model of RR-SAP interactions
When considering small changes around the mean
rr(i) = RR(i) - RR
sap(i) = SAP(i) - SAP
rr(i) = f(rrm,sapn) + urr(i)
sap(i) = g(sapp,rrq) + usap(i)
the bivariate model becomes linear
f(.,.) and g(.,.) linear combinations of past rr and sap values weighted by constant coefficients
with
baroreflex feedback
mechanical feedforward

Block diagram of the bivariate linear closed loop model of the baroreflex regulation
Hsap-rr(f), ksap-rr: transfer function and delay of the feedforward arm
Hrr-sap(f), krr-sap: transfer function and delay of the feedback arm
ksap-rrkrr-sap

Towards a better definition of the inputs to the closed loop model of the baroreflex regulation

Linear closed loop model of the baroreflex regulation and of the respiratory influences
rr(i) = f(rrm,sapn,rr) + urr(i)
sap(i) = g(sapp,rrq,rs) + usap(i)
the bivariate linear model can be modified to account for respiration
f(.,.) and g(.,.) linear combinations of past rr, sap and r values weighted by constant coefficients
with
When considering small changes of respiration R around the mean
r(i) = R(i) - R
Hypothesis: R exogenous input (i.e. R RR and R SAP but not viceversa)
baroreflex feedback
mechanical feedforward

Minimal linear model of the baroreflex regulation
Hsap-r(f), ksap-r: transfer function and delay from r to sap
Hrr-r(f), krr-r: transfer function and delay from r to rr

Outline
1) Modeling the baroreflex
2) Method for invasive estimation of the baroreflex sensitivity and its implicit underlying model
3) Traditional methods for the non invasive estimation of the baroreflex sensitivity and their implicit underlying models
4) Model-based methods for the non invasive estimation of the baroreflex sensitivity
5) Comparing invasive and non invasive baroreflex sensitivity estimates (between-class comparison)
6) Comparing non invasive baroreflex sensitivity estimates (within-class comparison)
7) Interpreting the disagreement between baroreflex sensitivity estimates

H.S. Smyth et al, Circulation Res, 24:109-121,1969
Invasive estimation of the baroreflex sensitivity

Mathematical model underlying the invasive estimation of the baroreflex sensitivity
sap(i)
rise of sap
rr(i+krr-sap)
rise of rr, krr-sap
wrr(i+krr-sap)

Outline
1) Modeling the baroreflex
2) Method for invasive estimation of the baroreflex sensitivity and its implicit underlying model
3) Traditional methods for the non invasive estimation of the baroreflex sensitivity and their implicit underlying models
4) Model-based methods for the non invasive estimation of the baroreflex sensitivity
5) Comparing invasive and non invasive baroreflex sensitivity estimates (between-class comparison)
6) Comparing non invasive baroreflex sensitivity estimates (within-class comparison)
7) Interpreting the disagreement between baroreflex sensitivity estimates

Spontaneous RR and SAP beat-to-beat variabilities in a mild hypertensive patient at rest
RR series SAP series

Traditional methods for the evaluation of the baroreflex gain based on spontaneous RR and SAP variabilities
1) baroreflex sequence analysis
2) α index
3) transfer function analysis
G. Bertinieri et al, J Hypertens, 3:S79-S81, 1985
M. Pagani et al, Hypertension, 12:600-610, 1988
H.W.J. Robbe et al, Hypertension, 10:538-543, 1987

Baroreflex sequence analysis
A.P. Blaber et al, Am J Physiol 268, H1682-H1687, 1995
Baroreflex sequence analysis searches for RR-SAP sequences characterized by at least two contemporaneous increases (or decreases) of both RR and SAP
Baroreflex sequence

Representation of a baroreflex sequence in the (RR,SAP) plane
A.P. Blaber et al, Am J Physiol 268, H1682-H1687, 1995
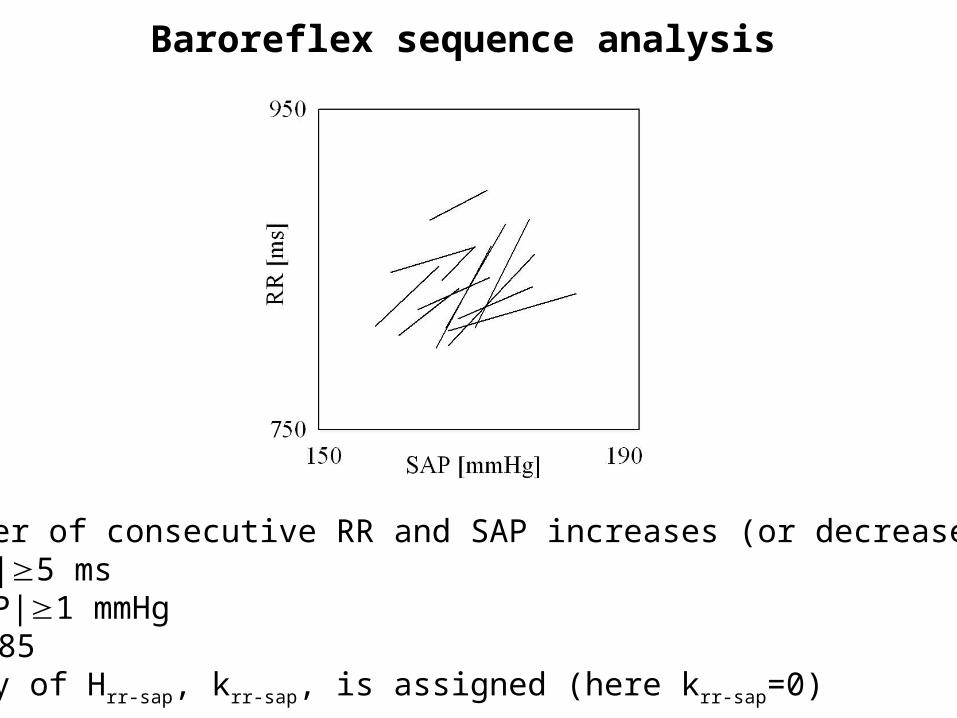
Baroreflex sequence analysis
number of consecutive RR and SAP increases (or decreases) = 3|RR|5 ms|SAP|1 mmHgr0.85delay of Hrr-sap, krr-sap, is assigned (here krr-sap=0)

Mathematical model underlying baroreflex sequence analysis
Baroreflex sequence method, by subdividing sequences in baroreflex and non baroreflex, actually imposes a causal, closed loop, model
However, since the blocks Hrr-sap and Hsap-rr are without memory over past values, only simultaneous interactions are disentangled (fast actions)

index
PSD RR PSD SAP

sap rrHrr-sap
wrr= 0
Mathematical model underlying index estimation
Hypotheses
1) RR and SAP series interact in open loop 2) SAP and RR series are correlated 3) RR interval lags behind SAP 4) wrr=0 in LF and HF bands

Transfer function estimation based on cross-spectral analysis
or as the average of the gain over LF or HF bands
or from the impulse response of Hrr-sap(f)
is calculated as
H.W.J. Robbe et al, Hypertension, 10, 538-543, 1987
R.B. Panerai et al, Am J Physiol, 272, H1866-H1875, 1997
CS(LF) = |Hrr-sap(LF)| = |Crr-sap(LF)|
Ssap(LF)
CS(HF) = |Hrr-sap(HF)| = |Crr-sap(HF)|
Ssap(HF)

sap rrHrr-sap
wrr0
Mathematical model underlying transfer function estimation based on cross-spectral approach
Hypotheses
1) RR and SAP series interact in open loop 2) RR and SAP are correlated (tested with K2
rr,sap) 3) RR interval lags behind SAP (tested with Crr,sap phase) 4) wrr uncorrelated to sap

Limitations of the traditional non invasive estimates of the baroreflex sensitivity
1) Causality (i.e. RR interval lags behind SAP) is an hypothesis (not tested by the methods)
2) Rough or absent modeling of the closed loop relationship between RR and SAP series
3) Rough modeling of inputs capable to drive RR interval variability independently of SAP (e.g. respiration)

Outline
1) Modeling the baroreflex
2) Method for invasive estimation of the baroreflex sensitivity and its implicit underlying model
3) Traditional methods for the non invasive estimation of the baroreflex sensitivity and their implicit underlying models
4) Model-based methods for the non invasive estimation of the baroreflex sensitivity
5) Comparing invasive and non invasive baroreflex sensitivity estimates (between-class comparison)
6) Comparing non invasive baroreflex sensitivity estimates (within-class comparison)
7) Interpreting the disagreement between baroreflex sensitivity estimates

1) Open loop bivariate causal models
2) Open loop bivariate causal models accounting for respiration
3) Closed loop bivariate causal models
4) Closed loop bivariate causal models accounting for respiration G. Baselli et al, IEEE Trans Biomed Eng, 35, 1033-1046, 1988 G. Baselli et al, Med Biomed Eng Comput, 32, 143-152, 1994
Model-based methods for the evaluation of the baroreflex gain from spontaneous RR and SAP variabilities
R. Barbieri et al, Ann Noninv Electrocard, 3, 264-77, 1996R. Barbieri et al, IEEE Eng Med Biol Mag, 20, 33-42, 2001
A. Porta et al, Am J Physiol, 279, H2558-H2567, 2000G. Nollo et al, Am J Physiol, 280, H1830-1839, 2001
D.J. Patton et al, Am J Physiol, 39, H1240-H1249, 1996A. Porta et al, Am J Physiol, 279, H2558-H2567, 2000

Exogenous (X) model with autoregressive (AR) noise
Double exogenous (XX) model with autoregressive (AR) noise
Two examples of causal open loop models
A. Porta et al, Am J Physiol, 279: H2558-H2567, 2000
XAR model XXAR model
A. Porta et al, Am J Physiol, 279: H2558-H2567, 2000

Bivariate autoregressive (AR2) model
Two examples of causal closed loop modelsBivariate autoregressive (AR2) model with exogenous (X) inputand autoregressive (AR) noises
A. Porta et al, Biol Cybern, 86, 241-251, 2002
G. Baselli et al, IEEE Trans Biomed Eng, 35, 1033-46, 1988
AR2 model XAR2AR model

Estimation of the baroreflex sensitivity from causal models
baroreflex feedback

Baroreflex sensitivity indexes derived from a mild hypertensive patient at rest
XAR=2.5 ms/mmHg
XXAR=1.9 ms/mmHg
AR2=2.3 ms/mmHg
XAR2AR=1.3 ms/mmHg
SEQ=5.4 ms/mmHg
PS(LF)=8.7 ms/mmHg PS(HF)=3.1 ms/mmHg
CS(LF)=7.8 ms/mmHg CS(HF)=2.5 ms/mmHg
=3 ms/mmHg
Model-based “spontaneous” baroreflex sensitivity
Traditional “spontaneous” baroreflex sensitivity
Invasive baroreflex sensitivity

Outline
1) Modeling the baroreflex
2) Method for invasive estimation of the baroreflex sensitivity and its implicit underlying model
3) Traditional methods for the non invasive estimation of the baroreflex sensitivity and their implicit underlying models
4) Model-based methods for the non invasive estimation of the baroreflex sensitivity
5) Comparing invasive and non invasive baroreflex sensitivity estimates (between-class comparison)
6) Comparing non invasive baroreflex sensitivity estimates (within-class comparison)
7) Interpreting the disagreement between baroreflex sensitivity estimates

Linear regression analysis between the baroreflex gains estimated by invasive () and by non invasive
methods (SEQ and CS(LF)) in normotensive subjects
and borderline hypertensive patients
Modified from L.L. Watkins et al, Hypertension 28, 238-243, 1996

Baroreflex gains estimated by invasive () and by noninvasive methods (SEQ and CS(LF)) in normotensive
subjects and borderline hypertensive patients
Values are expressed as meanstandard deviation.
Modified from L.L. Watkins et al, Hypertension 28: 238-243, 1996
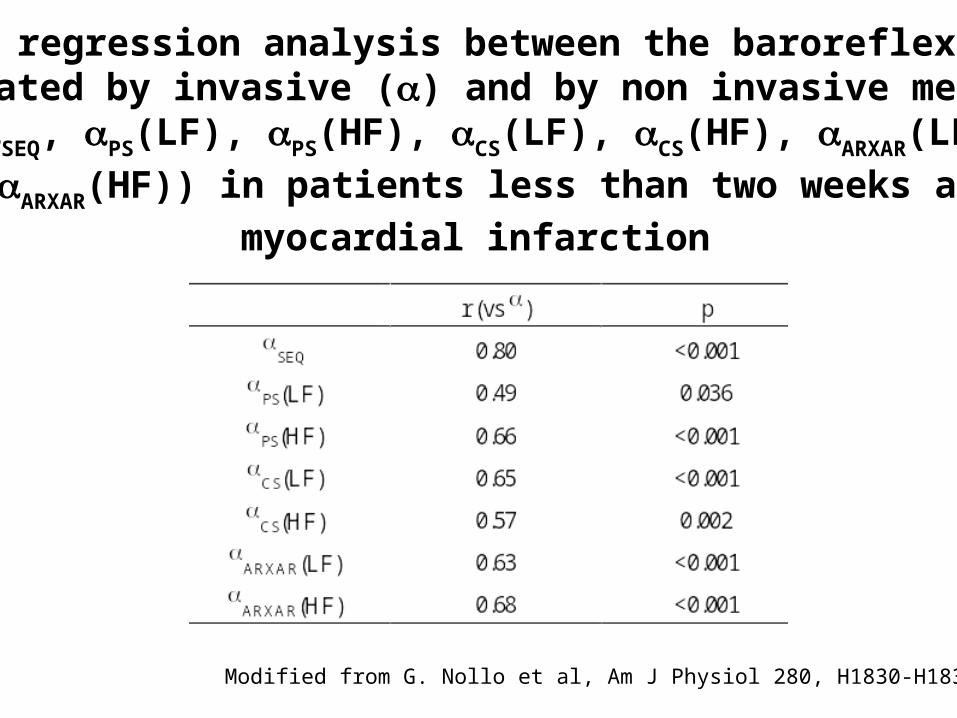
Linear regression analysis between the baroreflex gains estimated by invasive () and by non invasive methods (SEQ, PS(LF), PS(HF), CS(LF), CS(HF), ARXAR(LF)
and ARXAR(HF)) in patients less than two weeks after
myocardial infarction
Modified from G. Nollo et al, Am J Physiol 280, H1830-H1839, 2001

Baroreflex gains estimated by invasive () and by non invasive methods (SEQ, PS(LF), PS(HF), CS(LF),
CS(HF), ARXAR(LF) and ARXAR(HF)) in patients
less than two weeks after myocardial infarction
Values are expressed as meanstandard deviation.p<0.05 was considered significant
Modified from G. Nollo et al, Am J Physiol 280, H1830-H1839, 2001

Bland-Altman plots between and SEQ, PS, CS, CS(LF), IR in a population including 30% of individuals with
established coronary artery disease
R.D. Lipman et al, Hypertension, 42, 481-487, 2003
PS (from 0.05 to 0.3 Hz)SEQ
CS(LF) IR
CS (from 0.05 to 0.3 Hz)

Correlations between and SEQ, PS, CS, CS(LF), IR in individuals within the lowest tertile of
R.D. Lipman et al, Hypertension, 42, 481-487, 2003
SEQ
PS
CS
CS(LF)
IR
PS was assessed from 0.05 to 0.3 Hz
CS was assessed from 0.05 to 0.3 Hz

Comparing invasive and non invasive baroreflex sensitivity estimates (between-class comparison)
Bad news
1) Correlation between invasive and non invasive baroreflex sensitivity estimates depends on population
2) Correlation may be weak or even absent (especially when the baroreflex sensitivity is low)
3) A significant correlation may coexist with constant and/or proportional biases
Good news
1) Both invasive and non invasive indexes can detect the impairment of the baroreflex function

Outline
1) Modeling the baroreflex
2) Method for invasive estimation of the baroreflex sensitivity and its implicit underlying model
3) Traditional methods for the non invasive estimation of the baroreflex sensitivity and their implicit underlying models
4) Model-based methods for the non invasive estimation of the baroreflex sensitivity
5) Comparing invasive and non invasive baroreflex sensitivity estimates (between-class comparison)
6) Comparing non invasive baroreflex sensitivity estimates (within-class comparison)
7) Interpreting the disagreement between baroreflex sensitivity estimates

Baroreflex gains estimated by traditional non invasive methods (SEQ, PS(LF), PS(HF), CS(LF) and CS(HF))
and by a causal parametric model (XXAR)
in conscious dogs
Modified from A. Porta et al, Am J Physiol, 279, H2558-H2567, 2000

Correlation analysis between various non invasive methods in healthy subjects at rest
D. Laude et al, Am J Physiol, 286, R226-R231, 2004
PS(LF) PS(HF) SEQ
SEQ
XAR

Comparison between non invasive baroreflex sensitivity estimates during graded bicycle exercise
F. Vallais et al, Physiol Meas, 30, 201-213, 2009

REST
BRS BS FT(LF) FT(HF) AR(LF) AR(HF) CS(LF) CS(HF) XAR XXAR BS 0.29 0.73* 0.40 0.92* 0.40 0.82* 0.37 0.23 FT(LF) 0.70* 0.90* 0.45 0.96* 0.57* 0.88* 0.77* FT(HF) 0.76* 0.85* 0.74* 0.79* 0.60* 0.44 AR(LF) 0.54* 0.96* 0.62* 0.72* 0.60* AR(HF) 0.55 0.94* 0.45 0.28 CS(LF) 0.69* 0.81* 0.69* CS(HF) 0.56 0.41 XAR 0.96* XXAR
EXE BRS BS FT(LF) FT(HF) AR(LF) AR(HF) CS(LF) CS(HF) XAR XXAR BS 0.62* 0.72* 0.63* 0.84* 0.71* 0.81* 0.58* 0.64* FT(LF) 0.73* 0.57* 0.46* 0.83* 0.65* 0.61* 0.55* FT(HF) 0.40* 0.67* 0.69* 0.73* 0.46* 0.40* AR(LF) 0.51* 0.80* 0.61* 0.68* 0.71* AR(HF) 0.68* 0.77* 0.35* 0.32* CS(LF) 0.81* 0.84* 0.76* CS(HF) 0.75* 0.70* XAR 0.94* XXAR
REC BRS BS FT(LF) FT(HF) AR(LF) AR(HF) CS(LF) CS(HF) XAR XXAR BS 0.68* 0.87* 0.69* 0.85* 0.76* 0.84* 0.46 0.19 FT(LF) 0.77* 0.75* 0.77* 0.94* 0.74* 0.41 0.12 FT(HF) 0.80* 0.98* 0.74* 0.98* 0.41 -0.06 AR(LF) 0.77* 0.65* 0.87* 0.23 -0.27 AR(HF) 0.72* 0.97* 0.45 0.01 CS(LF) 0.69* 0.39 0.15 CS(HF) 0.39 -0.12 XAR 0.62* XXAR
The symbol * indicates a significant correlation with p<0.05.
Correlation between non invasive baroreflex sensitivity estimates during graded bicycle exercise
F. Vallais et al, Physiol Meas, 30, 201-213, 2009

Comparing non invasive baroreflex sensitivity estimates (within-class comparison)
Bad news
1) Non invasive methods provide different estimates of the baroreflex gain
2) Some of the non invasive estimates are not correlated with others
3) Correlation might depend on the experimental condition
Good news
1) All non invasive indexes can detect unloading or impairment of baroreflex

Outline
1) Modeling the baroreflex
2) Method for invasive estimation of the baroreflex sensitivity and its implicit underlying model
3) Traditional methods for the non invasive estimation of the baroreflex sensitivity and their implicit underlying models
4) Model-based methods for the non invasive estimation of the baroreflex sensitivity
5) Comparing invasive and non invasive baroreflex sensitivity estimates (between-class comparison)
6) Comparing non invasive baroreflex sensitivity estimates (within-class comparison)
7) Interpreting the disagreement between baroreflex sensitivity estimates

Toward a possible explanation of the differences betweeninvasive and non invasive baroreflex estimates
Physiology underlying spontaneous variability
Physiology underlying pharmacologically
forced RR interval response
Open loop along baroreflexClosed loop interactions perturbed by noises in LF and HF bands

Matching physiology with methods for baroreflex sensitivity estimation
Physiology underlying spontaneous variability
Physiology underlying pharmacologically
forced RR interval response
Open loop along baroreflexClosed loop interactions perturbed by noises in LF and HF bands
Model underlying the method for invasive estimate of
baroreflex sensitivity
Open loop along baroreflex
Model underlying the methods for non invasive estimate of
baroreflex sensitivity
Various models depending on the approach

Toward a possible explanation of the differences among non invasive baroreflex estimates
1) causality or directionality in the SAP-RR dynamical interactions
2) respiratory inputs perturbing SAP-RR interactions
3) regulatory inputs in the LF band independent of baroreflex
Indeed, non invasive methods differ in the ability of accounting for three factors
Differences among non invasive baroreflex estimates might be the effect of the different model underlying each technique

Causality (or directionality) in the SAP-RR dynamical interactions
K2rr,sap K2
sap rr K2rr sap
A. Porta et al, Biol Cybern, 86, 241-251, 2002
baroreflex feedback mechanical feedforward

Effects of respiration on SAP-RR interactions
G. Baselli et al, Med Biomed Eng Comput, 32, 143-152, 1994

Effects of regulatory inputs in the LF band independent of baroreflex
G. Baselli et al, Med Biomed Eng Comput, 32, 143-152, 1994

Conclusions
Poor matching of the non invasive techniques with physiology may be responsible for the disagreement between invasive and non invasive estimates
Different abilities of the non invasive techniques in taking into account causality (or directionality) in the SAP-RR interactions and inputs capable to change heart period independently of SAP both in LF and HF bands might be responsible for the disagreement among non invasive techniques
Among non invasive techniques those based on closed loop models should be better explored on large sets of data as they can guarantee a better matching with physiology