central artery stiffness, baroreflex sensitivity, and ... · accepted manuscript accepted...
TRANSCRIPT
�������� ����� ��
Central Artery Stiffness, Baroreflex Sensitivity, and Brain White MatterNeuronal Fiber Integrity in Older Adults
Takashi Tarumi, Daan L.K. de Jong, David C. Zhu, Benjamin Y. Tseng,Jie Liu, Candace Hill, Jonathan Riley, Kyle B. Womack, Diana R. Kerwin,Hanzhang Lu, C. Munro Cullum, Rong Zhang
PII: S1053-8119(15)00057-9DOI: doi: 10.1016/j.neuroimage.2015.01.041Reference: YNIMG 11948
To appear in: NeuroImage
Accepted date: 18 January 2015
Please cite this article as: Tarumi, Takashi, de Jong, Daan L.K., Zhu, David C., Tseng,Benjamin Y., Liu, Jie, Hill, Candace, Riley, Jonathan, Womack, Kyle B., Kerwin, DianaR., Lu, Hanzhang, Munro Cullum, C., Zhang, Rong, Central Artery Stiffness, BaroreflexSensitivity, and Brain White Matter Neuronal Fiber Integrity in Older Adults, NeuroIm-age (2015), doi: 10.1016/j.neuroimage.2015.01.041
This is a PDF file of an unedited manuscript that has been accepted for publication.As a service to our customers we are providing this early version of the manuscript.The manuscript will undergo copyediting, typesetting, and review of the resulting proofbefore it is published in its final form. Please note that during the production processerrors may be discovered which could affect the content, and all legal disclaimers thatapply to the journal pertain.

ACC
EPTE
D M
ANU
SCR
IPT
ACCEPTED MANUSCRIPT
1
Central Artery Stiffness, Baroreflex Sensitivity, and Brain White Matter Neuronal Fiber
Integrity in Older Adults
Takashi Tarumia,b
, Daan L.K. de Jongc, David C. Zhu
d, Benjamin Y. Tseng
a, b, Jie Liu
a,b,
Candace Hilla, Jonathan Riley
a, Kyle B. Womack
e,f, Diana R. Kerwin
g, Hanzhang Lu
h, C. Munro
Cullume,f
, Rong Zhanga,b,f
aInstitute for Exercise and Environmental Medicine,
gTexas Alzheimer’s and Memory Disorders,
Texas Health Presbyterian Hospital Dallas (8200 Walnut Hill Ln, Dallas, TX, USA 75231); bDepartment of Internal Medicine,
eDepartment of Psychiatry,
fDepartment of Neurology and
Neurotherapeutics, hAdvanced Imaging Research Center, University of Texas Southwestern
Medical Center (1801 Inwood Rd, Dallas, TX, USA 75235); cDepartment of Geriatric Medicine,
Radboud University Medical Center (Geert Grooteplein-Zuid 10, 6525 GA Nijmegen,
Netherlands); d
Department of Radiology and Psychology, and Cognitive Imaging Research
Center, Michigan State University (220 Trowbridge Rd, East Lansing, MI, USA 48824)
Short Title: Arterial Baroreflex and Neuronal Fiber Integrity
Conflict of Interest
None
Corresponding Author: Rong Zhang, Ph.D.
Institute for Exercise and Environmental Medicine
Texas Health Presbyterian Hospital Dallas
University of Texas Southwestern Medical Center
Address: 7232 Greenville Ave, Dallas, TX 75231
Telephone: (214) 345-8843
Fax: (214) 345-4618
E-mail: [email protected]

ACC
EPTE
D M
ANU
SCR
IPT
ACCEPTED MANUSCRIPT
2
Abstract
Cerebral hypoperfusion elevates the risk of brain white matter (WM) lesions and cognitive
impairment. Central artery stiffness impairs baroreflex, which controls systemic arterial
perfusion, and may deteriorate neuronal fiber integrity of brain WM. The purpose of this study
was to examine the associations among brain WM neuronal fiber integrity, baroreflex sensitivity
(BRS), and central artery stiffness in older adults. Fifty-four adults (65±6 years) with normal
cognitive function or mild cognitive impairment (MCI) were tested. The neuronal fiber integrity
of brain WM was assessed from diffusion metrics acquired by diffusion tensor imaging. BRS
was measured in response to acute changes in blood pressure induced by bolus injections of
vasoactive drugs. Central artery stiffness was measured by carotid-femoral pulse wave velocity
(cfPWV). The WM diffusion metrics including fractional anisotropy (FA) and radial (RD) and
axial (AD) diffusivities, BRS, and cfPWV were not different between the control and MCI
groups. Thus, the data from both groups were combined for subsequent analyses. Across WM,
fiber tracts with decreased FA and increased RD were associated with lower BRS and higher
cfPWV, with many of the areas presenting spatial overlap. In particular, the BRS assessed during
hypotension was strongly correlated with FA and RD when compared with hypertension.
Executive function performance was associated with FA and RD in the areas that correlated with
cfPWV and BRS. These findings suggest that baroreflex-mediated control of systemic arterial
perfusion, especially during hypotension, may play a crucial role in maintaining neuronal fiber
integrity of brain WM in older adults.
Keywords: Arterial stiffness; baroreflex sensitivity; neuronal fiber integrity; cognitive function;
mild cognitive impairment

ACC
EPTE
D M
ANU
SCR
IPT
ACCEPTED MANUSCRIPT
3
Introduction
Cardiovascular aging and disease are associated with an elevated risk for structural and
functional abnormalities in the brain (Kivipelto et al., 2001; Rusanen et al., 2014). In particular,
white matter (WM) lesions, a strong risk factor for cognitive impairment, have consistently been
shown to correlate with central artery stiffness (Longstreth et al., 1996; Tsao et al., 2013). WM
lesions may develop from hypoperfusion and/or ischemia (Fernando et al., 2006; Moody et al.,
1990). Under normal conditions, arterial perfusion pressure, especially those of short-term
variability in seconds and minutes, is controlled by arterial baroreflex (Koepchen, 1984). Arterial
baroreceptors, a type of mechanoreceptor located in the central elastic arteries, monitor changes
in transmural pressure via the vessel wall distortion (Lanfranchi and Somers, 2002). With age
and/or presence of cardiovascular disease risk factors, a reduction in central arterial compliance
attenuates baroreflex sensitivity for a given change in blood pressure (Monahan et al., 2001;
Tanaka et al., 2000). As a result, the depressed baroreflex sensitivity (BRS) may impair
cardiovascular regulation of systemic arterial perfusion (Rothwell, 2010; Rothwell et al., 2010).
To date, there have been no studies investigating the relation between brain WM structural
integrity and BRS.
Diffusion tensor imaging (DTI) can quantitatively assess microstructural changes in WM
neuronal fiber tracts that manifest with aging or neurodegenerative disease (de Groot et al., 2013;
Maillard et al., 2014). Measuring the anisotropic property of water molecule diffusions in a WM
fiber tract, DTI provides several key metrics, including fractional anisotropy (FA) and radial and
axial diffusivities (RD and AD respectively) (Mori and Zhang, 2006). FA reflects WM neuronal
fiber integrity that is determined by density, directional coherence, and myelination level of WM

ACC
EPTE
D M
ANU
SCR
IPT
ACCEPTED MANUSCRIPT
4
fibers (Beaulieu and Allen, 1994). RD and AD further provide structural information about WM
neuronal fibers. Histological studies suggested that higher RD indicates axonal demyelination,
while lower AD reflects axonal loss (Song et al., 2003). Importantly, alterations in these
diffusion metrics correlate with neurocognitive performance, especially executive function
(Madden et al., 2009).
Dementia manifests at the end of a pathological spectrum, extending from age-related
cognitive decline and functional impairment (Jack Jr et al., 2013; Wentzel et al., 2001). Mild
cognitive impairment (MCI) represents an intermediate disease stage which may be a suitable
target to alter the pathological trajectory via life-style and/or pharmacological interventions
(Gauthier et al., 2006). Therefore, physiological understanding of the mechanisms linking
cardiovascular and cognitive health in MCI is crucial. The main aim of the present study was to
determine the impact of central artery stiffness and BRS on WM neuronal fiber integrity in older
adults with or without MCI. Specifically, we hypothesized that: 1) central artery stiffness and
depressed BRS would be associated with the lower levels of WM neuronal fiber integrity as
assessed by DTI, and these abnormalities are exacerbated in MCI when compared with normal
older adults, and 2) executive function performance would be associated with WM neuronal fiber
integrity in the area(s) that correlates with central artery stiffness and BRS.
Materials and Methods
Study Participants
Fifty-four participants (18 cognitively normal and 36 MCI subjects) were recruited
through a community-based advertisement using local newspapers, senior centers, and the

ACC
EPTE
D M
ANU
SCR
IPT
ACCEPTED MANUSCRIPT
5
University of Texas Southwestern Medical Center Alzheimer’s Disease Center. The diagnosis of
MCI was based on the Petersen criteria (Petersen et al., 2001; Petersen et al., 1999), as modified
by the Alzheimer's Disease Neuroimaging Initiative project (http://adni-info.org). Clinical
evaluation was performed based on the recommendations from Alzheimer's Disease Cooperative
Study (http://adni-info.org). Inclusion criteria were men and women aged 55-80 years who were
diagnosed with MCI or judged to be cognitively normal. Exclusion criteria included major
psychiatric disorders, major or unstable medical conditions, uncontrolled hypertension, diabetes
mellitus, current or a history of smoking within the past 2 years, or chronic inflammatory
diseases. Individuals with a pacemaker or any metal in their body which precluded magnetic
resonance imaging were excluded. Subjects engaging in regular aerobic exercise in the past 2
years were excluded because physical activity may alter brain structure and function,
independently of vascular disease and risk factors (Cotman et al., 2007). All subjects signed the
informed consent approved by the Institutional Review Boards of University of Texas
Southwestern Medical Center and Texas Health Presbyterian Hospital of Dallas.
Measurements
Magnetic Resonance Imaging (MRI). All MRI measurements were acquired by a 3-Tesla scanner
(Philips Medical System, Best, The Netherlands) using a body coil for radiofrequency
transmission and 8-channel head coil with parallel imaging capability for signal reception. Three
MRI sequences were performed: DTI, fluid-attenuated-inversion-recovery (FLAIR), and 3D
magnetization-prepared rapid acquisition gradient echo (MPRAGE). DTI was acquired using a
single-shot echo-planar-imaging (EPI) sequence with a sensitivity encoding (SENSE) parallel
imaging scheme (reduction factor=2.2). The imaging matrix was 112×112 with field of view

ACC
EPTE
D M
ANU
SCR
IPT
ACCEPTED MANUSCRIPT
6
(FOV) =224×224 mm2 (nominal resolution of 2 mm), which was filled to 256×256. Axial slices
of 2.2 mm thickness (no gap) were acquired parallel to the anterior-posterior commissure line. A
total of 65 slices covered the entire hemisphere and brainstem. Echo Time (TE)/Repetition Time
(TR) was 51/5630 ms. The diffusion weighing was encoded along 30 independent orientations
and the b value was 1000 s/mm2. The scan duration was 4.3 minutes. Automated image
registration was performed on the raw diffusion images to correct distortions caused by motion
artifacts or eddy currents. All subjects underwent two consecutive scans of DTI acquisitions.
FLAIR images were acquired in the transverse plane using the following parameters:
FOV=230×230 mm2, resolution=0.65 (anterior-posterior) ×0.87 (right-left) mm
2, number of
slices=24, thickness=5 mm, gap=1 mm, TR/Inversion Time/TE=11000/2800/150 ms, and scan
duration=3.6 minutes. MPRAGE images were acquired using the following parameters:
TE/TR=3.7/8.1 ms, flip angle=12°, FOV=256×256 mm, number of slices = 160 (no gap),
resolution=1×1×1 mm3, SENSE factor=2, and scan duration=4 minutes.
Cardiovascular Assessments. All physiological measurements were performed in an
environmentally controlled laboratory after resting in the supine position for ≥15 minutes. All
subjects abstained from alcohol, caffeinated beverages, and intense physical activity for ≥12
hours prior to data collection. Brachial blood pressure was measured intermittently using an
electrosphygmomanometer (Suntech, Morrisville, NC, USA). Central artery stiffness was
measured by carotid-femoral pulse wave velocity (cfPWV) using applanation tonometry which
was sequentially placed on the common carotid and femoral arteries (SphygmoCor 8.0; AtCor
Medical, West Ryde, NSW, Australia). Arterial pulse of >10 cardiac cycles was recorded to
calculate cfPWV.

ACC
EPTE
D M
ANU
SCR
IPT
ACCEPTED MANUSCRIPT
7
BRS was assessed via the modified Oxford protocol in which we performed a sequential
intravenous bolus injections of sodium nitroprusside (100 µg) followed 60 seconds by
phenylephrine hydrochloride (150 µg). All subjects experienced a decrease and increase in
systolic blood pressure of at least 15 mmHg. Three-lead electrocardiogram (ECG) and beat-by-
beat arterial blood pressure using finger plethysmography (Finapress; Ohmeda, Boulder, CO,
USA) were continuously recorded with a sampling frequency of 1,000 Hz and analyzed offline
using data analysis software (Acqknowledge, BIOPAC Systems, Goleta, CA, USA).
Neurocognitive Assessments. Clinical Dementia Rating (CDR) (Morris et al., 1997), Mini-mental
State Examination (MMSE) (Folstein et al., 1975), Wechsler Memory Scale-Revised (WMS-R)
(Wechsler, 1987), California Verbal Learning Test-second edition (CVLT-II) (Delis, 2000), and
Trail Making Test parts A and B (Tombaugh, 2004) were administered and scored using
standard criteria. The diagnosis of MCI was determined by a global CDR of 0.5 with a score of
0.5 in the memory category, objective memory loss as indicated by education-adjusted scores on
the Logical Memory subtest of the WMS-R, and MMSE score between 24 and 30. CVLT-II
Long Delay Free Recall and Trail Making Test part B minus A (i.e., to focus more upon the
executive function components of the test by subtracting the psychomotor speed aspect) were
selected a priori as the primary measures of memory and executive function, respectively (Drane
et al., 2002; Grundman et al., 2004).
Data Analyses
DTI Preprocessing and Analysis. DTI data were preprocessed using the FMRIB Diffusion
Toolbox (FDT) included as a part of the FMRIB Software Library (FSL) program
(http://www.fmrib.ox.ac.uk/fsl, Oxford Center for Functional MRI of the Brain, Oxford

ACC
EPTE
D M
ANU
SCR
IPT
ACCEPTED MANUSCRIPT
8
University, UK) (version 5.0). First, 2 scans of DTI data were merged in the temporal order,
corrected for eddy currents and head motion, and averaged over the scans to increase signal-to-
noise ratio. Second, a brain mask was created using Brain Extraction Tool (BET). Finally, the
diffusion tensor was calculated by fitting a diffusion tensor model to the preprocessed DTI data
using the DTIfit program included in FDT (Smith, 2002). To minimize partial volume effects
from grey matter and cerebrospinal fluid, we set a threshold for voxels with FA value greater
than 0.20. Individual subjects’ images with FA, RD, and AD were visually inspected and used in
the voxelwise and region-of-interest (ROI) analyses.
Voxelwise statistics were performed by tract-based spatial statistics (TBSS) (version 1.2)
(Smith et al., 2006), a part of the FSL program (Smith et al., 2004). All subjects’ FA data were
first aligned into a common space using the FMRIB’s nonlinear image registration tool (FNIRT),
which uses a b-spline representation of the registration warp field (Rueckert et al., 1999). We
used JHU-ICBM-FA template as a common space in order to correspond the results from
voxelwise and ROI analyses. Next, the mean FA image was created and thinned to generate a
mean FA skeleton which represents the centers of all tracts common to all subjects. Each
subject’s aligned FA, RD, and AD data were projected onto this skeleton and the resulting data
were fed into voxelwise and ROI-based cross-subject statistics.
ROI analysis that is limited to the TBSS skeleton was performed using the deep WM
atlas (ICBM-DTI-81 white-matter atlas) developed by the Johns Hopkins University (Mori et al.,
2008). Mean values of a diffusion metric for selected ROI segmentations were extracted from
each participant.

ACC
EPTE
D M
ANU
SCR
IPT
ACCEPTED MANUSCRIPT
9
WM Lesion Volume. Total brain volume of WM hyperintensities were measured in FLAIR
images using a procedure described in detail elsewhere (Gurol et al., 2006). First, a ROI
corresponding to WM hyperintensity was created using a semi-automated technique which
applies individually determined intensity thresholding. Second, gross manual outlining of WM
hyperintensities was performed to create ROI maps. Third, the intersection of ROIs created from
the 1st and 2
nd steps were identified, visually inspected, and produced the final WM
hyperintensity volume. To account for individual differences in head size, total brain volume of
WM hyperintensity was normalized to the intracranial volume and reported in percentage.
Baroreflex Sensitivity. Cardiovagal BRS was analyzed using the procedure described in detail
elsewhere (Lipman et al., 2003; Rudas et al., 1999). Briefly, individual raw data showing the
relation between R-R interval and systolic blood pressure was first plotted to visually identify
and exclude the saturation and threshold regions. Next, the values of R-R interval were pooled
and averaged every 2 mmHg bin of systolic blood pressure to minimize the influence of
respiration. A least squares linear regression was applied to the relation between changes in
systolic blood pressure and R-R interval of the preceding cardiac cycle to account for baroreflex
delays. BRS was determined by a slope of the linear regression, with a correlation coefficient
greater than 0.80. BRS was calculated from the entire sequence of the modified Oxford protocol
as well as hypo- and hypertensive episodes separately.
Central Artery Stiffness. Carotid-femoral PWV was calculated by dividing arterial pulse
traveling distance by the transit time, and expressed in meters per second. The traveling distance
was measured as a straight distance on body surface between the carotid and femoral arteries
using a tape ruler. The arterial pulse transit time was calculated by subtracting a time difference

ACC
EPTE
D M
ANU
SCR
IPT
ACCEPTED MANUSCRIPT
10
between the R-wave of ECG to a foot of femoral artery pressure waveform minus a time
difference between the R-wave of ECG to a foot of carotid artery pressure waveform. The transit
time was averaged over >10 cardiac cycles.
Brain Volume. Global and regional brain volumes were measured using FreeSurfer software
(https://surfer.nmr.mgh.harvard.edu/fswiki). Global brain volume (i.e., total parenchyma, and
grey and white matters) was normalized to intracranial volume whereas regional brain volume
(i.e., medial temporal lobe and hippocampus) was corrected for total parenchyma volume in
order to estimate regional tissue loss, independent of the global effect (Wardlaw et al., 2013).
Statistical Analysis
All participants completed the study protocol. Voxelwise analysis of DTI data was
performed by general linear model, a part of the FSL-randomise program. Diffusion metrics
were first compared between the groups of normal and MCI subjects. Then, the associations with
cfPWV and BRS were examined. To further explore the impact of hypo- and hypertension on the
brain structure, we performed an additional TBSS analysis using BRS to separately assess the
effects of blood pressure reduction and elevation. Correction for multiple comparisons was
performed using threshold-free cluster enhancement (TFCE) with 5,000 permutations. Corrected
statistical maps were further thresholded by P<0.05. Anatomical assignments of the WM
skeleton voxels that survived correction of multiple comparisons and P-value thresholding were
identified using the WM atlas. We specifically focused on the major WM fiber tracts in the deep
and periventricular area which may be susceptible for cerebral hypoperfusion and/or ischemia
(Moody et al., 1990). These WM fiber tracts included corpus callosum, corona radiate, internal
capsule, external capsule, and superior longitudinal fasciculus. Finally, the mean values of

ACC
EPTE
D M
ANU
SCR
IPT
ACCEPTED MANUSCRIPT
11
diffusion metrics were extracted from the significant WM skeletons resulting from the TBSS
analysis.
The groups of normal and MCI subjects were compared by the Mann-Whitney U test.
Simple correlations among continuous variables were examined by the Pearson’s product-
moment correlation. Multiple linear regression was used to examine the association of diffusion
metrics with cfPWV and BRS, including covariates. All models adjusted for age, sex, education
level, systolic blood pressure, and correlates of cfPWV, BRS, and diffusion metrics in this
sample. Partial correlation was used to test the association between diffusion metrics and
cognitive function. The covariates included in this analysis were age, sex, education level,
systolic blood pressure, and correlates of cognitive function in this sample.
Normality of continuous variables was examined by the Shapiro-Wilk test as well as the
visual inspection of histograms and Q-Q plots. Total brain volume of WM hyperintensity was
log-transformed due to a skewed distribution of the raw data. Sex was dummy-coded (men=0
and women=1). Statistical significance was set a priori at P<0.05 for all tests. Data are reported
as mean ± standard deviation. Statistical analyses were performed using SPSS 21.0 (SPSS inc.,
Chicago, IL).
Results
Table 1 shows a group comparison of the normal and MCI subjects. Age, sex, education
level, and MMSE scores did not differ between groups. Compared with the normal group, MCI
subjects demonstrated lower performance in memory and executive function, as evidenced by
the lower scores on CVLT-II Long Delay Free Recall and the longer time in Trail Making Test

ACC
EPTE
D M
ANU
SCR
IPT
ACCEPTED MANUSCRIPT
12
B-A respectively. In contrast, there was no group difference in the measures of diffusion metrics,
brain volume, and cardiovascular function including cfPWV and BRS. Accordingly, all subjects’
data were combined to perform the association analyses.
Consistent with the literatures (Monahan et al., 2001; Tanaka et al., 2000), higher cfPWV
correlated with lower BRS (r=-0.34, P=0.01), assessed particularly during hypotension (r=-0.45,
P=0.001) compared with hypertension (r=-0.26, P=0.06). The greater volume of WM
hyperintensity correlated with lower BRS (r=-0.35, P=0.01) and higher cfPWV (r=0.68,
P<0.001).
Associations among central artery stiffness, BRS, and WM neuronal fiber integrity
In Figure 1, TBSS maps exhibit WM fiber tracts that associated with cfPWV and BRS.
Specifically, 46.6 cm3 and 43.1 cm
3 of the WM fiber tracts with decreasing FA were associated
with higher cfPWV and lower BRS, respectively. Similarly, 48.8 cm3 and 31.9 cm
3 of the WM
fiber tracts with increasing RD were associated with higher cfPWV and lower BRS, respectively.
When BRS was analyzed separately during hypo- and hypertension, the former was associated
with the greater volume of WM fiber tracts with FA (43.0 vs. 21.8 cm3) and RD (36.0 vs. 0.08
cm3) when compared with the latter, while the directions of associations remained the same as
the combined BRS (Figure 2). WM fiber tracts with AD did not correlate with either cfPWV or
BRS.
The WM fiber tracts that associated with cfPWV and BRS exhibited a large spatial
overlap. Specifically, 25.0 cm3 and 21.6 cm
3 of the voxels with FA and RD were associated with
both cfPWV and BRS, respectively (bottom of the Figure 1). This accounts for ~50% of the WM
fiber tracts that correlated with either cfPWV or BRS, and may suggest the presence of a
ACC
EPTE
D M
ANU
SCR
IPT
ACCEPTED MANUSCRIPT
13
common underlying mechanism by which central artery stiffness and low BRS deteriorate WM
neuronal fiber integrity or they may contribute independently to the neuronal fiber deterioration
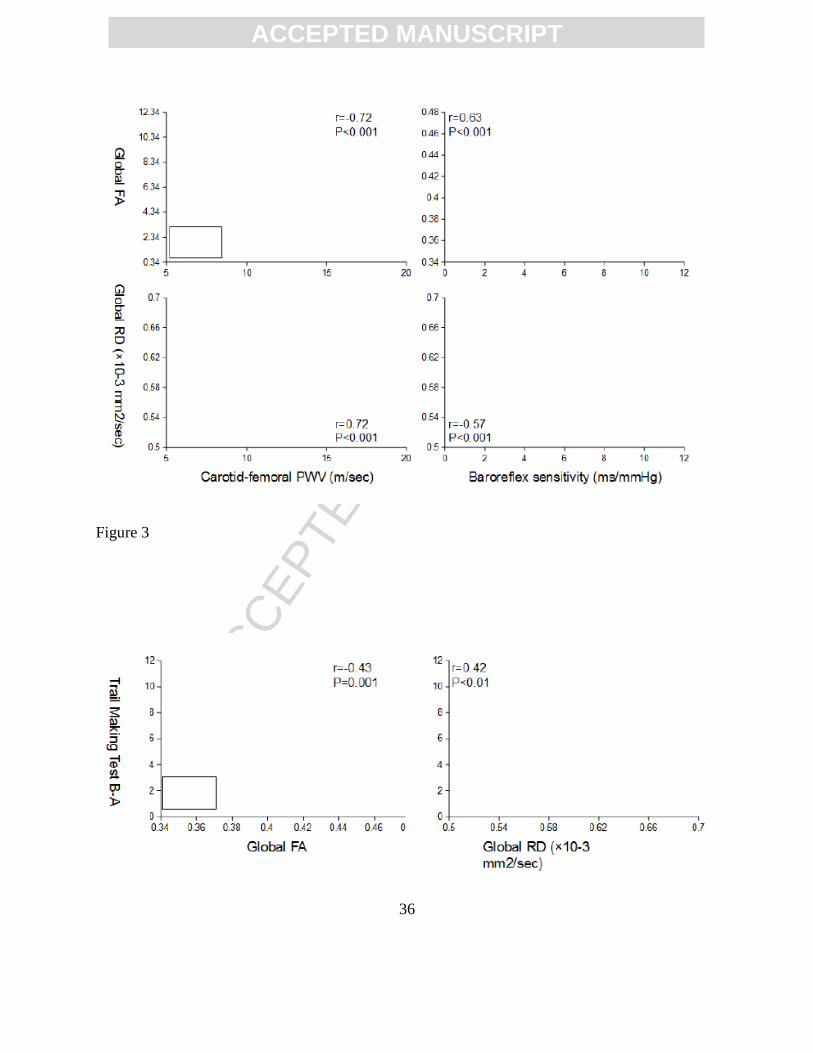
in these regions. To explore these possibilities, we extracted the mean values of individual FA
and RD from the spatial overlapped regions and further examined their associations with cfPWV
and BRS. Figure 3 shows the scatter plots of cfPWV and BRS in relation to FA and RD
extracted from the global WM skeletons. Multivariate adjusted regression revealed significant
associations of the global WM skeletons with cfPWV and BRS after controlling for age, sex,
education level, systolic blood pressure, and WM hyperintensity volume (Tables 2 and 3).
Similar to the global WM analysis, many of the WM fiber tracts in the deep and
periventricular area showed spatial overlap in terms of their associations with cfPWV and BRS.
Multivariate adjusted regression revealed that both cfPWV and BRS independently associated
with FA and RD in the posterior corona radiata (PCR) (Tables 2 and 3). In addition, BRS
independently associated with FA and RD in the splenium of corpus callosum and the
retrolenticular part of internal capsule.
Association between WM neuronal fiber integrity and cognitive function
Better executive function performance, as assessed by Trail Making Test B-A, was
associated with the higher levels of FA and the lower levels of RD in the global WM skeletons
that correlated with both cfPWV and BRS (Figure 4). Partial correlation analysis further revealed
that FA and RD measured from the global WM (r=-0.32 with P=0.03; r=0.31 with P=0.04,
respectively) and RD measured from the PCR (r=0.29 with P=0.048) remain to be correlated
with executive function performance after controlling for age, sex, education level, systolic
blood pressure, WM hyperintensity volume, and cognitive status (i.e., healthy or MCI group).

ACC
EPTE
D M
ANU
SCR
IPT
ACCEPTED MANUSCRIPT
14
Discussion
The major findings from this study are as follows. First, central artery stiffness and
depressed BRS were independently associated with the deterioration of WM neuronal fiber
integrity, as reflected by the decreases in FA and increases in RD. In addition, a large portion of
the WM fiber tracts with FA and RD that correlated with arterial stiffness and BRS showed
spatial overlap. Second, WM neuronal fiber integrity was correlated more strongly with BRS
assessed during hypotension than hypertension. Third, executive function performance was
associated with WM neuronal fiber integrity, specifically in the areas correlated with arterial
stiffness and low BRS. Below we further discuss the potential mechanism(s) and clinical
implications of these findings.
The role of baroreflex in the link between central artery stiffness and WM neuronal fiber
integrity
Central artery stiffness was associated with abnormal structural changes in the brain WM,
as assessed by both WM hyperintensity and DTI. The cross-sectional association between aortic
PWV and WM hyperintensity volume has consistently been reported in the literature (Henskens
et al., 2008), and our study also confirmed this association (r=0.68, P<0.001). Furthermore, our
data adds to the literature by demonstrating the independent association of higher cfPWV with
lower FA and higher RD in the global and regional WM fiber tracts after controlling for WM
hyperintensity volume. These findings suggest an involvement of central artery stiffness in the
pathogenesis of WM lesions because the lower levels of FA in the WM tissue have been shown
to precede the development and progression of WM hyperintensity (de Groot et al., 2013).

ACC
EPTE
D M
ANU
SCR
IPT
ACCEPTED MANUSCRIPT
15
Hemodynamic mechanisms underlying the association between central artery stiffness
and WM lesions are likely to be multifactorial. Aortic stiffness increases left ventricular afterload
and also leads to an early return of arterial wave reflections from the peripheral vascular bed
(Nichols, 2005). As a result, central pulse pressure increases due to the effects of elevated
forward and/or backward pressure waves (Mitchell et al., 2010; Namasivayam et al., 2009).
Cerebral circulation has a high flow, low vascular resistance and impedance which may facilitate
the transmission of hemodynamic pulsatility (O'Rourke and Safar, 2005). Age-related elevations
in central artery stiffness and pulse pressure are independently associated with the higher levels
of cerebral blood flow pulsatility and WM lesion volume (Aribisala et al., 2014; Katulska et al.,
2014; Mitchell et al., 2011; Tarumi et al., 2014). Mechanistically, excessive pulsatile shear stress
on cerebral microcirculations may damage vascular endothelium and blood-brain barrier whose
integrity has been shown as a neuropathological correlate of WM lesions (Young et al., 2008).
Therefore, central artery stiffness may increase the risk of WM lesions via elevations in central
and cerebral hemodynamic pulsatility.
Central artery stiffness may also increase short-term variability in blood pressure which
may predispose the brain to unstable supplies of oxygen and nutrients (Schillaci et al., 2012). In
the current study, WM neuronal fiber integrity not only correlated with BRS in general, but also
more closely with BRS assessed during hypotension than hypertension. Arterial baroreceptors,
the stretch-sensitive mechanoreceptors located in the walls of aortic arch and carotid sinus,
monitor moment-to-moment variability in arterial pressure. The baroreceptor reflex subsequently
modulates cardiac output and total peripheral resistance and maintains a constant levels of
systemic arterial pressure and perfusion (Lanfranchi and Somers, 2002). With stiffening of the

ACC
EPTE
D M
ANU
SCR
IPT
ACCEPTED MANUSCRIPT
16
barosensory arteries, BRS decreases and may elevate the risk of cerebral hypoperfusion in the
face of hypotension (e.g., orthostasis) (Ogoh et al., 2010). Alternatively, attenuated increases in
cardiac output that are accompanied by compensatory elevations in total peripheral resistance
may also cause hypoperfusion, independent of arterial pressure (Guo et al., 2006). It has been
shown that attenuated elevations in cardiac output during orthostasis correlate with cerebral
hypoperfusion and cognitive impairment in heart failure patients (Fraser, 2014). Therefore, these
findings suggest that cardiovascular regulation of arterial pressure and perfusion, especially
during hypotension, may have significant impact on the structural integrity of the brain WM.
The lower levels of FA associated with arterial stiffening and decreasing BRS occurred
with concurrent elevations in RD in many brain regions (Figures 1 and 2). DTI measures water
diffusions in a WM fiber tract that are restricted by axonal membranes and myelin (Mori and
Zhang, 2006). While FA provides an overall measure of WM neuronal fiber integrity, changes in
RD, as measured by water diffusions perpendicular to the WM fiber tract, are likely to reflect
myelin integrity. A series of histological experiments using the optic nerve exposed to retinal
ischemia demonstrated that axonal demyelination is correlated with elevations in RD (Song et al.,
2003; Sun et al., 2006). Therefore, findings from the present study suggest that cerebral
hypoperfusion and/or ischemia associated with low BRS during hypotension may lead to myelin
deterioration and manifest as reductions in WM FA.
The role of WM neuronal fiber integrity in cognitive function
Better executive function performance was correlated with higher FA and lower RD
measured from the global and regional WM fiber tracts. The brain WM, which accounts for
40%-50% of the parenchyma, comprises axons and myelin, connects distributed network of

ACC
EPTE
D M
ANU
SCR
IPT
ACCEPTED MANUSCRIPT
17
neurons, and facilitates complex cognitive task via structural and functional integrations
(Mesulam, 1990). The conventional techniques of brain WM imaging (e.g., T1-weighted or
FLAIR MRI) are limited by their sensitivity in detecting changes in cognitive function. In
contrast, the diffusion metrics derived from DTI have consistently been shown to correlate with
processing speed and executive function (Charlton et al., 2006). For example, Vernooij et al.
reported that higher FA measured from the global WM was related to better performance on
tasks assessing information processing speed and global cognition (Vernooij et al., 2009). In this
regard, our data also showed that higher FA and lower RD in the global WM correlated with
better executive function performance, while total brain volume of WM or WM hyperintensities
were unrelated to cognitive performance.
WM neuronal fiber integrity, as assessed by FA and RD, correlated with executive
function performance in all subjects. However, MCI subjects who have shown lower
performance in executive function demonstrated similar levels of WM neuronal fiber integrity
compared with healthy subjects. Such discrepancies in the results of group comparison versus
association analyses may be explained by a few reasons. First, cognitive impairment has
multifactorial causes, including but not only limited to brain WM deteriorations. The other
potential causes include amyloid depositions, hypometabolism, and neurodegeneration, which
may impact cognitive function independent of brain WM structural abnormalities (Arnaiz et al.,
2001; Jack et al., 2009). Second, a recent meta-analysis suggested that the effect of MCI or
Alzheimer disease on WM microstructural integrity may depend on the level of global cognitive
impairment (e.g., MMSE) (Sexton et al., 2011). Indeed, we also observed a trend towards a
positive relation between MMSE scores and global FA and RD (Data Supplement Figure). In the

ACC
EPTE
D M
ANU
SCR
IPT
ACCEPTED MANUSCRIPT
18
current study, MCI participants as a group demonstrated the comparable MMSE scores to
healthy adults which in turn may have reflected the similar levels in FA and RD. Third, the
metrics derived from DTI may not be specific and/or sensitive enough to detect the group
difference in executive function. Finally, our study sample was relatively small and may be
underpowered to detect group differences in the DTI metrics.
Strengths and Limitations
The major strength of this study is the multidisciplinary nature of the investigation. DTI
assessed microstructural tissue properties of brain WM, while baroreflex-mediated control of
systemic arterial perfusion was assessed by the modified Oxford technique which is currently
considered the gold-standard method to quantify BRS (Lipman et al., 2003). In addition, DTI
quantifies a continuous scale of WM structural characteristics as opposed to the conventional
FLAIR-MRI, which only provides a dichotomous classification of normal or abnormal WM
tissues. Furthermore, our sample was enriched by heterogeneous levels of cognitive function.
Since MCI is a common condition in older adults, understanding the physiological link between
cardiovascular and cognitive health in this population may help with the development of
strategies to prevent dementia later in life.
There are several limitations that need to be discussed. First, the baroreflex pathway
involves neural circuits in the brainstem which may confound an interpretation of the association
between BRS and WM neuronal fiber integrity (Benarroch, 2008). Indeed, we saw that BRS was
associated with FA and RD of the brainstem where the cardiovascular regulatory center is
located (Figure 1). However, a stronger correlation between WM neuronal fiber integrity and
BRS assessed during hypotension than hypertension and the presence of the correlations in many

ACC
EPTE
D M
ANU
SCR
IPT
ACCEPTED MANUSCRIPT
19
other brain regions which may not relate to the baroreflex pathway make an argument that
impairment in the BRS neural pathway alone cannot explain our observations. Second,
anatomical orientation of the WM fiber tracts (e.g., crossing fibers and diameter of axons) may
alter the level of diffusion metrics independent of the fiber integrity (Beaulieu and Allen, 1994).
In this regard, TBSS may reduce such errors by analyzing the center of WM tracts common to all
subjects. Third, our sample size was limited, and multiple statistical analyses were conducted,
which tends to inflate Type II error. Finally, our MCI group was comprised of very mildly
impaired subjects, and may not be generalizable to other populations. We did not have
longitudinal data to confirm the stability or progression of MCI symptoms, and the collection of
data were spread out over ~3 months, which may further attenuate relationships of interest.
Conclusions
Central artery stiffness and depressed BRS are independently associated with
deterioration of WM neuronal fiber integrity in older adults. In particular, the BRS assessed
during hypotension is strongly correlated with WM neuronal fiber integrity. These alterations in
WM neuronal fiber are likely to be related to axonal demyelination. Finally, executive function
performance is associated with WM neuronal fiber integrity, in the areas correlated with arterial
stiffness and BRS. Therefore, these findings collectively suggest that cardiovascular
dysregulation of systemic arterial perfusion may elevate the risk of brain WM lesions and
cognitive impairment in older adults.

ACC
EPTE
D M
ANU
SCR
IPT
ACCEPTED MANUSCRIPT
20
Acknowledgements
This study was supported by National Institute of Health (R01AG033106, R01HL102457, and
P30AG012300) and American Heart Association (14POST20140013). The authors would like to
thank the study participants for their time and effort; Yoshiyuki Okada for technical support; and
Mauricio Nunez for subject recruitment effort.
ACC
EPTE
D M
ANU
SCR
IPT
ACCEPTED MANUSCRIPT
21
References
1) Aribisala, B.S., Morris, Z., Eadie, E., Thomas, A., Gow, A., Hernández, M.C.V., Royle, N.A.,
Bastin, M.E., Starr, J., Deary, I.J., 2014. Blood Pressure, Internal Carotid Artery Flow
Parameters, and Age-Related White Matter Hyperintensities. Hypertension 63, 1011-1018.
2) Arnaiz, E., Jelic, V., Almkvist, O., Wahlund, L., Winblad, B., Valind, S., Nordberg, A., 2001.
Impaired cerebral glucose metabolism and cognitive functioning predict deterioration in mild
cognitive impairment. Neuroreport 12, 851-855.
3) Beaulieu, C., Allen, P.S., 1994. Determinants of anisotropic water diffusion in nerves.
Magnetic resonance in medicine 31, 394-400.
4) Benarroch, E.E., 2008. The arterial baroreflex Functional organization and involvement in
neurologic disease. Neurology 71, 1733-1738.
5) Charlton, R., Barrick, T., McIntyre, D., Shen, Y., O'Sullivan, M., Howe, F., Clark, C., Morris,
R., Markus, H., 2006. White matter damage on diffusion tensor imaging correlates with age-
related cognitive decline. Neurology 66, 217-222.
6) Cotman, C.W., Berchtold, N.C., Christie, L.-A., 2007. Exercise builds brain health: key roles
of growth factor cascades and inflammation. Trends in neurosciences 30, 464-472.
7) de Groot, M., Verhaaren, B.F., de Boer, R., Klein, S., Hofman, A., van der Lugt, A., Ikram,
M.A., Niessen, W.J., Vernooij, M.W., 2013. Changes in normal-appearing white matter
precede development of white matter lesions. Stroke 44, 1037-1042.
8) Delis, D.C., Kramer, J.H., Kaplan, E., Ober, B.A., 2000. CVLT-II: California Verbal
Learning Test Second Edition Adult Version. The Psychological Corporation, San Antonio,
TX.

ACC
EPTE
D M
ANU
SCR
IPT
ACCEPTED MANUSCRIPT
22
9) Drane, D.L., Yuspeh, R.L., Huthwaite, J.S., Klingler, L.K., 2002. Demographic
characteristics and normative observations for derived-trail making test indices.
Neuropsychiatry Neuropsychol Behav Neurol 15, 39-43.
10) Fernando, M.S., Simpson, J.E., Matthews, F., Brayne, C., Lewis, C.E., Barber, R., Kalaria,
R.N., Forster, G., Esteves, F., Wharton, S.B., Shaw, P.J., O'Brien, J.T., Ince, P.G., Function,
M.R.C.C., Ageing Neuropathology Study, G., 2006. White matter lesions in an unselected
cohort of the elderly: molecular pathology suggests origin from chronic hypoperfusion injury.
Stroke 37, 1391-1398.
11) Folstein, M.F., Folstein, S.E., McHugh, P.R., 1975. "Mini-mental state". A practical method
for grading the cognitive state of patients for the clinician. J Psychiatr Res 12, 189-198.
12) Fraser, K.S., Heckman, G.A., McKelvie, R.S., Harkness, K., Middleton, L., Hughson, R.L.,
2014. Cerebral hypoperfusion is exaggerated with an upright posture in heart failure: impact
of depressed cardiac output. JACC: Heart Failure In Press.
13) Gauthier, S., Reisberg, B., Zaudig, M., Petersen, R.C., Ritchie, K., Broich, K., Belleville, S.,
Brodaty, H., Bennett, D., Chertkow, H., 2006. Mild cognitive impairment. The Lancet 367,
1262-1270.
14) Grundman, M., Petersen, R.C., Ferris, S.H., Thomas, R.G., Aisen, P.S., Bennett, D.A., Foster,
N.L., Jack, C.R., Jr., Galasko, D.R., Doody, R., Kaye, J., Sano, M., Mohs, R., Gauthier, S.,
Kim, H.T., Jin, S., Schultz, A.N., Schafer, K., Mulnard, R., van Dyck, C.H., Mintzer, J.,
Zamrini, E.Y., Cahn-Weiner, D., Thal, L.J., 2004. Mild cognitive impairment can be
distinguished from Alzheimer disease and normal aging for clinical trials. Arch Neurol 61,
59-66.

ACC
EPTE
D M
ANU
SCR
IPT
ACCEPTED MANUSCRIPT
23
15) Guo, H., Tierney, N., Schaller, F., Raven, P.B., Smith, S.A., Shi, X., 2006. Cerebral
autoregulation is preserved during orthostatic stress superimposed with systemic hypotension.
Journal of Applied Physiology 100, 1785-1792.
16) Gurol, M., Irizarry, M., Smith, E., Raju, S., Diaz-Arrastia, R., Bottiglieri, T., Rosand, J.,
Growdon, J., Greenberg, S., 2006. Plasma β-amyloid and white matter lesions in AD, MCI,
and cerebral amyloid angiopathy. Neurology 66, 23-29.
17) Henskens, L.H., Kroon, A.A., van Oostenbrugge, R.J., Gronenschild, E.H., Fuss-Lejeune,
M.M., Hofman, P.A., Lodder, J., de Leeuw, P.W., 2008. Increased aortic pulse wave velocity
is associated with silent cerebral small-vessel disease in hypertensive patients. Hypertension
52, 1120-1126.
18) Jack, C.R., Lowe, V.J., Weigand, S.D., Wiste, H.J., Senjem, M.L., Knopman, D.S., Shiung,
M.M., Gunter, J.L., Boeve, B.F., Kemp, B.J., 2009. Serial PIB and MRI in normal, mild
cognitive impairment and Alzheimer's disease: implications for sequence of pathological
events in Alzheimer's disease. Brain, awp062.
19) Jack Jr, C.R., Knopman, D.S., Jagust, W.J., Petersen, R.C., Weiner, M.W., Aisen, P.S., Shaw,
L.M., Vemuri, P., Wiste, H.J., Weigand, S.D., 2013. Tracking pathophysiological processes
in Alzheimer's disease: an updated hypothetical model of dynamic biomarkers. The Lancet
Neurology 12, 207-216.
20) Katulska, K., Wykrętowicz, M., Minczykowski, A., Krauze, T., Milewska, A., Piskorski, J.,
Marciniak, R., Stajgis, M., Wysocki, H., Guzik, P., 2014. Aortic excess pressure and arterial
stiffness in subjects with subclinical white matter lesions. International journal of cardiology
172, 269-270.

ACC
EPTE
D M
ANU
SCR
IPT
ACCEPTED MANUSCRIPT
24
21) Kivipelto, M., Helkala, E.-L., Laakso, M.P., Hänninen, T., Hallikainen, M., Alhainen, K.,
Soininen, H., Tuomilehto, J., Nissinen, A., 2001. Midlife vascular risk factors and
Alzheimer's disease in later life: longitudinal, population based study. Bmj 322, 1447-1451.
22) Koepchen, H., 1984. History of studies and concepts of blood pressure waves. Mechanisms
of blood pressure waves, 3-23.
23) Lanfranchi, P.A., Somers, V.K., 2002. Arterial baroreflex function and cardiovascular
variability: interactions and implications. American Journal of Physiology-Regulatory,
Integrative and Comparative Physiology 283, R815-R826.
24) Lipman, R.D., Salisbury, J.K., Taylor, J.A., 2003. Spontaneous indices are inconsistent with
arterial baroreflex gain. Hypertension 42, 481-487.
25) Longstreth, W., Manolio, T.A., Arnold, A., Burke, G.L., Bryan, N., Jungreis, C.A., Enright,
P.L., O'Leary, D., Fried, L., 1996. Clinical correlates of white matter findings on cranial
magnetic resonance imaging of 3301 elderly people The Cardiovascular Health Study. Stroke
27, 1274-1282.
26) Madden, D.J., Bennett, I.J., Song, A.W., 2009. Cerebral white matter integrity and cognitive
aging: contributions from diffusion tensor imaging. Neuropsychology review 19, 415-435.
27) Maillard, P., Fletcher, E., Lockhart, S.N., Roach, A.E., Reed, B., Mungas, D., DeCarli, C.,
Carmichael, O.T., 2014. White matter hyperintensities and their penumbra lie along a
continuum of injury in the aging brain. Stroke 45, 1721-1726.
28) Mesulam, M., 1990. Large‐scale neurocognitive networks and distributed processing for
attention, language, and memory. Annals of neurology 28, 597-613.

ACC
EPTE
D M
ANU
SCR
IPT
ACCEPTED MANUSCRIPT
25
29) Mitchell, G.F., van Buchem, M.A., Sigurdsson, S., Gotal, J.D., Jonsdottir, M.K., Kjartansson,
Ó., Garcia, M., Aspelund, T., Harris, T.B., Gudnason, V., 2011. Arterial stiffness, pressure
and flow pulsatility and brain structure and function: the Age, Gene/Environment
Susceptibility–Reykjavik study. Brain 134, 3398-3407.
30) Mitchell, G.F., Wang, N., Palmisano, J.N., Larson, M.G., Hamburg, N.M., Vita, J.A., Levy,
D., Benjamin, E.J., Vasan, R.S., 2010. Hemodynamic correlates of blood pressure across the
adult age spectrum noninvasive evaluation in the Framingham Heart Study. Circulation 122,
1379-1386.
31) Monahan, K.D., Tanaka, H., Dinenno, F.A., Seals, D.R., 2001. Central arterial compliance is
associated with age-and habitual exercise–related differences in cardiovagal baroreflex
sensitivity. Circulation 104, 1627-1632.
32) Moody, D.M., Bell, M.A., Challa, V.R., 1990. Features of the cerebral vascular pattern that
predict vulnerability to perfusion or oxygenation deficiency: an anatomic study. AJNR Am J
Neuroradiol 11, 431-439.
33) Mori, S., Oishi, K., Jiang, H., Jiang, L., Li, X., Akhter, K., Hua, K., Faria, A.V., Mahmood,
A., Woods, R., 2008. Stereotaxic white matter atlas based on diffusion tensor imaging in an
ICBM template. Neuroimage 40, 570-582.
34) Mori, S., Zhang, J., 2006. Principles of diffusion tensor imaging and its applications to basic
neuroscience research. Neuron 51, 527-539.
35) Morris, J.C., Ernesto, C., Schafer, K., Coats, M., Leon, S., Sano, M., Thal, L.J., Woodbury,
P., 1997. Clinical dementia rating training and reliability in multicenter studies: the
Alzheimer's Disease Cooperative Study experience. Neurology 48, 1508-1510.

ACC
EPTE
D M
ANU
SCR
IPT
ACCEPTED MANUSCRIPT
26
36) Namasivayam, M., McDonnell, B.J., McEniery, C.M., O'Rourke, M.F., 2009. Does wave
reflection dominate age-related change in aortic blood pressure across the human life span?
Hypertension 53, 979-985.
37) Nichols, W.W., O'Rourke, M.E., 2005. McDonald's Blood Flow in Arteries, 5th ed. Oxford
University Press, New York.
38) O'Rourke, M.F., Safar, M.E., 2005. Relationship between aortic stiffening and microvascular
disease in brain and kidney: cause and logic of therapy. Hypertension 46, 200-204.
39) Ogoh, S., Tzeng, Y.-C., Lucas, S.J., Galvin, S.D., Ainslie, P.N., 2010. Influence of
baroreflex-mediated tachycardia on the regulation of dynamic cerebral perfusion during acute
hypotension in humans. The Journal of physiology 588, 365-371.
40) Petersen, R.C., Doody, R., Kurz, A., Mohs, R.C., Morris, J.C., Rabins, P.V., Ritchie, K.,
Rossor, M., Thal, L., Winblad, B., 2001. Current concepts in mild cognitive impairment.
Archives of neurology 58, 1985-1992.
41) Petersen, R.C., Smith, G.E., Waring, S.C., Ivnik, R.J., Tangalos, E.G., Kokmen, E., 1999.
Mild cognitive impairment: clinical characterization and outcome. Archives of neurology 56,
303-308.
42) Rothwell, P.M., 2010. Limitations of the usual blood-pressure hypothesis and importance of
variability, instability, and episodic hypertension. The Lancet 375, 938-948.
43) Rothwell, P.M., Howard, S.C., Dolan, E., O'Brien, E., Dobson, J.E., Dahlöf, B., Sever, P.S.,
Poulter, N.R., 2010. Prognostic significance of visit-to-visit variability, maximum systolic
blood pressure, and episodic hypertension. The Lancet 375, 895-905.

ACC
EPTE
D M
ANU
SCR
IPT
ACCEPTED MANUSCRIPT
27
44) Rudas, L., Crossman, A.A., Morillo, C.A., Halliwill, J.R., Tahvanainen, K.U., Kuusela, T.A.,
Eckberg, D.L., 1999. Human sympathetic and vagal baroreflex responses to sequential
nitroprusside and phenylephrine. American Journal of Physiology-Heart and Circulatory
Physiology 276, H1691-H1698.
45) Rueckert, D., Sonoda, L.I., Hayes, C., Hill, D.L., Leach, M.O., Hawkes, D.J., 1999. Nonrigid
registration using free-form deformations: application to breast MR images. Medical Imaging,
IEEE Transactions on 18, 712-721.
46) Rusanen, M., Kivipelto, M., Levälahti, E., Laatikainen, T., Tuomilehto, J., Soininen, H.,
Ngandu, T., 2014. Heart Diseases and Long-Term Risk of Dementia and Alzheimer's
Disease: A Population-Based CAIDE Study. Journal of Alzheimer's Disease.
47) Schillaci, G., Bilo, G., Pucci, G., Laurent, S., Macquin-Mavier, I., Boutouyrie, P., Battista, F.,
Settimi, L., Desamericq, G., Dolbeau, G., 2012. Relationship between short-term blood
pressure variability and large-artery stiffness in human hypertension findings from 2 large
databases. Hypertension 60, 369-377.
48) Sexton, C.E., Kalu, U.G., Filippini, N., Mackay, C.E., Ebmeier, K.P., 2011. A meta-analysis
of diffusion tensor imaging in mild cognitive impairment and Alzheimer's disease.
Neurobiology of aging 32, 2322. e2325-2322. e2318.
49) Smith, S.M., 2002. Fast robust automated brain extraction. Human brain mapping 17, 143-
155.
50) Smith, S.M., Jenkinson, M., Johansen-Berg, H., Rueckert, D., Nichols, T.E., Mackay, C.E.,
Watkins, K.E., Ciccarelli, O., Cader, M.Z., Matthews, P.M., 2006. Tract-based spatial
statistics: voxelwise analysis of multi-subject diffusion data. Neuroimage 31, 1487-1505.

ACC
EPTE
D M
ANU
SCR
IPT
ACCEPTED MANUSCRIPT
28
51) Smith, S.M., Jenkinson, M., Woolrich, M.W., Beckmann, C.F., Behrens, T.E., Johansen-
Berg, H., Bannister, P.R., De Luca, M., Drobnjak, I., Flitney, D.E., 2004. Advances in
functional and structural MR image analysis and implementation as FSL. Neuroimage 23,
S208-S219.
52) Song, S.-K., Sun, S.-W., Ju, W.-K., Lin, S.-J., Cross, A.H., Neufeld, A.H., 2003. Diffusion
tensor imaging detects and differentiates axon and myelin degeneration in mouse optic nerve
after retinal ischemia. Neuroimage 20, 1714-1722.
53) Sun, S.-W., Liang, H.-F., Le, T.Q., Armstrong, R.C., Cross, A.H., Song, S.-K., 2006.
Differential sensitivity of in vivo and ex vivo diffusion tensor imaging to evolving optic
nerve injury in mice with retinal ischemia. Neuroimage 32, 1195-1204.
54) Tanaka, H., Dinenno, F.A., Monahan, K.D., Clevenger, C.M., DeSouza, C.A., Seals, D.R.,
2000. Aging, habitual exercise, and dynamic arterial compliance. Circulation 102, 1270-1275.
55) Tarumi, T., Khan, M.A., Liu, J., Tseng, B.M., Parker, R., Riley, J., Tinajero, C., Zhang, R.,
2014. Cerebral hemodynamics in normal aging: central artery stiffness, wave reflection, and
pressure pulsatility. Journal of Cerebral Blood Flow & Metabolism.
56) Tombaugh, T.N., 2004. Trail Making Test A and B: normative data stratified by age and
education. Arch Clin Neuropsychol 19, 203-214.
57) Tsao, C.W., Seshadri, S., Beiser, A.S., Westwood, A.J., Decarli, C., Au, R., Himali, J.J.,
Hamburg, N.M., Vita, J.A., Levy, D., Larson, M.G., Benjamin, E.J., Wolf, P.A., Vasan, R.S.,
Mitchell, G.F., 2013. Relations of arterial stiffness and endothelial function to brain aging in
the community. Neurology 81, 984-991.

ACC
EPTE
D M
ANU
SCR
IPT
ACCEPTED MANUSCRIPT
29
58) Vernooij, M.W., Ikram, M.A., Vrooman, H.A., Wielopolski, P.A., Krestin, G.P., Hofman, A.,
Niessen, W.J., Van der Lugt, A., Breteler, M.M., 2009. White matter microstructural
integrity and cognitive function in a general elderly population. Archives of General
Psychiatry 66, 545-553.
59) Wardlaw, J.M., Smith, E.E., Biessels, G.J., Cordonnier, C., Fazekas, F., Frayne, R., Lindley,
R.I., O'Brien, J.T., Barkhof, F., Benavente, O.R., 2013. Neuroimaging standards for research
into small vessel disease and its contribution to ageing and neurodegeneration. The Lancet
Neurology 12, 822-838.
60) Wechsler, D., 1987. Wechsler Memory Scale-Revised. Psychological Corp, New York.
61) Wentzel, C., Rockwood, K., MacKnight, C., Hachinski, V., Hogan, D., Feldman, H., Østbye,
T., Wolfson, C., Gauthier, S., Verreault, R., 2001. Progression of impairment in patients with
vascular cognitive impairment without dementia. Neurology 57, 714-716.
62) Young, V.G., Halliday, G.M., Kril, J.J., 2008. Neuropathologic correlates of white matter
hyperintensities. Neurology 71, 804-811.

ACC
EPTE
D M
ANU
SCR
IPT
ACCEPTED MANUSCRIPT
30
Figure Legends
Figure 1: Tract-based spatial statistic (TBSS) maps exhibit white matter (WM) fiber tracts with
fractional anisotropy (left) and radial diffusivity (right) that associated with carotid-femoral pulse
wave velocity (PWV) (top) and baroreflex sensitivity (BRS) (middle). The color bar illustrates
the directionality and P-value of the associations. The bottom images show spatial overlap of the
WM fiber tracts (green) that associated with both carotid-femoral PWV and BRS.
Figure 2: Tract-based spatial statistic (TBSS) maps exhibit white matter fiber tracts with
fractional anisotropy (left) and radial diffusivity (right) that associated with baroreflex sensitivity
(BRS), as assessed separately during hypotension (top) and hypertension (bottom). The color bar
illustrates the directionality and P-value of the associations.
Figure 3: Scatter plots show simple correlations of carotid-femoral pulse wave velocity (PWV)
(left) and baroreflex sensitivity (right) with fractional anisotropy (FA) (top) and radial diffusivity
(RD) (bottom). Mean values of FA and RD were extracted from the global WM skeleton that
associated with both carotid-femoral PWV and baroreflex sensitivity (see the bottom of Figure 1).
Figure 4: Scatter plots show simple correlations of fractional anisotropy (FA) (left) and radial
diffusivity (RD) (right) with the scores from the Trail Making Test B-A index. Mean values of
FA and RD were extracted from the global WM skeleton that associated with both carotid-
femoral PWV and baroreflex sensitivity (see the bottom of Figure 1).

ACC
EPTE
D M
ANU
SCR
IPT
ACCEPTED MANUSCRIPT
31
Table 1: Sample characteristics of all, cognitively normal, and MCI subjects
All Normal MCI P-value
Men/Women (n) 26/28 10/8 16/20 0.44
Age (years) 65 ± 6 65 ± 6 66 ± 7 0.59
Education (years) 16 ± 2 17 ± 2 16 ± 2 0.29
Height (cm) 170 ± 8 171 ± 9 170 ± 8 0.64
Body mass (kg) 80 ± 14 80 ± 16 80 ± 13 0.89
Body mass index (kg/m2) 27 ± 4 27 ± 4 28 ± 4 0.50
Neurocognitive measures
Mini-Mental State Exam 29 ± 1 29 ± 1 29 ± 1 0.46
CVLT Short Delay Free Recall 10 ± 3 11 ± 2 9 ± 2 <0.01
CVLT Long Delay Free Recall 10 ± 3 12 ± 2 10 ± 3 <0.01
Trail Making Test part A 28 ± 10 29 ± 11 27 ± 9 0.80
Trail Making Test part B 72 ± 25 62 ± 18 77 ± 26 0.01
Trail Making Test part B-A 44 ± 21 33 ± 16 49 ± 21 <0.01
Cardiovascular measures
Systolic BP (mmHg) 124 ± 14 125 ± 14 124 ± 14 0.82
Diastolic BP (mmHg) 74 ± 8 74 ± 9 74 ± 8 0.82
Heart rate (bpm) 61 ± 10 63 ± 10 60 ± 11 0.34
Carotid-femoral PWV (m/sec) 11.0 ± 2.7 11.2 ± 2.2 11.0 ± 2.9 0.54
BRS (ms/mmHg) 4.99 ± 2.33 5.09 ± 2.80 4.94 ± 2.10 0.91
Brain volumetric measures
Total grey matter volume (%ICV) 39.7 ± 2.4 40.3 ± 2.1 39.4 ± 2.6 0.23
Total white matter volume (%ICV) 34.7 ± 3.1 34.7 ± 2.3 34.7 ± 3.5 0.83
Medial temporal lobe volume (%TB) 1.62 ± 0.13 1.63 ± 0.13 1.62 ± 0.12 0.73
Hippocampus volume (%TB) 0.69 ± 0.08 0.69 ± 0.06 0.69 ± 0.09 0.93
Total WMH volume (%ICV) 0.27 ± 0.44 0.25 ± 0.39 0.29 ± 0.46 0.79
Bold: P-value<0.05 between normal vs. MCI subjects. Values are mean ± standard deviation.
BP=blood pressure, BRS=baroreflex sensitivity, CVLT=California Verbal Learning Test,
ICV=intracranial volume, MCI=mild cognitive impairment, PWV=pulse wave velocity, TB=total
brain volume, and WMH=white matter hyperintensity. %ICV and %TB represent brain volume
normalized to intracranial and total brain volumes respectively.

ACC
EPTE
D M
ANU
SCR
IPT
ACCEPTED MANUSCRIPT
32
Table 2: Multivariate adjusted relations of central artery stiffness and baroreflex sensitivity with
microstructural tissue integrity of global and regional white matter fiber tracts, as assessed by
fractional anisotropy
White matter regions Carotid-femoral PWV Baroreflex sensitivity
β ± SE P-value β ± SE P-value
Global white matter -0.37 ± 0.11 <0.01 0.39 ± 0.10 <0.001
Corpus callosum genu -0.29 ± 0.18 0.12 0.15 ± 0.15 0.32
body -0.90 ± 0.17 0.59 0.03 ± 0.14 0.86
splenium -0.32 ± 0.19 0.10 0.32 ± 0.16 0.049
Corona radiata anterior -0.13 ± 0.16 0.40 0.12 ± 0.13 0.37
superior -0.25 ± 0.19 0.20 0.20 ± 0.16 0.23
posterior -0.46 ± 0.15 <0.01 0.40 ± 0.13 <0.01
Internal capsule anterior limb -0.26 ± 0.15 0.10 0.14 ± 0.13 0.29
posterior limb -0.27 ± 0.14 0.07 0.06 ± 0.12 0.63
retrolenticular part -0.34 ± 0.18 0.06 0.32 ± 0.15 0.04
External capsule -0.19 ± 0.16 0.25 0.27 ± 0.14 0.053
Superior longitudinal fasciculus -0.32 ± 0.18 0.09 0.25 ± 0.15 0.10
Bold: P-value<0.05. The mean values of fractional anisotropy were extracted from the global
and regional white matter fiber tracts that associated with both carotid-femoral PWV and
baroreflex sensitivity (see the bottom left of Figure 1). All models adjusted for age, sex,
education level, systolic blood pressure, and total brain volume of white matter hyperintensity.
Total brain volume of white matter hyperintensity was log-transformed before entered in the
model. β=standardized regression coefficient, PWV=pulse wave velocity, and SE=standard
error

ACC
EPTE
D M
ANU
SCR
IPT
ACCEPTED MANUSCRIPT
33
Table 3: Multivariate adjusted relations of central artery stiffness and baroreflex sensitivity with
microstructural tissue integrity of global and regional white matter fiber tracts, as assessed by
radial diffusivity
White matter regions Carotid-femoral PWV Baroreflex sensitivity
β ± SE P-value β ± SE P-value
Global white matter 0.38 ± 0.12 <0.01 -0.39 ± 0.10 0.001
Corpus callosum genu 0.32 ± 0.17 0.07 -0.24 ± 0.14 0.10
body 0.31 ± 0.16 0.055 -0.12 ± 0.13 0.37
splenium 0.36 ± 0.18 0.055 -0.39 ± 0.15 0.01
Corona radiata anterior 0.30 ± 0.14 0.03 -0.30 ± 0.11 0.01
superior 0.28 ± 0.15 0.07 -0.28 ± 0.13 0.04
posterior 0.47 ± 0.15 <0.01 -0.32 ± 0.12 0.01
Internal capsule anterior limb 0.18 ± 0.17 0.29 -0.16 ± 0.14 0.25
posterior limb 0.24 ± 0.16 0.14 -0.04 ± 0.13 0.78
retrolenticular part 0.37 ± 0.17 0.03 -0.28 ± 0.14 0.047
External capsule 0.29 ± 0.16 0.07 -0.24 ± 0.13 0.08
Superior longitudinal fasciculus 0.38 ± 0.17 0.04 -0.23 ± 0.15 0.13
Bold: P-value<0.05. The mean values of radial diffusivity were extracted from the global and
regional white matter fiber tracts that associated with both carotid-femoral PWV and baroreflex
sensitivity (see the bottom right of Figure 1). All models adjusted for age, sex, education level,
systolic blood pressure, and total brain volume of white matter hyperintensity. Total brain
volume of white matter hyperintensity was log-transformed before entered in the model.
β=standardized regression coefficient, PWV=pulse wave velocity, and SE=standard error

ACC
EPTE
D M
ANU
SCR
IPT
ACCEPTED MANUSCRIPT
34
Figure 1

ACC
EPTE
D M
ANU
SCR
IPT
ACCEPTED MANUSCRIPT
35
Figure 2
ACC
EPTE
D M
ANU
SCR
IPT
ACCEPTED MANUSCRIPT
36
Figure 3

ACC
EPTE
D M
ANU
SCR
IPT
ACCEPTED MANUSCRIPT
37
Figure 4