discussion of: pricing in us retail chains · discussion of: uniform pricing in us retail chains by...
TRANSCRIPT
Discussion of: Uniform Pricing in US Retail Chains
by Stefano DellaVigna and Matthew Gentzkow
Emi NakamuraColumbia University

Motivation (in my mind):
• Lack of state contingency in pricing
Lack of State Contingency
• Price Rigidity–Restaurant prices remain unchanged for months–Consumer packaged goods have a lot of sales; but often return to identical levels following sales
–Why not index to the inflation rate
• Simple Contracts–Why isn’t there more state contingent contracting– Index wages to inflation, interest rates etc.

In the cross section: • Lemon‐Lime and Arctic Blitz Gatorade cost exactlythe same amount (McMillan, 2007)• Demand curves and costs are different• Leslie (2004): Similar facts for Broadway theater prices
• Many things (demand curve, competition, etc.) can affect how much prices should vary cross‐sectionally• But exactly the same in nominal terms• $1 in 2006 ≠ $1 in 2007; $1 in NY ≠ $1 in Minneapolis• Sales taxes vary across states!
• If it’s efficient, seems like a big coincidence.
Macro Models of Near‐Optimal Prices
• Simple adjustment cost models–Fixed cost of adjustment (“menu cost”)–Fixed probability of adjustment (“Calvo”)
•Mankiw (1985), Akerlof‐Yellen (1985):–Near‐optimal prices yield only second‐order profit losses to a monopolist
–CES, monopolistic competition
Near‐Optimal Prices: Implications for Macro• If prices adjust efficiently:– Recessions are mostly driven by supply shocks (e.g. productivity) as opposed to demand shocks (e.g., animal spirits, household wealth etc.)
–So government policy response typically isn’t justified
–Also, fiscal and monetary policy don’t do much (because they are also demand shocks)
• Not true if prices adjust sluggishly(Keynesian economics)
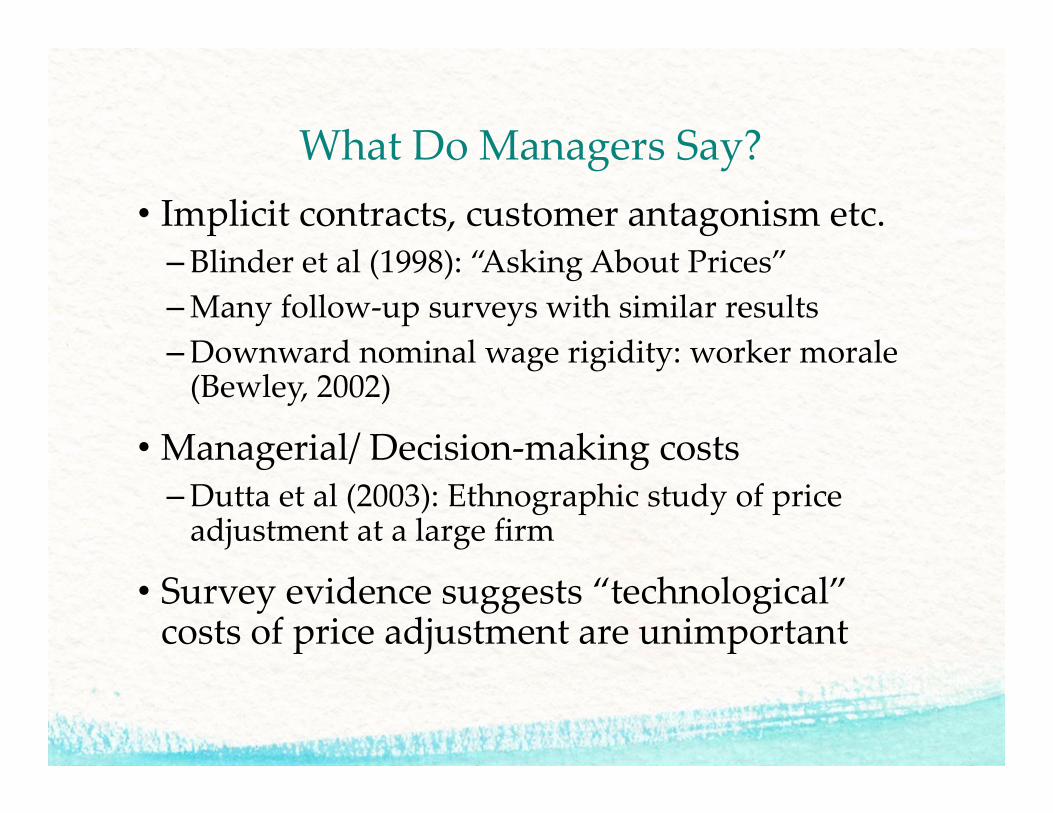
What Do Managers Say?• Implicit contracts, customer antagonism etc.–Blinder et al (1998): “Asking About Prices”–Many follow‐up surveys with similar results–Downward nominal wage rigidity: worker morale (Bewley, 2002)
•Managerial/ Decision‐making costs –Dutta et al (2003): Ethnographic study of price adjustment at a large firm
• Survey evidence suggests “technological” costs of price adjustment are unimportant
This Paper
Two provocative elements: 1. Very (?) sub‐optimal pricing2. Estimating demand curves with OLS
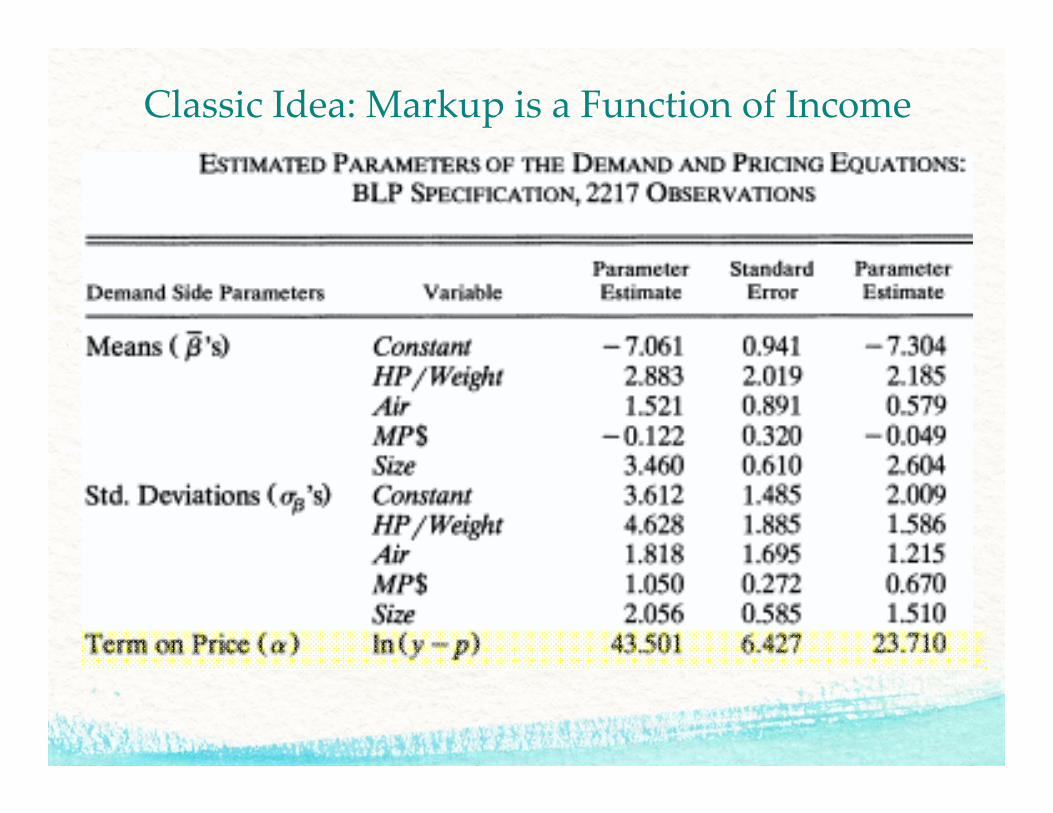
Classic Idea: Markup is a Function of Income
• E
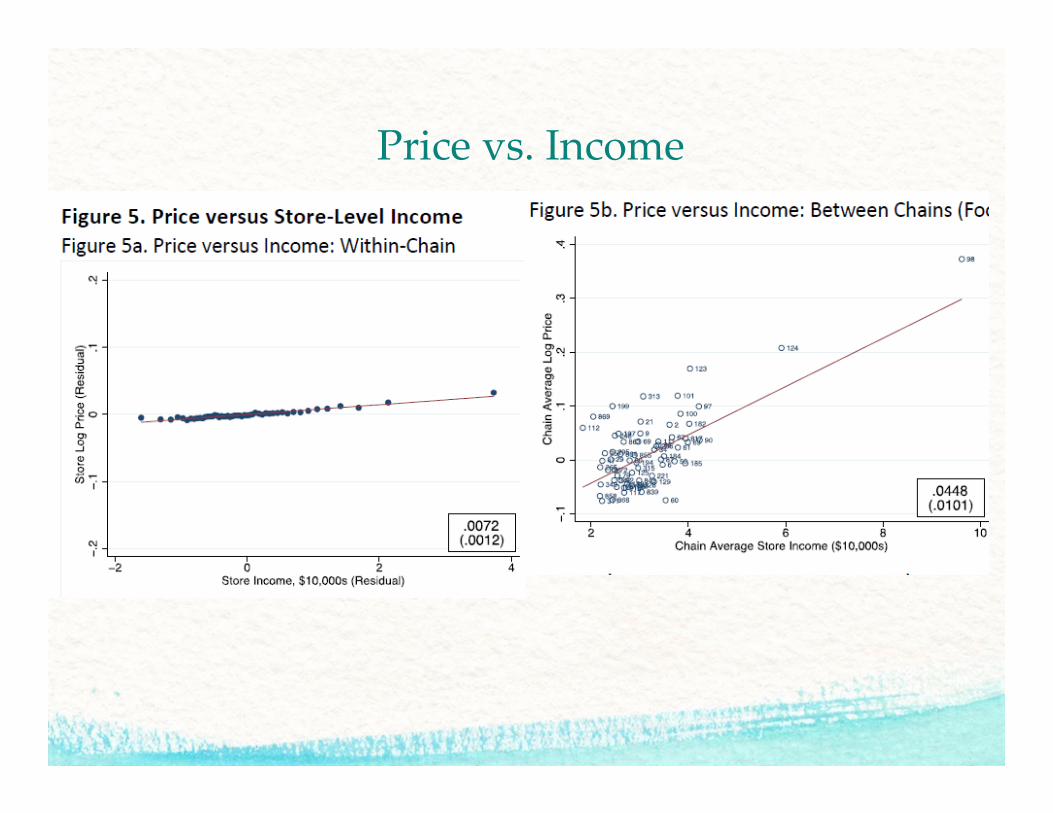
Price vs. Income
How Suboptimal?• Big (implausible) coincidence that identical prices are exactly optimal
• “How” sub‐optimal? Need a model for that.
•Many more assumptions required–Demand–Market structure–Costs
• This paper: Monopolistic competition, CES–Avoids having to specify “outside option”

Many Possible Questions–Monopolistic competition vs. Oligopoly–CES vs. Discrete choice –Are costs really the same across markets?(Wages, Implicit rent presumably lower)
–Is competition really the same across markets?
(Many robustness checks, but hard to be watertight)
One Challenge: What is Marginal?• Real estate prices lower in low income places
• Della Vigna and Gentzkow argue this shouldn’t affect marginal costs much since this is a small fraction of marginal costs
• Depends on the definition of “marginal”–You need a bigger store to sell more stuff– Space is fixed at high frequencies but variable at low frequencies
– (P‐MC/P) is approx. 30‐50% but profits (excluding overhead) are an order of magnitude less
Profit Loss Estimates
How much money is on the table?
• Profit losses are 7% of profits
• Equivalent to 0.35% of revenue
Is this big or small?
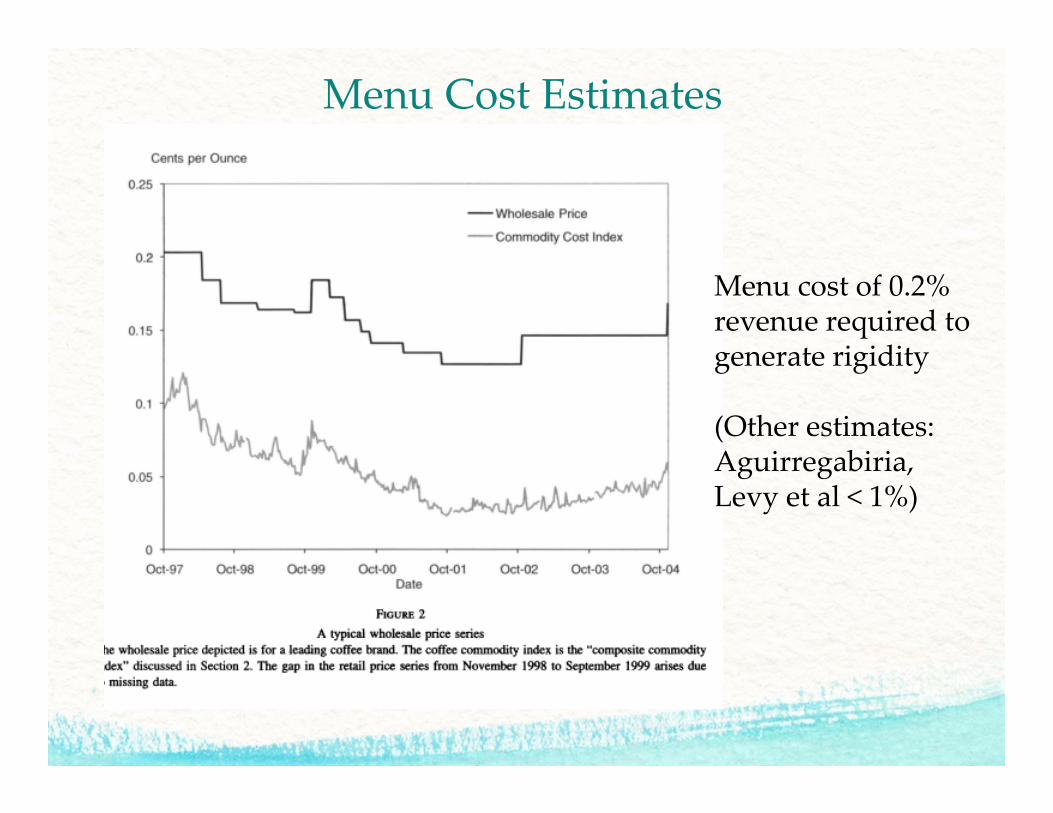
Menu Cost Estimates
Menu cost of 0.2% revenue required to generate rigidity
(Other estimates: Aguirregabiria, Levy et al < 1%)
Profit Loss Estimates: Interpretation• Menu cost <1% revenue often framed as “second order” in macro literature
• Large relative to “technological” costs of price adjustment – Safeway had $36bn in revenue (2015): 0.35% is $100m per year
• But survey/ethnographic evidence doesn’t suggest technological factors are important– And there’s no evidence that firms with higher average store sales have more flexible prices(As one would expect with fixed absolute cost)
– Suggestive of customer/managerial explanations, which might scale with size
Customer Antagonism: ZaraCarvalho et al. (QJE, 2014)• Zara prices are identical across countries within the Euro area – Despite massively different incomes etc.
• But different for Denmark– Denmark has a different currency– But a strong peg vs. Euro– So why does this matter?
Perhaps consumers are offend by “obvious” price discrimination (when currency is the same)
Do Profit Losses Pass Smell Test?
• Large “money” on the table might imply firms with more flex prices more profitable–Plausible biases would tend to overstate profit benefits of flexibility
– “Smart” firms have more flexible prices
• Not in the data–Perhaps hard to detect statistically?– 0.3% is small relative to annual standard deviation of revenues
–Or perhaps negative long‐run effects of non‐uniform pricing?
Selected Sample• One might worry about how general the phenomenon studied in this paper
•Main sample: one UPC from canned soup, cat food, chocolate, coffee, cookies, soda, bleach, toilet paper, yogurt and orange juice
• Goal: avoid selection due to stockouts–But could worry the results aren’t general
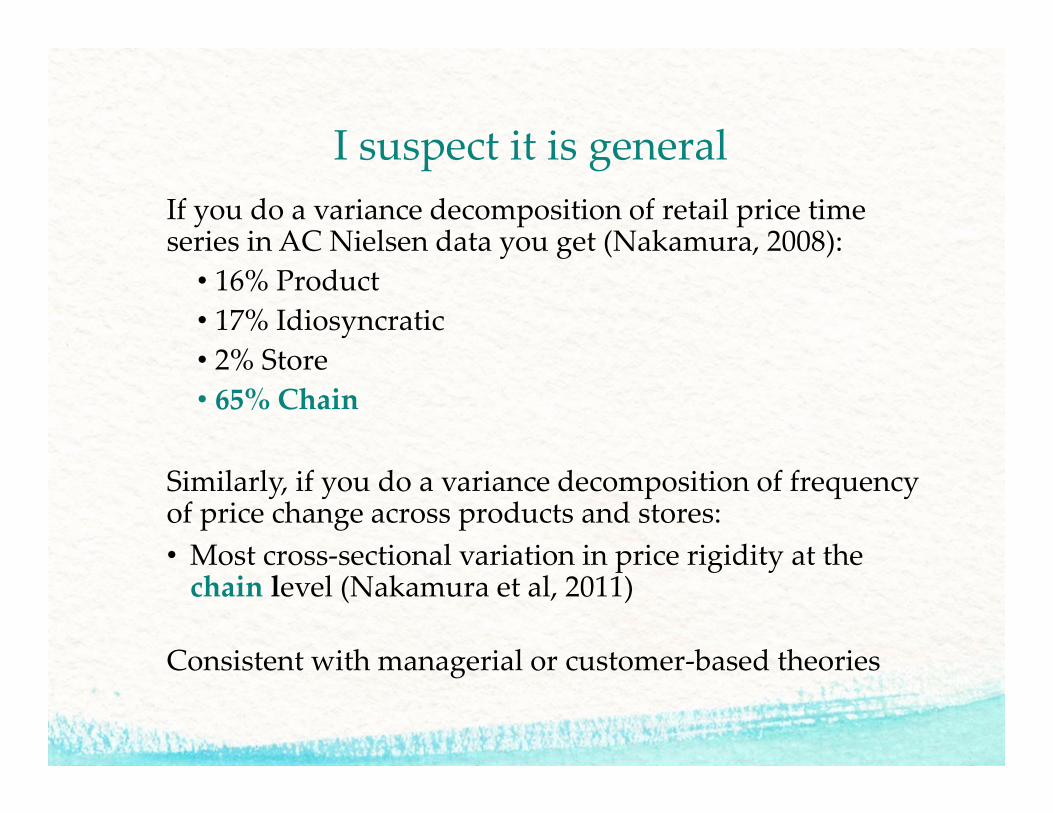
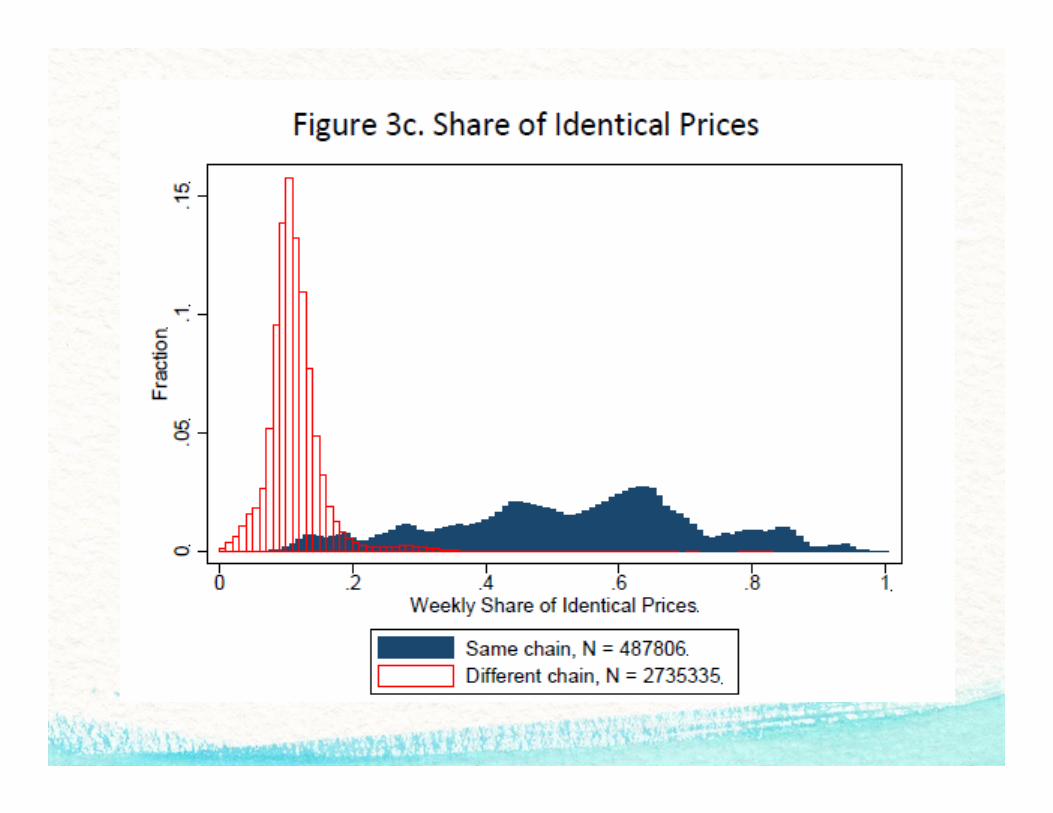
I suspect it is generalIf you do a variance decomposition of retail price time series in AC Nielsen data you get (Nakamura, 2008):• 16% Product• 17% Idiosyncratic • 2% Store• 65% Chain
Similarly, if you do a variance decomposition of frequency of price change across products and stores:• Most cross‐sectional variation in price rigidity at thechain level (Nakamura et al, 2011)
Consistent with managerial or customer‐based theories

Contributions
Two provocative elements: 1. Very (?) sub‐optimal pricing2. Estimating demand curve with OLSDidn’t I learn in undergrad I wasn’t allowed to do this?
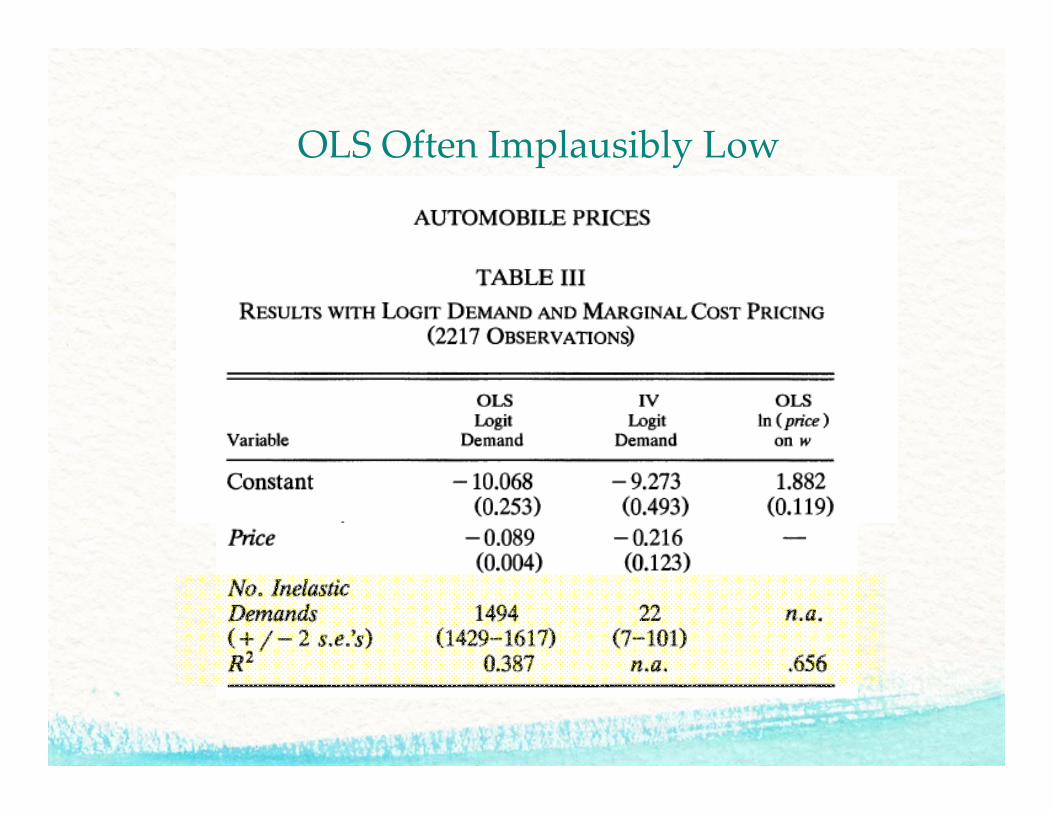
OLS Often Implausibly Low
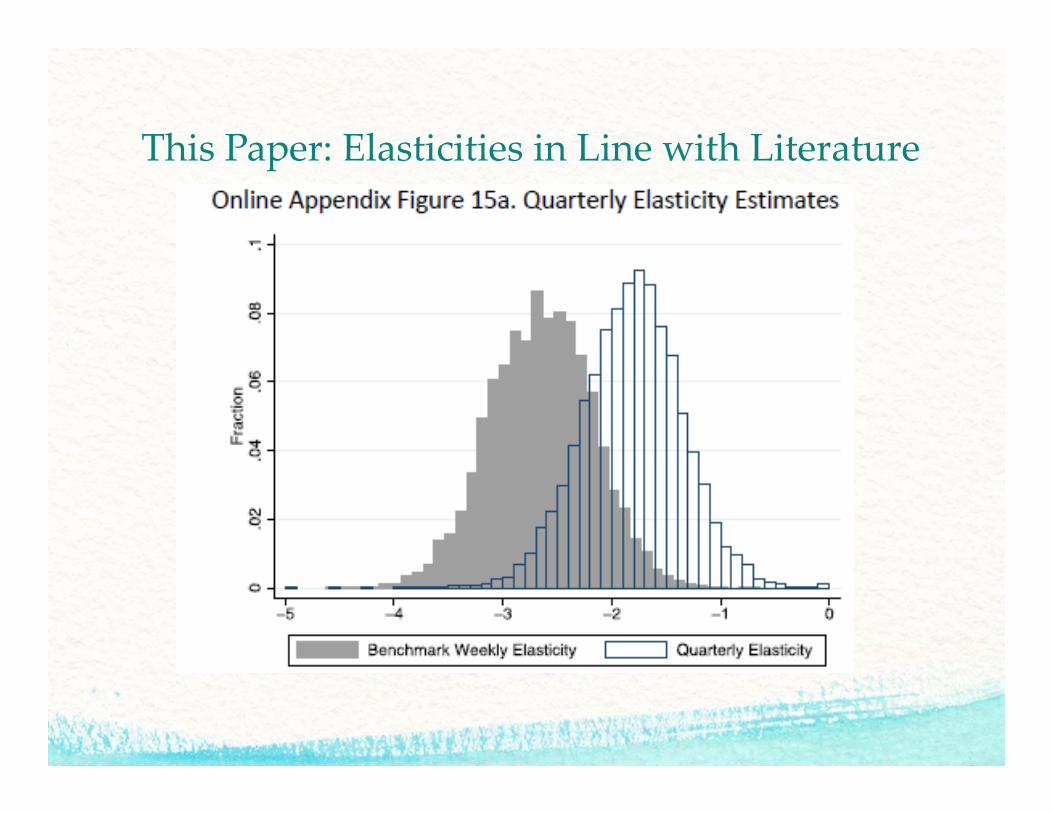
This Paper: Elasticities in Line with Literature
Why might OLS Work?• Price variation is from time series (vs. focus on cross‐section in much of the literature)
•What causes price fluctuations?– Sales occur continuously as opposed to being bunched on e.g. Superbowl
–Unlikely to be preference/productivity shocks– Suppose they are essentially random (e.g., Varian model of sales)
• High frequency price variation reflects supply shocks
Potential Bias: Stockpiling
–Demand responses to “sales” dominated by stockpiling (Hendel and Nevo, 2006)
•Could lead elasticities to be too high

Monthly vs. Quarterly
Lower Elasticities Raise Profit Losses•Might have thought higher elasticity would raise profit losses from sub‐optimal prices• Pricing “errors” more costly
•Actually goes the opposite direction!• Lower elasticity implies bigger variation in optimal prices• This effect dominates
• Profit losses are much larger for parameterizations with lower elasticities(sometimes uncomfortably so)
Conclusion• Fascinating, important paper• Deeply related to macro and international literature on price rigidity
• Exactly identical prices hard to explain exceptby some kind of pricing friction
• Quantitative estimates depend on functional firm of demand, market structure etc.
• OLS to estimate demand curves with high frequency time series data–Does not yield inelastic demand