disclaimer: the contents of this report reflect the...
TRANSCRIPT

Micropiles
Principal Investigator: Professor Richard Finno A final report submitted to the Infrastructure Technology Institute for TEA-
21 funded projects designated A433, and A495 DISCLAIMER: The contents of this report reflect the views of the authors, who are responsible for the facts and accuracy of the information presented herein. This Document is disseminated under the sponsorship of the Department of Transportation University of Transportation Centers Program, in the interest of information exchange. The U.S. Government assumes no liability for the contents or use thereof.

Evaluation of Capacity of Micropiles Embedded in Dolomite
A Final Report to the Infrastructure Technology Institute
by:
Professor Richard J. Finno Department of Civil and Environmental Engineering
Northwestern University
September 20, 2002

3
Table of Contents Acknowledgements 4 1.0 Introduction 5 2.0 Technical Background 6
2.1 Design Methods 6 2.2 Design Considerations 8 2.3 Typical Load Test Data 9 2.4 Summary 11
3.0 Axial Load Test Section 12
3.1 Overview 12 3.2 Rock Conditions 13 3.3 Instrumentation 15 3.4 Testing Procedures 15
4.0 Results of Axial Load Tests 16
4.1 Axial Load Deflection Response 16 4.2 Axial Load Transfer 18 4.3 Unit Side Resistance 23
5.0 Discussion of Results 26
5.1 Computed Design Loads and Observed Capacities 26 5.2 Comparison of Results with Full Scale Load Tests 27 5.3 Suggested Design Approach 27
6.0 Conclusions 29 Appendix A1

4
Acknowledgements This study was supported by funds from a grant from the Infrastructure Technology Institute (ITI) of Northwestern University and from the contributions of TCDI. The efforts of Messrs. Steven Scherer and Jeff Hill of TCDI to ensure the success of the work are greatly appreciated. Messrs. Charles A. Sanders and Hamilton White of Vulcan Materials Corp. of McCook, IL provided access to the quarry floor. Mr. Jim Rupert of O.C.I. Division, Global Drilling Suppliers Inc. of Brookville , PA, generously supplied micropile casing and bits at no cost to the project. Mr. Joseph Wiedemann of DYWIDAG Systems of Bollingbrook IL. provided anchor materials at cost. The authors also appreciate the continuing support of Mr. David Schulz, the Director of ITI.
DISCLAIMER The contents of this report reflect the views of the authors, who are responsible for the facts and the accuracy of the information presented herein. This document is disseminated under the sponsorship of the Department of Transportation, University Transportation Centers Program, in the interest of information exchange. The U.S. Government assumes no liability for the contents or use thereof.

5
1. Introduction Micropiles socketed in rock are used in the Chicago area for rehabilitation work for infrastructure systems. They differ from many micropiles in that they are designed based on end-bearing rather than interface shear. There are no specially-created procedures for designing micropiles socketed in rock. Their axial capacities typically are determined either on the basis of provisions in building codes not specifically related to micropiles or conventional design methods for drilled shafts. The capacity of a micropile socketed in rock is selected as either a conservative estimate of structural capacity or its end bearing capacity neglecting the shearing resistance along its side. Results of a number of field axial load tests indicate the load deflection responses are essentially linear to code-specified design loads, suggesting the true capacity of the piles are significantly higher than currently-allowed values. In conjunction with TCDI–a Division of Hayward Baker of Lincolnshire, IL, Northwestern University conducted four axial load tests on micropiles embedded in the Vulcan quarry of Countryside, IL. The dolomite in the quarry was directly accessible and allowed evaluation of the friction at the interface of the micropiles with the rock, without the need to drill through deep deposits of overlying soil. Strain gages were installed on the steel pipes and embedment strain gages were installed in the grout to study the load transfer during the testing. Chapter 2 briefly summarizes design procedures for micropiles in rock and presents typical axial load-deflection data from test micropiles. Chapter 3 describes the axial load test section, including rock conditions encountered at each test pile, instrumentation in the piles and testing procedures. Chapter 4 presents the load test results in terms of load-deflection curves, axial load distribution and mobilized side friction data. Chapter 5 discusses the results in light of conventional design procedures and suggests a different approach for designing these foundation elements. Chapter 6 presents the conclusions. The Appendix includes details of the testing program and the data collected during the axial load tests.

6
2. Technical Background Micropiles have been used in Europe since the 1950s as a foundation element in infrastructure rehabilitation projects. Their use in the United States has become popular in the last decade. There are many types of micropiles, generally classified by their installation procedure. The micropiles that are the subject of this work are shown in Figure 2.1 and consist of small-diameter steel pipes, installed in slightly oversized holes, grouted for their full length, and seated in rock. The tread bar is not usually included in compression members. These piles have proven to be an excellent choice for structural underpinning where there are challenges posed by limited access or headroom, environmental constraints including the avoidance of piling-induced vibrations, and the need to provide high load bearing capacity with minimal deflection. These constraints are very common in infrastructure rehabilitation projects.
Figure 2.1. Detail of a micropile rock socket
Whereas the design of a conventional pile is normally governed by the external (i.e. ground related) carrying capacity, micropile design is frequently controlled by the internal design (i.e. the selection of the pile components). These circumstances arise from the relatively small cross-section, and the high grout/ground bond capacities that can be mobilized as a consequence of the micropile installation. Most micropiles transfer their load to the ground through side friction; the piles under consideration in this proposal are founded on rock, and hence much of the existing work concerning the capacity of micropiles is not applicable. As will be shown later, the capacities of micropiles founded on rock in the Chicago area (and, in general, for micropiles tipped in competent rock) are very conservatively computed with conventional design methods. Consequently there is a need to better understand the load transfer mechanisms involved as the micropile is loaded to failure. Once one understands these mechanisms, a more realistic design method for the micropiles to rock can be developed. 2.1 Design methods There are several design methods or building code requirements that can be applied to micropiles founded on rock. These include procedures found in the Chicago Building Code, the

7
Massachusetts Building Code, the Canadian Manual on Foundation Engineering, and an analytical procedure for computing capacity of piles in rock found in a textbook by Goodman (1980). The Codes specify that the capacity of the micropile is limited by the stresses in the foundation element (i.e, the structural capacity) and the latter two methods are based on the capacity of the rock. Chicago Building Code The Chicago Building Code restricts the capacity of micropiles on the basis of a structural limit computed using allowable stress design assuming the pile is a concrete-filled steel pipe. The allowable load, Pa, is defined by:
scca AAfP 0.124.0 ' += (2.1)
where f΄c is the compressive strength of concrete, and Ac and As are the cross-sectional area of the concrete and steel, respectively.
Massachusetts State Building Code The Massachusetts State Building Code also restricts the capacity of micropiles on the basis of a structural limit computed using allowable stress design. According to this code, Pa is:
sycca AfAfP 4.033.0 ' += (2.2)
where fy is the yield strength of steel. The code further limits the allowable stresses to:
)(33.0
)(4.0' concretef
steelf
c
y (2.3)
These allowable stresses are applicable to small diameter grouted piles. Canadian Manual of Foundation Engineering The approach advocated in the Canadian Manual is based on the bearing capacity of the rock, and is calculated as:
gus
sspa AQ
D
LkP
+= 4.01 (2.4)
where Ls is the length of the pile socketed into rock, Ds is the diameter of the rock socket, Qu is the unconfined compressive strength of the rock, Ag is the gross area of the micropile, and ksp in an empirical bearing capacity factor that depends on the spacing of the discontinuities of the rock. Values of ksp for various discontinuity spacing are:

8
mthangreaterspacingsfor
mtoofwidthspacingfor
mtoofwidthspacingforksp
34.0
3125.0
0.13.01.0
==
=
(2.5)
Note that the term in the brackets in equation (2.4) is a depth term for bearing capacity and does not explicitly account for any side friction between the micropile and the rock. Goodman Approach The approach advocated by Goodman (1980) is also based on the bearing capacity of the rock, and is calculated as:
gu
a AFS
QP
++= 1)
245(tan 2 φ
(2.6)
where FS is the factor of safety, taken as 2 to 3, and φ is the angle of friction of the rock mass. This equation assumes that the rock failure is adequately described by a Mohr-Coulomb failure criteria. This approach also does not explicitly account for any side friction between the micropile and the rock.
Equations (2.4) and (2.6) were developed for larger diameter drilled shafts and may not be applicable to these smaller diameter micropiles. The structural capacity of a micropile could also be determined using load resistance factor design (LRFD) method developed by AISC. This is an ultimate strength design method, in contrast to the allowable stress design described by the two codes. 2.2 Design Considerations The axial capacity of a micropile is taken as the smallest of the buckling load, internal structural column resistance, or the resistance provided by the soil and rock in which the pile is founded. Buckling is only a design consideration when portions of the pile are unsupported and will not be considered herein. Service load design approaches related to the structural column capacity of a micropile can be summarized by:
Pallow = α × f 'c × Agrout + β × fy x A steel (2.7) where α and β are reduction factors to limit the mobilized stresses in the piles to acceptable levels. Values of α and β are summarized in Table 2.1 for methods that have been used to define the allowable capacity of grout-filled steel casings used as micropiles. Table 2.1 shows a wide range of allowable axial loads computed by these different methods for a typical micropile. The dimensions used for the piles are those of the test piles subsequently described herein: 178-mm-

9
diameter micropile with13-mm-thick walls with 550 MPa yield stress filled with a grout that has a compressive strength of 38 MPa.
Table 2.1. Allowable Loads for the Test Micropile Based on Service Load Designs
Method fy max (MPa) α β Allowable Load (kN)
AASHTO (Service load design) 550 0.4 0.47 2000 Chicago Building Code 200 0.4 0.4(1) 900
Massachusetts Building Code 410 0.33(3) 0.4(2) 1400
Notes: 1. β fy is limited to 200 MPa. 2. β fy is limited to 410 MPa. 3. α f´c is limited to 11 MPa. The major reason for this wide range is the specified maximum value for the yield stress in steel varies from fy-max of 200 MPa in the Chicago Building Code to 550 MPa in the AASHTO specifications. Because of the large proportion of load supported by the steel in these types of micropiles, different grades of steel or code-specified fy values introduce large differences in the allowable load of the micropile. It is clearly over conservative to use a limit stress of 200 MPa for a steel that has a yield point of 550 MPa, yet these restrictions exist in parts of the US. A low fy value is not applicable to most micropiles because of the high grade of steel generally used for casing and rebars. Micropiles have a high ratio of perimeter to cross-sectional area. When a micropile consists of a deformed rebar surrounded by grout, the limiting soil-micropile interface is generally a grout-ground bond. Consequently, most conventional micropile design methods consider the load transfer at the grout-ground interface and neglect the end-bearing capacity, which can be negligible due to the small pile diameter. However, for micropiles consisting of steel casing socketed in rock, it is usually assumed the piles are completely end-bearing and all load transfer due to side friction is neglected. Therefore, nearly all the existing micropile literature concerning design is not applicable to these tests.
Designs of micropiles socketed in rock typically are adaptations of the design for drilled shafts or driven piles on rock. For example, FWHA (2000) indicate moderately loaded micropiles have been designed for end bearing on rock. They suggest that the design is similar to end bearing drilled shafts or driven piles, or may be based on previous load test experiences of similar piles. 2.3 Typical Load Test Data Figure 2.2 illustrates the axial load – deflection response of a micropile founded in dolomite in the Chicago area. The test pile was 30 m long and consisted of a 178-mm-diameter casing with a wall thickness of 13 mm and a yield stress of 550 MPa. The casing was filled with 35 MPa grout and had a 35 mm diameter DSI threadbar with a yield stress of 1035 MPa placed in

10
its center. It was socketed o.6 m into the dolomite. The pile was designed for an allowable axial load of 890 kN.
Figure 2. Typical axial load test result
As can be seen in Figure 2.2, the load deflection response is almost linear to twice the design load, or 1780 kN (400 kips). Upon unloading, the net permanent displacement at the pile head was 2.2 mm (0.147 inch). These data suggest that most of the axial load was resisted elastically by the pile, and that no signs of failure were observed in the test. Therefore the ultimate load was not defined and was greater than 1780 kN (400 kips). Table 2.2 shows the estimated allowable load based on the four methods described previously. Given that the pile was tested to 400 kips with essentially elastic behavior, there is no way to determine the appropriateness of the design values.
Table 2.2. Computed allowable loads for test pile
Method Allowable load – kN (kips) Chicago Code 1180 (265)
Massachusetts Code 1450 (325) Canadian Foundation Manual 1280 (287)
Goodman 1140 (256)

11
2.4 Summary A review of existing data suggests that there are two major issues that must be addressed in an experimental program to study axial capacity of micropiles in rock Axial load tests on micropiles to rock have not been carried to failure such that one can evaluate whether the failure is caused by a structural failure of the system, or a failure of the supporting rock mass. If it is the former, then one must identify the failure mechanism of the composite micropile and compare the results with the structural design approaches, such as that given by the Chicago and Masssachsetts Building Codes. If it is the latter, then one must determine the most appropriate method to compute the bearing capacity of the supporting rock mass. The most common methods used to estimate capacity (equations 2.4 and 2.6) were developed for large diameter shafts, and likely are not strictly applicable for the smaller diameter micropiles. Load transfer in the rock along the side of the micropile. This is assumed to be zero in conventional design. Referring to Figure 2.1, this shearing resistance will only develop if there is adequate friction developed at the interfaces between (a) the central reinforcing bar and the grout in the annulus (this rebar is generally not used for compression members), (b) the grout in the annulus and the 178 mm casing, (c) the 178 mm casing and the grout between the casing and the rock, and (d) and the grout between the casing and the rock and the rock itself. Previous experience with axial load testing of drilled shafts has suggested that shearing resistance can be developed at the interfaces described by (a) and (d). The grout interfaces with the 178 mm casing, (b) and (c), must be adequate if appreciable side resistance will be generated in the rock. The qualities of these interfaces are a function of the drilling techniques used to socket the anchor in the rock.

12
3. Axial Load Test Section To allow one to rationally design micropiles founded in rock, one must conduct load tests to failure. The load testing program was designed to provide enough data to evaluate the load transfer characteristics along the side of a rock socket and the end bearing capacity of a micropile in rock characteristic of the conditions in the metropolitan Chicago area. These findings should be sufficiently general so that they would be applicable to other rock conditions. 3.1 Overview Northwestern University conducted four axial load tests on micropiles embedded in the Vulcan quarry of Countryside, south of Chicago. The dolomite on the quarry floor was directly accessible and allowed direct evaluation of the friction at the interfaces of the micropiles with the rock, without interference from overlying soil. Strain gages were installed in the steel pipes to study the load transfer during the load testing. The test section consisted of 9 tension anchors that provided reactions for the axial loading of 4 test micropiles. The reaction frame is shown in Figure 3.1. Production micropiles for end bearing on competent rock are installed in the Chicago area by drilling directly into the rock using a tri-cone roller bit attached to the bottom of
Figure 3.1. Reaction Frame for Axial Load Tests
Reference frame
Tension anchors
ck
Swivel plate
Micropile
Loading chair
Dial gages

13
drilling casing, filling the casing with grout, and pressurizing the grout within the casing until return is observed through the annulus. It was felt this procedure would have destroyed strain gages attached to the inside of the steel casing, and thus a different procedure was following to install the test micropiles. The holes for the micropiles were drilled with water with a 190-mm-diameter tri-cone, and the assembled micropile was placed into the completed hole. Grout then was tremied into the bottom of the pile, and pressurized from the top of the micropile to force the grout through openings in the bottom of the roller bit and up along the sides of the augered holes. This pressure never exceeded 140 kPa because of the short length of the piles. For each test, the axial load on the pile was transferred via the frame shown in Figure 3.1 to four tension anchors with a design capacity of 1110 kN. Each anchor was embedded 6 m in the ground. The bottom 4.5 m of the anchor pile were grouted and the remaining 1.5 m were left unbonded. Four micropiles were tested in axial compression. They consisted of 178-mm-diameter, 13-mm-thick, high strength steel tubes filled with grout. The lengths of the micropiles were 0.61, 1.22, 1.83 and 2.44 m. In addition, each pile had a free length of 300 mm at the top, and a 200-mm-high tri-cone drilling bit welded to the bottom of the steel casing. At each test pile location, a 3 m long rock core was recovered after the axial load test. Unconfined compression tests conducted on grout specimens on the same day the axial load tests were performed indicated the average unconfined compression strength was 42.7 MPa and with a Young’s modulus of 8180 MPa. Stress-strain curves for the grout are presented in the Appendix. After testing, two of the test piles were extracted by overcoring a 300 mm hole around the pile so that the conditions of the grout interfaces could be examined. 3.2 Rock Conditions
Detailed logs of cores obtained at each test pile location are shown in the Appendix. The conditions of the dolomite at each test pile are shown in the photos given in Figure 3.2. In spite of their proximity to one another (test pile to test pile spacing was 3 m), the rock quality at the locations of micropiles 3 and 4 was significantly higher than that at micropiles 1 and 2. Micropile 1 was drilled through highly weathered rock, and was seated on fractured rock with a RQD of 22. Micropile 2 was drilled through and was seated on highly fractured rock with a RQD of 0. Micropile 3 was founded in moderately fractured to massive rock, crossed with a near vertical joint, and was tipped in rock with an RQD of 87. Micropile 4 was drilled through moderately to highly fractured rock, and seams in this zone were filled with grout from the installation process. The last meter of micropile 4 encountered sound rock, with a RQD of 85. To investigate the development of side resistance, the last 150 mm of this cored hole was filled with loose cuttings so the end bearing for pile 4 would be negligible.

14
Figure 3.2. Dolomite at Test Pile Locations
Micropile 1 0-3.05 m
Micropile 2 0-3.05 m
Micropile 3 0-3.05 m
Micropile 4 0-3.65 m
TToopp
BBoottttoomm
BBoottttoomm
TToopp
BBoottttoomm
TToopp
BBoottttoomm
TToopp

15
Intact specimens of dolomite were obtained from the rock cores and tested in the laboratory. The test results are presented in the Appendix. Results of four uniaxial compression tests indicated the unconfined compression strength varied from 69 to 95 MPa and averaged 85 MPa. The Young’s modulus of these specimens ranged from 20 to 24 GPa and averaged 21.7 MPa. Results of eight tensile point load tests indicated the tensile strength of the intact dolomite varied from 7.0 to 7.9 MPa and averaged 7.6 MPa. Based on Deere’s classification system, the intact dolomite is a medium strength rock with an average modulus ratio.
3.3 Instrumentation A total of twenty weldable, vibrating wire strain gages were attached inside the steel casing of the four micropiles before they were installed. Instrumentation details are presented in the Appendix. The strain gages were installed in pairs and each had its pickup sensor shaved to match the curvature of the inside diameter of the steel pipes. The micropiles consisted of segments of 610 mm long, threaded tubes to allow access to the inside of the pipe to attach the gages. Embedment strain gages were installed on the telltale tubes in micropiles 3 and 4 at the same depth as the last level of weldable strain gages. Two telltale tubes were installed in each micropile. The holes for the micropiles were made with a 190-mm-diameter tri-cone bit using water as the drilling fluid. After the casing was assembled and placed in the hole, the cables of the strain gage sensors were pulled to the outside of the pile through a hole drilled at the top of each pile. The assembled micropiles were placed in the completed hole and grouted. The grout was tremied in the pile, then pressurized to force the grout through holes in the bottom of the roller bit and up along the sides of the augered holes. This pressure was never more than 140 kPa because of the short length of the piles. Grout samples from each micropile were on tested the same day as the test was conducted on that micropile.
3.4 Testing Procedures The loading system, shown in Figure 3.1, consisted of a frame of three beams supported by anchors. A hydraulic loading jack applied the axial load through a swivel plate and a load chair. Three dial gages measured the displacement of the load chair, two dial gages measured telltales deformations from a reference frame. An electronic load cell was used to calibrate the readings from the hydraulic jack. For each test, the axial load on the pile was transferred via the frame to four tension anchors with a design capacity of 1110 kN. Each anchor was embedded 6 m in the ground. The bottom 4.5 m of the anchor pile were grouted and the remaining 1.5 m were left unbonded. The axial load was increased in increments of 220 kN. Each load was maintained for 5 minutes to allow any time-dependent movement to occur. Unloading was accomplished in 445 kN decrements. Strain gage and telltale data were collected at each load increment.

16
4. Results of Axial Load Tests Load displacement and strain displacement data collected during the load tests are presented in the Appendix. 4.1 Axial load deflection responses Figure 4.1 shows the load-deflection responses at the pile head and tip for micropiles 1 and 3. These piles were loaded to 4450 kN without exhibiting a plunging failure. An unload-reload cycle was included for micropile 1. In the first cycle, the electronic load cell was placed in series with the hydraulic jack to check the jack calibration. This load cell capacity was limited to 2225 kN, so the first loading stopped at 2000 kN. After unloading, the load cell was removed and the axial load was increased to 4450 kN, the estimated safe limit of the anchor system. The tip deflection is smaller for micropile 3 (1.6 mm at 4450 kN) than for micropile 1 (10 mm at 4450 kN), and reflects the difference of the rock quality at the bottom of each pile. The RQD of the dolomite under the tip of micropile 3 was 87, whereas the RQD of the highly weathered dolomite below the tip of micropile 1 was 22.
Micropile 3-20
-18
-16
-14
-12
-10
-8
-6
-4
-2
00 1000 2000 3000 4000 5000
Load (kN)
Def
lect
ion
(mm
)
Tip deflection from telltales
Head deflection
Micropile 1-20
-18
-16
-14
-12
-10
-8
-6
-4
-2
0
0 1000 2000 3000 4000 5000Load (kN)
Def
lect
ion
(mm
)
Tip deflection from telltales
Head deflection
Davisson failure line
Elastic line
Figure 3 - Axial load-deflection curve of the micropiles 1 and 3
Elastic line
Davisson failure line
Figure 4.1. Axial Load vs. Deflection for Micropiles 1 and 3
According to Davisson’s definition of failure, micropile 1 failed at 4000 kN, but micropile 3 had not yet failed. Figure 4.2 shows the axial load-deflection curves for micropile 2. The head of this pile began to move significantly when the axial load exceeded 500 kN. According to Davisson’s criteria,

17
failure during this first loading cycle occurred at a load of 800 kN. The pile was unloaded at 1335 kN to reset the dial gages. Upon reloading, the pile did not show signs of a plunging failure. According to Davisson’s failure criteria, the pile failed at 2000 kN during the second cycle of load. The test was stopped at 3560 kN when the loading chair exhibited signs of distress.
-40
-35
-30
-25
-20
-15
-10
-5
0
0 500 1000 1500 2000 2500 3000 3500 4000
Load (kN)
De
flec
tion
(m
m)
Tip deflection from telltale
Head deflection
Elastic line
Davisson failure line
Figure 4.2 Axial Load vs. Deflection for Micropile 2
Micropile 2 exhibited a different response than micropiles 1 and 3. The load-deflection curves show the tip and the top moved together during the first load. In this case, the highly weathered rock (RQD = 0) beneath the pile tip compressed significantly as the axial load was applied, yet the pile did not plunge during the second loading. Rather, the pile tip deflection increased slowly during the reloading part to 1100 kN, whereupon the material beneath the tip began to respond as if loaded in constrained compression; that is the material became stiffer with increasing load.
The load-deflection responses of micropile 4 are shown in Figure 4.3. This pile plunged abruptly at 2000 kN. The tip of the pile did not deform until the plunging load was attained, and the pile head deflection was essentially equal to the elastic compression of the pile. This plunging failure was expected because of the loose cuttings placed beneath the tip of this pile.

18
-15
-12
-9
-6
-3
0
0 500 1000 1500 2000 2500Load (kN)
De
flec
tion
(mm
)
Head Deflection
Elastic line
Tip Deflection
?
?
Davisson failure line
Figure 4.3 Axial Load vs. Deflection for Micropile 4 4.2 Axial Load Transfer The measured strains were converted to axial loads by the procedure described by Fellenius (1989). This method accounts for the non-linearity in the stress-strain relationship of the composite micropile. This non-linearity is illustrated in Figure 4.4a, a plot of axial load at the pile head versus strain measured at each strain gage for micropile 3. While the modulus of the steel is constant since the stress in the steel for all tests was below the yield stress, the modulus of the grout varies over the large stress range imposed in the axial load tests, and hence depends on the imposed axial loads. Note that significant non-linearities were observed after 200 microstain in the unconfined compression tests of grout specimens. Fellenius (1989) derived the following equation for the secant modulus of the composite pile, Es, as a function of axial strain, ε:
BAEs += ε5.0 (4.1)
where A is the slope of the tangent modulus versus strain curve and B is the initial tangent modulus. The constants A and B are determined from a plot of tangent modulus versus strain for each pile, as indicated in Figure 4.4b for the strain gages for micropile 3. The tangent moduli are computed from the slope of the axial load at the pile head versus strain plots in Figure 4.4a. For gages near, or preferably, above the ground surface, the modulus for each increment is unaffected by the shaft resistance and the calculated moduli are representative of the moduli of the composite pile. At deeper gages, the load increments are reduced by the mobilized side resistance, and thus, initially, the computed tangent moduli are larger than that of the pile. This is observed in Figure 4.4b where the tangent moduli computed for the deepest gages, nos. 7 and 8, are initially higher than those of the shallower gages. After about 800 µε, the tangent moduli

19
for all gages converge. At this point, shaft resistance has been fully mobilized at all gage levels. Hence all applied load is transferred along the pile, and the calculated moduli are the composite tangent moduli values for the composite section. Constants A and B are computed from this linear portion of the tangent modulus versus strain plot.
0 500 1000 1500 2000Microstrain
(a)
0
500
1000
1500
2000
2500
3000
3500
4000
4500
Load
(kN
)
-0.54 m-0.54 m-1.15 m-1.15 m-1.5 m-1.5 m
0 500 1000 1500 2000Microstrain
(b)
0
50
100
150
200
250
Tan
gent
Mod
ulus
(G
Pa)
-0.54 m-0.54 m-1.15 m-1.15 m-1.5 m-1.5 m
B=78 GPa
A=-0.013 GPa/µε
Figure 4.4 Strain gage data from Micropile 3
The average friction between two levels of strain gages, fs, was computed by:
s
Pf
Dlπ∆= =
lD
EA
πεε ∆)(
(4.2)
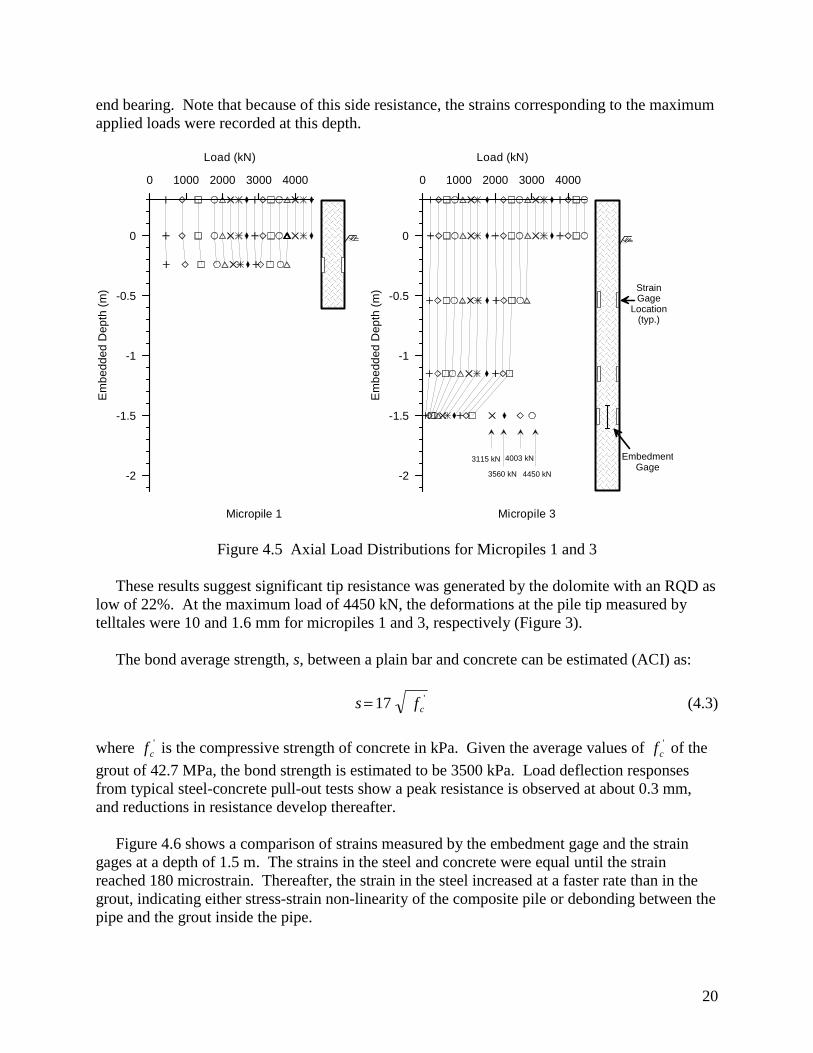
where ∆P is the difference of load between the two gage levels, l is the distance between the two gage levels and D is the diameter of the friction interface. Uncertainty arose as to which friction interface was the most appropriate to use. The friction at the bond between the rock and the grout is commonly used in computations of side resistance. Relative movements at the interface between the steel pipe and the grout around the pile were observed during the load tests. As subsequently discussed, extraction of piles 1 and 4 from the ground after load testing revealed that while the bond between rock and grout was intact, the outside diameter of the steel casing was free of grout, suggesting the steel-casing-grout interface was weaker than the grout-rock interface. Consequently, the diameter considered herein was the diameter of the pipe, i.e. 178 mm. Micropiles 1 and 3. The axial load distributions of micropiles 1 and 3 are shown in Figure 4.5. The data show no significant load transfer in the first meter of pile. Because micropile 1 was embedded only 0.8 m, the pile was essentially end-bearing. The strain gages in the upper portions of these piles were stressed beyond their linear range at loads greater than 3000 to 3500 kN, and hence are not include in Figure 4.5. Appreciable side resistance was observed below the gage at 1.14 m for micropile 3, and the pile resistance was a combination of side resistance and
20
end bearing. Note that because of this side resistance, the strains corresponding to the maximum applied loads were recorded at this depth.
0 1000 2000 3000 4000
Load (kN)
-2
-1.5
-1
-0.5
0
Em
bedd
ed D
epth
(m
)
Micropile 3
0 1000 2000 3000 4000
Load (kN)
-2
-1.5
-1
-0.5
0
Em
bedd
ed D
epth
(m
)
Micropile 1
StrainGage
Location(typ.)
EmbedmentGage
3115 kN
3560 kN
4003 kN
4450 kN
Figure 4.5 Axial Load Distributions for Micropiles 1 and 3
These results suggest significant tip resistance was generated by the dolomite with an RQD as low of 22%. At the maximum load of 4450 kN, the deformations at the pile tip measured by telltales were 10 and 1.6 mm for micropiles 1 and 3, respectively (Figure 3). The bond average strength, s, between a plain bar and concrete can be estimated (ACI) as:
'17 cfs = (4.3)
where '
cf is the compressive strength of concrete in kPa. Given the average values of 'cf of the
grout of 42.7 MPa, the bond strength is estimated to be 3500 kPa. Load deflection responses from typical steel-concrete pull-out tests show a peak resistance is observed at about 0.3 mm, and reductions in resistance develop thereafter. Figure 4.6 shows a comparison of strains measured by the embedment gage and the strain gages at a depth of 1.5 m. The strains in the steel and concrete were equal until the strain reached 180 microstrain. Thereafter, the strain in the steel increased at a faster rate than in the grout, indicating either stress-strain non-linearity of the composite pile or debonding between the pipe and the grout inside the pipe.

21
0
300
600
900
1200
1500
1800
-300 0 300 600 900 1200
Embedment strain gage (microstrain in concrete)
Stra
in g
ages
(m
icro
stra
in in
ste
el)
Sensor 12Sensor 11
Figure 4.6 Comparison of Strains in Grout and Steel for Micropile 3 Micropile 2. The axial load distribution of micropile 2 for the second loading cycle is shown in Figure 4.7. The data show significant load transfer does not occur in the upper 0.69 m of the embedded portions of the piles where the gages were located, and suggests most load is transferred directly to the pile tip, as was the case for micropile 1. This interpretation agrees with the telltale data shown in Figure 4.2, where the telltale and pile head movements were essentially the same during the first loading cycle, indicating the pile moves rigidly into the material below its base. Very small amounts of side resistance, an average of 360 kPa, were mobilized during the first loading cycle. The 27 mm of tip movement recorded during the test is a result of the highly weathered dolomite (RQD = 0) at the tip. As in the case of micropile 1, the relatively large movements needed to generate the tip resistance can be explained by poor quality rock. In spite of the poor rock conditions, significant axial loads developed in the test.

22
0 500 1000 1500
Load (kN)
-1.5
-1.25
-1
-0.75
-0.5
-0.25
0
0.25
0.5E
mb
ed
ded
De
pth
(m
)
Micropile 2 (First Loading)
0 1000 2000 3000
Load (kN)
-1.5
-1.25
-1
-0.75
-0.5
-0.25
0
0.25
0.5
Em
bed
de
d D
ept
h (
m)
Micropile 2 (Second Loading)
StrainGage
Location(typ.)
Figure 4.7 Axial Load Distribution for Micropile 2 Micropile 4. The axial load distribution of micropile 4 is shown in Figure 4.8 for the first loading cycle. The figure shows little load transfer in the first 1.14 m, and a higher rate of load transfer from 1.14 m to the bottom of the pile. Little load reaches the tip of the micropile until it suddenly plunges at the peak load of 2000 kN. This fact confirms the hypothesis that the failure did not occur until some load reaches the bottom, as suggested
?
0 400 800 1200 1600 2000 2400
Load (kN)
-2.25
-2
-1.75
-1.5
-1.25
-1
-0.75
-0.5
-0.25
0
0.25
Em
be
dd
ed
De
pth
(m
)
Micropile 4
??
StrainGage
Location(typ.)
EmbedmentGage
Figure 4.8 Axial Load Distribution for Micropile 4

23
by the telltale data in Figure 4.3. Recall that this pile was installed with a 150 mm zone of loose soil below its tip to more easily assess the mobilized side friction. As was the case with the other piles, very little load was transferred in the upper meter of the micropile. 4.3 Unit side resistance The unit side resistance, fs, is plotted versus axial head deflection for all micropiles in Figure 4.9. The values of fs are generally less than 200 kPa at depths less than 1 m, indicating negligible mobilized side resistance. These low values of side resistance likely resulted from the low grout pressures (140 kPa maximum), the small annulus between the rock and the steel casing, and the lack of confinement in the upper meter of the pile. Below this depth, fs values reach as much as 5400 kPa for pile 3 and 3200 kPa for pile 4.
0 -4 -8 -12 -16 -20Axial Head Deflection (mm)
-1000
0
1000
2000
3000
4000
5000
6000
Un
it S
ide
Re
sist
an
ce (
kPa
)
Micropile 1 (0.0-0.24 m)Micropile 2 (0.0-0.33 m)Micropile 2 (0.33-0.68 m)Micropile 3 (0.0-0.54 m)Micropile 3 (0.54-1.15 m)Micropile 3 (1.15-1.5 m)Micropile 4 (0.0-1.15 m)Micropile 4 (1.15-1.76 m)Micropile 4 (1.76-2.11 m)
Figure 4.9 Mobilized Side Resistance versus Axial Head Deflection The mobilized side resistance for pile 4 is similar to the average unit value for the bond that develops at a smooth steel–grout interface, approximately 3500 kPa based on equation (4.3) and 42.7 MPa grout. Given that micropile 4 exhibited a plunging failure, the side resistance completely mobilized at its failure load. To evaluate the conditions at the interfaces, micropiles 1 and 4 were extracted from the ground by coring around the pile with a 267-mm-diameter core bit. Micropile 4 did not exhibit any sign of structural failure. Rather, Figure 4.10 shows that the drilling bit of micropile 4 was tipped in a fine-grained powder; these cuttings were placed into the hole after drilling to assure that the end bearing resistance would be negligible resulting in the observed plunging failure. Furthermore, there was no sign of failure or movement at the interface rock-grout, and the outside grout was not bonded to the extracted steel pipe. The interface steel-grout thus was the weaker of the two potential failure surfaces.

24
Figure 4.10 Micropiles 1 and 4 after Extraction
Grout layer on rock
Separation, with traces of
Rock without
Bottom of Micropile
Dust Grout
Roller bits with dust but no trace of
Tip of micropile
Grout
Tip of micropile
Clean steel pipe:
No trace of remaining grout
Tip of micropile 1

25
The mobilized side resistance for pile 3 was higher than the estimated value for a smooth steel-grout interface, yet not inconsistent with its magnitude. Interpretation of load transfer near the bottom of a pile with significant amounts of side resistance and end bearing is difficult, and was the reason why pile 4 was tested with a soft bottom. Unfortunately, pile 3 was not extracted at the end of testing to verify the nature of the critical interface near its tip.

26
5. Discussion of Results There are a number of differences between the quarry test micropiles and typical end bearing micropiles in the Chicago area. In addition to the differences in construction techniques resulting from the need to install strain gages, production micropiles are much longer, typically 30 m long in the downtown area of Chicago. The fact that production micropiles are drilled into the rock will likely ensure the tip of the pile will be in sound rock since the depth can easily be extended until such rock is reached. However, while the bedrock in this area is the same dolomite as existed on the floor of the quarry, the large axial loads will cause much larger elastic compression in the production piles than in the shorter quarry test piles. Allowable deformations should be the key factor in determining the allowable axial capacity for these types of pile. The 178-mm-diameter piles are relatively compressible as compared to other types of deep foundations, and when they are founded on high quality rock, they should respond elastically. The side resistance within the soil above the rock should be relatively low because of the poor bond between the steel casing and the grout and the relatively large movements created by the elastic deformations of the pile. Although the potential for much higher axial capacities exists if the interfacial strength within the rock could be increased, perhaps by artificially roughening the outside of the casing, the relatively compressible nature of this small diameter element would limit its capacity when one considers allowable deformations as the main design criteria. 5.1 Computed Design Load and Observed Capacities Table 5.1 summarizes the allowable axial loads for the quarry test micropiles based on a number of methods. The allowable structural loads were computed by methods prescribed by AASHTO, and the Chicago and Massachusetts Building Codes and are the same for micropiles 2, 3 and 4. Micropile 1 differs because the compressive strength of the grout was 48 MPa for this pile, as compared to 38 MPa for the other 3 piles.
Table 5.1 Computed and Observed Loads for Test Micropiles
Computed Observed Allowable structural load (kN) Pile
1 2 3 Davisson allowable
load with FS = 2 (kN) Allowable load for 13 mm movement (kN)
1 1630 880 1380 2000 3800 2 1560 800 1320 400 1200 3 1560 800 1320 >2225 >4450 4 1560 800 1320 1000 not applicable
Notes: 1 – AASHTO 2 – Chicago Building Code 3 – Massachusetts Building Code

27
The Davisson method is an approach developed for high capacity driven piles. This method tends to define the “failure” load at levels where the end bearing is not completely mobilized, and is reasonable for piles 1, 2 and 4 where the fractured rock, or soft bottom conditions at pile 4, was compressible enough to permit significant displacements of the pile tip.
Neither the Davisson method, nor any other method that defines axial capacity in terms of safety factor applied to a relatively arbitrary definition of failure, is applicable to a micropile founded on good quality rock, as was the case for micropile 3. If one uses an allowable deformation of 12.5 mm to define the allowable axial load, then the pile 3 load test result indicates the capacity exceeds 4450 kN, far in excess of that defined by conventional structural criteria.
5.2 Comparison with full scale load tests Three piles out of four failed according to the Davisson’s criteria for defining failure. Micropile 1 failed at a load of 4000 kN. Upon first loading, micropile 2 failed at a load of 800 kN. Micropile 4 failed in a plunging at a load of 2000 kN. Micropile 3 was nearing a Davisson-defined failure at 4450 kN. Micropile 4 was the only pile wherein a plunging failure was observed. Note that the Davisson’s method conservatively computes a failure load for high capacity piles. In particular, significant side resistance was observed in all test piles. Design methods that ignore this resistance are therefore overly conservative. Several load tests on 35 m long micropiles in the downtown area of Chicago have been conducted by TCDI. These micropiles were embedded in similar dolomite in which the quarry tests were performed. Axial loads were applied to a maximum of 1780 kN without signs of failure. Note that these loads of 1780 were two times the design loads. Loads as great at 4450 kN were applied without failure at the quarry site. These results suggest that the current practice based on structural considerations can be quite conservative, if the rock is competent. Load transfer through side friction within the rock socket is the dominant load transfer mechanism. However, the data from the quarry tests suggests that the critical interface for determining the amount of side friction was that between the grout and the steel casing, and not the grout-rock interface. Comparison of the strains in the steel measured by the strain gages and that in the concrete measured by the embedment gages indicted that debonding between the grout and the steel casing occurred at relatively low axial loads. 5.3 Suggested Design Approach When one considers production micropiles founded in good quality rock with lengths on the order of 25 to 30 m, typical of the downtown area of Chicago, then most of the movement at the pile head will be a result of elastic compression of the pile. Recall the tip of micropile 3 moved less than 2 mm with an applied load of 4450 kN. Hence, it is more rational to design such a pile based on allowable movements, the majority of which comes from “elastic” compression of the pile. For example, if micropile 3 had been 27.5 m long and founded in the same quality rock, then the allowable axial capacity would have been 1350 kN for a 12.5 mm allowable deformation and 2600 kN for a 25 mm allowable deformation. These values are significantly greater than those defined from code-based structural considerations, for example, 900 kN in

28
Chicago (Table 2.1). Note the non-linearity of the composite pile must be taken into consideration when computing the “elastic” compression. This approach is valid only when good quality rock is at the tip of the micropile. Well-constructed production micropiles of the type described herein founded in competent dolomite meet these criteria.

29
6. Conclusions The axial capacity of the quarry test micropiles described herein, consisting of steel casing filled with grout and founded on rock, depends primarily on the quality of the rock below the pile tip. For the micropiles founded on dolomite with an RQD of 0, 22, and 87, the axial capacities determined by Davisson’s method were 1700 kN, 4000 kN and in excess of 4500kN, respectively. The movements at the pile tips at ultimate loads were 27, 10, and 2 mm, respectively. The stresses in these micropiles were in excess of those specified by codes without any detrimental effects on the performance of the pile under axial load. The interface that determined the distribution of axial load transfer with depth was not the interface between grout and rock, but the interface between the outside diameter of the steel and the grout. Because of the small annulus between the steel casing and the rock, and the low grout pressures necessitated by the shallow depth of the piles, side resistance did not develop above an embedded depth of approximately 1 m. Below 1 m, the mobilized friction was limited to that which can develop at the interface of steel casing and grout, and was approximately equal to that estimated based on pullout tests of smooth steel rebar from blocks of concrete. Due to the relatively high compressibility, the allowable axial loads of full-scale micropiles, installed in the same manner as described herein and founded on competent rock, are determined more rationally from allowable deformation considerations, rather than code-specified allowable stresses in the pile.

30
References ACI 318-95. (1995). Building Code Requirement for Structural Concrete. Fellenius, B.H. (1989). “Tangent Modulus of Piles Determined from Strain Data,” Proceedings, Congress on Foundation Engineering: Current Principles and Practices, F.H. Kulhawy ed., Vol. 1, ASCE, p. 500-510. FHWA. (2000). Micropile Design and Construction Guidelines. Publication no.FHWA-SA-97-070 Goodman, R.E., (1980), Introduction to Rock Mechanics, John Wiley & Sons, New York, NY

A1
Appendix
1.0 Micropile Installation and Instrumentation A2
1.1 Installation of strain gages A2
1.2 Installation of micropiles A4
1.3 Axial load testing of micropiles A8
2.0 Material Properties A14
2.1 Rock A14
2.2 Grout A20
3.0 Axial Load Test Data A28

A2
1. Micropile Instrumentation and Installation
1.1 Installation of strain gages
The four test micropiles were equipped with 20 strain gages and two embedment strain gages as presented in Figure A1.
Each strain gage contains a pre-tensioned vibrating wire. The length of this wire changes with the strain induced by the steel pipe. The sensor plucks the strain gage and returns to the read-out box a frequency signal, a function of the length of the wire. The frequency data is transformed to strain data as:
20.0007576 2030.1Frequency
Sensitivityµε × −= (A1)
The sensitivity was fixed to –1, in order to have a positive value of strain for compression. The pickup sensor also incorporates a temperature sensor, which supplies data for temperature compensation.
Figure A1 – Position of the strain gages in the micropiles.

A3
Figure A2 –Installation of the strain gages
The sensor is designed for a flat surface. However, the inside diameter of the pipe was 6 inches. This curvature did not allow the sensor to be mounted as close as necessary to the strain gage. Consequently, the sensor yielded inconsistent data during preliminary testing in the laboratory. To correct this, the sensors were machined to fit the pipe curve, as shown in the Figure A2 (2 and 3). Each gage was spot welded to the clean surface of the pipe (Figure A1, 1). After rounding its edges to match the curvature of the inside diameter of the pile, the pickup sensor is installed upon with glue and welded straps (Figure A1, 2). A mastic pad is then installed to protect the sensor (Figure A1, 4).
1
2
Each micropile was comprised of 2-foot-long tubes in order to allow easy access, as shown in Figure A1. Access to the bottoms of the piles was prevented by the presence of the drilling bit welded to the bottom of the pile. There, the sensors were just installed as far as possible inside the pipe. All the strain gages were installed in the laboratory at Northwestern University.

A4
Figure A3 – Embedment strain gage
The embedment strain gages were installed on the tubes of the telltales, and positioned as shown in Figures A1 and A3. The distance between the flanges is measured with a vibrating wire, like the weldable strain gage. The computed strain is corrected for the temperature effects.
1.2 Installation of micropiles
The micropiles and the anchors for the tests were arranged as shown in Figure A4. Each pile was in the middle of a square of anchors with 10-foot-long sides. The nine anchors were put in place first, on September 21 and 23, 2000. Each anchor was embedded 20 feet in the ground. The bottom fifteen feet of each anchor pile were bonded and the remaining 5 feet were unbonded.

A5
Figure A4 – Micropile and anchor plan
The micropiles were installed on September 25 and 26, 2000. The micropiles arrived in segments at the quarry. They were assembled and completed on site, as shown in Figure A5. The micropiles tubes were threaded together and the wires were tied on each side of the micropile, as shown in Figure A5. Two 1-inch-diameter holes were drilled on top of each micropile to let the strain gage wires out of the piles. The holes were then recovered by a plastic pad and filled with marine silicon.

A6
Figure A5 – Preparation of the micropiles on site The micropile hole was not drilled with the tri-cone drilling bit installed on the test micropiles, but with another drilling bit of the same type. Water was used when drilling. The test micropile was placed in the completely drilled hole, and were 1 foot longer than the depth of the hole. Grout was tremied inside the pile, then pressurized, as shown by Figure A6 (1 and 2). There are 3 holes in the drilling bit in order to let out the water during the drilling and the concrete during the grouting. Therefore, the concrete goes up the annulus between the micropile and the drilled hole during grouting. The thickness of the concrete outside the micropile can be estimated to approximately 0.25 inch, the difference between the drilling bit radius and the pipe radius. The grout pressure increased until the grout reached the top of the hole outside of the micropile. Two tubes per pile were installed for the telltales before the grout hardened, as shown in Figure A6 (3 and 4). The embedment strain gages were installed on these tubes for piles 3 and 4 (Figure A3).
1 2
3 4

A7
Two important problems were encountered during pile installation. First, the grouting pressure did not exceed 20 psi. Second, the quality of the rock appeared to vary substantially from one hole to another. The grouting pressure was low for two reasons. First, the holes were not very deep and the grout quickly reached the surface on the side of the micropiles. The grouting pressure would have been higher if longer micropiles had been tested, i.e., similar to those used in downtown Chicago where the length are approximately 90 to 100 feet. Second, the holes drilled on the side of the micropile to facilitate instrumentation were leaking. The silicon that filled the hole was not hard after 24 hours and could not support the pressure. Due to this low pressure, the grout probably did not penetrate into the surrounding rock as well as it would have if the pile was 30m long. However, the grout did reached the surface on the side of all the piles. The rock quality varied significantly from hole to hole. The rock was in good condition for the holes of piles 1 and 3, and weathered at the top for pile 4. But the rock of pile 2 was totally weathered, as shows Figure A7.
1 2
3
4
Figure A6 – Grouting of a micropile
Hole 1 Hole 2
Figure A7 – Rock condition in the holes of the micropiles 1 and 2

A8
1.3 Axial load testing of micropiles
Test Apparatus
Figure A8 shows the different elements of the test apparatus. A hydraulic jack axially loads the micropile, pushing it into the ground. A load frame provides the reaction for the jack. The frame is attached to the ground by four anchors. Each anchors was designed to support 250 kips. The test apparatus was designed to safely apply an axial load of 1000 kips on the pile. Three dial gages measured the movement of the top of the pile at the top of the chair. Chair deformation was neglected. The base of the measurement was a reference frame installed around the loading system and fixed in the rock. Two other dial gages were measuring the displacement of the two telltales. The telltale data represents show the movement at the bottom of the pile. A swivel plate was installed between the load frame and the jack each time there was enough space. The goal of the swivel plate was to insure that the loading was concentric.
Load Cell
STS Consultants provided a load cell to calibrate the hydraulic jack. The capacity of the load cell was 800 kips with the swivel plate. A first calibration on the first micropile showed inconsistent results between the jack pressure and the load cell because the load cell was not grounded.
A second try showed a good calibration of the jack pressure. Because there was not enough space to put the swivel plate between the jack and the transfer beam, the
Jack
Chair
Swivel plate
Micropile
Dial gages
Reference frame
Anchors
Figure A8 – Elements of the test apparatus

A9
0
50
100
150
200
250
300
350
400
450
0 50 100 150 200 250 300 350 400 450
Load using Jack calibration (kips)
Lo
ad g
iven
by
load
Cel
l (ki
ps)
Theoretical values
Actual values
Load using jack calibration (kips)
calibration test was stopped at 400 kips. The results of this calibration are presented in the Figure A9.
Load Tests
The axial loads were applied in increments of 50 kips. The unloading decrements were 100 kips. At each step, the load was maintained for 5 minutes to take into account creep movements of the pile.
Pile 1 was first tested to 450 kips with the load cell. It was then unloaded to remove the load cell from the loading apparatus. The micropile was then reloaded to 1000 kips and unloaded. The chair appeared to have been crushed, as shown by figure A10.
Figure A9 – Calibration of the jack pressure by the load cell

A10
The second pile was first tested to 300 kips with another chair. The pile began to plunge, and it was decided to do an unload-reload cycle. The pile did not plunge during the second loading cycle as the load was increased to 800 kips. At 800 kips, the chair began to show some sign of crushing. The test was stopped to save the chair. The chair was then reinforced with a steel plate. Micropile 3 was loaded to 1000 kips without any problems, then unloaded. An additional load cycle was performed to calibrate the hydraulic jack with the load cell, as presented in Figure A9. Micropile 4 was loaded to 450 kips, where upon it began to plunge. The swivel plate was leaning strongly on to side, indicating a change of the load direction. Therefore, the test was stopped. A second attempt to load this pile was made. The plunging occurred after 400 kips. The swivel plate was leaning more and more to the side. The micropile was plunging perceptibly and made noises. The top of the pile mushroomed, the big beam of the load frame began to move on a side and the jack was finally forced out of the load frame. The test was stopped. It appeared later that one anchor failed at the end of the test. Figure A11 shows the scene at the end of the test.
Figure A10 – Crushed loading chair after the test of the micropile 1

A11
Strain data collection – Read out system
The read-out system is composed of a “terminal box” and a “read-out box,” as presented in Figure A12. All the sensor wires are connected to the terminal box. One selects a sensor with a “switch button”, then the information is sent to the read-out box, which computes the strain and temperature data and save the results in its memory. All data were transferred later to a computer. While the strain gages were designed for compression, some of them were overstressed at the highest loads. Overstress was noticeable by inconsistent results or a recurrent strain value of 1756.1 microstrain. The strain gages were overstressed each time they reached this value. Temperature data were also taken during the tests. The temperature remained relatively constant during the tests.
Figure A11 – Failure of the testing apparatus during the load test of the micropile 4

A12
Figure A12 – Strain data collection – terminal box and read-out box
Terminal Box
Read-out Box
Load Cell Box
Visual observations of unbonding
Evidence of unbonding between the steel pipe and the grout was observed during the axial load test. First, it could be observed that the pipe moved with respect to the grout in the annulus space between the pile and the rock. Figure A13 (1) shows the distortions of the paint on pile 1 due to the movements during testing.
The unbonding at the interface between grout and pipe was also noticed inside the
pipe. Before the load test, the grout at the top of the pile was approximately one- eighth of an inch below the tip of the steel pipe, as shown for micropile 1 in Figure A13 (2). At the end of the tests, the grout extended above the steel pipe, as shown for micropile 4 in Figure A13 (3). Apparently, relative movements between the inside grout and the steel pipe had occurred during the test, which presumably reflected unbonding between the grout and steel pipe.

A13
2. Material Properties
2.1 Rock Properties
Conditions of dolomite at test section
A 9-foot-long rock core was obtained 20 feet from micropile 4 before the load tests began. The diameter of the core was 4.5 inches. Recovery was not as good as expected because the drilling bit was not designed specifically for coring. The rock was weathered for the first five feet, and sound from 5 to 9 feet. Figure A14 shows the rock recovered from the core.
Because of the variable nature of the rock at each pile location, a 2-inch-diameter core was obtained near each of the micropiles after the load tests had been conducted.
Figure A14 – 4.5-inch-diameter core and drilling bit
Top
Bottom
Figure A13 – Signs of unbonding of the micropiles
1
2 3

A14
The cores near piles 1, 2 and 3 were 10 feet long. The core near pile 4 was 12 feet long. The results are summarized in Figure A15. Figure A16 shows photos of the cores.
Figure A15 – Rock core logs

A15
Figure A16 – Rock cores
Top
Top
Top
Top
Bottom
Bottom
Bottom
Bottom
Micropile 1 0-10’
Micropile 2 0-10’
Micropile 3 0-10’
Micropile 4 0-12’

A16
Properties
One unconfined compression test was conducted on a dolomite sample from each drill hole. Figures A17 to A20 shows the strain-stress curves. The unconfined compression strength and the Young Modulus of the rock were computed from the curves. Two tension tests were conducted on samples from each drill hole to estimate the tensile strength of the dolomite. Table A1 shows the results of the tests conducted on the rock cores.
Table A1 – Results of the tests
Rock Properties
Test nb σc (ksi) E (ksi) Test nb σt (ksi)
1 13.4 3150 1 0.96 42 12.3 3050 2 1.2 53 10 2950 3 1.08 54 13.7 3500 4 0.96 4
Average 12.4 3163 5 1.08 56 0.96 47 1.32 68 1.2 5
Average 1.10Notes:
Point Tensile TestCompression Test
* Point Tensile test realized with 2-inch-diameter core with a minimal length of 3 inches. The formula used to compute the tensile stress from the applied load F is
Reichmuth (1962): σt = - 0.96 F / d2.
* unconfined compression test conducted with 4 inch-high, 2-inch-diameter cylinder. Young Modulus computed as the slope of the strain-stress curve, after the initial slack

A17
Figure A18 - Strain-Stress curve of the dolomite: micropile 2
0
2
4
6
8
10
12
14
0 0.001 0.002 0.003 0.004 0.005 0.006 0.007
Strain
Figure A17 - Strain-stress curve of the dolomite: micropile 1
0
2
4
6
8
10
12
14
0 0.001 0.002 0.003 0.004 0.005 0.006 0.007
Strain

A18
Figure A19 - Strain-Stress curve of the dolomite: micropile 3
0
2
4
6
8
10
12
0 0.001 0.002 0.003 0.004 0.005 0.006
Strain
Figure A20 - Strain-stress curve of the dolomite: micropile 4
0
2
4
6
8
10
12
14
0 0.001 0.002 0.003 0.004 0.005 0.006
Strain

A19
Table A2 – Summary of the properties of the grout cylinders
Date Cylinder f'c (psi) Ec (ksi) Date Cylinder f'c (psi) Ec (ksi) Date Cylinder f'c (psi)
1 6982 1254 1 5837 1129 1 72712 6878 1260 2 5501 1111 2 72813 6671 1253 3 5183 1089 3 6930
Average 6844 1256 Average 5507 1110 Average 71611 7269 1214 1 5741 1136 1 77562 7301 1260 2 5414 1104 2 81063 5057 1210 3 5477 1077 3 71394 7367 1343 Average 5544 1106 Average 76675 6772 1335 Young modulus values for computation:
Average 7177 1272 Micropile 1: Ec= 1250 ksi Micropiles 2,3,4: Ec = 1100 ksi
Anchors (09/22)Pile 1 (samples done on 09/25) Piles 2,3,4 (samples done on 09/26)
10/03 (8 days)
10/02 10 days
10/03 11 days
10/02 (7 days)
10/02 6 days
10/3 7 days
2.2 Grout Properties
Six-inch-high, 3-inch-diameter cylinders of grout were prepared on site. Six samples were prepared with grout used to construct the anchors on 09/22/00. Eight samples were prepared with the grout of the first micropile on 09/25/00. Six cylinders were made with the grout of the other three piles on 09/26/00.
Unconfined compression tests were made on the grout samples on 09/30/00,
10/02/00 and 10/03/00, approximately the same days as the micropile load tests. The unconfined compression strength and the Young modulus were computed from the stress-strain curves. These stress-strain curves are presented by Figures A21 to A34.
The values of the unconfined compressive stress, f’c, and the Young Modulus, Ec, for the different samples are presented in Table A2. The average value of f’c was approximately 7000 psi for the anchors and micropile 1, and 5500 psi for micropiles 2,3 and 4.

A20
Figure A21 - Grout 9/25: pile 1 - Test 9/30 - cylinder 1
0
1
2
3
4
5
6
7
8
0 0.002 0.004 0.006 0.008 0.01 0.012
Strain
Figure A22 - Grout 9/25: pile 1 - Test 9/30 - cylinder 2
0
1
2
3
4
5
6
7
8
0 0.001 0.002 0.003 0.004 0.005 0.006 0.007 0.008 0.009 0.01
Strain

A21
Figure A23 - Grout 9/25: pile 1 - Test 9/30 - cylinder 3
0
1
2
3
4
5
6
7
0 0.001 0.002 0.003 0.004 0.005 0.006 0.007 0.008 0.009 0.01
Strain
Figure A24 - Grout 9/25: pile 1 - Test 10/2 - cylinder 1
0
1
2
3
4
5
6
7
8
0 0.001 0.002 0.003 0.004 0.005 0.006 0.007 0.008 0.009
Strain

A22
Figure A25 - Grout 9/25: pile 1 - Test 10/2 - cylinder 2
0
1
2
3
4
5
6
7
8
0 0.001 0.002 0.003 0.004 0.005 0.006 0.007 0.008 0.009
Strain
Figure A26 - Grout 9/25: pile 1 - Test 10/2 - cylinder 3
0
1
2
3
4
5
6
0 0.001 0.002 0.003 0.004 0.005 0.006 0.007
Strain

A23
Figure A27 - Grout 9/25: pile 1 - Test 10/2 - cylinder 4
0
1
2
3
4
5
6
7
8
0 0.001 0.002 0.003 0.004 0.005 0.006 0.007
Strain
Figure A28 - Grout 9/25: pile 1 - Test 10/2 - cylinder 5
0
1
2
3
4
5
6
7
8
0 0.001 0.002 0.003 0.004 0.005 0.006 0.007
Strain

A24
Figure A29 - Grout 9/26: pile 2,3,4 - Test 10/2 - cylinder 1
0
1
2
3
4
5
6
7
0 0.001 0.002 0.003 0.004 0.005 0.006 0.007 0.008Strain
Figure A30 - Grout 9/26: pile 2,3,4 - Test 10/2 - cylinder 2
0
1
2
3
4
5
6
0 0.001 0.002 0.003 0.004 0.005 0.006 0.007 0.008
Strain

A25
Figure A31 - Grout 9/26: pile 2,3,4 - Test 10/2 - cylinder 3
0
1
2
3
4
5
6
0 0.001 0.002 0.003 0.004 0.005 0.006 0.007
Strain
Figure A32 - Grout 9/26: pile 2,3,4 - Test 10/2 - cylinder 1
0
1
2
3
4
5
6
7
0 0.001 0.002 0.003 0.004 0.005 0.006 0.007 0.008
Strain

A26
Figure A33 - Grout 9/26: pile 2,3,4 - Test 10/2 - cylinder 2
0
1
2
3
4
5
6
0 0.001 0.002 0.003 0.004 0.005 0.006 0.007 0.008Strain
Figure A34 - Grout 9/26: pile 2,3,4 - Test 10/2 - cylinder 3
0
1
2
3
4
5
6
0 0.001 0.002 0.003 0.004 0.005 0.006 0.007
Strain

A27
3.0 Axial Load Test Data
This section contains the definitions, formulae and assumptions made to reduce the axial load test data. The total average deflection of the top of the micropile is computed as the average of the readings of the 3 dial gages shown in Figure A8. The average tip deflection is the average of the readings of the telltales. The telltales are anchored at the top of the drilling bit, approximately 8 inches above the bottom of the micropile. The average compression is the difference of the head deflection and the tip deflection. The pile is taken as a steel pipe filled with grout. The steel pipe is characterized by a Young Modulus of the steel, Esteel, of 29,000 ksi, and the grout has a Young Modulus, Econcrete ,of 1250 ksi for the pile 1, 1100 ksi for the piles 2,3 and 4. The cross-sectionnal area of the steel was 10.2 in2, the area of grout inside the pile was 28.3 in2. Note that these values represent initial moduli and are only used to compute the elastic lines on the axial-load deflection curves. Because of the relatively high strains and resulting nonlinearity, the Fellenius procedures described in the body of the report are used to compute the axial load distribution.
The total elastic deflection of a pile for a given load P corresponds to the elastic deformation of the pile under this load, considering that the pile is free standing and supported on a rigid base. The elastic line is given by the elastic deformation of the pile versus the load P.
The steel and the concrete are assumed to have the same strain, i.e. perfect bonding
exists between the steel and the concrete. From this assumption one can obtain:
s ss c
c c
A EP P
A E= (A3)
c c s s
PLd
A E A E=
+ (A4)
With: P = Load at the pile head. Ps = Load supported by the steel.
Pc = P – Ps = Load supported by the concrete. d = elastic deformation at pile head. L = Length of the pipe. AsEs = Axial stiffness of steel AcEc = Axial stiffness of concrete
Applying equation A3 shows that, for the values given in Table A6, and assuming an equal strain in the concrete and steel, the load in the concrete is approximately nine times smaller than that in the steel. Equation A4 is the equation of the elastic line.

A28
A change of one microstrain is equivalent to a change of 0.33 kips in the load. At each level, an average of the two strain gages is taken to determine the average load at this level. Strain data were taken at the start and end of each load increment. The temperature was taken at the same time as the strain data for the micropile 1. The temperature remained approximately constant during the test. Consequently, the temperature data were taken less frequently interval during the other tests. The maximum variation of temperature was 0.7°C, corresponding to 1.05 µε, or less than 0.35 kips. Since this load is negligible, the temperature correction was neglected in the computations. All the strain gages gave inconsistent results after having reached the strain value of 1750 µε as a result of being overstressed. All the values coming from an overstressed strain gage are in italic in the Tables. They do not appear in the graphs.
The following tables contain all the data obtained in the course of the load test results.

A29
Micropile 1

A30

A31

A32

A33

A34

A35
Micropile 2

A36

A37

A38

A39

A40
Micropile 3

A41

A42

A43

A44

A45

A46
Micropile 4

A47

A48

A49