directive leadership
TRANSCRIPT

International Bulletin of Business Administration
ISSN: 1451-243X Issue 9 (2010)
© EuroJournals, Inc. 2010
http://www.eurojournals.com
31
The Effect of Directive and Participative Leadership Style on
Employees’ Commitment to Service Quality
H. Rezaei Dolatabadi
Assistant professor of Marketing, University of Isfahan, Hezarjerib Street, Isfahan, Iran
M. Safa
M.A, Candidate, University of Isfahan
E-mail: [email protected]
Abstract
The purpose of this study is investigation the Effect of directive and participative
leadership styles on employees’ role clarity, shared customer oriented values and
employees’ commitment to service quality (ECSQ) in banking industry in Iran. Data was
collected from 87 Iranian banks and questionnaires distributed between managers and
employees that have directly contact to customer. The survey asked managers about their
leadership styles, while frontline employees were asked about their shared values, role
clarity, and commitment to service quality. To analysis the data used, structural equation
modeling (SEM). The results of the structural equations analysis showed that leadership
style of manager can influence on employees’ responses. Directive leadership has negative
effect on Shared values and ECSQ, and positive influence on employees’ role clarity.
However, the results indicated that, participative leadership has directly influenced on
Shared values and ECSQ but this leadership style did not influence on Employees’ role
clarity. Also in this study direct, indirect, and total effects of variable have been perused
too. This study demonstrates the importance effects of leadership styles of manager in
service climate on employees’ responses.
Keywords: Leadership styles, Employees’ Commitment to Service Quality, banking
industry
1. Introduction The importance of frontline, customer-contact employees that directly related to customers and
provided the service them, cannot be disregarded. High quality of frontline employees is integral to the
excellence of firms because the service provided by such employees reflects the image of the
organization and effects customer perceptions of service quality. Frontline employees are directly
accountable for face-to-face customer service, service quality, and customer satisfaction—all of which
are keys to strong performance (Hartline, Wooldridge, and Jones 2003). Most industry observers and
practitioners agree that frontline employees who are satisfied with and committed to their jobs share
the firm’s customer-oriented values, exhibit low levels of role stress, and deliver the highest level of
service quality (Hartline, Maxham, and McKee 2000; Singh 2000). Leadership style, which refers to
the way leaders behave towards or treat the individuals they are leading (Ehrhart, 2004), Drucker
32
(1993) indicated that the quality and performance of managers are the key criteria in deciding
organizational success. An enterprise without a manager’s leadership is not able to transmute input
resources into competitive advantage. Therefore, it is clear that the leadership style of a manager has a
close relation to the development of organization. The study made by Bass (1990) shows that 45% to
65% of the total factors causing success or failure of organization are decided by leaders. Leadership
style has influence on employees’ behavior, including their adoption of the firm’s strategy and
organizational value and has been linked to both organizational outcomes and employee work
performance (Ehrhart, 2004). On the other hand managers can influence employees commitment to
service quality is to demonstrate it themselves (Babakus et al. 2003). This requires the manager to
adopt a leadership style that can influence his or her employees. While different leadership styles have
the ability to influence employees’ behavior in differing ways, manager must be attention to adopt of
the appropriate leadership style.
This research, investigates the extent to which two leadership styles (namely, directive,
participative,) influence frontline employees in bank industry, by examining how leadership style can
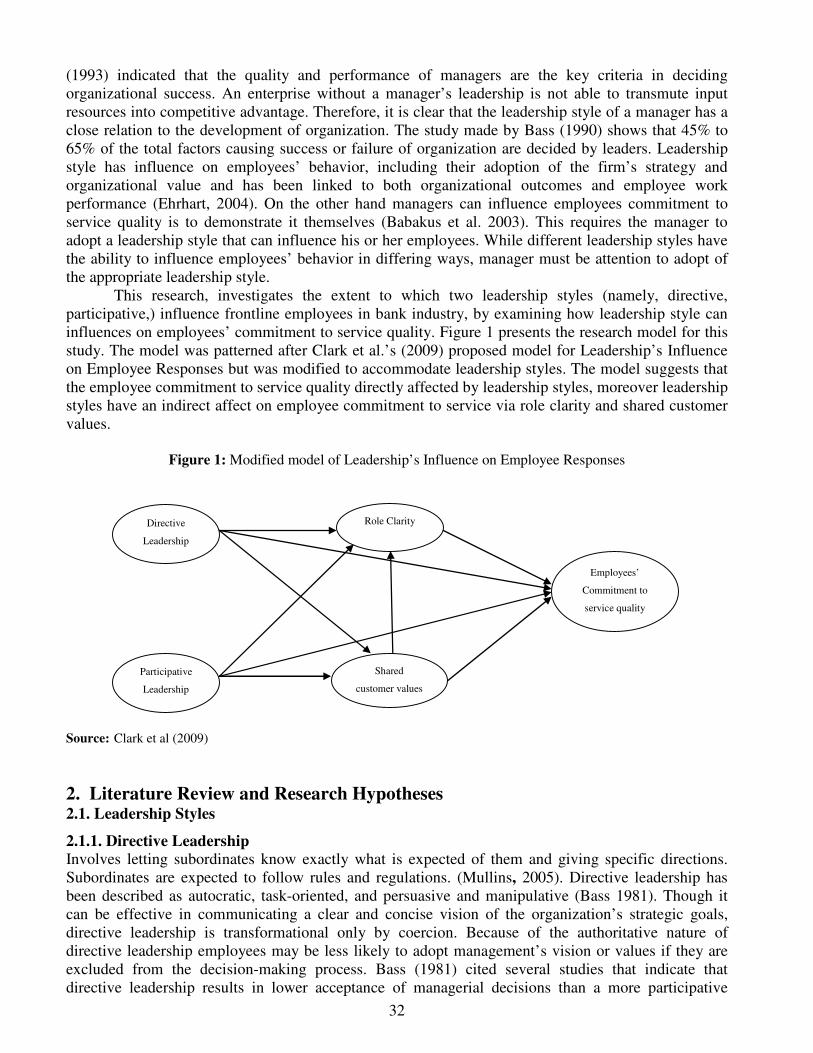
influences on employees’ commitment to service quality. Figure 1 presents the research model for this
study. The model was patterned after Clark et al.’s (2009) proposed model for Leadership’s Influence
on Employee Responses but was modified to accommodate leadership styles. The model suggests that
the employee commitment to service quality directly affected by leadership styles, moreover leadership
styles have an indirect affect on employee commitment to service via role clarity and shared customer
values.
Figure 1: Modified model of Leadership’s Influence on Employee Responses
Directive
Leadership
Shared
customer values
Role Clarity
Participative
Leadership
Employees’
Commitment to
service quality
Source: Clark et al (2009)
2. Literature Review and Research Hypotheses 2.1. Leadership Styles
2.1.1. Directive Leadership
Involves letting subordinates know exactly what is expected of them and giving specific directions.
Subordinates are expected to follow rules and regulations. (Mullins, 2005). Directive leadership has
been described as autocratic, task-oriented, and persuasive and manipulative (Bass 1981). Though it
can be effective in communicating a clear and concise vision of the organization’s strategic goals,
directive leadership is transformational only by coercion. Because of the authoritative nature of
directive leadership employees may be less likely to adopt management’s vision or values if they are
excluded from the decision-making process. Bass (1981) cited several studies that indicate that
directive leadership results in lower acceptance of managerial decisions than a more participative

33
leadership style. Employees’ failure to espouse management values may be a particular problem in
service organizations, since frontline employees are often required to make decisions and customize
service on the fly (Hartline, Maxham, and McKee 2000). Therefore:
2.1.2. Participative Leadership
Participative leadership Involves consulting with subordinates and the evaluation of their opinions and
suggestions before the manager makes the decision (Mullins, 2005). Participative leadership is
associated with consensus, consultation, delegation, and involvement (Bass 1981). Results revealed
that employees who perceive their managers as adopting consultative or participative leadership
behavior are more committed to their organizations, more satisfied with their jobs and higher in their
performance. (Yousef, 2000). Because of the consultative nature of participative leadership, it has the
potential to enhance the dissemination of organizational and managerial values to employees.
Employees who work for a participative leader tend to exhibit greater involvement, commitment, and
loyalty than employees who work under a directive leader (Bass 1981). Consequently employees who
are allowed to participate in the decision-making process are likely to be more committed to those
decisions. Since, frontline Employees in bank industry are often more cognizant of customer needs
than are managers, given the employees’ direct contact with customer. Therefore, management must be
allowed employees to participate in the decision-making process. Participative leadership’s ability to
raise the commitment, involvement, and loyalty among employees should be attractive to a manager
wishing to promulgate his or her commitment to service quality to employees.
2.2. Leadership Style and Employee Responses
Different leadership styles can have vastly different effects on the employees’ service related actions.
In this section, we discuss how leadership style influences shared customer oriented values, role
clarity, and employees’ commitment to service quality.
2.2.1. Shared Customer Oriented Values
Shared values represent the critical “glue” that holds organizational members together as they work
toward a common purpose (Hartline, Maxham, and McKee 2000). Like all beliefs, organizational
values have cognitive, affective and behavioral components which continually interact and are
exhibited in the actions and behaviors of the members of an organization (Rokeach, 1973). Every
profession and every organization is guided by a set of beliefs and values. It is these “organizational
values” that communicate what an organization believes and what it considers to be important (Hitt,
1988). Identifying organizational values is a critical step since such values influence directly how
people behave. In our study, we focus on the extent of shared customer-oriented values between the
organization and employees. Hutchinson and Purcell (2003), suggestions, managers need the support
of strong organizational values concerning leadership and people management.
In directive leadership style, The leader gives specific guidance of performance to subordinates
,telling followers what needs to be done and giving appropriate guidance along the way. Because of the
persuasive nature of directive leadership suffers the organizational shared values through the lack of
transformational properties limits its ability to influence shared values in a meaningful way (Gault
1994). Because directive leadership is not likely to create the necessary culture for shared values to
flourish. On the other hand research indicates that employees are less likely to adopt organizational or
managerial values when the employees are excluded from decision-making processes (Bass 1981).
Since this leadership style manager excluded employee from decision-making employees will be less
likely to accept organizational values and goals. Hence:
Hypothesis 1: directive leadership style is associated with shared customer-oriented values
between the bank and its frontline employees.
In contrast, in participative leadership leader consults with subordinates and considers their
suggestion and ideas when making decisions and taking particular actions. Through the consultative

34
process involved in a participative style, organizational values and employee values come into
alignment as employees recognize that the manager gives consideration to their ideas and opinions.
Because of the consultative nature of participative leadership likely that this process will greatly
enhance the degree of shared values between the bank and its employees. Hence:
Hypothesis 2: participative leadership style is associated with shared customer-oriented values
between the bank and its frontline employees.
2.2.2. Role clarity
Role clarity refers to the degree to which required information is provided about how the employee is
expected to perform his/her job (Teas et al, 1979). Role clarity is the extent to which an individual
receives and understands information required to do the job (Kelly and Hise, 1980). In managing
customer-contact employees, role clarity is a critical issue for managers, as it has been empirically
linked to employee performance and customers’ perceptions of service quality (Singh , 2000).
Employees who understand their role in organization can be better satisfied customer’ needs. Feedback
helps the frontline employees in learning about and clarifying their roles and hence has a significant
effect on the role clarity perceived by them (Evans et al., 2002). Therefore Directive leadership can be
effective in increasing role clarity because of the amount of feedback it generates (Muczyk and
Reimann 1987). Therefore, we expect that bank managers who employ a directive leadership style will
increase their employees’ role clarity:
Hypothesis 3: directive leadership style is associated with employee role clarity.
While participative leadership provides less explicit directives as to employees’ role
responsibilities, this type of management nonetheless significantly influences role clarity. A primary
difference between directive and participative leadership is the nature of communication between
managers and employees: directive leadership involves top-down communication, while participative
leadership allows employees to have input into and some control over their roles and responsibilities.
With a participative connection, employees can still gain feedback from their manager on role
expectations when needed (Clark et al, 2009). As a result, role clarity is likely to increase as
information and expectations about employees’ roles are managed by consensus (Bass 1981).
Therefore, we expect that a participative leadership style will have a positive influence on role clarity.
Hence:
Hypothesis 4: participative leadership style is associated with employee role clarity.
2.2.3. Employees’ commitment to service quality
Mowday et al (1979) defined organizational commitment as a strong belief in the organization’s goals
and values and a willingness to exert considerable effort on behalf of the organization. Employee
commitment reflects the employees' level of trust and belief in an organization’s purpose and value
system. Research has shown the stronger an employee can believe in the core values and direction of
an organization the higher the level of commitment (Porter et al, 1974). Mowday et al (1979) and
Meyer et al (1989) argue that individuals affectively committed to their organizations, (i.e. those who
identify with and involve themselves in an organization) perform at a higher level.
Previous research has devoted a great deal of attention to the relationship between leadership
behavior and organizational commitment. The findings in this area, however, are not entirely
consistent. Several studies found a positive relationship between the two variables (Alley and Gould,
1975; Porter et al., 1976.). Among the factors which contribute to a healthy organizational climate,
high morale and motivation, is the extent to which members of staff have a sense of commitment to the
organization. The extent of their commitment will have a major influence on the level of work
performance (Mullins, 2005). Employee who commitment to organization attempts to enhance their
skills and provides better services to customer (Schneider et al, 1998). Morris & Sherman (1981)
indicated that organizational commitment is able to effectively predict the employee’s performance and
turnover. Meyeret et al(1989) also found that organizational commitment was a proper indicator of

35
work performance. It is important for managers and leaders to pay more attention to the employee’s
organizational commitment.
In this study we considered commitment that employees have to service quality, therefore
Employee commitment to service quality (ECSQ) is a form of attitudinal commitment that can be
described as the strength of an individual’s dedication to providing quality service to an organization’s
customers (Ahmed and Parasuraman 1994). Although it is conceptually similar to organizational
commitment (Mowday, Steers, and Porter 1979), J. Morris and R.M. Steers (1980) have linked
leadership behavior to employees’ organizational commitment and found positive correlations between
high respect for leaders, high hierarchical structure level and organizational commitment.
Several studies indicate that participative leadership is more conducive to employee
commitment and loyalty than is directive leadership (Bass 1981). Due to its autocratic and
manipulative nature, directive leadership tends to focus on specific job tasks (Muczyk and Reimann
1987). In contrast, a participative leader invites the input of employees and strives for consensus (Bass
1981). Because participative leadership values the employee more than it does the task, such leadership
is likely to engender increased commitment among employees. As a result, the likelihood that frontline
employees will adopt the manager’s orientation to service quality increases. Hence:
Hypothesis 5: directive leadership style is associated with employee commitment to service
quality.
Hypothesis 6: participative leadership style is associated with employee commitment to service
quality.
2.3. Relationships between Employees Values and Actions
2.3.1. Shared Customer-oriented Values
When employees share the values of their organization, their job responses and behavior become more
consistent with those values. Shared values are among the most important components of any
organization’s culture (Deshpandé and Webster 1989). As such, shared values create a framework of
cultural norms and performance standards. That are sanctioned by the organization and embraced by its
employees. Employees working within this framework of shared values will better understand their
role in executing the firm’s customer-oriented mission (Hartline, Maxham, and McKee 2000). Thus,
when employee and organizational values are aligned, employees will experience greater clarity about
their role, their job, and how they contribute to the firm’s mission. A similar relationship also holds
true with respect to employee commitment. Employees who share the organization’s values tend to be
exhibit greater commitment at work (Hartline, Maxham, and McKee 2000). Furthermore, it is
reasonable to predict that when employees share the organization’s customer-oriented values, they are
more likely to exhibit commitment to serving customers well (Parasuraman, Zeithaml,and Berry 1985).
Hence:
Hypothesis 7: shared customer oriented values between the bank and their frontline employee
is associated with employee role clarity.
Hypothesis 8: shared customer oriented values between the bank and their frontline employee
is associated with employee commitment to service quality.
2.3.2. Role Clarity
Role clarity perceived by the frontline employees is not only desirable in terms of customer
satisfaction, but is also linked with employee’s job satisfaction, organizational commitment and
improved performance (de Ruyter et al., 2001). According to role theory, customer-contact employee
has a strong need for clarity on how they are expected to perform their jobs (Bush and Busch, 1981;
Teas et al., 1979). The relationship between role stress and employee commitment to service quality
has not been investigated empirically. However, research does indicate that organizational commitment
is affected negatively by role conflict and role ambiguity (Mathieu and Zajac 1990). A lack of role
clarity has a negative impact on job performance (Churchill et al, 1985). Considerable evidence

36
suggests that increased role ambiguity is associated with reduced job satisfaction and commitment
among frontline employees (Hartline and Ferrell 1996; Singh 2000). Hence, we hypothesize the
following:
Hypothesis 9: Employees’ role clarity is associated with employee commitment to service
quality.
3. Research Method 3.1. Sample
In this research for testing the hypotheses we collected the data from managers and frontline bank
employees in Iran. To collect the data for the study, 87 questionnaire Packets, each containing one
survey for the manager and four for employees that spent time directly dealing with customers for
transactions as well as responding to problems and complaints (frontline employees) consigned. The
survey asked managers about their leadership styles, while frontline employees were asked about their
shared customer values, role clarity and commitment to service quality. From a total of 348 employee
questionnaires distributed, 194 usable questionnaires were returned. The response rate was 55.74%.
Meanwhile, all 87 manager questionnaires were completed, and the response rate was 100%. The
demographic characteristics of employees and general managers are reported in Table1.
Table 1: Demographic Characteristics of Frontline Employees and Managers
Frontline Employees
n = 194
Managers
n = 87
Frequency Percentage Frequency Percentage
Gender
Male 124 62.9 85 97.7
Female 72 37.1 2 2.3
Age (years)
20-30 53 27.3 8 9.2
31-40 108 55.7 19 21.8
41-50 32 16.5 36 41.4
51-60 1 5 24 27.6
Education
Diploma 32 16.5 10 11.5
Senior High School 50 25.8 17 19.5
Bachelor 106 54.6 57 65.5
MA 6 3.1 3 3.5
Experience (years)
under 7 62 32 12 13.8
7–14 101 52.1 20 23
15–22 24 12.4 37 42.5
22–30 7 3.5 18 20.7
3.2. Measurement
Based on our review of the previous related literature, we constructed our survey instrument. We
utilized a multiple-item method; in which each item was measured on a five-point Likert scale from
strongly disagree to strongly agree. Prior to the data analysis, the measurement instruments were
evaluated for reliability. This was done to determine the degree to which the observed variables
measured the ‘‘true” value, and whether they were ‘‘error free.” Thus, the constructs were tested for
reliability, using Cronbach’s alpha test. Nunnally (1994) suggested that the score for each construct
should be greater than 0.6 to be considered reliable. As shown in Table 2, the Cronbach’s alpha
(reliability) for variable. Because the overall reliability of measurement was above 0.7, the
measurement instrument was shown to have a sufficient internal consistency. As a result, the data were

37
found to be appropriate for further analysis. In an effort to test for the convergent and discriminant
validity of the constructs, confirmatory factor analysis was employed. Factor analysis confirmed factor
loading in each variable to provide the appropriate factor to examine the research model. The
confirmatory factor analysis of the measurement model will categorize the appropriate factor variables
and will use them to analyze the results.
Conducting a Confirmatory Factor Analysis (CFA) of measurement model confirms the factor
structure of the measures as used. When the factors are appropriately identified and loaded, the
hypothesized structural model can be tested (Hair et al., 2003). Thus, the application of factor analysis
was deemed appropriate. According to Hair et al(2003), in order to determine the minimum loading
necessary to include an item in its respective construct, variables with loading greater than 0.3 were
considered significant; loading greater than 0.4, more important; and loadings of 0.5 or greater were
quite significant. Thus, this study accepts items with loading of 0.5 or greater. As shown in the Table2,
the internal consistency reliability (Cronbach’s alpha) of each measure is above the commonly
accepted threshold of .60. Also, the results of confirmatory factor analysis are shown in table 2. The
results indicated a reasonable fit of the six factor model to the employees data on the basis of a number
of fit statistics ( =193.66, df =186, root mean square error of approximation [RMSEA] =.015,
Goodness-of-Fit Index [GFI] = .91, Adjusted Goodness of Fit Index (AGFI) =.89, Normed Fit Index
[NFI] = .81, Comparative Fit Index [CFI] = .91. Meanwhile, Goodness of Fit Statistics for manager
data indicates: ( =67.91, df = 26, root mean square error of approximation [RMSEA] = .067,
Goodness-of-Fit Index [GFI] = .85, Adjusted Goodness of Fit Index (AGFI) =.74, Normed Fit Index
[NFI] =.88, Comparative Fit Index [CFI] =.90
Table 2: Result of confirmatory factor analysis and Cronbach’s alpha
Item Factor Loading t-value Cronbach’s alpha
Directive leadership 0.823
DL1 0.55 4.74
DL2 0.52 4.51
DL3 0.50 4.28
DL4 0.58 5.03
DL5 0.75 6.72
Participative leadership 0.786
PL1 0.52 4.31
PL2 0.64 5.32
PL3 0.56 4.60
PL4 0.64 5.38
Shared customer oriented values 0.89
SCV1 0.69 5.99
SCV2 0.75 6.40
SCV3 0.66 5.75
SCV4 0.54 4.71
SCV5 0.55 4.80
Role clarity 0.765
RC1 0.65 6.19
RC2 0.65 6.14
RC3 0.70 6.71
RC4 0.21 1.90
RC5 0.58 5.47
RC6 0.62 5.90
RC7 0. 60 5.64
RC8 0. 57 5.36
Employees’ commitment to service
Quality
0.856
ECSQ1 0.68 6.08
ECSQ2 0.54 4.84
ECSQ3 0.59 5.31

38
ECSQ4 0.61 5.42
ECSQ5 0.51 4.52
ECSQ6 0.55 4.95
ECSQ7 0.13 1.17
ECSQ8 0.51 4.51
3.3. Analysis
When the appropriate measurement model has been established, the next step is to test the full
structural model. Structural equation modeling is a tool for testing the causal relationships among the
latent variables, explaining the causal effects and assigning the explained and unexplained variance
(Joreskog & Sorbom, 2004). The relationships hypothesized in Figure 1 were tested using LISREL 8.8
to estimate completely standardized parameter estimates and t-values. The structural equation
modeling was utilized to determine the significant relationships among variable. The structural
equation modeling confirms this conceptual model perfectly because of causal relationships among
these variables. The results are summarized in Table 3. Model fit statistics in Table 4 collectively
indicate that the proposed model fits the data relatively well. Chi-Square= 2.17 and df=2 (p = .0324)
indicate that the fit for the model is acceptable. And model, shown in Exhibit 5
Table 3: Model Test Results
Hypothesis Path Parameter Estimate t-Value
H1 Directive leadership shared values -0.36 -6.87
H2 Participative leadership shared values 0.43 8.14
H3 Directive leadership role clarity 0.47 7.62
H4 Participative leadership role clarity -0.09 -1.41
H5 Directive leadership ECSQ -0.26 -5.73
H6 Participative leadership ECSQ 0.34 7.74
H7 shared values role clarity 0.43 6.32
H8 shared values ECSQ 0.36 7.35
H9 Role clarity ECSQ 0.30 6.99
Table 4: Goodness of Fit Statistics
Fitting indexes Appropriate criteria
RMR = root mean square error RMR < 0.05 0.025
GFI = Goodness-of-Fit Index GFI > 0.9 0.978
AGFI=adjusted goodness-of-fit index AGFI > 0.9 0.934
RMSEA = root mean square error of approximation RMSEA < 0.05 0.011
NFI = Normed Fit Index NFI > 0.9 0.984
CFI = Comparative Fit Index CFI > 0.9 0.97
IFI= Incremental fit index IFI > 0.9 0.97
4. Results This study examined the impact of directive and participative leadership style on employee’s
responses, including shared customer oriented values, role clarity and employees commitment to
service quality in Iranian banks. Results indicated that leadership styles can influence frontline
employee’s responses. The path diagram has been showed in figure 2 that indicated path coefficients
between variables. The findings indicated that directive leadership has negative impact on shared
customer oriented values and employees’ commitment to service quality. In other words due to
autocratic nature of directive leadership, this leadership style reduces the employees’ commitment to
service quality and shred values between bank and employees. Therefore the results proved hypotheses
H1 and H5. Moreover directive leadership significantly increases clarity of role between employees in
the environment of bank. Because of the authoritative nature of directive leadership, this leadership

39
style provides subordinates with an explicit understanding of their responsibilities and roles within the
organization (Hughes, Ginnett, and Curphy 1999). Therefore our findings proved hypotheses H3.
Hypotheses in our study are concerned with the direct effects of leadership styles on employees’
commitment to service quality. However, we were interested in total effects of these leadership styles
on employees’ attributes. Accordingly, we computed their direct, indirect, and total effects as shown in
table 5 we use these findings, as well as our hypothesis testing results, in drawing implications from
our study. In addition to direct effect of directive leadership on employees’ commitment to service
quality, this factor also has indirect impact on employees’ commitment to service quality via shared
customer oriented values and role clarity. The results indicated that total effect of this leadership style
on employee’s commitment is negative. Consequently, it can be stated that directive leadership
significantly diminishes employees’ commitment to service quality.
Participative leadership significantly impacts on employees’ commitment to service quality and
shared customer oriented values between employees and bank. These findings demonstrate that
employees who work in a participative bank environment are influenced by the firm’s culture and
values. The path coefficient between participative leadership and two variables (shared customer
oriented values and employees’ commitment to service quality) are strong and positive which indicates
that the use of participative leadership style by managers would cause the increase in employees’
commitment and shared values. Therefore, our findings proved hypotheses H2 and H6. Contrary to
hypothesis 4, participative leadership does not directly influence role clarity. Although this leadership
style has direct effect on employees’ commitment to service quality but it has indirect effect through
role clarity and shared values on employees’ commitment to service quality.
Shared values variable has a positive effect on role clarity and commitment to service quality,
supporting hypotheses 7 and 8. The path coefficient between shared values and role clarity is strong
and positive. In fact, the increase of shared values between banks and employees would raise the role
clarity. Also the path coefficient between shared values and commitment to service quality is positive.
This finding indicates the importance of aligning employee and organizational values in a bank setting.
Role clarity has a positive effect on employees’ commitment to service quality, supporting hypotheses
9.
Figure 2: Path Diagram of the Proposed Model
Directive
Leadership
Shared
customer values
Role Clarity
Participative
Leadership
Employees’
Commitment to
service quality
0.47
-0.36
-0.26
-0.09
0.34
0.43
0.43 0.36
0.30
40
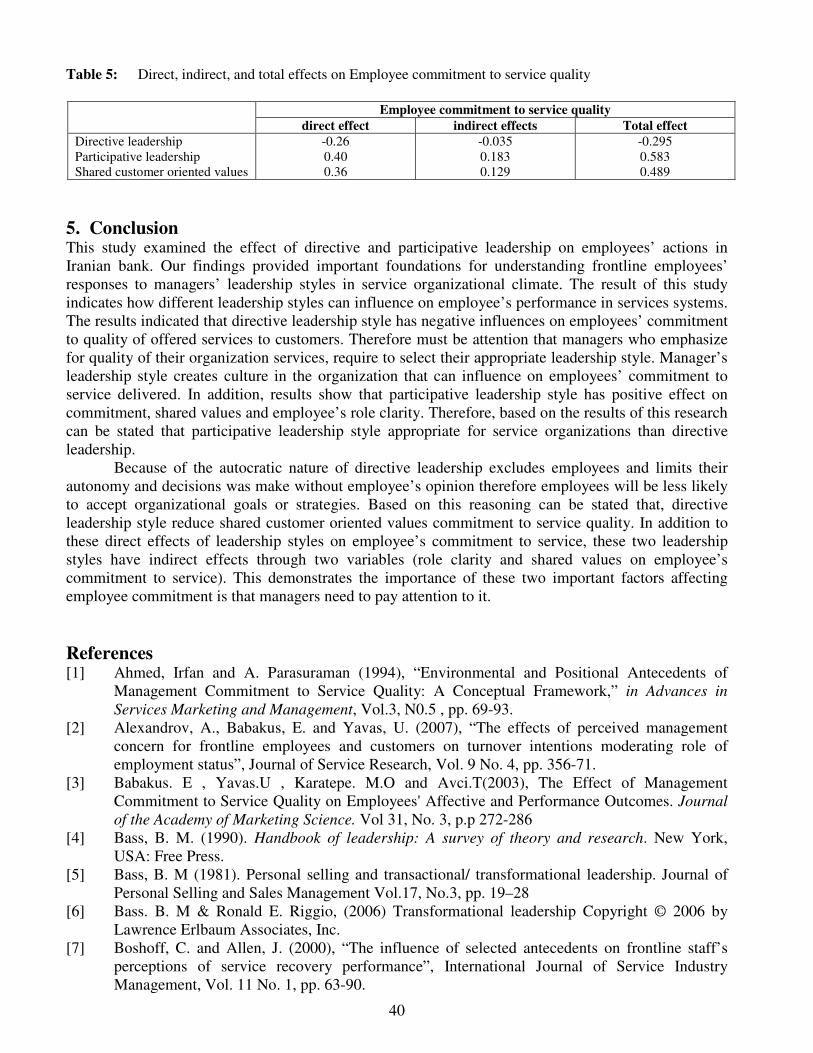
Table 5: Direct, indirect, and total effects on Employee commitment to service quality
Employee commitment to service quality
direct effect indirect effects Total effect
Directive leadership -0.26 -0.035 -0.295
Participative leadership 0.40 0.183 0.583
Shared customer oriented values 0.36 0.129 0.489
5. Conclusion This study examined the effect of directive and participative leadership on employees’ actions in
Iranian bank. Our findings provided important foundations for understanding frontline employees’
responses to managers’ leadership styles in service organizational climate. The result of this study
indicates how different leadership styles can influence on employee’s performance in services systems.
The results indicated that directive leadership style has negative influences on employees’ commitment
to quality of offered services to customers. Therefore must be attention that managers who emphasize
for quality of their organization services, require to select their appropriate leadership style. Manager’s
leadership style creates culture in the organization that can influence on employees’ commitment to
service delivered. In addition, results show that participative leadership style has positive effect on
commitment, shared values and employee’s role clarity. Therefore, based on the results of this research
can be stated that participative leadership style appropriate for service organizations than directive
leadership.
Because of the autocratic nature of directive leadership excludes employees and limits their
autonomy and decisions was make without employee’s opinion therefore employees will be less likely
to accept organizational goals or strategies. Based on this reasoning can be stated that, directive
leadership style reduce shared customer oriented values commitment to service quality. In addition to
these direct effects of leadership styles on employee’s commitment to service, these two leadership
styles have indirect effects through two variables (role clarity and shared values on employee’s
commitment to service). This demonstrates the importance of these two important factors affecting
employee commitment is that managers need to pay attention to it.
References [1] Ahmed, Irfan and A. Parasuraman (1994), “Environmental and Positional Antecedents of
Management Commitment to Service Quality: A Conceptual Framework,” in Advances in
Services Marketing and Management, Vol.3, N0.5 , pp. 69-93.
[2] Alexandrov, A., Babakus, E. and Yavas, U. (2007), “The effects of perceived management
concern for frontline employees and customers on turnover intentions moderating role of
employment status”, Journal of Service Research, Vol. 9 No. 4, pp. 356-71.
[3] Babakus. E , Yavas.U , Karatepe. M.O and Avci.T(2003), The Effect of Management
Commitment to Service Quality on Employees' Affective and Performance Outcomes. Journal
of the Academy of Marketing Science. Vol 31, No. 3, p.p 272-286
[4] Bass, B. M. (1990). Handbook of leadership: A survey of theory and research. New York,
USA: Free Press.
[5] Bass, B. M (1981). Personal selling and transactional/ transformational leadership. Journal of
Personal Selling and Sales Management Vol.17, No.3, pp. 19–28
[6] Bass. B. M & Ronald E. Riggio, (2006) Transformational leadership Copyright © 2006 by
Lawrence Erlbaum Associates, Inc.
[7] Boshoff, C. and Allen, J. (2000), “The influence of selected antecedents on frontline staff’s
perceptions of service recovery performance”, International Journal of Service Industry
Management, Vol. 11 No. 1, pp. 63-90.

41
[8] Clark & et al. (2009). The Effects of Leadership Style on Hotel Employees' Commitment to
Service Quality. Cornell Hospitality Quarterly, Vol.50, No.2, pp.209–231 [9] de Ruyter, Ko., Wetzels, M. and Feinberg, R. (2001), “Role stress in call centres: its effects on
employee performance and satisfaction”, Journal of Interactive Marketing, Vol. 15 No. 2, pp.
23-35.
[10] Drucker, P. F. (1993). The practice of management. New York, USA: Harper Business.
[11] Ehrhart, M. G. (2004). Leadership and procedural justice climate as antecedents of unit level
organizational citizenship performance. Personnel Psychology, 57, 61-94.
[12] Evans, K.R., Schlacter, J.L., Schultz, R.J. and Gremler, D.D. (2002), “Salesperson and sales
manager perceptions of salesperson job characteristics and job outcomes: a Perceptual
congruence approach”, Journal of Marketing Theory and Practice, Vol. 10 No. 4, pp. 30-44.
[13] Hair, J. F., Anderson, R. E., Tatham, R. L., and Black, W. C. Multivariate Data Analysis, 5th
edition. Pearson Education, India, 2003.
[14] Hartline, Michael D., Barbara Wooldridge, and Keith C. Jones. 2003. Guest perceptions of
hotel quality: Determining which employee groups count most. Cornell Hostel and Restaurant
Administration Quarterly 44: 43–52.
[15] Hartline, Michael D., James G. Maxham III, and Darryl O. McKee. 2000. Corridors of
influence in the dissemination of customer-oriented strategy to customer contact service
employees. Journal of Marketing 64 (April): 35–50.
[16] Hitt, W. D. (1988). The leader-manager: Guidelines for action. Columbus, Ohio. Batelle press.
[17] Hutchinson, S and Purcell, J (2003) Bringing Policies to Life: The vital role of front line
managers in people management, CIPD, London
[18] J.C. Nunnally, I.H. Bernstein, Psychometric Theory, 3rd ed. McGraw-Hill, New York, 1994.
[19] Jaworski, B.J. and Kohli, A.K. (1993), “Market orientation: antecedents and consequences”,
Journal of Marketing, Vol. 57 No. 3, pp. 53-70
[20] Jenkins, K.J. (1992), “Service quality in the skies”, Business Quarterly, Vol. 57 No. 2, pp. 13-
18.
[21] Joreskog, K.G., & Sorbom, D. (2004). LISREL. Retrieved October 27, 2004 from
www.ssicentral.com
[22] Karatepe, O.M., Yavas, U. and Babakus, E. (2007), “The effects of customer orientation and
job resources on frontline employees’ job outcomes”, Services Marketing Quarterly, Vol. 29
No. 1, pp. 61-79.
[23] Mullins .L. J. (2005) Management and organizational behavior .7th ed, Visit us on the World
Wide Web at: www.pearsoned.co.uk
[24] Malhotra, N., & Mukherjee, A. (2004). The relative influence of organizational commitment
and job satisfaction on service quality of customer-contact employees in banking call centers.
Journal of Services Marketing, 18, 162-174.
[25] Mathieu, John E. and Dennis M. Zajac (1990), “A Review and Meta- Analysis of the
ntecedents, Correlates, and Consequences of Organizational Commitment,” Psychological
Bulletin, 108 (September), 171-94.
[26] Meyer, J. P., Paunonen, S. V., Gellatly, I. R., Goffin, R. D., & Jackson, D. N. (1989).
Organizational commitment and job performance: It’s the nature of the commitment that the
counts. Journal of Applied Psychology, 74, 152-156.
[27] Morris, J. & Steers, R. M. (1980). Structural influences on organizational commitment. //
Journal of Vocational Behavior, 17.
[28] Morris, J. H., & Sherman, J. D. (1981). Generalizability of an organizational commitment
model. Academy of Management Journal, 24, 512-526.
[29] Mowday, R. T., Steers, R. M. & Porter, L. W. (1979). The measurement of organizational
commitment. // Journal of Vocational Behavior, 14.
42
[30] Mowday, Richard T., Richard M. Steers, and Lyman W. Porter (1979), “The Measurement of
Organizational Commitment,” Journal of Vocational Behavior, 14 (April), 224-47.
[31] Muczyk, Jan P., and Bernard C. Reimann. 1987. The case for directive leadership. Academy of
Management Executive 1 (3): 301–11.
[32] Newman, J.E. (1974). Predicting absenteeism and turnover: a field comparison of Fishbein’s
model and traditional job attitude measures.// Journal of Applied Psychology, Vol. 59.
[33] Porter, L. W., Steers, R. M., Mowday, R. T., and Boulian, P. V. (1974). Organizational
commitment, job satisfaction, and turnover among psychiatric technicians. Journal of Applied
Psychology, 59, 5, 603-609.
[34] Porter. L.W., Campon, W.J. and Smith, F.J. (1976). Organizational Commitment and
managerial turnover: a longitudinal study.// Organizational Behavior and Human Performance,
Vol. 9.
[35] Porter. L.W., Campon, W.J. and Smith, F.J. (1976). Organizational Commitment and
managerial turnover: a longitudinal study. Organizational Behavior and Human Performance,
Vol. 9.
[36] Robbins, S. P. (1993). Organizational behavior. Prentice-Hall, Inc., 366-392.
[37] Rogers JD, Clow KE, Kash TJ. 1994. Increasing job satisfaction of service personnel. Journal
of Services Marketing 8(1): 14–26.
[38] Rokeach, M. (1973). The nature of human values. New York: The Free Press.
[39] Rust RT, Stewart GR, Miller H, Pielack D. 1996. The satisfaction and retention of frontline
employees: a customer satisfaction measurement approach. International Journal of Service
Industry Management 7(5): 62–80.
[40] Singh, Jagdip. 2000. Performance productivity and quality of frontline employees in service
organizations. Journal of Marketing 64 (April): 15–34.
[41] Spreitzer, Gretchen M., Suzanne C. De Janasz, and Robert E. Quinn. 1999. Empowered to lead:
The role of psychological empowerment in leadership. Journal of Organizational Behavior 20:
511–26.
[42] Teas, R.K., DeCarlo, T.E and McElroy, J.C. (1997), “Salesperson performance attribution
processes and the formation of expectancy estimates”, Journal of Personal Selling & Sales
Management, Vol. 17 No. 3, pp. 1-17.
[43] Yousef, D.A. (2000), “Organizational commitment: a mediator of the relationships of
leadership behavior with job satisfaction and performance in a non-western country”, Journal of
Managerial Psychology, Vol. 15 No. 1.