direct nucleation control of crystal size distribution ... · direct nucleation control of crystal...
TRANSCRIPT

Loughborough UniversityInstitutional Repository
Direct nucleation control ofcrystal size distribution in
pharmaceuticalcrystallization
This item was submitted to Loughborough University's Institutional Repositoryby the/an author.
Citation: ABU BAKAR, M.R. ... et al, 2008. Direct nucleation control of crys-tal size distribution in pharmaceutical crystallization. 17th International Sym-posium on Industrial Crystallization, September 14th-17th, Maastricht, TheNetherlands.
Additional Information:
• This is a conference paper. It was presented at ISIC 17.
Metadata Record: https://dspace.lboro.ac.uk/2134/4747
Please cite the published version.
This item was submitted to Loughborough’s Institutional Repository (https://dspace.lboro.ac.uk/) by the author and is made available under the
following Creative Commons Licence conditions.
For the full text of this licence, please go to: http://creativecommons.org/licenses/by-nc-nd/2.5/

DIRECT NUCLEATION CONTROL OF CRYSTAL SIZE DISTRIBUTION IN PHARMACEUTICAL CRYSTALLIZATION
M. R. Abu Bakar, A. N. Saleemi, C. D. Rielly, Z. K. Nagy† Department of Chemical Engineering, Loughborough University, Loughborough, Leicestershire, LE11 3TU, United Kingdom †E-mail: [email protected] The control of crystal size distribution (CSD) in pharmaceutical crystallization is of primary importance, as downstream processes such as filtration or drying are greatly affected by the properties of the CSD. It is recognized that the variability in the final CSD is mainly caused by the significant uncertainties in the nucleation rates, and therefore, a good control of nucleation events will result in the desired CSD. In this paper, a new direct nucleation control (DNC) approach is introduced that directly controls the onset of nucleation. The approach uses information on nucleation, provided by focused beam reflectance measurement (FBRM), in a feedback control strategy that adapts the process variables, so that the desired quality of product is achieved, for example large crystals with a narrow CSD. In addition, DNC provides in situ fines removal through the operating policy, rather than having additional equipment and external recycle loops. DNC does not require concentration measurement and has the advantage of being a model-free approach, requiring no information on nucleation or growth kinetics in order to design an operating curve; the system automatically and adaptively detects the boundary of the operating curve. The approach has been applied for the crystallization of glycine and experimental results demonstrate the benefits of DNC of producing larger crystals with narrower CSD compared to classical operations. 1. Introduction Crystallization is an important unit operation used in a variety of industries. It can be regarded as the heart of pharmaceutical industry, as about 90% of active pharmaceutical ingredients (APIs) are produced in crystalline form [AUL01]. The crystallization operation is often critical because it determines product properties such as the crystal size distribution (CSD), habit and polymorphic form. The CSD is of primary importance since it influences subsequent downstream operations such as filtration and drying, and the product performance such as dissolution and bioavailability. Along with the United States Food and Drug Administration’s (FDA) Process Analytical Technology (PAT) initiative, the development of control approaches, which can improve the manufacturing of products with desired properties, has become of significant interest [YU04].
The majority of control approaches applied in crystallization, affect the CSD indirectly by implementing a temperature or anti-solvent profile in time to follow a given supersaturation profile in the phase diagram. These profiles are obtained either using simple trial-and-error experimentation or more complex model-based or direct-design approaches [FUJ05, ZHO06]. However, it is recognized that the variability in the final CSD is mainly caused by the significant uncertainties in the nucleation rate, and all of the above mentioned approaches in essence try to identify operating policies, which provide an acceptable compromise between crystal growth and nucleation [FUJ05].
Lasentec focused beam reflectance measurement (FBRM) is one of the in-situ instruments that has been used extensively in the crystallization processes to provide qualitative as well as quantitative information about nucleation and crystal growth [BAR02, BAR06, CHE07a, CHE07b, LIO04, ZHO06]. Despite the widespread use of FBRM for monitoring crystallization processes, up until now only a few attempts have been reported

that use on-line FBRM information to augment existing crystallization operations [DOK06, CHE07b]. In this paper a novel approach will be introduced that directly controls the onset of nucleation in the case of (i) anti-solvent and (ii) combined cooling and anti-solvent crystallization processes. A desired number of FBRM counts, which indicate the number density of crystals, is maintained during the entire duration of crystallization using a feedback control strategy that adapts the anti-solvent/solvent addition, or cooling/heating rate, to directly control the nucleation or dissolution rates. The experimental results from the implementation of the DNC approach for the crystallization of glycine are reported. 2. Direct Nucleation Control Approach The direct nucleation control (DNC) is a model-free approach in which the number of counts measured by the FBRM is directly controlled using a feedback control strategy. By definition, the total counts measured by FBRM is the sum of the number of chord length measurements detected in all the channels (1 through 38 in the FBRM model used) that represents chord length range from 0.8 to 1000 µm, and is an efficient measure of the nucleation rate, which contributes predominantly to the changes in the number of particles. Figure 1 shows the schematic block diagram of the DNC approach for anti-solvent crystallization systems. A similar structure can be used for cooling crystallization.
A typical operating profile during DNC, represented in the phase diagram, is illustrated in Figure 2. The DNC approach automatically switches between heating and cooling or solvent and anti-solvent addition (or a combination of the two) to generate nucleation, or fines dissolution, to maintain the desired number of counts. If the number of counts exceeds the desired value, the excess particles are dissolved by solvent addition, or an increase in temperature, which drives the process into the undersaturated zone until the number of counts decreases. The proposed DNC approach provides in situ fines removal through the operating policy, rather than having additional equipment and external recycle loops.
An additional novel feature of the DNC is that it does not use predetermined heating or
cooling polices. The heating/cooling rates (or solvent/anti-solvent addition rates) are automatically determined during the entire duration of the crystallization in correlation with the extent of nucleation detected. The DNC approach has the benefit of automatically driving the crystallization process toward the optimal operating curve, which is close to the boundary of the metastable zone (MSZ), automatically and adaptively detecting the metastable zone limits. Therefore DNC provides a very robust methodology for crystallization scale-up, through FBRM feedback control, which requires virtually no a priori information about the model, kinetics or metastable zone width of the process.
Nucleation controllerwset(t)
Crystallizer
Flow controller
# counts/s from FBRM
+
-- + desired
# counts/s
w(t)
Temperature, Solvent / Antisolvent Ratio
Solu
tion
Con
cen
trat
ion
Solubility curve
DNC operating profile
MSZ limit
Figure 1. A block diagram of the DNC approach. Figure 2. Typical DNC operating profile.

3. Experimental Section 3.1. Materials. In all experiments, aqueous glycine (> 99.5% purity, Fisher BioReagents) solutions were prepared, corresponding to a solubility of 22.5 g of glycine per 100 g of water at 20oC [MUL01]. Glycine was dissolved in water by heating to 35°C at a rate of 5°C/min. After the solution equilibrated at 35°C for 10 minutes, the temperature of the solution was lowered to 30°C with a cooling rate of 1°C/min, after which the temperature was further reduced to 25°C at 0.3°C/min. The temperature of the solution was maintained at 25°C prior to the start of experiment. Ethanol (99.99% purity, analytical reagent grade, Fisher Scientific) was used as an anti-solvent. 3.2. Apparatus. The crystallization experiments were performed in a jacketed 1000-ml glass vessel. The temperature in the vessel was controlled with a stainless steel Pt100 thermocouple connected to a thermofluid (Dow Corning 200/20 cS) circulator bath (Huber Ministat 125). The temperature readings were recorded every 4 seconds on the PC by a control interface written in LabVIEW (National Instruments). An overhead stirrer with a stainless steel three-blade marine type impeller was used to agitate the system at 400 rpm. A FBRM probe (model A100, Lasentec) was inserted into the solution to measure chord length distributions. The distributions were collected every 6 seconds and averaged during collection. They were monitored using the control interface software (version 5.3). The solvent and anti-solvent were pumped into the vessel by a MasterFlex console driver with EasyLoad II peristaltic pump, calibrated before the experiments. Two-way solenoid valves were used for the alternate addition of solvent/anti-solvent, which was controlled by the PC. A schematic representation of the experimental set-up is shown in Figure 3.
3.3. Uncontrolled Anti-solvent Addition. This experiment was conducted to see the maximum total counts the system could achieve, so that the value can be used as an upper limit, below which suitable desired values of counts could be selected for the subsequent controlled experiments. It involves the continuous addition of anti-solvent to an aqueous glycine solution at a fixed rate of 10 g/min until the total counts per second stabilised. 3.4. DNC by Anti-solvent/Solvent Addition. In this experiment, the desired number of counts per second were selected based on the maximum counts achieved in the uncontrolled anti-solvent addition experiment described previously. Anti-solvent was added to the aqueous glycine solution until primary nucleation occurred, after which the addition rate was reduced or stopped to avoid an overshoot from the desired number of counts. Once the number of counts exceeds the desired value, the addition of anti-solvent was stopped and sequentially, solvent was added to dissolve the fine particles and thus correcting the number of counts. The anti-solvent was continuously added at a slow rate towards the end to ensure that the supersaturation in the system is maintained without triggering nucleation. The experiment was stopped once the suspension reached the 1000 ml mark on the vessel. The crystals produced were filtered and dried for subsequent analysis. This procedure was repeated with different desired number of counts per second. 3.5. DNC by Combined Anti-solvent Addition and Heating-Cooling. This experiment follows the same procedure as described in 3.4 but instead of adding solvent, heating was used to correct the nuclei count, should the generation of nuclei exceed the desired number of counts per second. Once the desired number of counts was achieved, the supersaturation was continuously generated through either cooling or anti-solvent addition.
FBRM
Stirrer
Thermo-regulator
Antisolvent
Solvent
Pump
PC
Figure 3. A schematic representation of the experimental set-up for DNC experiments.

4. Results and Discussion 4.1. Uncontrolled Anti-solvent Addition. Figure 4 shows the profile number of counts measured by FBRM from the start of the anti-solvent addition (at t=0). Once nucleated, the number of counts increased very rapidly to almost 7000 #/s, after which there was a slight drop and eventually stabilised at 6000 #/s. The drop may be due to the dissolution of some small crystals as a result of the dilution. The sudden formation of nuclei produced a rapid reduction in the solute concentration and together with the continuous addition of anti-solvent, the dilution effect became prominent. Based on the result of this experiment, three target numbers of counts for the subsequent nucleation control experiments were selected i.e. 2000, 3000 and 4000 #/s. 4.2. DNC by Anti-solvent/Solvent Addition Figure 5(a) shows the profiles of number of counts and anti-solvent/solvent addition rate for a DNC target of 2000 #/s. It can be seen from the profile that there were a couple of overshoots and undershoots before the system finally reached the desired value. It was found that primary nucleation is always difficult to control as the increase in number of counts after the onset of nucleation is very fast.
Figure 5(b) shows the evolution of fine and coarse crystals during DNC. The trend shows that solvent addition decreases the amount of fines while having little effect on the number of coarse crystals. The continuous increase in the number of coarse crystals indicates growth into the range > 250 µm. This result shows that DNC is able to provide in-situ automatic fine removal and it requires no additional equipment or design to do so. Figure 6 shows similar results and trends for the DNC experiment at 4000 #/s. However, it was noticed that the smaller desired number of counts were more difficult to control and it gave higher noise.
In order to get information about the size of the crystals, the square-weighted mean chord length (SWMCL) statistic was used, defined as
3
1
2
1
k
i iik
i ii
n MSWMCL
n M
=
=
=∑
∑. (1)
Figure 5. Profiles of (a). Number of counts and anti-solvent/solvent addition rate, and (b). number of fines and coarse for nucleation control experiments at desired counts of 2000 #/s.
0
2000
4000
6000
8000
0 10 20 30 40
Time (min)
Tota
l cou
nts
(#/s
)
Target counts
Figure 4. Profiles of total counts for the uncontrolled experiment with an anti-solvent addition rate of 10 g/min. The dashed-lines are the target counts.
0
1000
2000
3000
4000
0 20 40 60 80
Time (min)
# of
cou
nts/
s
1
6
11
16
21
Add
ition
rate
(g/m
in)
Total counts (#/s)AntisolventSolvent
(a)
0
500
1000
1500
2000
0 20 40 60 80
Time (min)
# of
cou
nts/
s (fi
ne)
0
40
80
120
160
200
240
# of
cou
nts/
s (c
oars
e)
Fine (<22 µm)
Coarse (>250 µm)
(b)
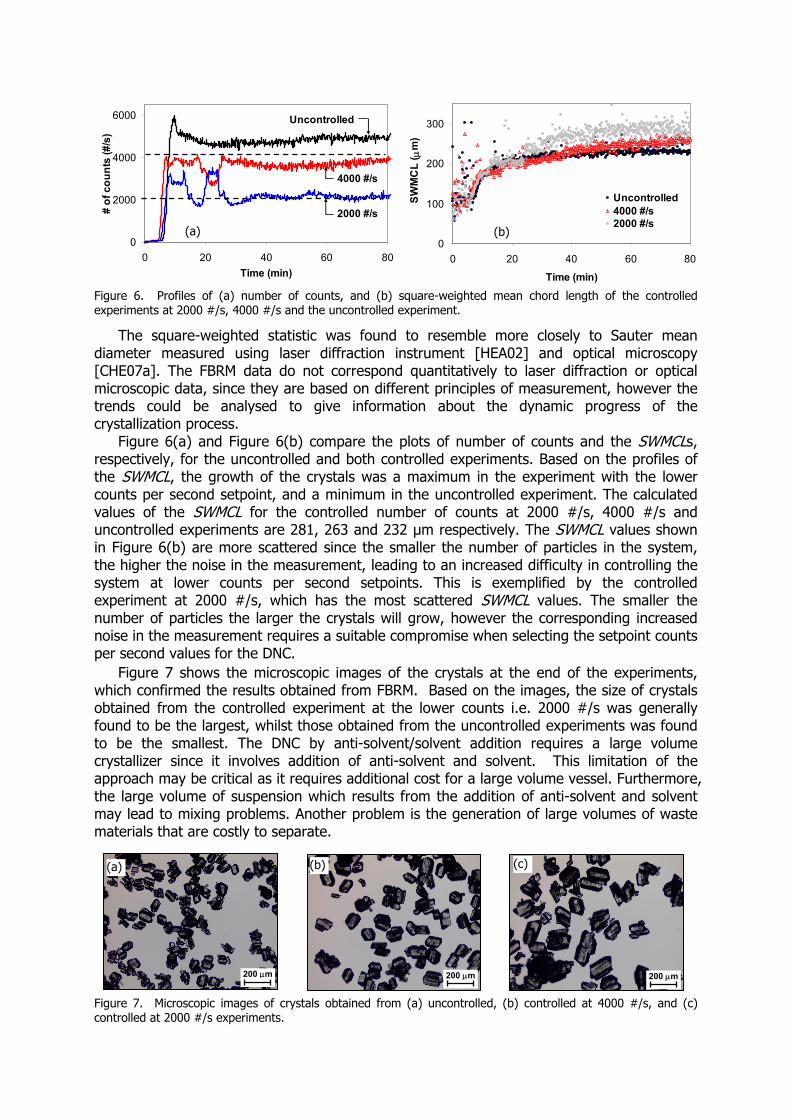
Figure 6. Profiles of (a) number of counts, and (b) square-weighted mean chord length of the controlled experiments at 2000 #/s, 4000 #/s and the uncontrolled experiment.
The square-weighted statistic was found to resemble more closely to Sauter mean diameter measured using laser diffraction instrument [HEA02] and optical microscopy [CHE07a]. The FBRM data do not correspond quantitatively to laser diffraction or optical microscopic data, since they are based on different principles of measurement, however the trends could be analysed to give information about the dynamic progress of the crystallization process.
Figure 6(a) and Figure 6(b) compare the plots of number of counts and the SWMCLs, respectively, for the uncontrolled and both controlled experiments. Based on the profiles of the SWMCL, the growth of the crystals was a maximum in the experiment with the lower counts per second setpoint, and a minimum in the uncontrolled experiment. The calculated values of the SWMCL for the controlled number of counts at 2000 #/s, 4000 #/s and uncontrolled experiments are 281, 263 and 232 µm respectively. The SWMCL values shown in Figure 6(b) are more scattered since the smaller the number of particles in the system, the higher the noise in the measurement, leading to an increased difficulty in controlling the system at lower counts per second setpoints. This is exemplified by the controlled experiment at 2000 #/s, which has the most scattered SWMCL values. The smaller the number of particles the larger the crystals will grow, however the corresponding increased noise in the measurement requires a suitable compromise when selecting the setpoint counts per second values for the DNC.
Figure 7 shows the microscopic images of the crystals at the end of the experiments, which confirmed the results obtained from FBRM. Based on the images, the size of crystals obtained from the controlled experiment at the lower counts i.e. 2000 #/s was generally found to be the largest, whilst those obtained from the uncontrolled experiments was found to be the smallest. The DNC by anti-solvent/solvent addition requires a large volume crystallizer since it involves addition of anti-solvent and solvent. This limitation of the approach may be critical as it requires additional cost for a large volume vessel. Furthermore, the large volume of suspension which results from the addition of anti-solvent and solvent may lead to mixing problems. Another problem is the generation of large volumes of waste materials that are costly to separate.
Figure 7. Microscopic images of crystals obtained from (a) uncontrolled, (b) controlled at 4000 #/s, and (c) controlled at 2000 #/s experiments.
0
2000
4000
6000
0 20 40 60 80Time (min)
# of
cou
nts
(#/s
)
2000 #/s
Uncontrolled
4000 #/s
0
100
200
300
0 20 40 60 80
Time (min)
SWM
CL
( µm
)
Uncontrolled4000 #/s2000 #/s
200 µm200 µm 200 µm
(a)
(a) (b) (c)
(b)

Figure 8. Profiles of (a) number of counts, square-weighted mean chord length, process temperature, and anti-solvent addition rate, and (b) number of fine and coarse particles in the nucleation control experiment by a combined approach with temperature profile. 4.3. DNC by Combined Anti-solvent Addition and Heating-Cooling. In these experiments the hard constraint of limited vessel capacity was relaxed by using heating/cooling to control the level of supersaturation instead of solvent/anti-solvent additions. In this approach, the vessel’s volume requirement is only to accommodate the initial anti-solvent addition for generating the nuclei.
Figure 8(a) shows the profiles of number of counts, SWMCL, process temperature, and anti-solvent addition rate for the experiment using the combined approach of anti-solvent addition & heating–cooling. In the experiment, the desired number of counts was 3000 #/s. Initially, when the total counts went beyond the desired value upon nucleation as a result of the anti-solvent addition, the addition was stopped and subsequently, temperature was increased in small intervals to dissolve the excessive nuclei. The total counts gradually decreased as the temperature was increased. As soon as the total counts went below 4000 #/s, cooling was initiated. The total counts eventually settled at 3000 #/s. They remained approximately at the same level throughout the process even when the system was cooled down to 15°C at a rate of 0.3°C/min. This continuous cooling was required to generate the supersaturation for crystal growth.
The profile of SWMCL of the system during the experiment shows that the mean size of the crystals was not affected very much by the heating, only reduced slightly at high temperature (approximately at 38°C). As confirmed by the trends of the evolution of fines and coarse crystals during DNC in Figure 8(b), the heating dissolves only fine crystals, which do not contribute a lot to the SWMCL. As the cooling continues, the mean size of the crystals increased significantly as shown by the steady increase of the SWMCL. It can also be seen that during cooling, there was a slight increase in the number of counts.
This implies that besides promoting growth as indicated by an increase in the mean size of the crystals, the cooling also generated fines, which made up the number of counts. In this experiment, the amount of ethanol consumed was very little (53 g), as it was only used to initiate the nucleation.
As an alternative to cooling towards the end of the batch for supersaturation generation, hence promoting growth, the application of anti-solvent addition was also tested. Figure 9 shows the profiles of the number of counts, SWMCL, process temperature and anti-solvent addition rate during the last 115th minutes of the experiment.
The figure shows that the crystals started to grow in size with cooling and then further growth was promoted with the addition of anti-solvent. Although anti-solvent was continuously added, no more growth was shown after about 125th minutes. This is probably due to the depletion of the solute concentration in the suspension as it was already fully utilized for growth.
0
100
200
300
400
500
600
0 20 40 60 80 100 120 140 160
Time (min)
# of
cou
nts
(10
#/s)
/ SW
MC
L ( µ
m)
0
10
20
30
40
Proc
ess
tem
pera
ture
(o C) /
A
ntis
olve
nt a
dditi
on ra
te (g
/min
)
Anti-solvent addition rate
SWMCL
Processtemperature
# of counts
(a)
0
500
1000
1500
2000
2500
3000
3500
0 50 100 150
Time (min)
# of
cou
nts
(#/s
)
0
10
20
30
40
50
Proc
ess
tem
pera
ture
(o C)
Processtemperature
Fine (<22 µm)
Coarse (>250 µm)
(b)
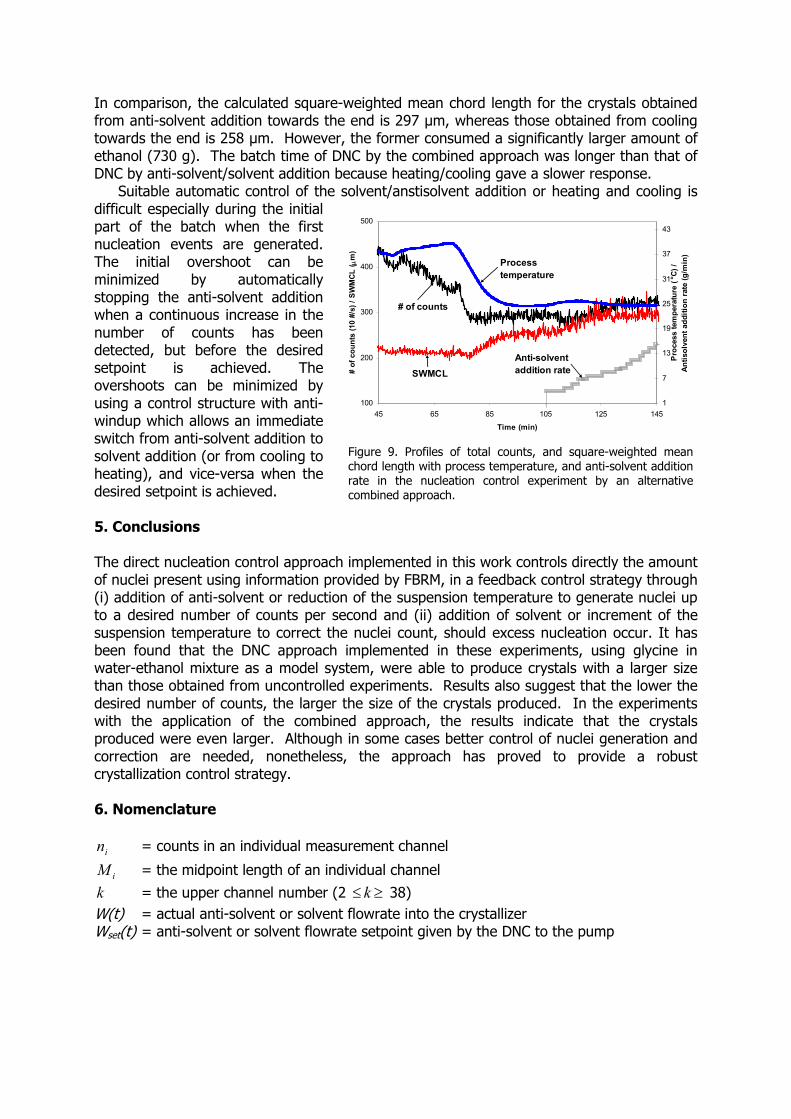
In comparison, the calculated square-weighted mean chord length for the crystals obtained from anti-solvent addition towards the end is 297 µm, whereas those obtained from cooling towards the end is 258 µm. However, the former consumed a significantly larger amount of ethanol (730 g). The batch time of DNC by the combined approach was longer than that of DNC by anti-solvent/solvent addition because heating/cooling gave a slower response.
Suitable automatic control of the solvent/anstisolvent addition or heating and cooling is difficult especially during the initial part of the batch when the first nucleation events are generated. The initial overshoot can be minimized by automatically stopping the anti-solvent addition when a continuous increase in the number of counts has been detected, but before the desired setpoint is achieved. The overshoots can be minimized by using a control structure with anti-windup which allows an immediate switch from anti-solvent addition to solvent addition (or from cooling to heating), and vice-versa when the desired setpoint is achieved. 5. Conclusions The direct nucleation control approach implemented in this work controls directly the amount of nuclei present using information provided by FBRM, in a feedback control strategy through (i) addition of anti-solvent or reduction of the suspension temperature to generate nuclei up to a desired number of counts per second and (ii) addition of solvent or increment of the suspension temperature to correct the nuclei count, should excess nucleation occur. It has been found that the DNC approach implemented in these experiments, using glycine in water-ethanol mixture as a model system, were able to produce crystals with a larger size than those obtained from uncontrolled experiments. Results also suggest that the lower the desired number of counts, the larger the size of the crystals produced. In the experiments with the application of the combined approach, the results indicate that the crystals produced were even larger. Although in some cases better control of nuclei generation and correction are needed, nonetheless, the approach has proved to provide a robust crystallization control strategy. 6. Nomenclature in = counts in an individual measurement channel
iM = the midpoint length of an individual channel
k = the upper channel number (2 ≥≤ k 38) W(t) = actual anti-solvent or solvent flowrate into the crystallizer Wset(t) = anti-solvent or solvent flowrate setpoint given by the DNC to the pump
100
200
300
400
500
45 65 85 105 125 145
Time (min)
# of
cou
nts
(10
#/s)
/ SW
MCL
( µm
)
1
7
13
19
25
31
37
43
Pro
cess
tem
pera
ture
(o C)
/ An
tisol
vent
add
ition
rat
e (g
/min
)
Processtemperature
# of counts
SWMCLAnti-solvent addition rate
Figure 9. Profiles of total counts, and square-weighted mean chord length with process temperature, and anti-solvent additionrate in the nucleation control experiment by an alternative combined approach.

7. References [AUL01] Aulton, M. E., Pharmaceutics: the science of dosage form design. 2nd edition, Churchill Livingstone, 2001 [BAR02] Barrett , P., and Glennon, B. Characterizing the Metastable Zone width and solubility curve using Lasentec FBRM and PVM, Trans IChemE, Part A, 80(2002), 799-805 [BAR06] Barthe, S. and Rousseau, R. W. Utilization of focussed beam reflectance measurement in the control of crystal size distribution in a batch cooled crystallizer. Chem. Eng. Technol., 29(2006)2, 206 – 211 [CHE07a] Chew, J. W., Black, S. N., Chow, P. S., Tan, R. B. H. Comparison between open-loop temperature control and closed-loop supersaturation control for cooling crystallization of glycine, Ind. Eng. Chem. Res., 46(2007), 830-838 [CHE07b] Chew, J. W., Chow, P. S., Tan, R. B. H. Automated in-line technique using FBRM to achieve consistent product quality in cooling crystallization, Cryst. Growth Des. 7(2007)8, 1416-1422 [DOK06] Doki, N., Seki, H., Takano, K., Asatani, H., Yokota, M. and Kubota, N., Process Control of Seeded Batch Cooling Crystallization of the Metastable -Form Glycine Using an In-Situ ATR-FTIR Spectrometer and an In-Situ FBRM Particle Counter, Cryst. Growth Des., 4(2006)5, 949-953. [FUJ05] Fujiwara, M., Nagy, Z. K., Chew, J. W., Braatz, R. D. First principles and direct design approaches for the control of pharmaceutical crystallization, J. Process Control, 15(2005)5, 493-504 [HEA02] Heath, A. R., Fawell, P. D., Bahri, P. A., Swift, J. D. Estimating average particle size by focused beam reflectance measurement (FBRM), Part. Part. Syst. Charact., 19(2002), 84-95 [LIO04] Liotta, V. & Sabesan, V. Monitoring and feedback control of supersaturation using ATR-FTIR to produce an active pharmaceutical ingredient of a desired crystal size, Org. Process Res. Dev., 8(2004)3, 488-494 [MUL01] Mullin, J. W., Crystallization, 4th edition, Butterworth-Heinemann, London, 2001 [YU04] Yu, L. X., Lionbergera, R. A., Rawa, A. S., D'Costa, R., Wub, H., and Hussain, A. S. Applications of process analytical technology to crystallization processes, Adv. Drug Delivery Rev., 56 (2004)3, 349-369 [ZHO06] Zhou, G. X., Fujiwara, M., Woo, X. Y., Rusli, E., Tung, H., Starbuck, C., Davidson, O., Ge, Z., Braatz, R. D. Direct design of pharmaceutical anti-solvent crystallization through concentration control, Cryst. Growth Design, 6(2006)4, 892 -898 Acknowledgements Financial support provided by the Engineering and Physical Sciences Research Council (EPSRC), U.K., (grant EP/E022294/1) is gratefully acknowledged. One of the authors (MRAB) is grateful to the Malaysian Ministry of Higher Education for a scholarship.