dio accommodation customer satisfaction tracker … accommodation customer satisfaction tracker...
TRANSCRIPT

DIO Accommodation customer satisfaction tracker survey Q1 2013/14 M·E·L RESEARCH
Measurement Evaluation Learning: Using evidence to shape better services
DIO Accommodation customer satisfaction tracker survey Q3
2013/14
Final Report
April 2014

DIO ACCOMMODATION CUSTOMER SATISFACTION TRACKER SURVEY Q3 2013/14 M·E·L RESEARCH
Measurement Evaluation Learning: Using evidence to shape better services
Contents Page
1) Project details and acknowledgements ..................................................................... 1
2) Introduction ................................................................................................................... 2
3) Summary ....................................................................................................................... 3
4) Survey Results .............................................................................................................. 5
Overall quality of home ................................................................................................................................ 7
SFA estate as a place to live........................................................................................................................ 8
Upkeep of communal areas ......................................................................................................................... 9
Value for money daily occupancy charges provide ............................................................................. 10
Allocating SFA ............................................................................................................................................. 11
Move In .......................................................................................................................................................... 12
Repairs and maintenance .......................................................................................................................... 13
Move Out ....................................................................................................................................................... 14
Listen to views and act upon them .......................................................................................................... 15
SFA Priorities ................................................................................................... Error! Bookmark not defined.
Appendices .............................................................................................................................. 16
Appendix 1 – Survey ............................................................................................................... 17

DIO ACCOMMODATION CUSTOMER SATISFACTION TRACKER SURVEY Q3 2013/14 M·E·L RESEARCH
Measurement Evaluation Learning: Using evidence to shape better services
1) Project details and acknowledgements
M·E·L Research
8 Holt Court
Aston Science Park
Birmingham B7 4AX
Tel: 0121 604 4664
Fax: 0121 604 6776
Email: [email protected]
Web: www.m-e-l.co.uk
Title DIO Accommodation customer satisfaction tracker survey Q3
2013/14
Client DIO Accommodation
Project number 13076
Client contact Liam Wilson
Author Jack Harper
Contract Manager Jack Harper
DIO ACCOMMODATION CUSTOMER SATISFACTION TRACKER SURVEY Q3 2013/14 M·E·L RESEARCH
Measurement Evaluation Learning: Using evidence to shape better services 2
2) Introduction
DIO Accommodation commissioned M·E·L Research to undertake a monthly customer satisfaction survey
for customers living in service family accommodation (SFA).
Methodology
The monthly customer tracker survey started in June 2013. Data collection took place by telephone during
the first two weeks of each month with a randomly selected sample of customers. Each month a minimum
of 200 interviews were conducted with a total of 2,003 interviews being conducted so far, with 600
interviews being conducted in Q3. Following the exception second quarter report (which covered 4 months),
this report fell into line with normal quarterly reporting periods, and covered the period January 2014 to
March 2014.
A revision to the questionnaire was made for Q3:
To understand reasons for dissatisfaction with the arrangements for allocating SFA an extra question has been added to explore this.
To understand reasons for dissatisfaction with the way the contractor deals with repairs and maintenance issues, two extra questions have been added to explore dissatisfaction and to understand when the last time a repair and maintenance issue was reported
To understand reasons for dissatisfaction that DIO Accommodation listens to views and acts upon them four extra questions have been added to explore:
When the last time contact with DIO accommodation has been made,
When a customer has felt DIO accommodation did not listen to their views and act upon,
The preferred method of communication with DIO accommodation for customers,
The frequency of communication with DIO accommodation for customers,
To understand priorities for customers a priority ranking question has been added.
As a consequence of these additions, the question on dissatisfaction with the overall quality of the home
was removed.
Reporting conventions
We report decimal places rounded to the nearest whole number. If specific response options are then
totalled, this can result in slight rounding differences in the figures reported. Owing to the rounding of
numbers, percentages displayed visually on graphs may not always add up to 100%; this may also apply to
some of the percentages reported for ‘total satisfaction’. For example, 51.4% plus 44.2% equals 95.6%.
Rounded to the nearest whole number this total would be reported as 96%. But in the report this would be
shown as 51% plus 44% equalling 96%, giving the appearance that the reported total is incorrect.

DIO ACCOMMODATION CUSTOMER SATISFACTION TRACKER SURVEY Q3 2013/14 M·E·L RESEARCH
Measurement Evaluation Learning: Using evidence to shape better services 3
3) Summary
This section provides a brief summary of the key findings from DIO Accommodation customer
satisfaction survey. Detailed findings are presented in the subsequent sections of this report.
Overall, 71% of customers are satisfied, and 15% dissatisfied, with the service provided by DIO Accommodation and its contractors. Overall satisfaction with the service provided has increased only slightly in Q3, with 70% of customers expressing satisfaction compared to 68% in Q2.
85% of customers are satisfied, and 9% dissatisfied, with the rules that govern entitlement to SFA. Satisfaction has increased gradually from 83% in Q1 to 87% in Q3.
75% of customers express satisfaction with the overall quality of their home, while 17% express dissatisfaction. There is little variation in the satisfaction with the quality of home from Q2 to Q3.
87% of customers are satisfied, and 8% dissatisfied, with the SFA estate as place to live. There is little variation in satisfaction between Q2 and Q3 results.
75% of customers are satisfied, and 15% dissatisfied, with the upkeep of communal areas. There is no variation in satisfaction between Q2 and Q3 results and little variation in dissatisfaction between Q2 and Q3 results.
87% of customers are satisfied, and 8% dissatisfied, with the value for money that daily occupancy charges provide. Notably, as seen in the Q3 results, this is the highest level of satisfaction and lowest level of dissatisfaction expressed for all of the eleven aspects rated in this survey.
75% of customers are satisfied, and 18% dissatisfied, with the arrangements for allocating SFA. There has been a slight increase in satisfaction for this aspect in Q3 with 77% of customers expressing satisfaction compared to 72% in Q2.
82% of customers are satisfied, and 13% dissatisfied, with the way the ‘Move In’ is dealt with. Satisfaction has increased gradually from 80% in Q1 to 86% in Q3.
61% of customers are satisfied, and 25% dissatisfied, with the way the contractor deals with repairs and maintenance issues. Notably, as seen in Q3, this is the highest level of dissatisfaction expressed for all of the eleven aspects rated in this survey.
85% of customers are satisfied, and 12% dissatisfied, with the way the ‘Move Out’ is dealt with. There is little variation in satisfaction between Q2 and Q3 results.
Only 55% of customers are satisfied, and 21% dissatisfied, that DIO Accommodation listens to views and acts upon them. Notably, this is the lowest level of satisfaction express for all of the eleven aspects rated in this survey. However, dissatisfaction that DIO Accomodation listens to views and acts upon them has declined in Q3 with 17% expressing dissatisfaction compared to 23% in Q2.

DIO ACCOMMODATION CUSTOMER SATISFACTION TRACKER SURVEY Q3 2013/14 M·E·L RESEARCH
Measurement Evaluation Learning: Using evidence to shape better services 4
Question
Satisfaction
Q1 Total
Q2 Total
Jan-14 Feb-14 Mar-14 Q3
Total Overall
Overall service provided 74% 68% 71% 72% 69% 70% 71%
Rules that govern entitlement 83% 84% 85% 93% 84% 87% 85%
Quality of home 78% 73% 72% 77% 75% 74% 75%
SFA estate as a place to live 87% 88% 89% 86% 87% 87% 87%
Upkeep of communal areas 76% 74% 76% 79% 69% 74% 75%
Value for money daily occupancy charges provide
86% 87% 88% 87% 89% 88% 87%
Arrangements for allocating SFA 77% 72% 78% 80% 73% 77% 75%
Move In was dealt with 80% 81% 85% 88% 84% 86% 82%
Repairs and maintenance 62% 61% 53% 69% 59% 60% 61%
Move Out was dealt with 84% 85% 88% 84% 88% 87% 85%
Listens to views and acts upon them
57% 53% 58% 61% 47% 55% 55%
Question
Dissatisfaction
Q1 Total
Q2 Total
Jan-14 Feb-14 Mar-14 Q3
Total Overall
Overall service provided 14% 16% 15% 15% 15% 15% 15%
Rules that govern entitlement 11% 9% 10% 5% 7% 7% 9%
Quality of home 15% 20% 19% 11% 18% 16% 17%
SFA estate as a place to live 8% 7% 8% 9% 7% 8% 8%
Upkeep of communal areas 15% 16% 15% 10% 19% 15% 15%
Value for money daily occupancy charges provide
10% 7% 7% 6% 5% 6% 8%
Arrangements for allocating SFA 18% 19% 15% 15% 20% 16% 18%
Move In was dealt with 14% 14% 10% 9% 11% 10% 13%
Repairs and maintenance 24% 26% 27% 20% 32% 26% 25%
Move Out was dealt with 12% 12% 9% 14% 8% 10% 12%
Listens to views and acts upon them 21% 23% 19% 13% 19% 17% 21%

DIO ACCOMMODATION CUSTOMER SATISFACTION TRACKER SURVEY Q3 2013/14 M·E·L RESEARCH
Measurement Evaluation Learning: Using evidence to shape better services 5
4) Survey Results
This section presents the overall findings for 2013/14
Satisfaction with the service provided by DIO Accommodation and its
contractors
Taking everything into account, overall, 71% of customers living in Service Family Accommodation are;
very (23%), or fairly (48%), satisfied with the service provided by DIO Accommodation and its contractors.
14% of customers state they are neither satisfied nor dissatisfied, while 15% indicate some degree of
dissatisfaction with the overall service provided.
Figure 1 Overall satisfaction with the service provided by DIO Accommodation and its contractors.
Percentage of respondents- base size 2003
23%
48%
14%
9%
6%
Very satisfied
Fairly satisfied
Neither
Fairly dissatisfied
Very dissatisfied
71% Satisfaction
As figure 2 below shows, when looking at the results for overall satisfaction for the last quarter; there has
been some minor variation in satisfaction with the lowest level of satisfaction, at 69%, being expressed
during March 2014, and the highest, at 72%, being expressed during February 2014. The result for Q3
(68%) is marginally higher than Q2 (70%) and slightly lower than Q1 (74%).
Figure 2 Overall satisfaction with the service provided by DIO Accommodation and its contractors
Percentage of respondents- base size 2003
6% 6% 6% 7% 5% 6% 6%
8% 10% 9% 8% 10% 9% 9%
12%16% 15% 14% 17% 15% 14%
46%45% 50%
60%48% 53%
48%
28%23% 21%
12%21% 18%
23%
0%
10%
20%
30%
40%
50%
60%
70%
80%
90%
100%
Q1 Total Q2 Total Jan-14 Feb-14 Mar-14 Q3 Total Yearly Rolling Average
Very dissatisfied Fairly dissatisfied Neither Fairly satisfied Very satisfied

DIO ACCOMMODATION CUSTOMER SATISFACTION TRACKER SURVEY Q3 2013/14 M·E·L RESEARCH
Measurement Evaluation Learning: Using evidence to shape better services 6
Satisfaction with the rules that govern entitlement to SFA
Just over eight out of ten (85%) customers are satisfied with the rules that govern customer entitlement to
SFA, with 32% very satisfied. Just less than one in ten customers are dissatisfied with the rules that govern
customer entitlements to SFA.
Figure 3 Satisfaction with the rules that govern customer entitlement to SFA
Percentage of respondents- base size 2003
32%
53%
6%
6%
3%
Very satisfied
Fairly satisfied
Neither
Fairly dissatisfied
Very dissatisfied
85% Satisfaction
When looking at satisfaction with the rules that govern customer entitlement to SFA for each month, it
shows that there is notable variation in satisfaction, with the highest level of satisfaction in February 2014
being 93%, and the lowest level of satisfaction in March 2014 being 84%. At 87%, satisfaction with the rules
that govern customer entitlement to SFA in Q3 are the highest expressed since the survey started in June
2013, with a gradual increase being shown each quarter (Q1 – 83%, Q2 – 84%).
Figure 4 Satisfaction with the rules that govern customer entitlement to SFA
Percentage of respondents- base size 2003
5% 3% 4% 1% 2% 2% 3%
6% 6% 7%4% 5% 5% 6%
6% 7% 5%
3%
9% 6%6%
45%53% 59% 70% 51% 60% 53%
37%31%
27% 23%
33%27%
32%
0%
10%
20%
30%
40%
50%
60%
70%
80%
90%
100%
Q1 Total Q2 Total Jan-14 Feb-14 Mar-14 Q3 Total Yearly Rolling Average
Very dissatisfied Fairly dissatisfied Neither Fairly satisfied Very satisfied

DIO ACCOMMODATION CUSTOMER SATISFACTION TRACKER SURVEY Q3 2013/14 M·E·L RESEARCH
Measurement Evaluation Learning: Using evidence to shape better services 7
Overall quality of home
All respondents were asked how satisfied they are with the overall quality of home. As shown below three
quarters (75%) of customers are satisfied with the overall quality of their home, with just over one out of
three (31%) expressing that they are very satisfied. 8% are neither satisfied nor dissatisfied. 17% indicate
some degree of dissatisfaction.
Figure 5 Satisfaction with the overall quality of home
Percentage of respondents- base size 2003
31%
44%
8%
10%
7%
Very satisfied
Fairly satisfied
Neither
Fairlydissatisfied
Very dissatisfied
75% Satisfaction
When analysing the results for each month it shows that the highest level of satisfaction (77%) and the
lowest level of dissatisfaction (11%) was in February 2014, while the lowest level of satisfaction expressed
by customers for the overall quality of their home was in January 2014 (72%). Dissatisfaction levels were
also highest in January at 19%.
Figure 6 Satisfaction with the overall quality of home
Percentage of respondents- base size 2003
6% 7% 8% 5% 7% 7% 7%
10%12% 12%
6%11% 9% 10%
7%8% 10%
13%8% 10% 8%
43%43% 42% 53%
43% 46% 44%
35%30% 30%
25%32% 29% 31%
0%
10%
20%
30%
40%
50%
60%
70%
80%
90%
100%
Q1 Total Q2 Total Jan-14 Feb-14 Mar-14 Q3 Total Yearly Rolling Average
Very dissatisfied Fairly dissatisfied Neither Fairly satisfied Very satisfied

DIO ACCOMMODATION CUSTOMER SATISFACTION TRACKER SURVEY Q3 2013/14 M·E·L RESEARCH
Measurement Evaluation Learning: Using evidence to shape better services 8
SFA estate as a place to live
87% of customers are satisfied with the SFA estate as a place to live, with just under four in ten (39%) of
customers expressing they are very satisfied. Only 8% of customers express dissatisfaction with the SFA
estate as a place to live.
Figure 7 Satisfaction with SFA estate as a place to live
Percentage of respondents- base size 2003
39%
48%
5%
4%
4%
Very satisfied
Fairly satisfied
Neither
Fairly dissatisfied
Very dissatisfied
87% Satisfaction
When analysing the results by month and by quarter it shows that satisfaction with the SFA estate as a
place to live has shown little fluctuation, with the lowest level of satisfaction in February 2014, at 86%, and
the highest in January 2014, at 89%.
Figure 8 Satisfaction with SFA estate as a place to live
Percentage of respondents- base size 2003
4% 3% 4% 5% 5% 4% 4%4% 4% 4% 4% 3% 4% 4%4% 6% 4% 6% 7% 5% 5%
39%50% 57%
60%
48%55%
48%
49%38%
33%26%
39%33%
39%
0%
10%
20%
30%
40%
50%
60%
70%
80%
90%
100%
Q1 Total Q2 Total Jan-14 Feb-14 Mar-14 Q3 Totally Yearly Rolling Average
Very dissatisfied Fairly dissatisfied Neither Fairly satisfied Very satisfied

DIO ACCOMMODATION CUSTOMER SATISFACTION TRACKER SURVEY Q3 2013/14 M·E·L RESEARCH
Measurement Evaluation Learning: Using evidence to shape better services 9
Upkeep of communal areas
All respondents were asked how satisfied they are with the upkeep of communal areas, including grounds
maintenance. As shown below, three out of four (75%) customers are satisfied with the upkeep of
communal areas, with 31% expressing they are very satisfied. 15% of customers indicate some degree of
dissatisfaction, while 10% state they are neither satisfied nor dissatisfied.
Figure 9 Satisfaction with the upkeep of communal areas, including grounds maintenance
Percentage of respondents- base size 2003
31%
44%
10%
9%
6%
Very satisfied
Fairly satisfied
Neither
Fairly dissatisfied
Very dissatisfied
75% Satisfaction
When analysing the same results by each month’s data collection it shows that satisfaction expressed by
customers with the upkeep of communal areas varies greatly from 79% in February 2014 to 69% in March
2014. Dissatisfaction levels also increased by a similar level from 10% in February 2014 to 19% in March
2014.
Figure 10 Satisfaction with the upkeep of communal areas, including grounds maintenance
Percentage of respondents- base size 2003
7% 6% 8% 5%9% 7% 6%
9% 10% 7%6%
11%8% 9%
8% 10% 10%12%
12%
11% 10%
39%44%
53%52%
44%50%
44%
37%30%
23% 27% 25% 25%31%
0%
10%
20%
30%
40%
50%
60%
70%
80%
90%
100%
Q1 Total Q2 Total Jan-14 Feb-14 Mar-14 Q3 Total Yearly Rolling Average
Very dissatisfied Fairly dissatisfied Neither Fairly satisfied Very satisfied

DIO ACCOMMODATION CUSTOMER SATISFACTION TRACKER SURVEY Q3 2013/14 M·E·L RESEARCH
Measurement Evaluation Learning: Using evidence to shape better services 10
Value for money daily occupancy charges provide
A high proportion (87%) of customers are satisfied that their daily occupancy charge provides value for
money, with 42% expressing that they are very satisfied. Less than one out of ten (8%) customers express
they are dissatisfied that their daily occupancy charge provides value for money.
Figure 11 Satisfaction with that daily occupancy charges provide value for money
Percentage of respondents- base size 1954 – non applicable removed
42%
45%
5%
4%
4%
Very satisfied
Fairly satisfied
Neither
Fairly dissatisfied
Very dissatisfied
87% Satisfaction
There has been very little variation in satisfaction when analysing the same result by each month’s data
collection; 88% of customers express satisfaction in January 2014, while 89% expressed satisfaction in
March 2014.
Figure 12 Satisfaction with that daily occupancy charges provide value for money
Percentage of respondents- base size 1954 – non applicable removed
5% 3% 3% 4% 2% 3% 4%5%
4% 4% 3% 4% 3% 4%
4% 6% 6% 6% 6% 6% 5%
40%46% 47%
58%
47%51% 45%
46%41% 40%
30%
42%37%
42%
0%
10%
20%
30%
40%
50%
60%
70%
80%
90%
100%
Q1 Total Q2 Total Jan-14 Feb-14 Mar-14 Q3 Total Yearly Rolling AverageVery dissatisfied Fairly dissatisfied Neither Fairly satisfied Very satisfied

DIO ACCOMMODATION CUSTOMER SATISFACTION TRACKER SURVEY Q3 2013/14 M·E·L RESEARCH
Measurement Evaluation Learning: Using evidence to shape better services 11
Allocating SFA
All respondents were asked how satisfied they are with the arrangements for allocating SFA. As shown
below, 75% of customers are satisfied with the arrangements for allocating SFA, with nearly one in three
(29%) very satisfied. 18% of customers express some degree of dissatisfaction with the arrangements for
allocating SFA.
Figure 13 Satisfaction with the arrangements for allocating SFA
Percentage of respondents- base size 2003
29%
46%
7%
9%
9%
Very satisfied
Fairly satisfied
Neither
Fairly dissatisfied
Very dissatisfied
75% Satisfaction
When analysing the results by each month’s data collection it shows that satisfaction levels were highest
(80%) and dissatisfaction levels were lowest (15%) in February. While in March, satisfaction levels were
lowest (73%) and dissatisfaction levels were highest (20%).
Figure 14 Satisfaction with the arrangements for allocating SFA
Percentage of respondents- base size 2003
9% 9% 8% 5%9% 7% 9%
8% 10%7% 10%
11%9% 9%
5%9%
8% 6%
8%7%
7%
44%
46%
42%
57% 46%48% 46%
33%26%
36%
23%27% 29% 29%
0%
10%
20%
30%
40%
50%
60%
70%
80%
90%
100%
Q1 Total Q2 Total Jan-14 Feb-14 Mar-14 Q3 Total Yearly Rolling Average
Very dissatisfied Fairly dissatisfied Neither Fairly satisfied Very satisfied

DIO ACCOMMODATION CUSTOMER SATISFACTION TRACKER SURVEY Q3 2013/14 M·E·L RESEARCH
Measurement Evaluation Learning: Using evidence to shape better services 12
Move In
All respondents were asked how satisfied they are with the way their Move In was dealt with. As shown
below, over eight out of ten (82%) customers express satisfaction with the way their Move In was dealt with,
with 43% indicating that they are very satisfied. Only 13% express some degree of dissatisfaction.
Figure 15 Satisfaction with the way the Move In was dealt with
Percentage of respondents- base size 2003
43%
39%
5%
7%
6%
Very satisfied
Fairly satisfied
Neither
Fairly dissatisfied
Very dissatisfied
82% Satisfaction
As shown below, when comparing satisfaction levels with the way the Move In was dealt with by each
month’s data collection in Q3 there has been little variation in satisfaction and dissatisfaction.
Figure 16 Satisfaction with the way the Move In was dealt with
Percentage of respondents- base size 2003
7% 7% 6% 3% 4% 4% 6%
7% 7%4% 6% 7% 6%
7%
6% 5%6% 3%
6% 5%5%
33%40%
44% 53%38% 45% 39%
47%41% 41%
36%
46%41% 43%
0%
10%
20%
30%
40%
50%
60%
70%
80%
90%
100%
Q1 Total Q2 Total Jan-14 Feb-14 Mar-14 Q3 Total Yearly Rolling Average
Very dissatisfied Fairly dissatisfied Neither Fairly satisfied Very satisfied

DIO ACCOMMODATION CUSTOMER SATISFACTION TRACKER SURVEY Q3 2013/14 M·E·L RESEARCH
Measurement Evaluation Learning: Using evidence to shape better services 13
Repairs and maintenance
Only 61% of customers express satisfaction with the way the contractor deals with repairs and maintenance
issues, with just over a quarter (25%) of customers expressing they are very satisfied. One out of four
customers indicate that they are; fairly (13%) or very (13%), dissatisfied with the way the contractor deals
with repairs and maintenance issues. It is worth noting that this is the highest level of dissatisfaction
expressed for all of the eleven aspects rated in this survey.
Figure 17 Satisfaction with the way the contractor deals with repairs and maintenance issues
Percentage of respondents- base size 2003
25%
36%
14%
13%
13%
Very satisfied
Fairly satisfied
Neither
Fairly dissatisfied
Very dissatisfied
61% Satisfaction
Satisfaction has varied significantly for each month of Q3’s data collection; the highest level of satisfaction
was in February 2014 (69%) with the lowest levels of satisfaction being in January 2014 (53%). The highest
levels of dissatisfaction occurred in March (32%) and the lowest levels of dissatisfaction was in February
(20%).
Figure 18 Satisfaction with the way the contractor deals with repairs and maintenance issues
Percentage of respondents- base size 2003
12% 12% 11% 9%
20%13% 13%
11% 14% 16%11%
12%
13% 13%
15% 14%21%
12%
9%14% 14%
33%36%
33%
48% 33% 38% 36%
29%24% 21% 21%
27% 23% 25%
0%
10%
20%
30%
40%
50%
60%
70%
80%
90%
100%
Q1 Total Q2 Total Jan-14 Feb-14 Mar-14 Q3 Total Yearly Rolling Average
Very dissatisfied Fairly dissatisfied Neither Fairly satisfied Very satisfied
DIO ACCOMMODATION CUSTOMER SATISFACTION TRACKER SURVEY Q3 2013/14 M·E·L RESEARCH
Measurement Evaluation Learning: Using evidence to shape better services 14
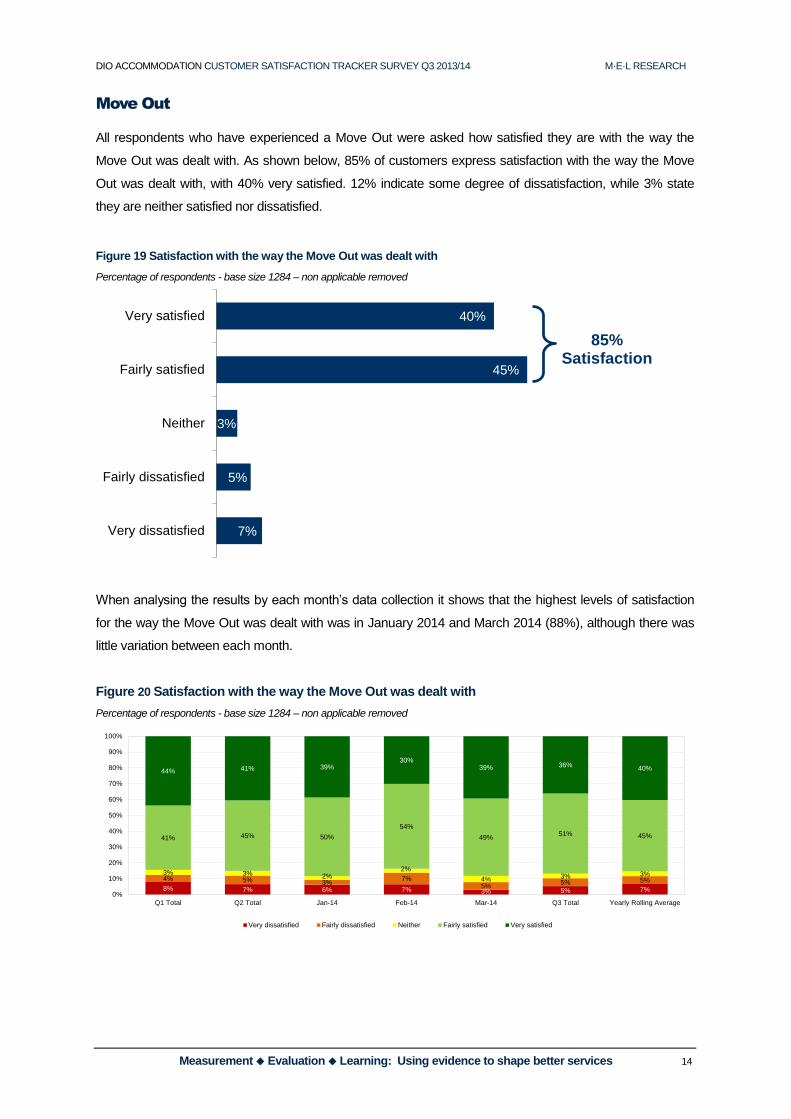
Move Out
All respondents who have experienced a Move Out were asked how satisfied they are with the way the
Move Out was dealt with. As shown below, 85% of customers express satisfaction with the way the Move
Out was dealt with, with 40% very satisfied. 12% indicate some degree of dissatisfaction, while 3% state
they are neither satisfied nor dissatisfied.
Figure 19 Satisfaction with the way the Move Out was dealt with
Percentage of respondents - base size 1284 – non applicable removed
40%
45%
3%
5%
7%
Very satisfied
Fairly satisfied
Neither
Fairly dissatisfied
Very dissatisfied
85% Satisfaction
When analysing the results by each month’s data collection it shows that the highest levels of satisfaction
for the way the Move Out was dealt with was in January 2014 and March 2014 (88%), although there was
little variation between each month.
Figure 20 Satisfaction with the way the Move Out was dealt with
Percentage of respondents - base size 1284 – non applicable removed
8% 7% 6% 7% 3% 5% 7%
4% 5% 3%7%
5%5% 5%
3% 3% 2%2%
4% 3% 3%
41% 45% 50%
54%
49%51% 45%
44% 41% 39%30%
39% 36%40%
0%
10%
20%
30%
40%
50%
60%
70%
80%
90%
100%
Q1 Total Q2 Total Jan-14 Feb-14 Mar-14 Q3 Total Yearly Rolling Average
Very dissatisfied Fairly dissatisfied Neither Fairly satisfied Very satisfied

DIO ACCOMMODATION CUSTOMER SATISFACTION TRACKER SURVEY Q3 2013/14 M·E·L RESEARCH
Measurement Evaluation Learning: Using evidence to shape better services 15
Listen to views and act upon them
All respondents were asked how satisfied they are that DIO Accommodation listens to views and acts upon
them. As the results below show, only 55% of customers express they are satisfied that DIO
Accommodation listen to views and act upon them, with fewer than two out of ten expressing they are very
satisfied (18%). This is the lowest level of satisfaction expressed by customers for all eleven aspects rated
in this survey. 21% of customers indicate they are; fairly (11%), or very (10%), dissatisfied that DIO
Accommodation listen to views and act upon them. It is worth noting that a high proportion of customers
(25%) express they are neither satisfied nor dissatisfied.
Figure 21 Satisfaction that DIO Accommodation listens to views and acts upon them
Percentage of respondents- base size 2003
18%
37%
25%
11%
10%
Very satisfied
Fairly satisfied
Neither
Fairly dissatisfied
Very dissatisfied
55% Satisfaction
There is a relatively high degree of variation for each month’s data collection in Q3, with 61% of customers
satisfied that DIO Accommodation listen to views and act upon them in February 2014, and only 47% of
customers satisfied in March 2014.
Figure 22 Satisfaction that DIO Accommodation listens to views and acts upon them
Percentage of respondents- base size 2003
10% 11% 9% 5% 8% 7% 10%
11% 12%10%
8%11% 10%
11%
21%24%
24%27%
35%28% 25%
37%36%
37% 46%
34%
39% 37%
20% 17% 21%15% 13% 16% 18%
0%
10%
20%
30%
40%
50%
60%
70%
80%
90%
100%
Q1 Total Q2 Total Jan-14 Feb-14 Mar-14 Q3 Total Yearly Rolling Average
Very dissatisfied Fairly dissatisfied Neither Fairly satisfied Very satisfied

DIO ACCOMMODATION CUSTOMER SATISFACTION TRACKER SURVEY Q3 2013/14 M·E·L RESEARCH
Measurement Evaluation Learning: Using evidence to shape better services 16
Appendices

DIO ACCOMMODATION CUSTOMER SATISFACTION TRACKER SURVEY Q3 2013/14 M·E·L RESEARCH
Measurement Evaluation Learning: Using evidence to shape better services 17
Appendix 1 – Survey

DIO ACCOMMODATION CUSTOMER SATISFACTION TRACKER SURVEY Q3 2013/14 M·E·L RESEARCH
Measurement Evaluation Learning: Using evidence to shape better services 18

DIO ACCOMMODATION CUSTOMER SATISFACTION TRACKER SURVEY Q3 2013/14 M·E·L RESEARCH
Measurement Evaluation Learning: Using evidence to shape better services 19

DIO ACCOMMODATION CUSTOMER SATISFACTION TRACKER SURVEY Q3 2013/14 M·E·L RESEARCH
Measurement Evaluation Learning: Using evidence to shape better services 20

DIO ACCOMMODATION CUSTOMER SATISFACTION TRACKER SURVEY Q3 2013/14 M·E·L RESEARCH
Measurement Evaluation Learning: Using evidence to shape better services 21

DIO ACCOMMODATION CUSTOMER SATISFACTION TRACKER SURVEY Q3 2013/14 M·E·L RESEARCH
Measurement Evaluation Learning: Using evidence to shape better services 22

DIO Accommodation customer satisfaction tracker survey Q1 2013/14 M·E·L RESEARCH
Measurement Evaluation Learning: Using evidence to shape better services 1