dinosaurs and dragons - noycefdn.org · looking at the graph for dinosaurs and the graph for...
TRANSCRIPT

Copyright © 2007 by Mathematics Assessment Page 57 Dinosaurs and Dragons Test 4 Resource Service. All rights reserved.
Number of words
The diplodocus, tyrannosaurus, stegosaurus and allosaurus were dinosaurs, mighty creatures that inhabited planet earth during the Jurassic and Cretaceous periods.
Dinosaurs and Dragons This problem gives you the chance to: • draw graphs and interpret data
Adam likes learning about dinosaurs. Jade loves reading about dragons. Adam read this today.
Adam likes long words, so he made this line plot to show the length of each word in the box above. Adam also recorded the length of the words as a bar graph. 1 2 3 4 5 6 7 8 9 10 11 12 13 Number of letters in a word
1. Adam has made one mistake on his bar graph. Write an X on the mistake he has made.
Number of words
1 2 3 4 5 6 7 8 9 10 11 12 13 Number of letters in a word
4
3
2 1 0

Copyright © 2007 by Mathematics Assessment Page 58 Dinosaurs and Dragons Test 4 Resource Service. All rights reserved.
In the hills lived a green, sad dragon. Nobody visited his lair, as they were afraid of his red eyes.
2. Jade reads this in her dragon book.
Here is a table to show the number of words of different lengths in Jade’s book. Number of letters in a word 1 2 3 4 5 6 7 Number of words 1 3 5 4 3 3 1
Make a bar graph using this data. Remember to label the axes.
3. Look at the data shown in the two bar graphs.
a. Write one thing about the data that is the same in both bar graphs.
___________________________________________________________________ ___________________________________________________________________ b. Write two things about the data that is different in the two bar graphs. ___________________________________________________________________ ___________________________________________________________________ ___________________________________________________________________
8

Copyright © 2007 by Mathematics Assessment Page 59 Dinosaurs and Dragons Test 4 Resource Service. All rights reserved.
Task 4: Dinosaurs and Dragons Rubric The core elements of performance required by this task are: • draw graphs and interpret data Based on these, credit for specific aspects of performance should be assigned as follows
points section points
1. Marks the column with 9 letters that records 4 instead of 3 words 1 1
2. Labels both axes correctly Produces a correct bar graph
Partial credit A graph with one error
A graph with two errors.
1 3
(2)
(1)
4
3. Statements such as: a) Both of the graphs should show the lengths of 20 words
Both of the graphs have one word with 7 letters Both of the graphs have three words with 6 letters
b) Adam’s graph shows no words with 1 or 2 letters but Jade’s graph has 4 of these.
Adam’s graph has 9 words with 8 or more letters but Jade’s has none.
1
1 1
3
Total Points 8

Copyright © 2007 by Noyce Foundation 60 Resource Service. All rights reserved.
Dinosaurs and Dragons Work the task. What types of questions are being asked? What are the big ideas around data that are being assessed? How are the cognitive demands of making a graph different from reading information off a graph? What are the additional things a student has to consider when making a graph? Look at student work on the second graph. How many of your students:
Made a correct graph
Put no labels on the axes
Reversed axes No numbers on vertical axes
No numbers on either axes
Put scale in the middle on the vertical axes
Made all bars the same size
Other
What opportunities do students in your class have to make their own graphs? Look at some of the papers with the axes reversed. How did this make the information difficult to graph? Why should the vertical scale be aligned with the grid marks? What is the mathematics that students need to understand in order to see the distinction between numbering the space and numbering the grid lines? Why is it o.k. to have the scale on the horizontal axis between grid marks? What would it mean if the numbers on the horizontal axis fell directly on the grid marks? How might you pose a question to the class to help them understand these distinctions? What is the difference between noting facts about each graph and comparing significant features of the data? What are some of the mathematical features of the graph you might expect students to notice? How many of your students made comments about:
• Range? • Frequency? Mode? • Most/ Least/ Same? • Shape of data?
What is important in making a comparison statement? What types of activities or discussions help students develop their ability to make significant comparisons? How do you do this for language arts? How can these techniques be applied to mathematics? What are some examples of comparisons that you valued? What features did you like about these particular comparisons? Why were they useful in understanding the data? Now look at some other descriptions, what would need to be changed to make them better or more significant?

Copyright © 2007 by Noyce Foundation 61 Resource Service. All rights reserved.
Looking at Student Work on Dinosaurs and Dragons Student A has full marks on the task. The student has discussed range and frequency in comparing the differences. How might part 3a be improved? What makes “7” significant? Student A

Copyright © 2007 by Noyce Foundation 62 Resource Service. All rights reserved.
Student B also has full marks. What is significant about the final sentence in 3b? What generalization might you want students to make about the data? Student B

Copyright © 2007 by Noyce Foundation 63 Resource Service. All rights reserved.
Student C has described something that is the same for both graphs. However, it is not clear why or if this is significant to understanding the data. What do you think? Like Student C, many students had difficulty understanding comparisons. In 4b the student gives two facts rather than two comparisons about the differences. How do you help students develop the language and logic of comparisons? Student D describes something that is the same about both graphs, but it is not about the data. Students need help teasing out what makes some information more important than others. In part 4b the student makes a good observation, but like C, does not understand that the two statements make only one comparison. Student C

Copyright © 2007 by Noyce Foundation 64 Resource Service. All rights reserved.
Student D

Copyright © 2007 by Noyce Foundation 65 Resource Service. All rights reserved.
The logic of making a graph is different from the skills needed to read information from a graph. The student needs to think about scale and units. Student E has made a graph with no numbers. In part 3a the student has made a comparison that is about the scale rather than the data. Another important question for the student might be, “One what?” (one letter? one word? one word with one letter?) Student E

Copyright © 2007 by Noyce Foundation 66 Resource Service. All rights reserved.
Student F is able to make a graph and choose a scale other than one. The student is also able to graph the data accurately with this scale. Do you think having a different scale on each graph makes it more difficult to compare the data? The student makes interesting observations about the graphs and topics, but does not mention the significant features of the data. What activities do students in your class have to talk about important data features like range, mode, shape, and frequency? Student F
Copyright © 2007 by Noyce Foundation 67 Resource Service. All rights reserved.
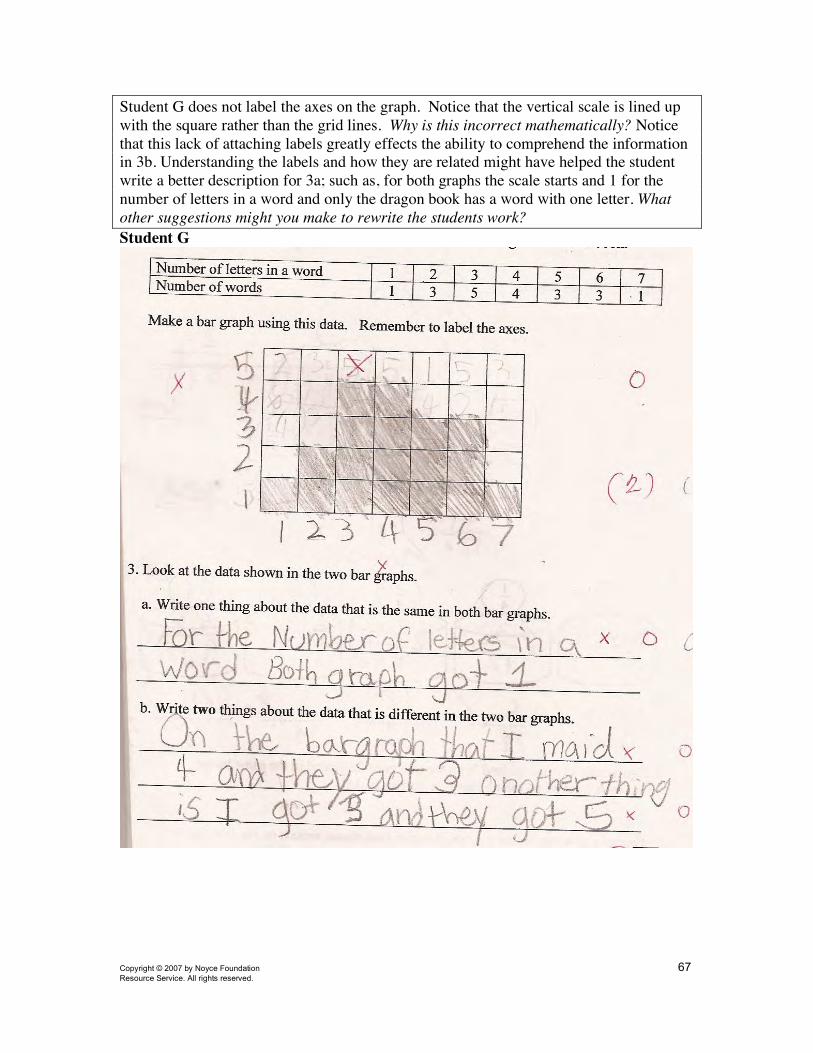
Student G does not label the axes on the graph. Notice that the vertical scale is lined up with the square rather than the grid lines. Why is this incorrect mathematically? Notice that this lack of attaching labels greatly effects the ability to comprehend the information in 3b. Understanding the labels and how they are related might have helped the student write a better description for 3a; such as, for both graphs the scale starts and 1 for the number of letters in a word and only the dragon book has a word with one letter. What other suggestions might you make to rewrite the students work? Student G

Copyright © 2007 by Noyce Foundation 68 Resource Service. All rights reserved.
Student H is able to label part of the graph, but omits the vertical scale. The comparisons are too vague or about insignificant features. Student H

Copyright © 2007 by Noyce Foundation 69 Resource Service. All rights reserved.
Student I, like many students, compares the table and the graph for dragons rather than looking at the graph for dinosaurs and the graph for dragons. The student is also looking at the width of these two objects as a measure for comparison rather than discussing data. Does the student understand that the table or graph could be blown up or shrunk with a copier, but the data would stay the same? What question might you pose for the student? Student I

Copyright © 2007 by Noyce Foundation 70 Resource Service. All rights reserved.
Student J makes describes something about the data that is the same. Is this a significant feature? Why or why not? Look at the second comparison in 3b. Is this significant? Why or why not? Student J

Copyright © 2007 by Noyce Foundation 71 Resource Service. All rights reserved.
Look at the work of Student K on the bar graph. Can you figure out what the student was graphing? Student K

Copyright © 2007 by Noyce Foundation 72 Resource Service. All rights reserved.
Understanding the complications of trying to make a graph is shown in the work of Student L. If I look at the graph, it seems the student may have graphed 3 words two letters for the second bar; 3 letters five words for the third bar. The lack of attention to labels makes it more difficult for the student to think about what is represented horizontally and vertically. The student is not consistently tracking the information. Without labels it is hard to decipher the comments in part 3. Student L

Copyright © 2007 by Noyce Foundation 73 Resource Service. All rights reserved.
Again the logic and thinking needed to make a graph is significantly different from reading a graph. Look at the work of Student M. Can you understand how the student drew the bars? Student M

Copyright © 2007 by Noyce Foundation 74 Resource Service. All rights reserved.
4th Grade Task 4 Dinosaurs and Dragons Student Task Draw graphs and interpret data. Compare data on graphs. Core Idea 5 Data Analysis
Collect, organize, represent and interpret numerical and categorical data, and clearly communicate their findings.
• Represent data using tables, charts, line plots, and bar graphs. • Interpret data to answer questions about a situation. • Describe the shape and important features of a set of data.
Based on teacher observations, this is what fourth graders knew and were able to do:
• Find discrepancy between a line plot and a bar graph • Plotting bar graphs
Areas of difficulty for third graders:
• Labeling the axes on a graph • Putting the scale on a graph • Making comparison statements about significant features of the data such as
frequency, range, mode, and shape • Using data to make generalizations

Copyright © 2007 by Noyce Foundation 75 Resource Service. All rights reserved.
The maximum score available for this task is 8 points. The minimum score for a level 3 response, meeting standards, is 4 points. Most students, 93%, could identify the discrepancy between the information in the line plot and the bar graph. Many students, 69%, could identify the error, and make bars on a graph that matched the data (although the graphs may have lacked labels and scale). Almost half the students, 46%, could identify the error and make a correct graph including labeling the axes and making a vertical scale. 5% of the students could meet all the demands of the task including making comparisons for similarities and differences between the graphs. 7% of the students received no points on this task. 80% of the students with this score attempted the task.

Copyright © 2007 by Noyce Foundation 76 Resource Service. All rights reserved.
Dinosaurs and Dragons Points Understandings Misunderstandings
0 80% of the students with this score attempted the task.
6% of the students did not do part 1 of the task, identify the error on the graph. About 2% marked two errors on the graph. Another 2% thought the error was on 13.
1 Students could identify the discrepancy between the line plot and the bar graph.
Students had difficult filling in the bars on the second graph. Almost 9% of the students made an error in the size of all their bars. 2% made a line graph.
4 Students could find the error and make appropriately sized bars.
They had difficulty labeling the axes. Almost 17% put the vertical scale numbers between grid lines instead of on the grid lines. 14% put no numbers on either axes. An additional 14% did not put numbers on the vertical axis. 5% reversed the axes, putting the number of letters on the vertical axis.
5 Students could find the error and make a graph from a table complete with labeled axes.
Students had difficulty making comparisons. 7% mentioned that the labels were the same. 8% said they had the same numbers. 6% said they had the same information. 3% said they had the same data. Almost 10% only mentioned one difference. 8% did not attempt to write about differences. 4% mentioned that one graph had a mistake.
8 Students could find an error in a bar graph, make their own bar graph with labels and scale from a table, and make comparisons about data from two graphs.

Copyright © 2007 by Noyce Foundation 77 Resource Service. All rights reserved.
Implications for Instruction Students need practice making their own graphs. The reasoning for labeling axes, putting numbers on the scale, and thinking about appropriate scale are very different from just answering questions about a bar graph. Graphing is done to help answer questions and find relationships in the data. Students should be given opportunities to make comparisons and identify significant differences between graphs. Ideas for Action Research –Re-engagement One useful strategy when student work does meet your expectations is to use student work to promote deeper thinking about the mathematical issues in the task. In planning for re-engagement it is important to think about what is the story of the task, what are the common errors and what are the mathematical ideas I want students to think about more deeply. Then look through student work to pick key pieces of student work to use to pose questions for class discussion. Often students will need to have time to rework part of the task or engage in a pair/share discussion before they are ready to discuss the issue with the whole class. This reworking of the mathematics with a new eye or new perspective is the key to this strategy. In this task there were two key issues. One was the idea of comparing data. What is significant about for making a comparison? What is the language of comparison and how is it different from writing facts? The second idea is how to make a graph and interpret scale. For the issue of comparison, you might start the lesson with a mind set activity like picking 3 or 4 people and asking the class how they are the same. You might pick something like all wearing jeans or all wearing white shirts. Have the class guess the rule. Now pick a different group of 4 people, who all have quite different appearances and attire – but share something unimportant like all having an “a” as the second letter in their name or somewhere in their name. Have the class discuss why some information is more useful or interesting for comparison that others. Now pose some questions for class discussion. For example: I overheard one group working on this task. Sally says, “Both graphs have one space on the filled in on the sevens.” Fred says, “ Both graphs there are three letter words.” Nancy adds, “These are interesting facts, but why are they important? What is the graph really trying to tell us?” Think about Nancy’s questions. How might you change these statements so the importance is clearer? Is there other information that might be even more important to know? If you were going to summarize the information in the two graphs what would you say?

Copyright © 2007 by Noyce Foundation 78 Resource Service. All rights reserved.
Give the students time to work on these questions. Do they realize that the graph is trying to say one book has more large words than the other? If not, pose some new questions about differences to see if this makes the case clearer. In a different group, I heard students discussing the differences: Cody says, “The dinosaur graph has no 2 letter words, but the dragon graph has 3 two letter words.” Joe says, “In the dinosaur bar graph there are 4 3-lettered words and in the dragon bar graph there are 5 e-lettered words.” Lisa asks, “Why is that information important? Shouldn’t we be thinking about things like the highest bars and lowest bars or something like that?” What do you think? How might you improve these statements? Now think about the issues around making a graph. Choose some of the examples from the toolkit to use as a starting place for asking a question of the class to dig into the mathematics of making a graph. For example: Make a graph of the following work from Student G without the scoring marks. Ask the students to find where Student G made his mistake. What advice would they give him about improving the graph?
Hopefully students will bring up issues like the importance of labels. The students should notice that bars 3 and 4 on the same height. Push their thinking to see if they can talk about how putting some numbers between and the 5 on the grid line may have been confusing.