diion paper erieftp.iza.org/dp12779.pdf · benefits such as studies on tennessee after it...
TRANSCRIPT
DISCUSSION PAPER SERIES
IZA DP No. 12779
Timothy J. HallidayRandall Q. AkeeTetine SentellMegan InadaJill Miyamura
The Impact of Medicaid on Medical Utilization in a Vulnerable Population: Evidence from COFA Migrants
NOVEMBER 2019

Any opinions expressed in this paper are those of the author(s) and not those of IZA. Research published in this series may include views on policy, but IZA takes no institutional policy positions. The IZA research network is committed to the IZA Guiding Principles of Research Integrity.The IZA Institute of Labor Economics is an independent economic research institute that conducts research in labor economics and offers evidence-based policy advice on labor market issues. Supported by the Deutsche Post Foundation, IZA runs the world’s largest network of economists, whose research aims to provide answers to the global labor market challenges of our time. Our key objective is to build bridges between academic research, policymakers and society.IZA Discussion Papers often represent preliminary work and are circulated to encourage discussion. Citation of such a paper should account for its provisional character. A revised version may be available directly from the author.
Schaumburg-Lippe-Straße 5–953113 Bonn, Germany
Phone: +49-228-3894-0Email: [email protected] www.iza.org
IZA – Institute of Labor Economics
DISCUSSION PAPER SERIES
ISSN: 2365-9793
IZA DP No. 12779
The Impact of Medicaid on Medical Utilization in a Vulnerable Population: Evidence from COFA Migrants
NOVEMBER 2019
Timothy J. HallidayUniversity of Hawaii at Manoa, UHERO and IZA
Randall Q. AkeeBrookings Institution, UCLA, IZA and NBER
Tetine SentellUniversity of Hawaii at Manoa
Megan InadaKokua Kalihi Valley Comprehensive Family Services
Jill MiyamuraHawaii Health Information Corporation
ABSTRACT
IZA DP No. 12779 NOVEMBER 2019
The Impact of Medicaid on Medical Utilization in a Vulnerable Population: Evidence from COFA Migrants*
In March 2015, the State of Hawaii stopped covering the majority of migrants from
countries belonging to the Compact of Free Association (COFA) in its Medicaid program.
COFA migrants were required to obtain private insurance in the exchanges established
under the Affordable Care Act. Using statewide hospital discharge data, we show that
Medicaid-funded hospitalizations and emergency room visits declined in this population
by 31% and 19%. Utilization funded by private insurance did increase, but not enough
to offset the declines in Medicaid-funded utilization. Finally, the expiration of benefits
increased uninsured ER visits.
JEL Classification: I10, I14, J61
Keywords: immigration, health insurance, cost sharing, Medicaid, insurance exchange
Corresponding author:Timothy J. HallidayUniversity of Hawaii at Manoa2424 Maile WaySaunders Hall Room 533Honolulu, HI 96822USA
E-mail: [email protected]
* We thank the University of Hawaii Economic Research Organization for providing funding to purchase data from
the Hawaii Health Information Corporation. We would also like to thank Marcella Alsan, Marianne Bitler, Carl Bonham,
Patrick Button, David Card, Anita Hofschneider, Lester Lusher, Gregory Maskarinec, Craig McIntosh, Teresa Molina,
Judy Mohr Peterson, Ranjani Starr, and Seiji Yamada for useful comments and discussions. We also acknowledge
seminar participants at the University of Hawaii Applied Micro Workshop,the NBER Workshop on the Economics of
Indigenous Peoples and Institutions, the Trans-Pacific Labor Seminar, and Kokua Kalihi Valley Comprehensive Family
Services. Victoria Fan contributed to an earlier draft of this paper. All errors are our own.

2
I. Introduction
A principal question in health economics is how insurance coverage affects the demand for
health services. Those that lack financial resources are often those most in need of medical
services, and, in the absence of adequate insurance, low-income populations may forgo
necessary medical care. These concerns have been a driving force for the expansion of
government-provided or government-subsidized health insurance in many countries around the
world, including the United States. The Affordable Care Act (ACA) of 2010 established
subsidies for low-income households to purchase private insurance in marketplaces and
incentives for states to expand coverage in their Medicaid programs. As a consequence of the
ACA, the percentage of uninsured people in the United States decreased by 41%, a reduction
from 48 to 28 million between 2011 and 2015 (Cohen et al, 2017). Importantly, the ACA had the
largest impacts on the poor and on minorities (Cohen et al, 2017).
At a time when the United States was expanding health insurance coverage for its poorest
citizens, the State of Hawaii reduced health care coverage for a small, but vulnerable, portion of
its population. Until March of 2015, the State of Hawaii enrolled eligible migrants of countries
belonging to the Compact of Free Association (COFA) in a state-funded Medicaid plan. COFA
migrants are from the Republic of Palau, the Republic of the Marshall Islands, and the Federated
States of Micronesia (FSM), three nation-states located in the Pacific Ocean.1 At the time, the
State of Hawaii was estimated to have roughly 28,000 COFA migrants (commonly referred to as
“Micronesians”). Most COFA migrants are not US citizens, but under the terms of the federal
Compacts, are guaranteed certain prerogatives, such as free entry to the US and the right to work.
While the Compacts allow for these rights, their allowance for access to health care, particularly
Medicaid, has been a highly contested issue.
In general, Medicaid is jointly financed by federal and state governments. Federal welfare
reform in 1996 suspended federal funds for COFA populations through Medicaid. Despite a lack
1 The Compact of Free Association was signed for the Federated States of Micronesia and the Republic of the Marshall Islands in 1986 (and in 1994 for Palau). Previously, these island groups were under part of the Trust Territory of the Pacific which was administered by the U.S. after World War II. After these countries became independent from the Trust Territory, the citizens of these countries elected to continue their close relationship with the U.S. under a compact of free association (COFA). In exchange for U.S. military access to FSM’s ocean territories (an area of over 1 million square miles), the United States agreed to provide governmental funding for the FSM over the course of 15 years; funding was extended beyond that initial time period and is set to expire in 2026. Additionally, FSM citizens were allowed free entry into the United States at any time and, in theory, had access to medical coverage such as Medicaid and other governmental and social services.
3
of federal Medicaid financing for COFA migrants, the State of Hawaii continued to provide
coverage via state-funded health insurance in various forms, including a state Medicaid plan
provided by the State of Hawaii Medicaid agency (called Med-QUEST). Following a court
ruling in April of 2014, state Medicaid program coverage for this population was suspended.2 As
a consequence, most COFA migrants were ultimately denied access to the Medicaid program in
March of 2015. However, some COFA migrants were allowed to maintain Medicaid program
coverage. First, CHIPRA (Children’s Health Insurance Program Reauthorization Act) continued
to cover pregnant women and newborns. Second, the Aged, Blind and Disabled (ABD) program
continued to be available to eligible COFA migrants as well. The majority of COFA migrants,
however, needed to purchase private insurance in the health insurance exchanges established by
the ACA in order to continue their medical coverage; they were not eligible for the Medicaid
expansion created by the ACA (McElfish, et al. 2015). COFA migrants were required to select
private insurance from the state of Hawaii’s health insurance exchange -- with the state paying
the premium for insurance for households with incomes less than 100% of the FPL provided that
they chose a Silver-level plan and could verify income (Hawaii DHS, 2014).
In this paper, we employ statewide administrative data of all hospital discharges in Hawaii to
estimate the effects of expiring Medicaid program coverage on medical utilization among COFA
migrants. The data are close to a census of all hospitalizations in Hawaii over the period 2014-
2015. The data also contain a unique patient identification number which enables us to track
individual utilization over time. Using these data, we construct an individual-level panel that
covers the 24 months from January 2014 to December 2015, which includes months before and
after the expiration of Medicaid benefits. The discharge data contain an ethnicity variable. We
employ data for three ethnicities: COFA migrants as the treatment group, non-Hispanic whites as
the control group, and Japanese as the placebo group. To address omitted zeros for non-utilizers,
we include dummy observations and frequency weights corresponding to population numbers
obtained from the American Community Survey (ACS).
To investigate the impact of the expiration of Medicaid program benefits on utilization
among COFA migrants, we use a difference-in-difference research design. We show that there
was a sharp reduction in the number of emergency and in-patient medical care admissions
charged to Hawaii Medicaid (hereafter referred to as ‘Medicaid’) after the expiration of program
2 For details, see McElfish, et al. (2015).

4
benefits for COFA migrants relative to the non-Hispanic white and Japanese populations in
Hawaii among people ages 18 to 64. In particular, Medicaid-funded ER visits and inpatient
admissions declined by 31% and 19%, respectively. This sharp reduction in utilization is
consistent with other studies that have investigated the impact of the expiration of Medicaid
benefits such as studies on Tennessee after it discontinued Medicaid benefits (see DeLeire 2019,
Tarazi 2017, Tello-Trillo 2016). At the same time, there was a substantial increase in the number
of emergency room (ER) visits and inpatient admissions charged to private payers, indicating
that there was a move towards private insurance among COFA migrants after Medicaid program
benefits expired. However, the magnitude of this increase was smaller than the reduction in
Medicaid-funded utilizations. As a result, net inpatient admissions and emergency visits
declined.
After Medicaid program benefits expired, there was an increase in uninsured ER visits. In
particular, uninsured ER visits offset at least 25% of the decline in Medicaid-funded ER use.
This result is likely the consequence of a more onerous enrollment process for private insurance
than for Medicaid, which has year-round open enrollment.
We also find that the Medicaid expiration for adults ages 18 to 64 impacted children and
infants. CHIPRA eligibility did not change for children under 18 years of age during this period.
We show that the utilization of children ages one to 17 declined. We interpret this as a reverse
woodworking effect. Coverage expired for some COFA migrants but many believed that it
expired for all migrants. We further show that inpatient utilization of infants declined
dramatically after the expiration of benefits. However, Medicaid-funded ER visits by infants
increased by a large margin. This result may be the consequence of reduction in ambulatory care
for newborns after the Medicaid expiration.3
The expiration of Medicaid benefits may have reduced utilization of COFA migrants
through two possible mechanisms: increased cost-sharing and low take-up of private insurance.
Both mechanisms increase the cost of medical care. First, the expiration of benefits may have
increased the per-unit cost of services since Medicaid has a well-established fee schedule with
generally lower reimbursement amounts than private insurance, places restrictions on co-
payments, and prohibits balance billing which is the practice of providers charging patients for
what insurers do not reimburse. This increase in prices reduces the consumption of medical
3 We cannot test this hypothesis due to a lack of outpatient data.

5
services.4 Second, moving COFA migrants from a relatively simple public insurance scheme to
more complicated exchanges might have resulted in lower insurance take-up rates (and hence
utilization) due to an increase in the complexity of obtaining insurance coverage. Medicaid has a
year-round open enrollment period. In contrast, private insurers have a six-week open enrollment
period. Moreover, COFA migrants had to have first applied for Medicaid and get rejected prior
to being able to apply for private insurance. The ramp-up in uninsured ER visits that we saw
after the Medicaid expiration is evidence of these difficulties enrolling in private insurance
Another factor for lower insurance take-up is that education levels and literacy rates are
substantially lower for COFA migrants compared to other ethnic groups. For example, Akee
(2010) showed that 7.8% of adult male immigrants from the FSM have no education, 6.5% have
between one and six years of education, and 16.6% have between seven and eight years of
education; the average years of schooling in this population is 10 years. Baicker, et al. (2012) has
also showed that take-up rates of low-cost health insurance are low among those of lower income
and education levels. Despite considerable outreach by advocates during the transition from
Medicaid program coverage to state-subsidized private insurance coverage, this take-up issue
was widely expected.
We conclude that these results provide additional evidence on the responsiveness of the
demand for health services to the cost of services. A major innovation of this paper is that we
show this in a vulnerable migrant population that is substantially poorer than other populations
from this literature including in the Oregon Health Insurance Experiment. The removal of access
to the Medicaid program resulted in only some shifting towards private insurance. However, this
shift does not fully compensate for the decline in utilizations previously financed by Medicaid.
In addition, we show that uninsured ER visits have increased as a consequence of the expiration
of Medicaid benefits. Overall, our results suggest that there are now COFA migrants forgoing
health care services. Importantly, the decline in utilization occurred despite stated-subsidized
private insurance and an automatic transition from Medicaid to private insurance for migrants
enrolled in Medicaid prior to March 2015.
4 Much cited evidence from the RAND Health Insurance Experiment (Manning, et al. 1987; Newhouse, et al. 1993; Aron-Dine et al. 2013) and the Oregon Health Insurance Experiment (Finkelstein et al, 2012) shows that increased cost sharing results in lower utilization. There is also similar quasi-experimental evidence from Card, et al. (2008) in the United States and Shigeoka (2014) in Japan. A reduction in medical utilization as a consequence of an increase in out-of-pocket expenditures without a corresponding underlying change in health status is termed ex post moral hazard or just moral hazard in the health economics literature (Pauly 1968; Cutler and Zeckhauser 2000).

6
The balance of this paper is as follows. In the next section, we provide some institutional
background on the history of COFA migrants in Hawaii and their ability to access health
insurance. After that, we discuss the discharge data that we employed and how we used it to
construct an individual level panel. We then discuss the methods that we employ. After that, we
discuss our results and conclude.
II. Medicaid Eligibility for COFA Migrants in the State of Hawaii
Publicly-sponsored health care coverage for COFA migrants by the State of Hawaii has been
subject to various successive federal and state policy decisions. These policy changes resulted in
public confusion about the actual health programs and specific benefits for which COFA
migrants would be eligible. Such policy changes thus can also serve as a barrier to insurance
enrollment and to obtaining health care, further compounding the socioeconomic vulnerability
and linguistic and cultural barriers facing this community. Here, we provide a brief overview of
recent and relevant policies.
In the 1996 Welfare Reform Act, certain non-U.S. citizens including citizens of COFA
nations were deemed ineligible for federal public assistance including Medicaid. Under this Act,
immigrants to the US were made ineligible for federal Medicaid assistance unless they have
completed a five-year waiting period following immigration in the U.S. However, most COFA
residents are classified not as immigrants, but instead as legal migrants and specifically
permanently classified as “non-qualified aliens.” Thus, under this migration status, these
individuals are not qualified for federal assistance. To make up for the shortfall in the wake of
the 1996 welfare reform, the State of Hawaii began to provide comprehensive health coverage
for COFA residents for Medicaid beginning in 1997 using state funds only (Rilkon et al., 2010).
However, given that the agreement with COFA nations is a federal not a state policy, the
financial responsibility for providing these benefits has often been viewed as disproportionately
burdensome to the State of Hawaii, relative to limited federal support available (typically
provided through limited Department of Interior funds to different state and territorial
jurisdictions affected by COFA migration) (Hawaii DHS, 2009).
After the passage of ACA in 2010, COFA residents along with other lawfully present
noncitizens were eligible to purchase health insurance through state health insurance exchanges.
However, Medicaid-ineligible noncitizens would not be eligible for federal subsidies for
7
premium-free assistance. Instead, the ACA required Medicaid-ineligible noncitizens with
incomes less than 100% of the federal poverty line (FPL) to pay the same premium for insurance
purchased on the exchange as a citizen who has income of 100% FPL (Hawaii DHS, 2014).
In the same year, due to budgetary shortfalls the State of Hawaii elected to cancel the
Medicaid program eligibility for non-pregnant adult COFA residents. Instead, the State created a
limited medical assistance program called Basic Health Hawaii (BHH). Several court cases
contesting this change in policy were filed. Following a lawsuit, a federal court issued an
injunction “requiring the state to provide Medicaid-like benefits to all non-pregnant adult COFA
residents who would otherwise be eligible for Medicaid but for their citizenship status.” The
State appealed this injunction to the Ninth Circuit Court of Appeals, which ruled in favor of the
State of Hawaii in April 2014. The injunction remained in place until November 2014 when the
Supreme Court declined to hear the case, thus ending the plaintiffs’ appeal of the Ninth Circuit
decision.
Subsequently, the State created a policy in which non-pregnant adult COFA migrants who
were not ABD became ineligible for Medicaid program benefits beginning in March of 2015
(Hawaii DHS, 2014; McElfish et al, 2015). Medicaid program coverage effectively ended for
COFA migrants in the State of Hawaii except for children, pregnant women, and people who
were ADB. Infants and pregnant women remained eligible for Medicaid from CHIPRA and
those who were ABD were able to receive the same level of benefits as those available under
Medicaid.
The non-pregnant, non-ABD COFA adults were instructed to buy private health insurance on
the Hawaii Health Connector, the state’s health insurance exchange with premiums to be
subsidized. On the exchange, COFA migrants could choose from either of two private insurers
(Kaiser Permanente or Hawaii Medical Service Association (HMSA)), with the state paying the
premium for insurance purchased for those with incomes less than 100% of the FPL provided
that they chose a Silver-level plan and could verify household income (Hawaii DHS, 2014). The
premium assistance program, however, did not pay for any deductible, co-payment, co-
insurance, or other cost-sharing arrangements, in contrast to Hawaii Medicaid coverage.
However, Kaiser waived these costs for those meeting eligibility requirements by demonstrating
financial need.
8
The final policy shift to insurance exchange plans was a source of much confusion in the
community. While outreach volunteers and workers held information sessions and went door-to-
door to share relevant information, enrollment on the exchange itself was confusing.
Compounding these challenges were the technical challenges troubling the Hawaii Health
Connector website. In 2015, only a few months after the enrollment period for the COFA
migrants to change to the private insurance, the Connector was closed down and to be replaced
by the federally-managed exchange. This meant that anyone who had been enrolled in the
connector had to re-enroll using Healthcare.gov, causing further confusion and additional
outreach to the COFA community (Princeton, 2017). Unlike the Hawaii Health Connector,
Healthcare.gov is not available in COFA languages, adding more challenges (Princeton, 2017).
In the year 2015 only, the State’s Medicaid program did institute auto-enrollment so those being
dropped and those who had not chosen a plan were automatically placed into one of the two
private insurance plans, with an intended 50/50 split. A recent policy analysis estimated that
3,600 COFA Hawaii residents enrolled in coverage in Kaiser in 2015 and 5,500 in HMSA
(Princeton, 2017).
III. Data Description
The data used in this study are provided by the Hawaii Health Information Corporation
(HHIC), a private, not-for-profit organization that was based in Honolulu, Hawaii. HHIC
collected data from hospitals in Hawaii. Its catchment area included all hospitals in the State of
Hawaii.5
We utilized raw data from HHIC that consisted of all utilizations of inpatient and emergency
medical services over the period January 1, 2014 to December 31, 2015 for all individuals with
Japanese, Caucasian, or Micronesian ethnicities. In total, we used data on 409,556 specific
utilizations. For our analysis, we only use utilizations for Hawaii residents (i.e. people with
addresses in the State of Hawaii). These data include information on the type of discharge (i.e.
inpatient or ER), admission and discharge dates, ethnicity (e.g. Micronesian, Japanese, or
Caucasian), gender, age, payer type (e.g. Medicaid, private insurance), total billed/charged, and
5 The HHIC data for Tripler Army Medical Center do not include race information so we do not use hospitalizations and ER visits for this hospital. Accordingly, the data were thus nearly a census.
9
principal diagnosis and procedural codes. A critical feature of these data is that they include a
unique patient identification number which allows us to identify the same patient over time in the
raw data. This allows us to construct a panel in which we track utilization of a given individual
for each month between January 2014 and December 2015. If no admissions are reported in a
given month in the raw data, this indicates that no utilization likely took place in that month
given the large catchment area of the HHIC data.
One important feature of the raw HHIC data is that they contain exact birthdates and death
dates (for those who died during 2014-15 and provided that they died in a hospital). For people
who were born during 2014-15, the panel begins on the month and year of their birth. For people
who we know to have died during 2014-15, the panel ends on the month and year of their death.
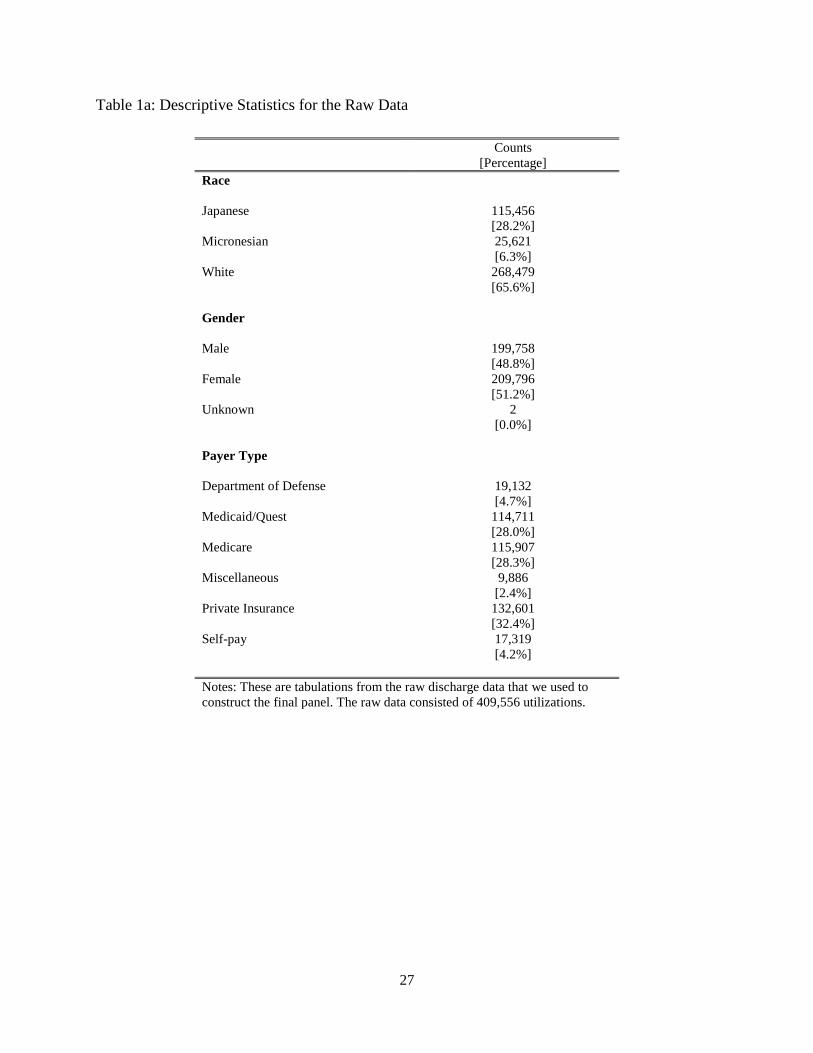
Descriptive statistics from the raw discharge data are reported in Table 1a. The bulk of the
sample is Caucasian comprising 65.6% of all utilizations, followed by Japanese (28.2%) and
Micronesians (6.3%). This sample has slightly more women (51.2%) than men (48.8%). Finally,
most of the utilizations in our sample were for people on private plans (32.4%), Medicare
(28.3%), and then Med-QUEST (28.0%). Roughly 4% of the utilizations in the raw data were
billed to the patient (as opposed to an insurer).
To put the data in a format suitable for regression analysis, we created an individual-level
panel in which we tracked utilization for all months between January 2014 and December 2015.
To do this, we computed the total number of admissions and charges in a given month for a
given individual. We used the discharge date from the raw data to date the utilization. If no
utilization took place for an individual in a month, we entered a zero for the cost and utilization
variables. Next, we dropped all individual/month observations for which total charge exceeded
one million dollars. This resulted in a final panel data set containing 205,691 individuals and
4,782,091 month/individual observations.
The HHIC data and the resulting panel described herein only include individuals with at least
one admission to a hospital or an ER during 2014-15. The sample excludes people who had no
such contact with the medical system during this time (i.e. people who had no inpatient
admission or emergency room visit during this time period). Importantly, if we did observe data
for these individuals, the dependent variables (most likely) would have been a 24-month period
string of zeros given HHIC’s almost universal catchment area.

10
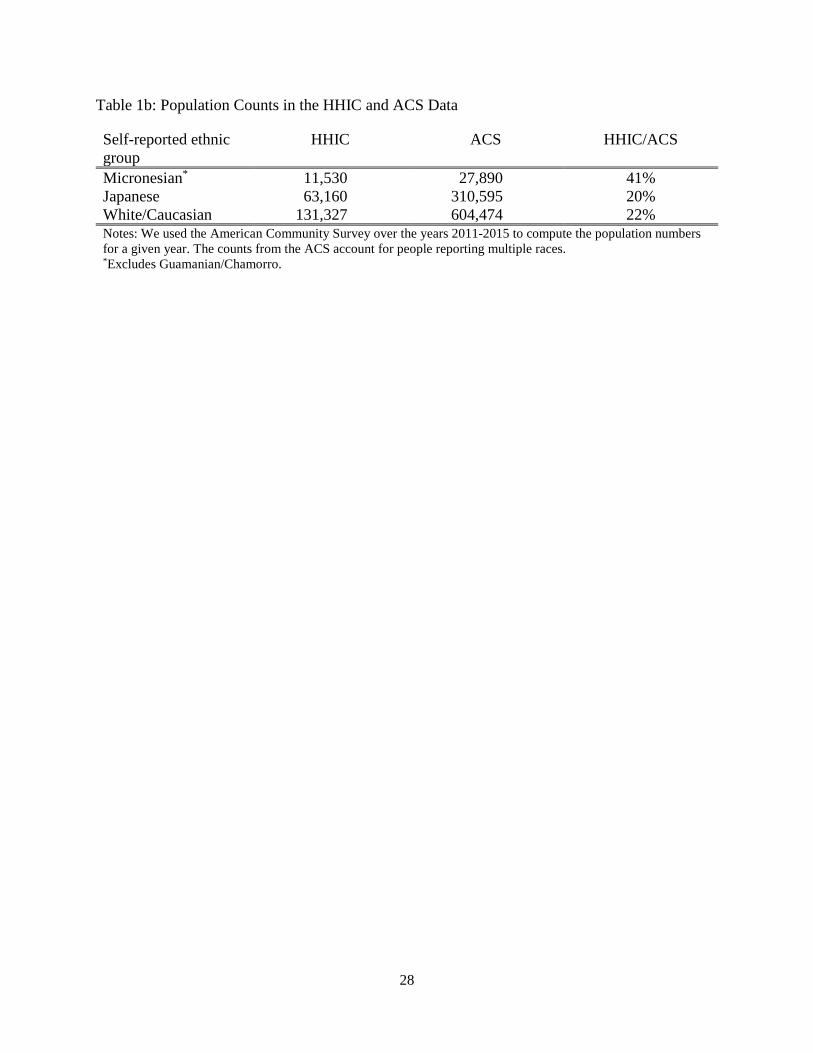
Table 1b presents population counts from the American Community Survey (ACS). The five-
year counts from the ACS from 2011-2015 correspond to people who report Micronesian
(excluding Guamanian/Chamorro), Japanese, or White as one of their ethnicities. Our estimates
of ACA-based population of Micronesians, Japanese, and Whites are, respectively, 27,890,
310,595, and 604,474, whereas corresponding counts in the HHIC data are 11,530, 63,160, and
131,327 indicating that there are many missing zeros from our panel indicating that they did not
use any acute care services.6
The solution to this is fairly simple. For each of the three ethnicities considered and for each
age/gender category, we added a single dummy observation in which all of the outcome
variables were coded as zeros. We then created a set of frequency weights as follows. All
individuals in the initial HHIC panel received a weight of unity since they represent exactly one
population unit. For each of the dummy observations, which correspond to the omitted zeros
from the HHIC data, we set the weight equal to the difference between the population counts for
the ethnicity/age/gender category from the ACS and the corresponding ethnicity/age/gender
category from the HHIC data. This procedure ensures that the denominators in our means
correspond to the population counts as opposed to those who were merely present in the HHIC
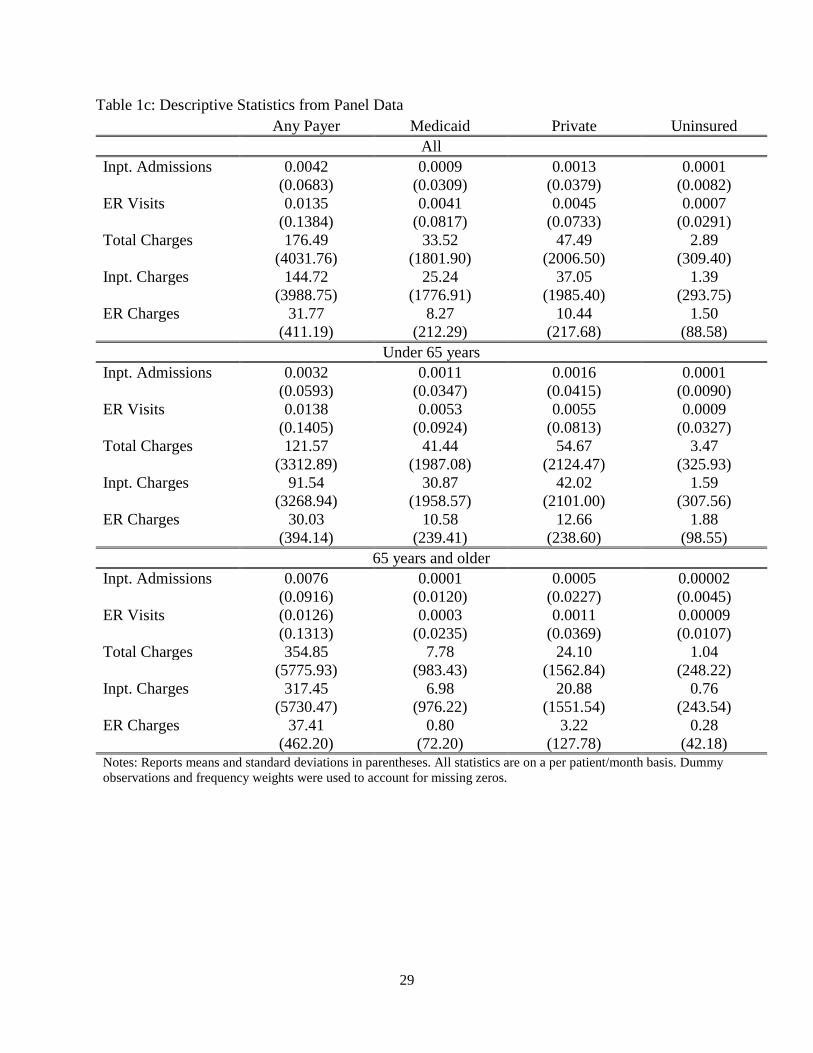
data (see Appendix A for additional details).7 Summary statistics on utilization and charges
from the panel are reported in Tables 1c and 1d. All statistics use the frequency weights and
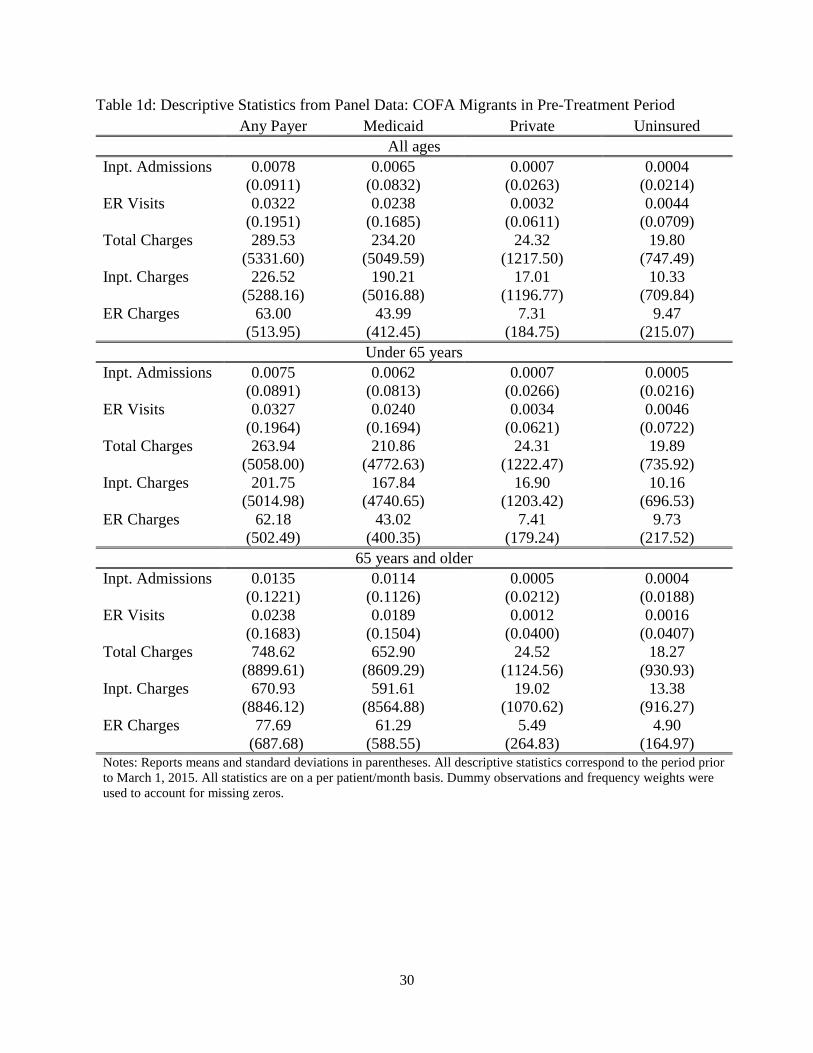
address the issue of omitted zeros. Table 1c reports statistics for all individuals and Table 1d
reports statistics for COFA migrants for the period prior to March 1, 2015. In each of these
tables, descriptive statistics are reported for individuals of all ages in the top panel, people under
65 years in the middle panel, and people 65 and over in the bottom panel. Utilization and charges
are broken down by inpatient admissions and ER visits. We also report statistics for all
utilization under the heading “all payers,” utilization charged to Medicaid, utilization charged to
private insurance, and utilization not charged to any payer, “uninsured.”
6 There is a recent report from the US Census Bureau that estimates that there are 18,874 COFA migrants in the State of Hawaii (US Census Bureau 2018). This estimate only counts people who migrated to Hawaii since 1986 and does not count additional people in the ACS who report Micronesian as a race or ethnicity. This is an important distinction because the HHIC ethnicity question only asked the patient if they reported Micronesian as a race or ethnicity. Hence, we contend that the count of 27,890 is based on questions that better match the HHIC ethnicity information. 7 Note that the counts of many groups in the US Census are not perfect. This is particularly true of marginal groups, who may be undercounted. Accordingly, we do conduct some sensitivity analysis.
11
In the top panel of Table 1c, we see that on average there were 0.0042 inpatient admissions
and 0.0135 emergency room visits per patient-month. This translates to an inpatient admission
about every 20 years and an ER admission about every 6 years for entire population. On average,
total charges per patient-month for all admissions (i.e. inpatient and ER) were $176.49. The
average amount charged to Medicaid was $33.52 and to private payers was $47.49. The
remainder was paid by other payers such as Medicare.
Table 1d provides descriptive statistics from the COFA population for the period prior to
March 2015. The table shows that COFA migrants are sicker than the overall study sample. For
example, the mean of hospital admissions per patient-month among COFA migrants under 65
was 0.0075, whereas it was 0.0032 for the entire sample under age 65 in the previous table.
Accordingly, the hospitalization rate for COFA migrants is more than twice that of the study
sample. Similarly, the lower health status among COFA migrants is also reflected by the
observation that Micronesians accounted for 6.3% of the study discharges for the three
ethnicities, but 3.0% of the state’s population of the corresponding ethnicities.
In Figure 1, we display bar graphs depicting total admissions per patient-month charged to
Medicaid, private insurance, Medicare, and the individual by ethnic group for the entire sample
period over 2014-2015. The top panel shows inpatient admissions and the bottom panel shows
ER visits. The left panel shows utilizations for people under 65 years and the right panel
corresponds to people 65 years and older. Several observations are apparent. First, for the
duration of our sample, COFA migrants are substantially more likely to have their utilizations
charged to Medicaid than either the Japanese or Caucasians. Second, we see a discontinuous
jump in total charges to public insurance for people 65 years and older. However, while
utilizations of the Japanese and Caucasians are charged to Medicare, COFA migrants are by-and-
large covered by Medicaid when they are elderly which is consistent with the discussion in the
previous section. Third, COFA migrants visit the ER at much higher rates than the other two
groups. Fourth, there is a much higher rate of uninsured COFA migrants in ER usage than either
the Japanese or Caucasians (see bottom row of the figure).
Finally, we can use the statistics in Table 1d for COFA migrants to estimate the total cost
of providing Medicaid benefits to this population for the State. For all COFA migrants, the State
was charged $234.20 per patient/month for inpatient and ER services. Table 1b indicates that
there were 27,890 Micronesians in the State. Accordingly, over the course of a year, this sums to
12
$78,382,056 that was charged to the State for inpatient and ER services. A typical assumption on
the payment-charge ratio for Medicaid is 2/3 which results in a total cost of about $52.5 million
to provide inpatient and ER services to COFA migrants. Note that total expenditures by the State
of Hawaii in 2014 were about $10.7 billion (Rosewicz 2018). Accordingly, the cost of providing
medical services to COFA migrants for the State constituted approximately 0.5 % of the State’s
budget in 2014.
IV. Methods
We employ a difference-in-difference (DD) research design. We let 𝑦𝑦𝑖𝑖𝑖𝑖 denote a particular
outcome for individual 𝑖𝑖 at period 𝑡𝑡. The unit of time, t, is measured in months and covers the 24
months between January 2014 and December 2015. The main outcomes that we consider are the
number of inpatient admissions or ER visits in a month and the corresponding amount charged.
We further disaggregate visits by those that were charged to Medicaid, to private insurance, or to
the individual. The treatment group is the COFA population which is identified as “Micronesian”
in our data. Caucasians are our control group and the Japanese are our placebo group.
Our main estimation equation is the standard panel difference-in-difference model with two-
way fixed effects for individuals and periods with some small modifications. Our main outcome
variable is given by 𝑦𝑦𝑖𝑖𝑖𝑖 . We let 𝐽𝐽𝐽𝐽𝑖𝑖 denote a dummy that equals one if the individual is Japanese.
Similarly, 𝐶𝐶𝐶𝐶𝐶𝐶𝐶𝐶𝑖𝑖 is a dummy that is equal to one if the individual is Micronesian. We let 𝐽𝐽𝐶𝐶𝑃𝑃𝑃𝑃𝑖𝑖
denote an indicator for the period being March 2015 or later. In addition, 𝐽𝐽𝐶𝐶𝑃𝑃𝑃𝑃−1,𝑖𝑖 is an
indicator for one quarter prior to the expiration of Medicaid benefits (Dec 2014 to Feb 2015) and
𝐽𝐽𝐶𝐶𝑃𝑃𝑃𝑃−2,𝑖𝑖 is an indicator for two quarters prior to the expiration of Medicaid benefits (Sep 2014
to Nov 2014).
The main estimation equation that we employ can then be expressed as:
𝑦𝑦𝑖𝑖𝑖𝑖 = 𝜋𝜋−2(𝐽𝐽𝐶𝐶𝑃𝑃𝑃𝑃−2,𝑖𝑖 ∗ 𝐽𝐽𝐽𝐽𝑖𝑖) + 𝜋𝜋−1(𝐽𝐽𝐶𝐶𝑃𝑃𝑃𝑃−1,𝑖𝑖 ∗ 𝐽𝐽𝐽𝐽𝑖𝑖) + 𝜋𝜋0(𝐽𝐽𝐶𝐶𝑃𝑃𝑃𝑃𝑖𝑖 ∗ 𝐽𝐽𝐽𝐽𝑖𝑖)�����������������������������������������𝑃𝑃𝑃𝑃𝑃𝑃𝑃𝑃𝑃𝑃𝑃𝑃𝑃𝑃 𝑇𝑇𝑃𝑃𝑇𝑇𝑖𝑖
+
𝜏𝜏−2(𝐽𝐽𝐶𝐶𝑃𝑃𝑃𝑃−2,𝑖𝑖 ∗ 𝐶𝐶𝐶𝐶𝐶𝐶𝐶𝐶𝑖𝑖) + 𝜏𝜏−1(𝐽𝐽𝐶𝐶𝑃𝑃𝑃𝑃−1,𝑖𝑖 ∗ 𝐶𝐶𝐶𝐶𝐶𝐶𝐶𝐶𝑖𝑖)���������������������������������𝑃𝑃𝑃𝑃𝑃𝑃−𝑇𝑇𝑃𝑃𝑃𝑃𝑇𝑇𝑇𝑇 𝑇𝑇𝑃𝑃𝑇𝑇𝑖𝑖
+ 𝜏𝜏(𝐽𝐽𝐶𝐶𝑃𝑃𝑃𝑃𝑖𝑖 ∗ 𝐶𝐶𝐶𝐶𝐶𝐶𝐶𝐶𝑖𝑖)�������������𝐷𝐷𝑖𝑖𝐷𝐷𝐷𝐷−𝑖𝑖𝑇𝑇−𝐷𝐷𝑖𝑖𝐷𝐷𝐷𝐷𝑇𝑇
+ 𝛼𝛼𝑖𝑖 + 𝛾𝛾𝑖𝑖 + 𝑔𝑔(𝑎𝑎𝑔𝑔𝑎𝑎𝑖𝑖𝑖𝑖) + 𝜀𝜀𝑖𝑖𝑖𝑖
(1)

13
The estimate of parameter, τ, is the difference-in-difference estimator which is informative of the
effects of Medicaid on medical utilization among COFA migrants. We clustered all standard
errors at the individual-level.
Estimation of this model also allows for two specification tests that are informative of the
validity of the research design. The first is a test for differential pre-trends in the COFA
population. This is an F-test of 𝐻𝐻0: 𝜏𝜏−2 = 𝜏𝜏−1 = 0, which has a 𝜒𝜒22 distribution. The second is a
test for parallel trends in our placebo group who are the Japanese. This is an F-test of 𝐻𝐻0:𝜋𝜋0 =
𝜋𝜋−2 = 𝜋𝜋−1 = 0, which has a 𝜒𝜒32 distribution. We also report an F-test of the null that the
difference-in-difference parameter is zero, which has a 𝜒𝜒12 distribution.
Because we have a very large sample size, small deviations from these null hypotheses
that would not have been detectable with a sample under 10,000, for example, will now be
detectable. Our sample size is quite large with close to one million individuals who we observe
for up to 24 months. As Deaton (1997) points out, “Larger sample sizes are like resolving power
on a telescope; features that are not visible from a distance become more and more sharply
delineated as the magnification is turned up.” Leamer (1978) and Schwarz (1978) propose
adjusting the critical values of statistical tests for the sample size to prevent the over-rejection of
null hypotheses in large samples. In particular, they propose employing 𝑞𝑞 ln𝑛𝑛 as the critical
value of a 𝜒𝜒𝑞𝑞2-test (see pp. 130-131 of Deaton 1997). We report the Leamer-Schwarz critical
values (L-S CV) in Table 2.
V. Results
Core Results
We report our core results from estimation of equation (1) for adults ages 18-64 in Table 3.
We restrict our sample to this age range for our main estimations because the Medicaid
expiration did not impact children (under 18) or the elderly (65 or over). The table reports the
results of 12 estimations. For each estimation, we report the difference-in-difference (DiD)
estimator as well as F-tests of the nulls that the pre-trend, placebo, and DiD parameters are zero.
The outcomes that we consider are inpatient admissions and ER visits reimbursed by any payer,

14
a private payer, or Medicaid (reported in Panel A). We also consider charges for each of these
six outcomes (reported in Panel B). Before we discuss the DiD estimates, we note that the
specification tests in the table do not indicate any pre-trends or placebo effects.
In the panel A of Table 3, we look at the effects of the policy change on inpatient admissions
and ER visits. In the first column of this panel, we see that the policy had a negative but
insignificant impact on inpatient admissions charged to any payer. Note that this effect is
inclusive of utilizations that were funded by Medicaid and those that were funded by private
insurance. In the fourth column of the same panel, we see that the Medicaid expiration had a
larger negative impact on ER visits charged to any payer. The point estimate of the DiD
parameter indicates a reduction in ER visits of 0.0045 per patient/month and the F-test of the null
that the DiD parameter is 37 which greatly exceeds the L-S CV of 13.
Next, looking at utilization disaggregated by type of insurer (columns 2, 3, 5 and 6), we see
that utilizations charged to Medicaid declined whereas those charged to private insurance
increased. However, the magnitudes of the former effects are larger than the latter effects which
is what accounts for the net negative impacts found in the “Any” payer columns (columns 1 and
4). In the second and fifth columns, we see that inpatient admissions and ER visits that were
charged to Medicaid declined by 0.0029 and 0.0139 per patient-month. Both estimates have F-
statistics that greatly exceed their L-S CV. The reported means for these two outcomes (reported
in the same table for the COFA population in the pre-period) are 0.0151 and 0.0445.
Accordingly, these effects amount to 19% and 31% decreases in utilization for the COFA
migrants. In contrast, inpatient admissions and ER visits charged to private insurance increased
by 0.0019 and 0.0064, respectively. Compared to the means of 0.0021 and 0.0124 of inpatient
admissions and ER visits, these effects represent 90% and 52% increases. This indicates that the
policy worked as expected with a shift in financing away from Medicaid and towards private
insurers.
The second panel of Table 3 reports the effects of the Medicaid expiration on charges for
inpatient admissions (columns 1-3) and ER visits (columns 4-6). These results closely mimic the
results in Panel A. We see that the Medicaid expiration reduced charges for inpatient admissions
and ER visits charged to Medicaid by $106 and $33, respectively. Both estimates are highly
significant. As a percentage of the mean, these estimates constitute 22% and 32% decreases in
15
charges. Conversely, the Medicaid expiration increased charges for inpatient admissions and ER
visits charged to private insurers by $66 and $16, which constitute 104% and 47% increases.
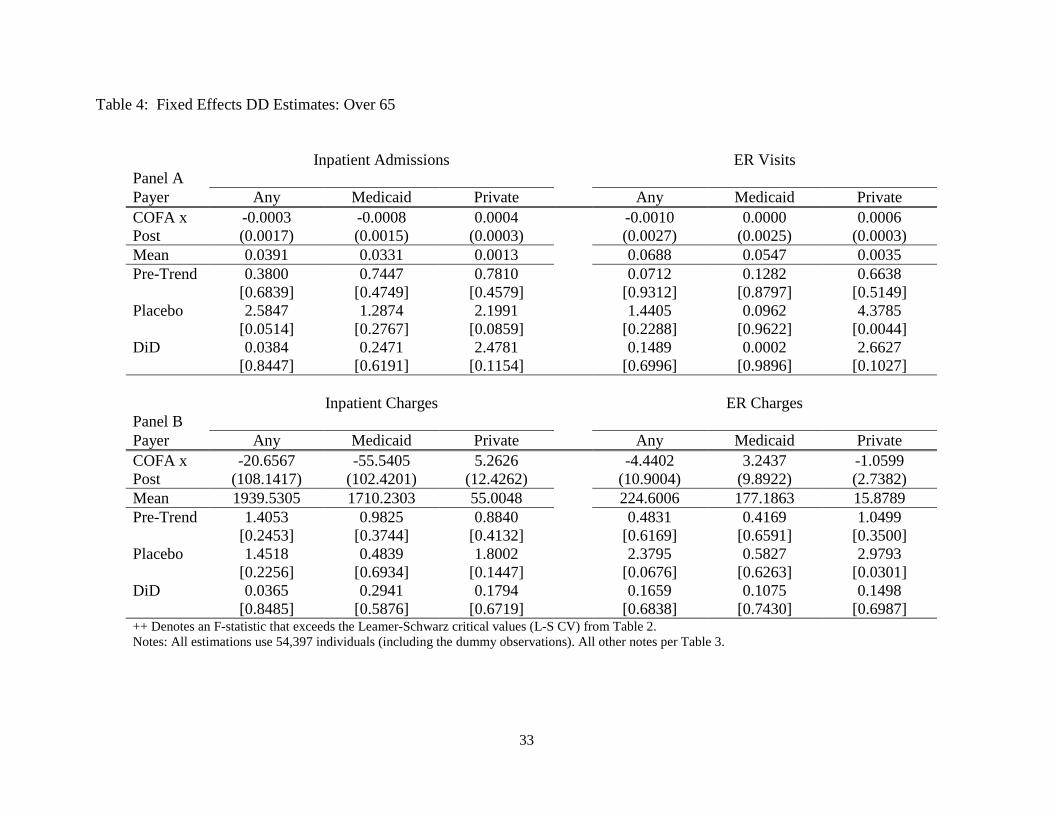
Next, in Table 4, we estimate the same models as in Table 3 but now we restrict the
population to people over 65 years of age. This population was eligible for Medicaid throughout
the sample period. We see no effects on this population.
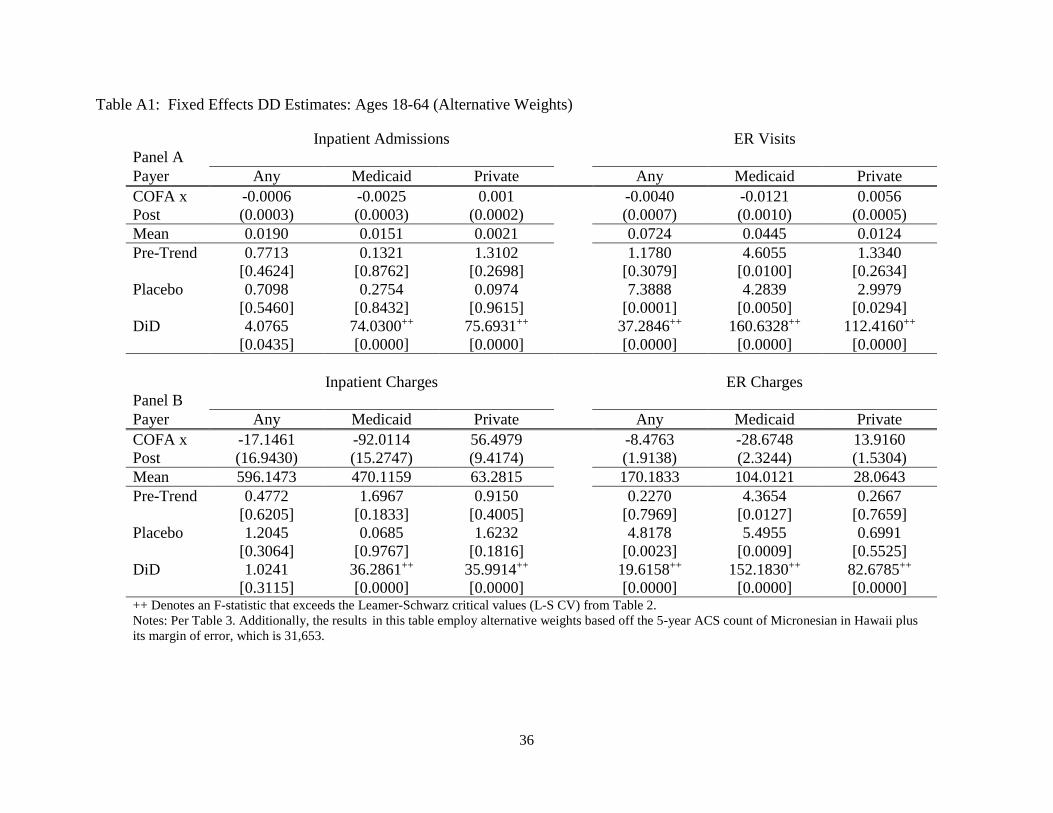
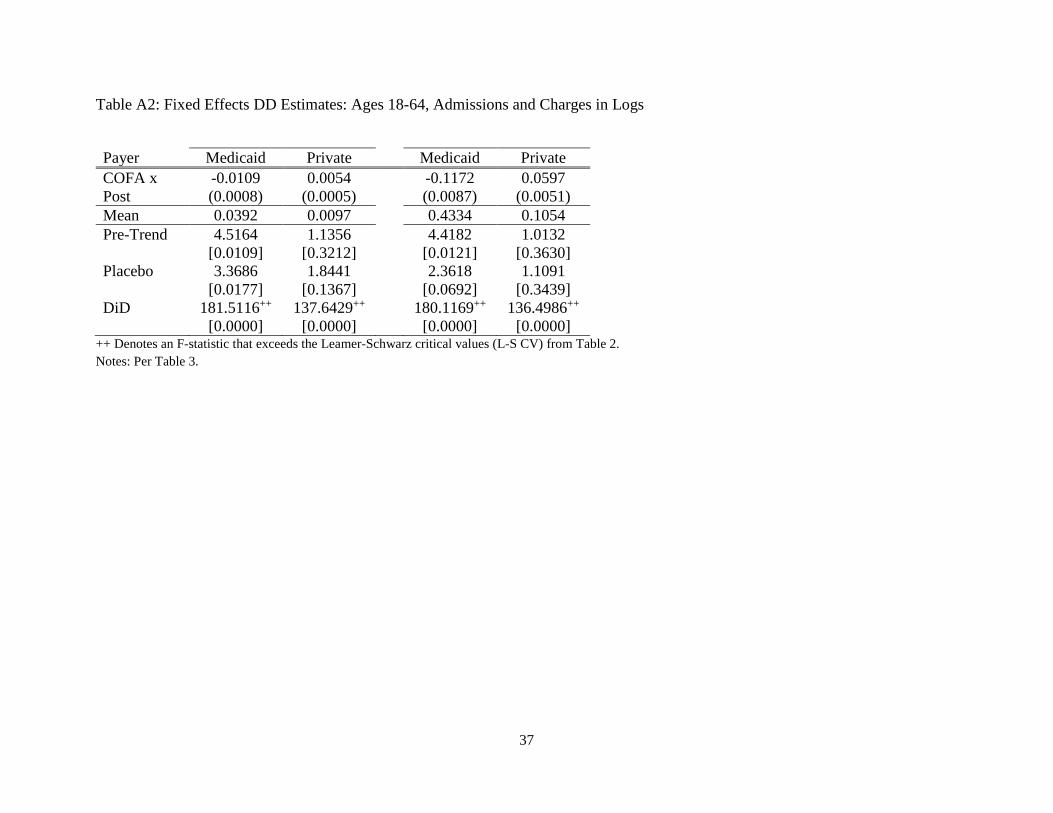
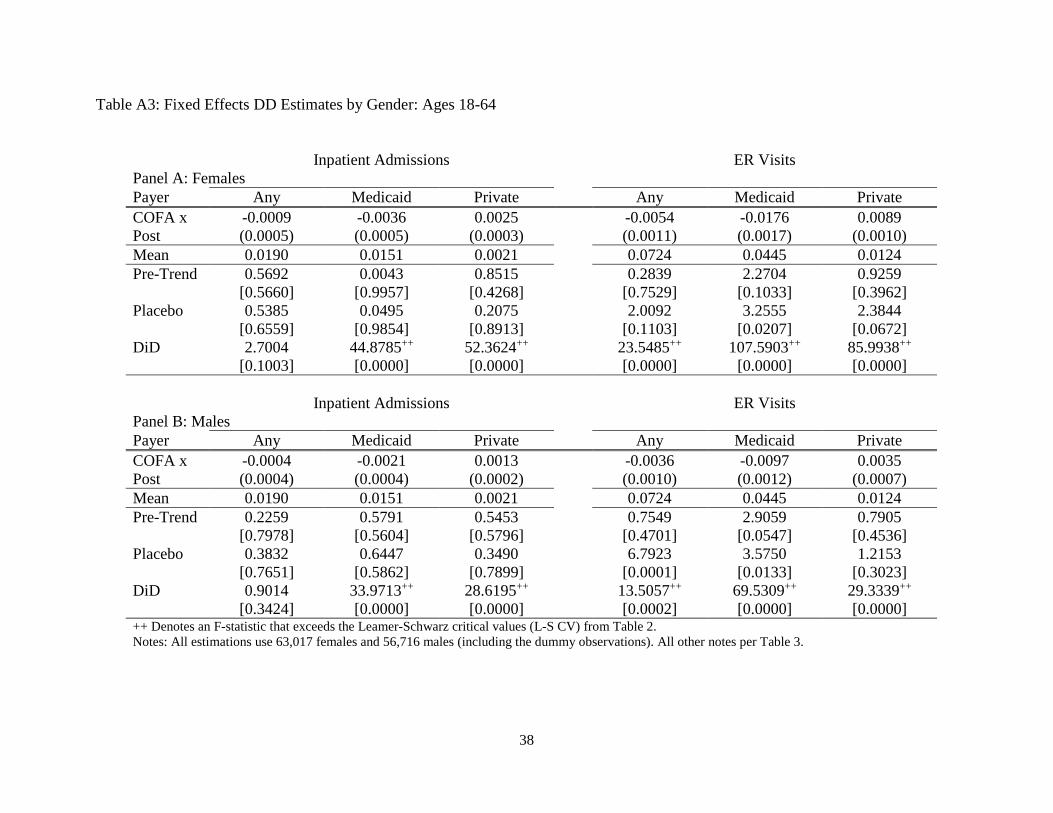
In the Appendix, we report three additional sets of results. First, we estimate the same models
as in Table 2 except that we employ alternative weights for COFA migrants. Our preferred
weights in this paper are based on a five year count from the ACS from 2011-2015 of
Micronesians in the State of Hawaii. However, given the possibility that Micronesians (like
many other migrant groups) might be undercounted, we also employ the count from the ACS
plus the reported margin of error of 3763. Accordingly, we also report a set of results using
weights based off of a count of Micronesians that is slightly higher, 31,653. The results of this
exercise are reported in Table A1. Our qualitative findings are unaffected. For the second
exercise (reported in Table A2), we use the log of total admissions and charges as the dependent
variable. To account for the large number of zeros in the data, we added one to all observations.
Note that because of this, you cannot interpret these estimates as elasticities. We did this to
ensure that our findings are not being driven by outliers. This is particularly important for the
charges. The results indicate that this is not the case. Third, we examine the effects of the
Medicaid expiration across genders (reported in Table A3). These results indicate that the
Medicaid expiration affected women slightly more than men.
Effects on the Uninsured
We now look at how the Medicaid expiration affected uninsured utilization. We estimate our
two-way fixed effects DiD model using inpatient admissions and ER visits that were not charged
to any insurer (either public or private) as the dependent variable (results in Table 5).
We see impacts for COFA migrants ages 18-64, but not older than 65. Uninsured
hospitalizations increased for people ages 18-64 by 0.0003 per patient/month, but this estimate
has an F-statistic that is only marginally above the L-S CV of 13. Uninsured ER visits, on the
other hand, increased dramatically for ages 18-64 by 0.0035 per patient/month. The F-statistic on
this estimate is 83, which is far greater than the L-S CV. The magnitude of this estimate is 25%

16
as large as the DiD estimate of the impact of the Medicaid expiration on Medicaid-funded ER
visits from Table 3. In the next section, we will show that the increase in uninsured ER use
ramped up prior to the official expiration date. Accordingly, at least 25% of the decline in
Medicaid-funded ER use was offset by uninsured ER use. The last two columns show no impacts
on uninsured admissions among COFA migrants 65 and older.
Event Analysis
We now estimate an event study modification of equation (1):
𝑦𝑦𝑖𝑖𝑖𝑖 = 𝛼𝛼𝑖𝑖 + 𝛾𝛾𝑖𝑖 + 𝐶𝐶𝐶𝐶𝐶𝐶𝐶𝐶𝑖𝑖 × 𝜏𝜏𝑖𝑖 + 𝑔𝑔(𝑎𝑎𝑔𝑔𝑎𝑎𝑖𝑖𝑖𝑖) + 𝜀𝜀𝑖𝑖𝑖𝑖 (2)
For each of these estimations, we plot the 𝜏𝜏𝑖𝑖 estimates for all 𝑡𝑡.8 We normalize 𝜏𝜏𝑖𝑖 to be zero for
February 2015, which is the month just prior to the expiration of benefits. These estimations will
shed additional light on the parallel trends assumption. We estimate the model for ages 18-64.
We present the results in Figure 2. The figure contains six graphs corresponding to inpatient
utilization and ER visits and whether the payer Medicaid, private insurance, or the individual.
We report the results for inpatient utilization in the first row. We do not see evidence of
pre-trends in any of the plots. Next, we see a sharp change in utilization funded by private
insurance and Medicaid precisely in March of 2015 when Medicaid benefits expired. Finally, we
do not see meaningful changes in self-funded hospitalizations in the third plot in the first row.
We report the results for ER visits in the second row. As with inpatient utilization, we do
not see evidence of pre-trends when the payer was either private insurance or Medicaid. The
magnitude of the decline in Medicaid-funded ER visits was substantially larger than the
corresponding magnitude for the increase in ER visits funded by private insurance. Finally, we
see that uninsured ER visits increased relative to the pre-period after Medicaid benefits expired.
Notably, this ramp-up occurred prior to the date at which Medicaid benefits officially expired.
8 Note that for this specification, we combined the Japanese and Caucasians into the control group. We did this because the previous analysis did not indicate that there were different effects on the placebo group.

17
It is not completely clear what the cause of this ramp-up is. This is a puzzle because
COFA migrants were still eligible for Medicaid during this period. Typical practice at most
emergency rooms is to enroll eligible, uninsured patients in Medicaid as this guarantees
payment. This indicates a rigidity preventing this from happening.9 For example, the hospitals
may have thought either that COFA migrants where not eligible for Medicaid before March 2015
or that it was not worth enrolling COFA migrants in Medicaid for a brief time period.
Results by Age
We now investigate heterogeneity in the treatment effect by age. For this, we estimate a
variant of the two way fixed effects model in which we include a complete set of age dummies as
well as their interactions with the COFA dummy. The model is
𝑦𝑦𝑖𝑖𝑃𝑃𝑖𝑖 = 𝛼𝛼𝑖𝑖 + 𝛾𝛾𝑖𝑖 + 𝛼𝛼𝑃𝑃 + 𝐶𝐶𝐶𝐶𝐶𝐶𝐶𝐶𝑖𝑖 × 𝜃𝜃𝑃𝑃 + 𝐽𝐽𝐶𝐶𝑃𝑃𝑃𝑃𝑖𝑖 × 𝜌𝜌𝑃𝑃 + 𝐶𝐶𝐶𝐶𝐶𝐶𝐶𝐶𝑖𝑖 × 𝐽𝐽𝐶𝐶𝑃𝑃𝑃𝑃𝑖𝑖 × 𝜙𝜙𝑃𝑃 + 𝜀𝜀𝑖𝑖𝑃𝑃𝑖𝑖 (3)
where 𝑎𝑎 denotes a five year age bin between ages one and 85. For these estimations, we exclude
infants and people older than 85.10 For each estimation, we plot the coefficient on the interaction
between the DiD variable and the five-year age bin denoted by the parameter, 𝜙𝜙𝑃𝑃. In the next
subsection, we will consider infants (and children) separately. As before, the figure contains six
figures corresponding to type of utilization (inpatient or ER) and payer (private insurance,
Medicaid, or self). Each plot contains two vertical lines at ages 18 and 65. The Medicaid
expiration should have only affected people between these ages.
We see that the expiration of benefits mainly impacted adults between ages 18 and 64.
However, there is evidence that Medicaid-funded ER visits by children declined. Medicaid
eligibility did not change for children and, so this decline should not have happened.
Effects on the Infants and Children
9 Private communication with physicians working at Queens Medical Center in Honolulu indicated that just prior to the expiration of COFA Medicaid program benefits, there was a sense that it would be difficult to enroll uninsured COFA migrants in the State’s Medicaid program due to the policy uncertainty so many providers may not have put forth the typical effort to support enrollment for those otherwise uninsured. 10 As before, we are combining Japanese and Caucasian people into a single control group for the sake of parsimony.
18
Finally, we explore how the expiration of benefits affected Micronesian infants and
children. To do this, we estimate a variant of equation (1) for children under 18. For some
specifications, we include an infant dummy and its interaction with the COFA/POST variable (as
well as all of the other associated interactions). We only consider utilizations charged to
Medicaid.
We report the results in Table 6. The table consists of eight columns corresponding to
four outcomes: inpatient admissions, ER visits, inpatient charges, and ER charges. For each
outcome, we report the estimation of equation (1) without the infant interactions in the odd
columns and, in the even columns, we report the results with the infant interactions.
The results indicate that the expiration of Medicaid benefits for adults affected children.
We see that there was a decline in inpatient admissions and charges (columns 1 and 5). In
addition, we see that there was a much larger decline in inpatient admissions and charges for
infants (columns 2 and 6). There was also a decline in ER visits and charges (columns 3 and 7).
However, there was a substantial increase in ER visits and charges for infants (columns 4 and 8).
The contrasting effects of the expiration of benefits on the utilization of infants are important.
We showed that inpatient admissions declined precipitously whereas ER visits increased by a
large magnitude. While our hospital data is not ideal for pinning down the precise mechanism,
we suspect that the expiration of Medicaid program benefits for many COFA migrants generally
led to a decline in the use of ambulatory care for newborns.
This may have led to two consequences. The first is that the use of ER visits for neonatal care
increased. The second was a decline in inpatient admissions, which may have happened since
primary care physicians refer patients for surgery and other inpatient services.
Prima facie, these effects on infants are puzzling since pregnant women and legally residing
children were still technically covered by Medicaid after March, 2015 (i.e. the policy change
should not have affected this group). What these results suggest then is that, despite their
continued eligibility, there were still many children and pregnant mothers who did not use the
available state-provided Medicaid services – perhaps because they were unaware that they
continued to be eligible for CHIPRA coverage.
In some sense, this can be viewed as a reverse woodworking effect. Benefits expired for a
large swath of the Micronesian population in Hawaii. As previously discussed, young COFA
migrants were actually still covered by the State’s CHIPRA program. However, it appears as if

19
the salience of the expiration of benefits for the majority of migrants led many eligible migrants
to believe that they were not covered. To this end, Hofschneider (2019) says, “parents are
sometimes confused about why they have different insurance from their children, or mistakenly
think that because they aren't covered that their children aren't either.” In a similar vein, but in
the opposite direction, Frean, et al. (2017) found that the expansion of Medicaid under the ACA
increased enrollment in Medicaid among people who were previously eligible for Medicaid
benefits.
VI. Conclusions
In this paper, we investigated the effects of eliminating Medicaid program coverage for a
vulnerable migrant population in the State of Hawaii. To do this, we employed a large
administrative database that constitutes close to a census of all inpatient and emergency room
utilizations during 2014 and 2015. Difference-in-difference models indicate that the expiration of
benefits decreased Medicaid-funded inpatient and emergency room utilizations for adults ages 18
to 64 by 31% and 19%, respectively. Privately-funded utilizations increased by 90% for inpatient
admissions and 52% for emergency room visits. On net, the magnitudes of the publicly-funded
utilization did not make up for the decline in Medicaid-funded utilization resulting in a net
decline in utilization for Micronesian adults after the expiration of Medicaid program benefits.
Some of the shortfall in Medicaid-funded utilization of the ER was made up for by
utilizations of uninsured patients. We find that there was a marked increase in ER visits that were
charged to the patient (as opposed to Medicaid) that began earlier than the official expiration
date of Medicaid benefits. This is a puzzle. Ostensibly, COFA migrants should have been
eligible for Medicaid benefits up to March of 2015. Our best guess is that COFA migrants who
were enrolled in Medicaid were allowed to obtain Medicaid benefits until March of 2015.
However, many COFA migrants who were uninsured before March of 2015 (and, hence, eligible
for Medicaid) and who sought care in the ER were not enrolled in Medicaid.
We also saw the expiration of Medicaid benefits for Micronesian adults affected
Micronesian children. COFA migrants under age 18 remained eligible for the State’s CHIPRA
program throughout the sample period. In addition, we saw that there was a dramatic increase in
Medicaid-funded ER visits by Micronesian infants after the general Medicaid benefits expired.
20
Unfortunately, it is hard to pin down the precise mechanism underlying this finding, but we
suspect that Micronesian parents substituted ER visits for ambulatory care for their newborns
once Medicaid benefits expired. These findings suggest a failure to effectively communicate that
the children of COFA migrants would continue to be eligible for Medicaid even after benefits for
most other COFA migrants ended.
Many of these undesirable effects were predicted at the time of the expiration of benefits.
For example, Hagiwara, et al. in the May 2015 issue of the Journal of Health Care for the Poor
and Underserved said, “There is concern that this process, which has proven to be confusing
even for native English speakers, will at best be confusing for COFA migrants and at worst cause
individuals to be uninsured and possibly forgo needed health care.” These prognostications
turned out to be true.
An important take-away of this study for policy makers is that moving poorer people
from Medicaid programs to private insurance obtained from exchanges, even when private
premiums are still supported by public funds, may result in lower utilization on net. This could
happen due to four reasons. First, the relative complexity of the exchanges could result in lower
take-up rates of private insurance thereby leaving many without insurance. Second, the vast
majority of private insurance plans entail more out-of-pocket expenses than Medicaid which
typically has little or no out-of-pocket expense. Third, communicating these changes and options
is not a trivial undertaking. For vulnerable populations with limited English ability and
familiarity with government agencies, this may prove to be a larger hurdle than for the native-
born populations. Fourth and perhaps most importantly, private insurers have a six week open
enrollment period, whereas Medicaid has a year-round open enrollment period. In addition,
COFA migrants must first apply for Medicaid and get rejected before they can enroll in private
insurance (Hofschneider 2019). For these reasons, we would expect a transition from Medicaid
to private insurance to reduce medical demand and/or utilization.
While this study focuses on a very unique policy change affecting a relatively small
population, it can provide lessons to other policy makers. In particular, we have shown the
difficulties of using private insurance obtained through exchanges to provide coverage to
vulnerable migrant populations with low levels of education and English proficiency. Note that
these difficulties persisted despite premiums that were subsidized by public funds. Medicaid
appears to provide clarity and certainty that private insurers may not have been able to provide.

21
On the whole, we suspect that a relatively simpler single payer public insurance scheme would
be better suited for vulnerable populations. However, if policy makers are insistent on using
private insurers to cover vulnerable migrant populations supported by public funds, better
communications and outreach are needed. This study provides some lessons on how to proceed.
22
References
Akee, R. (2010). Who leaves? Deciphering immigrant self-selection from a developing country. Economic Development and Cultural Change, 58(2), 323-344. Aron-Dine, A., Liran Einav, and Amy Finkelstein. 2013. “The RAND Health Insurance Experiment, Three Decades Later.” Journal of Economic Perspectives Volume 27, Number 1 Winter: 197–222. Baicker, K., Congdon, W. J., and Mullainathan, S. (2012). Health insurance coverage and take‐up: Lessons from behavioral economics. The Milbank Quarterly, 90(1), 107-134.
Card, D., Dobkin, C., and Maestas, N. (2008). The impact of nearly universal insurance coverage on health care utilization: evidence from Medicare. American Economic Review, 98(5), 2242-58.
Cohen RA, Zammitti EP, Martinez ME. Health insurance coverage: Early release of estimates from the National Health Interview Survey, 2016. National Center for Health Statistics. May 2017. Available from: https://www.cdc.gov/nchs/nhis/ releases.htm.
Cutler, D. M. and Zeckhauser, R. J. (2000). The anatomy of health insurance. In Handbook of health economics (Vol. 1, pp. 563-643). Elsevier.
Deaton, A. (1997). The analysis of household surveys: a microeconometric approach to development policy. The World Bank.
DeLeire, T. (2019). The Effect of Disenrollment from Medicaid on Employment, Insurance Coverage, and Health and Health Care Utilization☆. In Health and Labor Markets (pp. 155-194).
Fernandez, L., Shattuck, R., and Noon, J. (2018). The Use of Administrative Records and the American Community Survey to Study the Characteristics of Undercounted Young Children in the 2010 Census (No. 2018-05). Center for Economic Studies, US Census Bureau.
Finkelstein, Amy, Sarah Taubman, Bill Wright, Mira Bernstein, Jonathan Gruber, Joseph P. Newhouse, Heidi Allen, Katherine Baicker, and the Oregon Health Study Group. 2012. “The Oregon Health Insurance Experiment: Evidence from the First Year.” Quarterly Journal of Economics 127(3): 1057–1106.
Frean, M., Gruber, J., and Sommers, B. D. (2017). Premium subsidies, the mandate, and Medicaid expansion: Coverage effects of the Affordable Care Act. Journal of Health Economics, 53, 72-86.
Hagiwara, M. K. I., Yamada, S., Tanaka, W., and Ostrowski, D. M. (2015). Litigation and community advocacy to ensure health access for Micronesian migrants in Hawaii. Journal of health care for the poor and underserved, 26(2), 137-145.
23
Hawaii Department of Human Services (DHS). (2009). DHS Moving Non-Citizen Adults into new Medical Assistance Program, ‘Basic Health Hawaii’ on September 1. Hawaii Department of Human Services. News Release. July 28, 2009.
Hawaii Department of Human Services. COFA Residents and Health Care Assistance in Hawaii. November 2014. Available from: https://humanservices.hawaii.gov/wp-content/uploads/2014/11/COFA-Background-Memo.pdf
Hofschneider, Anita (2019, April 3). Micronesians in Hawaii Still Struggle to Get Care. Honolulu Civil Beat.
Leamer, E. E. (1978). Specification searches: Ad hoc inference with nonexperimental data (Vol. 53). John Wiley & Sons Incorporated. Manning, Willard G., Joseph P. Newhouse, Naihua Duan, Emmett B. Keeler, Arleen Leibowitz, and M. Susan Marquis. 1987. “Health Insurance and the Demand for Medical Care: Evidence from a Randomized Experiment.” American Economic Review 77(3): 251–77.
McElfish, P.A., Hallgren, E. and Yamada, S., 2015. Effect of US health policies on health care access for Marshallese migrants. American journal of public health, 105(4), pp.637-643. Joseph P. Newhouse, Rand Corporation. Insurance Experiment Group, & Insurance Experiment Group Staff. (1993). Free for all? Lessons from the RAND health insurance experiment. Harvard University Press. Pauly, M. V. (1968). The economics of moral hazard: comment. The American Economic Review, 531-537. Princeton University. Hawaii’s COFA Islanders: Improving Health Access and Outcomes. A report for the Governor of Hawaii, David Ige. January 2017. Available from wws.princeton.edu/sites/.../WWS%20591e%20ACA%20Final%20Report%202017.pdf Rilkon S, Alik W, Hixon A, and Palafox N. (2010). The “Compact Impact” in Hawaii: Focus on health care. Hawaii Medical Journal, 69 (6); 7-12. Rosewicz, B. Over Long Term, Revenue Lags Behind Expenses in 10 States. Pew Charitable Trust. November 2018. Schwarz, G. (1978). Estimating the dimension of a model. The annals of statistics, 6(2), 461-464. Shigeoka, Hitoshi. 2014. The Effect of Patient Cost Sharing on Utilization, Health, and Risk Protection. American Economic Review 104:7, 2152-2184.
Tarazi, W. W., Green, T. L., & Sabik, L. M. (2017). Medicaid disenrollment and disparities in access to care: evidence from Tennessee. Health services research, 52(3), 1156-1167.
24
Tello-Trillo, D. S. (2016). Effects of Losing Public Health Insurance on Healthcare Access, Utilization and Health Outcomes: Evidence from the TennCare Disenrollment. mimeo.
United States Census Bureau (2018). 2018 Estimates of Compact of Free Association (COFA) Migrants.

25
Appendix A: Discussion of Weighting Procedure We let 𝑃𝑃𝑖𝑖 ∈ {0,1} denote an indicator for being present in the HHIC data where unity indicates
presence. First, note that we can write
𝐸𝐸[𝑦𝑦𝑖𝑖𝑖𝑖|𝐽𝐽𝐶𝐶𝑃𝑃𝑃𝑃𝑖𝑖 = 𝑝𝑝,𝐶𝐶𝐶𝐶𝐶𝐶𝐶𝐶𝑖𝑖 = 𝑑𝑑, 𝑃𝑃𝑖𝑖 = 1] =𝐸𝐸[𝑦𝑦𝑖𝑖𝑖𝑖 × 1(𝐽𝐽𝐶𝐶𝑃𝑃𝑃𝑃𝑖𝑖 = 𝑝𝑝,𝐶𝐶𝐶𝐶𝐶𝐶𝐶𝐶𝑖𝑖 = 𝑑𝑑, 𝑃𝑃𝑖𝑖 = 1)]
𝑝𝑝(𝐽𝐽𝐶𝐶𝑃𝑃𝑃𝑃𝑖𝑖 = 𝑝𝑝,𝐶𝐶𝐶𝐶𝐶𝐶𝐶𝐶𝑖𝑖 = 𝑑𝑑, 𝑃𝑃𝑖𝑖 = 1)
for 𝑝𝑝,𝑑𝑑 ∈ {0,1}. Next, we note that
𝐸𝐸[𝑦𝑦𝑖𝑖𝑖𝑖 × 1(𝐽𝐽𝐶𝐶𝑃𝑃𝑃𝑃𝑖𝑖 = 𝑝𝑝,𝐶𝐶𝐶𝐶𝐶𝐶𝐶𝐶𝑖𝑖 = 𝑑𝑑, 𝑃𝑃𝑖𝑖 = 1)]
= 𝐸𝐸[𝑦𝑦𝑖𝑖𝑖𝑖 × 1(𝐽𝐽𝐶𝐶𝑃𝑃𝑃𝑃𝑖𝑖 = 𝑝𝑝,𝐶𝐶𝐶𝐶𝐶𝐶𝐶𝐶𝑖𝑖 = 𝑑𝑑)].
(1a)
This is true because 𝑃𝑃𝑖𝑖 = 0 implies that 𝑦𝑦𝑖𝑖𝑖𝑖 = 0. Accordingly, we obtain that
𝑝𝑝(𝐽𝐽𝐶𝐶𝑃𝑃𝑃𝑃𝑖𝑖 = 𝑝𝑝,𝐶𝐶𝐶𝐶𝐶𝐶𝐶𝐶𝑖𝑖 = 𝑑𝑑, 𝑃𝑃𝑖𝑖 = 1)
𝑝𝑝(𝐽𝐽𝐶𝐶𝑃𝑃𝑃𝑃𝑖𝑖 = 𝑝𝑝,𝐶𝐶𝐶𝐶𝐶𝐶𝐶𝐶𝑖𝑖 = 𝑑𝑑)𝐸𝐸[𝑦𝑦𝑖𝑖𝑖𝑖|𝐽𝐽𝐶𝐶𝑃𝑃𝑃𝑃𝑖𝑖 = 𝑝𝑝,𝐶𝐶𝐶𝐶𝐶𝐶𝐶𝐶𝑖𝑖 = 𝑑𝑑, 𝑃𝑃𝑖𝑖 = 1]
= 𝐸𝐸[𝑦𝑦𝑖𝑖𝑖𝑖|𝐽𝐽𝐶𝐶𝑃𝑃𝑃𝑃𝑖𝑖 = 𝑝𝑝,𝐶𝐶𝐶𝐶𝐶𝐶𝐶𝐶𝑖𝑖 = 𝑑𝑑]
(1b)
This then implies that
𝐸𝐸[𝑦𝑦𝑖𝑖𝑖𝑖|𝐽𝐽𝐶𝐶𝑃𝑃𝑃𝑃𝑖𝑖 = 𝑝𝑝,𝐶𝐶𝐶𝐶𝐶𝐶𝐶𝐶𝑖𝑖 = 𝑑𝑑] =𝐸𝐸[𝑦𝑦𝑖𝑖𝑖𝑖 × 1(𝐽𝐽𝐶𝐶𝑃𝑃𝑃𝑃𝑖𝑖 = 𝑝𝑝,𝐶𝐶𝐶𝐶𝐶𝐶𝐶𝐶𝑖𝑖 = 𝑑𝑑, 𝑃𝑃𝑖𝑖 = 1)]
𝑝𝑝(𝐽𝐽𝐶𝐶𝑃𝑃𝑃𝑃𝑖𝑖 = 𝑝𝑝,𝐶𝐶𝐶𝐶𝐶𝐶𝐶𝐶𝑖𝑖 = 𝑑𝑑) .
This is interesting because it suggests that the expectation on the left-hand side of the above
equation can be estimated as
�𝑦𝑦𝑖𝑖𝑖𝑖𝜑𝜑𝑖𝑖
𝑁𝑁
𝑖𝑖=1
where 𝜑𝜑𝑖𝑖 = 𝐷𝐷𝑖𝑖∑ 𝐷𝐷𝑖𝑖𝑁𝑁𝑖𝑖=1
and 𝑓𝑓𝑖𝑖 is the frequency weight associated with the 𝑖𝑖th observation. Note that 𝑁𝑁
corresponds to the sample size in the HHIC data with the added dummy observations discussed
in Section 3. The frequencies are equal to unity if the observation in in the HHIC data. For the
dummy observations, they are equal to the difference between the counts from the ACS and the
HHIC sample for a given ethnicity/age/gender cell. An important feature of the weights in 𝜑𝜑𝑖𝑖 is
26
that they exactly correspond to what standard statistical packages such as STATA compute when
you employ frequency weights.
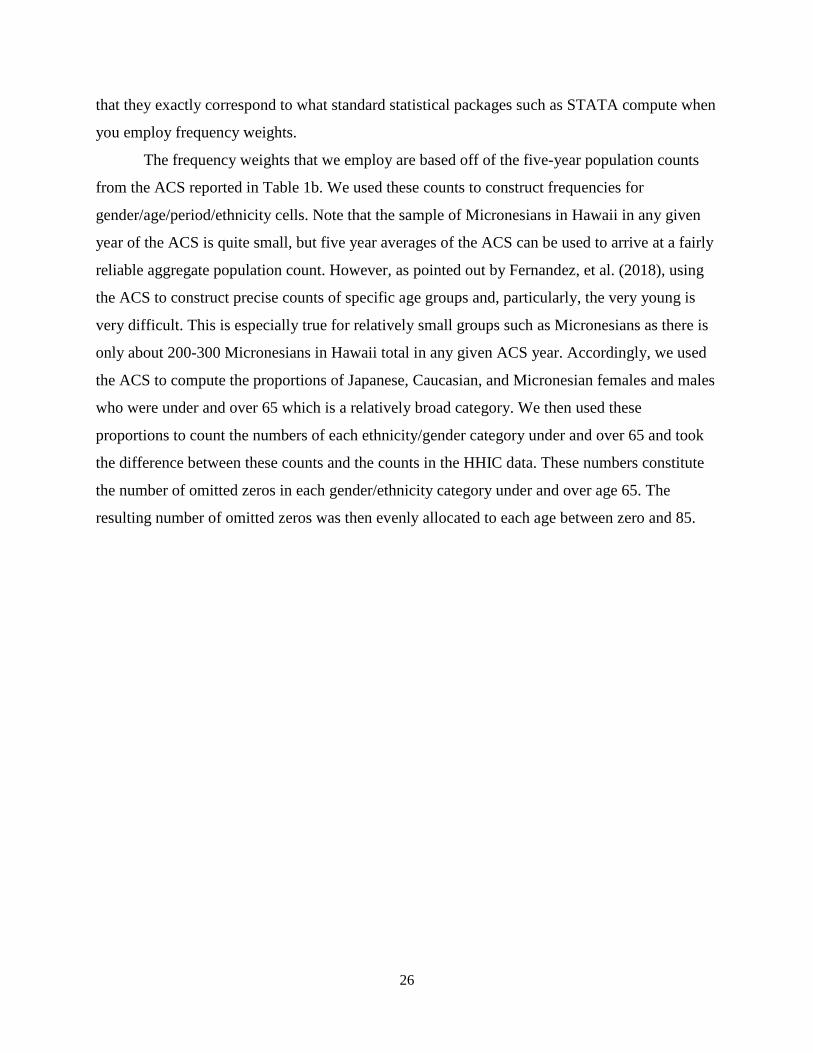
The frequency weights that we employ are based off of the five-year population counts
from the ACS reported in Table 1b. We used these counts to construct frequencies for
gender/age/period/ethnicity cells. Note that the sample of Micronesians in Hawaii in any given
year of the ACS is quite small, but five year averages of the ACS can be used to arrive at a fairly
reliable aggregate population count. However, as pointed out by Fernandez, et al. (2018), using
the ACS to construct precise counts of specific age groups and, particularly, the very young is
very difficult. This is especially true for relatively small groups such as Micronesians as there is
only about 200-300 Micronesians in Hawaii total in any given ACS year. Accordingly, we used
the ACS to compute the proportions of Japanese, Caucasian, and Micronesian females and males
who were under and over 65 which is a relatively broad category. We then used these
proportions to count the numbers of each ethnicity/gender category under and over 65 and took
the difference between these counts and the counts in the HHIC data. These numbers constitute
the number of omitted zeros in each gender/ethnicity category under and over age 65. The
resulting number of omitted zeros was then evenly allocated to each age between zero and 85.
27
Table 1a: Descriptive Statistics for the Raw Data
Counts [Percentage]
Race Japanese 115,456
[28.2%] Micronesian 25,621
[6.3%] White 268,479
[65.6%] Gender Male 199,758
[48.8%] Female 209,796
[51.2%] Unknown 2
[0.0%] Payer Type Department of Defense 19,132
[4.7%] Medicaid/Quest 114,711
[28.0%] Medicare 115,907
[28.3%] Miscellaneous 9,886
[2.4%] Private Insurance 132,601
[32.4%] Self-pay 17,319
[4.2%] Notes: These are tabulations from the raw discharge data that we used to construct the final panel. The raw data consisted of 409,556 utilizations.
28
Table 1b: Population Counts in the HHIC and ACS Data
Self-reported ethnic group
HHIC ACS HHIC/ACS
Micronesian* 11,530 27,890 41% Japanese 63,160 310,595 20% White/Caucasian 131,327 604,474 22% Notes: We used the American Community Survey over the years 2011-2015 to compute the population numbers for a given year. The counts from the ACS account for people reporting multiple races. *Excludes Guamanian/Chamorro.
29
Table 1c: Descriptive Statistics from Panel Data Any Payer Medicaid Private Uninsured
All Inpt. Admissions 0.0042 0.0009 0.0013 0.0001 (0.0683) (0.0309) (0.0379) (0.0082) ER Visits 0.0135 0.0041 0.0045 0.0007 (0.1384) (0.0817) (0.0733) (0.0291) Total Charges 176.49 33.52 47.49 2.89 (4031.76) (1801.90) (2006.50) (309.40) Inpt. Charges 144.72 25.24 37.05 1.39 (3988.75) (1776.91) (1985.40) (293.75) ER Charges 31.77 8.27 10.44 1.50 (411.19) (212.29) (217.68) (88.58)
Under 65 years Inpt. Admissions 0.0032 0.0011 0.0016 0.0001 (0.0593) (0.0347) (0.0415) (0.0090) ER Visits 0.0138 0.0053 0.0055 0.0009 (0.1405) (0.0924) (0.0813) (0.0327) Total Charges 121.57 41.44 54.67 3.47 (3312.89) (1987.08) (2124.47) (325.93) Inpt. Charges 91.54 30.87 42.02 1.59 (3268.94) (1958.57) (2101.00) (307.56) ER Charges 30.03 10.58 12.66 1.88 (394.14) (239.41) (238.60) (98.55)
65 years and older Inpt. Admissions 0.0076 0.0001 0.0005 0.00002 (0.0916) (0.0120) (0.0227) (0.0045) ER Visits (0.0126) 0.0003 0.0011 0.00009 (0.1313) (0.0235) (0.0369) (0.0107) Total Charges 354.85 7.78 24.10 1.04 (5775.93) (983.43) (1562.84) (248.22) Inpt. Charges 317.45 6.98 20.88 0.76 (5730.47) (976.22) (1551.54) (243.54) ER Charges 37.41 0.80 3.22 0.28 (462.20) (72.20) (127.78) (42.18) Notes: Reports means and standard deviations in parentheses. All statistics are on a per patient/month basis. Dummy observations and frequency weights were used to account for missing zeros.
30
Table 1d: Descriptive Statistics from Panel Data: COFA Migrants in Pre-Treatment Period Any Payer Medicaid Private Uninsured
All ages Inpt. Admissions 0.0078 0.0065 0.0007 0.0004 (0.0911) (0.0832) (0.0263) (0.0214) ER Visits 0.0322 0.0238 0.0032 0.0044 (0.1951) (0.1685) (0.0611) (0.0709) Total Charges 289.53 234.20 24.32 19.80 (5331.60) (5049.59) (1217.50) (747.49) Inpt. Charges 226.52 190.21 17.01 10.33 (5288.16) (5016.88) (1196.77) (709.84) ER Charges 63.00 43.99 7.31 9.47 (513.95) (412.45) (184.75) (215.07)
Under 65 years Inpt. Admissions 0.0075 0.0062 0.0007 0.0005 (0.0891) (0.0813) (0.0266) (0.0216) ER Visits 0.0327 0.0240 0.0034 0.0046 (0.1964) (0.1694) (0.0621) (0.0722) Total Charges 263.94 210.86 24.31 19.89 (5058.00) (4772.63) (1222.47) (735.92) Inpt. Charges 201.75 167.84 16.90 10.16 (5014.98) (4740.65) (1203.42) (696.53) ER Charges 62.18 43.02 7.41 9.73 (502.49) (400.35) (179.24) (217.52)
65 years and older Inpt. Admissions 0.0135 0.0114 0.0005 0.0004 (0.1221) (0.1126) (0.0212) (0.0188) ER Visits 0.0238 0.0189 0.0012 0.0016 (0.1683) (0.1504) (0.0400) (0.0407) Total Charges 748.62 652.90 24.52 18.27 (8899.61) (8609.29) (1124.56) (930.93) Inpt. Charges 670.93 591.61 19.02 13.38 (8846.12) (8564.88) (1070.62) (916.27) ER Charges 77.69 61.29 5.49 4.90 (687.68) (588.55) (264.83) (164.97) Notes: Reports means and standard deviations in parentheses. All descriptive statistics correspond to the period prior to March 1, 2015. All statistics are on a per patient/month basis. Dummy observations and frequency weights were used to account for missing zeros.

31
Table 2: Leamer-Schwarz Critical Values
Ages 18 – 64 < 18 65+ d.o.f All Males Females All All 1 13.01437 11.15611 11.11086 11.82689 11.80753 2 26.02873 22.31222 22.22173 23.65378 23.61507 3 39.0431 33.46832 33.33259 35.48067 35.4226 Notes: For details, see p. 130-131 of Deaton (1997). These critical values were constructed use the 2011-2015 ACS.

32
Table 3: Fixed Effects DD Estimates: Ages 18 - 64
Inpatient Admissions ER Visits Panel A Payer Any Medicaid Private Any Medicaid Private COFA x -0.0006 -0.0029 0.0019 -0.0045 -0.0139 0.0064 Post (0.0003) (0.0003) (0.0002) (0.0007) (0.0010) (0.0006) Mean 0.0190 0.0151 0.0021 0.0724 0.0445 0.0124 Pre-Trend 0.7488 0.1491 1.3107 1.0232 4.8040 1.2195 [0.4729] [0.8615] [0.2696] [0.3595] [0.0082] [0.2954] Placebo 0.7096 0.2744 0.0969 7.3874 4.2779 2.9936 [0.5461] [0.8439] [0.9618] [0.0001] [0.0050] [0.0296] DiD 3.7588 77.3539++ 80.2275++ 37.1284++ 178.1942++ 120.8315++
[0.0525] [0.0000] [0.0000] [0.0000] [0.0000] [0.0000] Inpatient Charges ER Charges Panel B Payer Any Medicaid Private Any Medicaid Private COFA x -17.9929 -105.6608 65.6702 -9.0688 -32.7700 16.2033 Post (19.4605) (17.3662) (10.6646) (2.1785) (2.5457) (1.6989) Mean 596.1473 470.1159 63.2815 170.1833 104.0121 28.0643 Pre-Trend 0.4600 1.6981 0.8603 0.2732 4.5517 0.2642 [0.6313] [0.1830] [0.4230] [0.7609] [0.0106] [0.7679] Placebo 1.2044 0.0684 1.6228 4.8170 5.4879 0.6982 [0.3064] [0.9767] [0.1817] [0.0024] [0.0009] [0.5530] DiD 0.8549 37.0185++ 37.9183++ 17.3290++ 165.7059++ 90.9655++
[0.3552] [0.0000] [0.0000] [0.0000] [0.0000] [0.0000] ++ Denotes an F-statistic that exceeds the Leamer-Schwarz critical values (L-S CV) from Table 2. Notes: All estimations use 119,733 individuals (including the dummy observations) observed over a maximum of 24 months and include individual and time fixed effects; a quadratic function of age; and a complete set of interactions between dummies for Mar-Dec 15, Dec 14 – Jan 15, and Sep – Nov 14 with COFA and Japanese dummies. Standard errors adjust for clustering on individuals. The means corresponds to the COFA population before Mar 15. The tests for pre-trends and placebo effects are the F-tests described in Section IV. The DiD test is an F-test of the null COFA X Post is zero. p-values are reported in brackets.
33
Table 4: Fixed Effects DD Estimates: Over 65
Inpatient Admissions ER Visits Panel A Payer Any Medicaid Private Any Medicaid Private COFA x -0.0003 -0.0008 0.0004 -0.0010 0.0000 0.0006 Post (0.0017) (0.0015) (0.0003) (0.0027) (0.0025) (0.0003) Mean 0.0391 0.0331 0.0013 0.0688 0.0547 0.0035 Pre-Trend 0.3800 0.7447 0.7810 0.0712 0.1282 0.6638 [0.6839] [0.4749] [0.4579] [0.9312] [0.8797] [0.5149] Placebo 2.5847 1.2874 2.1991 1.4405 0.0962 4.3785 [0.0514] [0.2767] [0.0859] [0.2288] [0.9622] [0.0044] DiD 0.0384 0.2471 2.4781 0.1489 0.0002 2.6627 [0.8447] [0.6191] [0.1154] [0.6996] [0.9896] [0.1027] Inpatient Charges ER Charges Panel B Payer Any Medicaid Private Any Medicaid Private COFA x -20.6567 -55.5405 5.2626 -4.4402 3.2437 -1.0599 Post (108.1417) (102.4201) (12.4262) (10.9004) (9.8922) (2.7382) Mean 1939.5305 1710.2303 55.0048 224.6006 177.1863 15.8789 Pre-Trend 1.4053 0.9825 0.8840 0.4831 0.4169 1.0499 [0.2453] [0.3744] [0.4132] [0.6169] [0.6591] [0.3500] Placebo 1.4518 0.4839 1.8002 2.3795 0.5827 2.9793 [0.2256] [0.6934] [0.1447] [0.0676] [0.6263] [0.0301] DiD 0.0365 0.2941 0.1794 0.1659 0.1075 0.1498 [0.8485] [0.5876] [0.6719] [0.6838] [0.7430] [0.6987] ++ Denotes an F-statistic that exceeds the Leamer-Schwarz critical values (L-S CV) from Table 2. Notes: All estimations use 54,397 individuals (including the dummy observations). All other notes per Table 3.

34
Table 5: Fixed Effects DD Estimates: Utilization by the Uninsured
Ages 18-64 Over 65 Inpatient ER Inpatient ER COFA x 0.0003 0.0035 -0.0002 -0.0011 Post (0.0001) (0.0004) (0.0003) (0.0005) Mean 0.0013 0.0126 0.0010 0.0045 Pre-Trend 5.5432 14.3896 3.1792 0.7310 [0.0039] [0.0000] [0.0416] [0.4814] Placebo 6.1484 15.3646 0.2975 1.2680 [0.0004] [0.0000] [0.8273] [0.2834] DiD 13.2243++ 83.3567++ 0.3722 4.5864 [0.0003] [0.0000] [0.5418] [0.0322] ++ Denotes an F-statistic that exceeds the Leamer-Schwarz critical values (L-S CV) from Table 2. Notes: All outcomes are counts of admissions per patient/month charged to the individual. All other notes are per Table 3.

35
Table 6: Fixed Effects DD Estimates: Effects on Children (Ages 1-17) and Infants
Inpatient Admissions ER Visits Inpatient Charges ER Charges COFA x -0.0089 -0.0014 -0.0067 -0.0045 -142.3976 -19.1973 -8.8337 -3.8252 Post (0.0011) (0.0003) (0.0013) (0.0012) (31.9292) (16.2368) (2.1231) (1.9784) COFA x -0.1242 0.0552 -1798.0105 63.4868 Post X (0.0161) (0.0108) (446.4086) (18.0931) Infant Means Ages 0-18 0.0157 0.0808 326.7330 108.6253 Ages 1-17 0.0042 0.0733 123.5802 96.9402 Infants 0.0791 0.1222 1446.6331 173.0406 DiD Ages 0-18 71.3588++ 25.6885++ 19.8897++ 17.3125 [0.0000] 0.0000 [0.0000] 0.0000 Ages 1-17 19.1256++ 13.0516++ 1.3979 3.7384 [0.0000] [0.0003] [0.2371] [0.0532] Infants 60.0226++ 22.3553++ 16.4239++ 10.9724 [0.0000] [0.0000] [0.0001] [0.0009] ++ Denotes an F-statistic that exceeds the Leamer-Schwarz critical values (L-S CV) from Table 2. Notes: All outcomes were reimbursed by Medicaid. All specifications correspond to those from Table 2 except that the specification in the odd columns includes a triple interaction between COFA, post, and infant (as well as all the other associated interactions). We report the COFA/post/infant and the COFA/post interactions in the odd columns. All other notes are per Table 3. To economize on space, we do not report specification tests but we do report them in Table A4.
36
Table A1: Fixed Effects DD Estimates: Ages 18-64 (Alternative Weights)
Inpatient Admissions ER Visits Panel A Payer Any Medicaid Private Any Medicaid Private COFA x -0.0006 -0.0025 0.001 -0.0040 -0.0121 0.0056 Post (0.0003) (0.0003) (0.0002) (0.0007) (0.0010) (0.0005) Mean 0.0190 0.0151 0.0021 0.0724 0.0445 0.0124 Pre-Trend 0.7713 0.1321 1.3102 1.1780 4.6055 1.3340 [0.4624] [0.8762] [0.2698] [0.3079] [0.0100] [0.2634] Placebo 0.7098 0.2754 0.0974 7.3888 4.2839 2.9979 [0.5460] [0.8432] [0.9615] [0.0001] [0.0050] [0.0294] DiD 4.0765 74.0300++ 75.6931++ 37.2846++ 160.6328++ 112.4160++
[0.0435] [0.0000] [0.0000] [0.0000] [0.0000] [0.0000] Inpatient Charges ER Charges Panel B Payer Any Medicaid Private Any Medicaid Private COFA x -17.1461 -92.0114 56.4979 -8.4763 -28.6748 13.9160 Post (16.9430) (15.2747) (9.4174) (1.9138) (2.3244) (1.5304) Mean 596.1473 470.1159 63.2815 170.1833 104.0121 28.0643 Pre-Trend 0.4772 1.6967 0.9150 0.2270 4.3654 0.2667 [0.6205] [0.1833] [0.4005] [0.7969] [0.0127] [0.7659] Placebo 1.2045 0.0685 1.6232 4.8178 5.4955 0.6991 [0.3064] [0.9767] [0.1816] [0.0023] [0.0009] [0.5525] DiD 1.0241 36.2861++ 35.9914++ 19.6158++ 152.1830++ 82.6785++
[0.3115] [0.0000] [0.0000] [0.0000] [0.0000] [0.0000] ++ Denotes an F-statistic that exceeds the Leamer-Schwarz critical values (L-S CV) from Table 2. Notes: Per Table 3. Additionally, the results in this table employ alternative weights based off the 5-year ACS count of Micronesian in Hawaii plus its margin of error, which is 31,653.
37
Table A2: Fixed Effects DD Estimates: Ages 18-64, Admissions and Charges in Logs
Payer Medicaid Private Medicaid Private COFA x -0.0109 0.0054 -0.1172 0.0597 Post (0.0008) (0.0005) (0.0087) (0.0051) Mean 0.0392 0.0097 0.4334 0.1054 Pre-Trend 4.5164 1.1356 4.4182 1.0132 [0.0109] [0.3212] [0.0121] [0.3630] Placebo 3.3686 1.8441 2.3618 1.1091 [0.0177] [0.1367] [0.0692] [0.3439] DiD 181.5116++ 137.6429++ 180.1169++ 136.4986++
[0.0000] [0.0000] [0.0000] [0.0000] ++ Denotes an F-statistic that exceeds the Leamer-Schwarz critical values (L-S CV) from Table 2. Notes: Per Table 3.
38
Table A3: Fixed Effects DD Estimates by Gender: Ages 18-64
Inpatient Admissions ER Visits Panel A: Females Payer Any Medicaid Private Any Medicaid Private COFA x -0.0009 -0.0036 0.0025 -0.0054 -0.0176 0.0089 Post (0.0005) (0.0005) (0.0003) (0.0011) (0.0017) (0.0010) Mean 0.0190 0.0151 0.0021 0.0724 0.0445 0.0124 Pre-Trend 0.5692 0.0043 0.8515 0.2839 2.2704 0.9259 [0.5660] [0.9957] [0.4268] [0.7529] [0.1033] [0.3962] Placebo 0.5385 0.0495 0.2075 2.0092 3.2555 2.3844 [0.6559] [0.9854] [0.8913] [0.1103] [0.0207] [0.0672] DiD 2.7004 44.8785++ 52.3624++ 23.5485++ 107.5903++ 85.9938++
[0.1003] [0.0000] [0.0000] [0.0000] [0.0000] [0.0000] Inpatient Admissions ER Visits Panel B: Males Payer Any Medicaid Private Any Medicaid Private COFA x -0.0004 -0.0021 0.0013 -0.0036 -0.0097 0.0035 Post (0.0004) (0.0004) (0.0002) (0.0010) (0.0012) (0.0007) Mean 0.0190 0.0151 0.0021 0.0724 0.0445 0.0124 Pre-Trend 0.2259 0.5791 0.5453 0.7549 2.9059 0.7905 [0.7978] [0.5604] [0.5796] [0.4701] [0.0547] [0.4536] Placebo 0.3832 0.6447 0.3490 6.7923 3.5750 1.2153 [0.7651] [0.5862] [0.7899] [0.0001] [0.0133] [0.3023] DiD 0.9014 33.9713++ 28.6195++ 13.5057++ 69.5309++ 29.3339++
[0.3424] [0.0000] [0.0000] [0.0002] [0.0000] [0.0000] ++ Denotes an F-statistic that exceeds the Leamer-Schwarz critical values (L-S CV) from Table 2. Notes: All estimations use 63,017 females and 56,716 males (including the dummy observations). All other notes per Table 3.

39
Table A4: Specification Tests from Children’s Estimations
Inpatient Admissions ER Visits Inpatient Charges ER Charges Pre-Trends Ages 0-17 11.0724
20.0813
3.1453
16.2097
[0.0000]
[0.0000]
[0.0431]
[0.0000]
Ages 1-17
2.0817
15.6136
0.5848
10.7813 [0.1247]
[0.0000]
[0.5572]
[0.0000]
Infants
6.5557
8.3530
2.9887
7.6903 [0.0014]
[0.0002]
[0.0504]
[0.0005]
Placebo Ages 0-17 1.4400
1.4516
1.6234
1.3037
[0.2289]
[0.2256]
[0.1816]
[0.2712]
Ages 1-17
0.6925
1.5714
0.2813
1.6284
[0.5565]
[0.1940]
[0.8389]
[0.1804]
Infants
3.3780
0.5439
0.7182
0.4467
[0.0175]
[0.6522]
[0.5410]
[0.7196]
DiD Ages 0-17 71.3588++
25.6885++
19.8897++
17.3125++
[0.0000]
[0.0000]
[0.0000]
[0.0000]
Ages 1-17
19.1256++
13.0516++
1.3979
3.7384
[0.0000]
[0.0003]
[0.2371]
[0.0532]
Infants
60.0226++
22.3553++
16.4239++
10.9724
[0.0000]
[0.0000]
[0.0001]
[0.0009]
++ Denotes an F-statistic that exceeds the Leamer-Schwarz critical values (L-S CV) from Table 2. Notes: Reports specification tests from the estimations in Table 7. For information on the specification tests, we refer the reader to Section 4 of the paper.
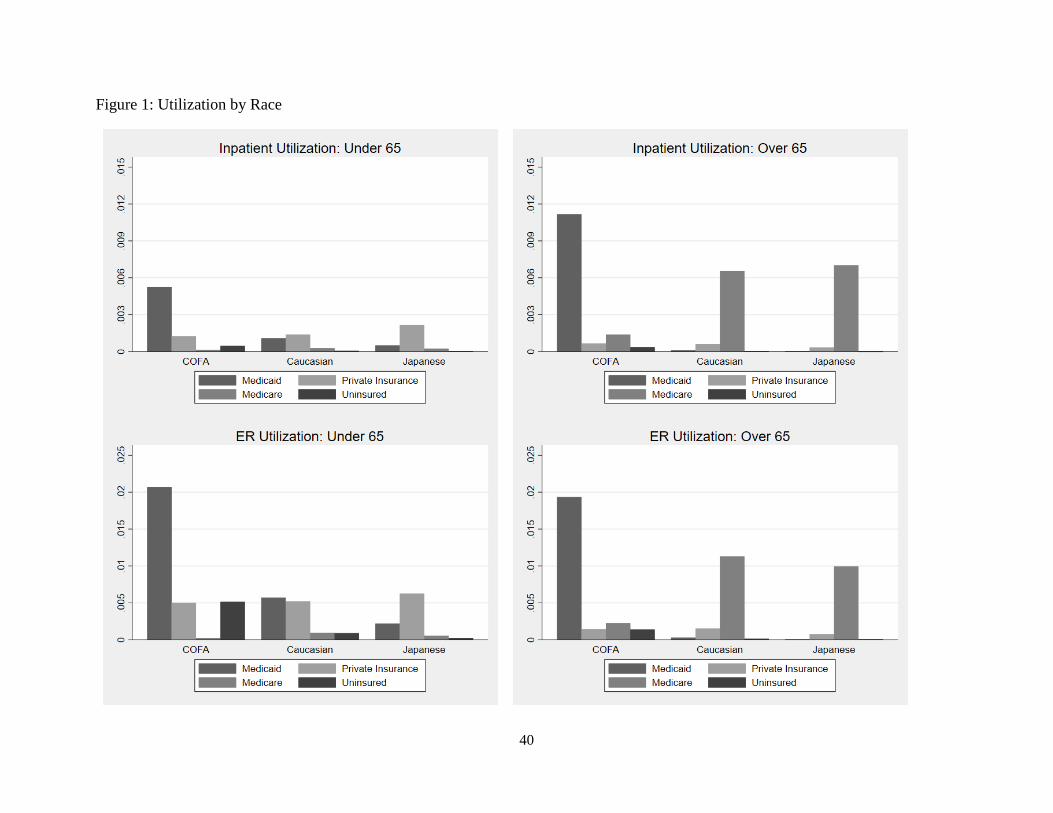
40
Figure 1: Utilization by Race

41
Figure 2: Event Analysis, Ages 18-65

42
Figure 3: Age Profiles of Treatment Effects