digital resource productivity
TRANSCRIPT

By Brandon Owens
DIGITAL RESOURCE
PRODUCTIVITYECOMAGINATION,
THE INDUSTRIAL INTERNET, AND THE GLOBAL
RESOURCE CHALLENGE

AUTHOR BIOGRAPHY
Brandon Owens, Strategy & Analytics Director, Ecomagination
Brandon Owens is an economist , energy analyst , researcher, and writer. His research has been pub-lished in industry-leading journals such as INFORMS, Public Utilities Fortnightly, Energy Policy, and Research Evaluation. A keynote speaker and expert witness, Mr. Owens has been cited in periodicals such as the New York Times and USA Today.
The author of GE’s 2014 whitepaper “The Rise of Distributed Power,” Mr. Owens is currently the director of ecomagination Strategy & Analytics at GE, where he helps guide the strategic direction of GE’s flagship corporate sustainability program. Prior to this role, he was the Manager of Strategy & Analytics within GE Energy’s Global Strategy & Planning group.
Prior to joining GE in 2007, Mr. Owens was Director of Research at Cambridge Energy Research Associates (IHS CERA). Earlier, he served as Senior Analyst for the National Renewable Energy Laboratory (NREL). Mr. Owens holds an MS in Mineral Economics from the Colorado School of Mines and a BA in Mathematics and Economics from the University of Colorado at Boulder.
DIGITAL RESOURCE PRODUCTIVITY

3
DIGITAL RESOURCE PRODUCTIVITY
CONTENTS
Executive Summary
I. Introduction II. The Global Natural Resource Challenge Natural Resources and Economic Growth The Vice Is Tightening The Resource Productivity Imperative
III. When Hardware Meets Software Ecomagination The Industrial Internet
IV. Powering the Future Lighting Aviation Power Rail Water Wind Oil and Gas Beyond the Power of 1%
V. Conclusion
4
9 10 12 12 15
19 19 20
27 27 29 29 30 30 31 33 33
35

4© 2014 General Electric Company. All rights reserved.This material may not be copied or distributed in whole or in part without prior permission of the copyright owner.
Ecomagination (www.ge.com/about-us/ecomagination) is GE’s commitment to developing technologies that reduce our consumption of natural resources, while cre-ating economic benefit for our customers. Established in 2005, GE’s ecomagination program has been at the forefront of resource productivity solutions for a dec- ade. Since its founding, the GE technologies and solu- tions in the ecomagination portfolio have generated $180 billion in revenue. GE has maintained its commit- ment to efficient resource solutions by investing $15 billion in research and development over this period.
Ecomagination technologies are at the cutting edge of resource productivity. For example, consider GE’s GEnx aircraft engines, GE’s turbofan engine family
for select wide-body aircraft . GEnx engines use advanced GE propulsion technology to reduce fuel consumption, associated carbon dioxide (CO2) and oxides of nitrogen (NOx) emissions, noise, and oper-ating cost , compared to the engines they replace. In comparison with the previous model (GE’s CF6 engine), the GEnx engine reduces fuel consump-tion by more than 10 percent , which translates to a double-digit reduction in CO2.
As we enter the second decade of GE’s ecomagination strategy, the need for resource efficiency and envi-ronmentally sustainable solutions around the world has never been stronger. The fact is, a great global resource challenge is upon us. The demand for natural
EXECUTIVE SUMMARYEXECUTIVE SUMMARY

5
EXECUTIVE SUMMARY
resources is outstripping available supplies in many regions around the world. Regional resource imbal-ances are occurring for energy, water, food, and materials. These imbalances are driving up com-modity prices and creating resource stresses that have social, political, and economic implications.
A global resource challenge is upon us. In the absence of resource productivity improvements, both materials extraction and energy con-sumption will increase by 80 percent by 2030.
The global resource challenge is poised to become even greater in the years ahead. Expected increases in gross domestic product (GDP) and population levels over the next 15 years will translate into even stronger levels of resource demand. Our analysis indicates that in the absence of additional improvements in the intensity of resource use per dollar of GDP, both materials extraction and energy consumption will increase by 80 percent by 2030. Further, accord-ing to the Organization for Economic Co-operation and Development (OECD), without additional water conservation and productivity improvements, the number of people living under water stress will grow from 1 billion today to 3.9 billion in 2050.1
Additional solutions are needed to hold resource demand in check without risking human or eco-nomic development . Enter the Industrial Internet (www.gesoftware.com/industrial-internet). By combining remote sensors, communications technologies, and cloud-based computing with industrial machinery, the Industrial Internet opens new avenues for increasing the productivity of the global industrial complex. The integration of industrial hardware with Internet-based software
enables more efficient management and use of human, capital, and natural resources within indus-trial machines, fleets, facilities, and networks. The Industrial Internet enables resources to be opti-mized across the entire industrial system.
The integration of efficient hardware with Internet- enabled software is the new frontier in natural resource productivity. We call this Digital Resource Productivity.
The combination of ecomagination solutions with the Industrial Internet has the potential to play a key role in solving the global resource chal-lenge. The integration of efficient hardware with Internet-enabled software is the new frontier of natural resource productivity. This approach pro-vides an avenue to achieve resource productivity improvements above and beyond those that can be achieved through hardware advances alone. We call this Digital Resource Productivity, and we believe that productivity improvements can be doubled over the next 15 years by integrating software and hardware to optimize resource use.
Resource productivity improvements of this mag-nitude would have major implications for global industrial energy consumption. Over the last decade, through advances in the efficiency of hardware, energy productivity improved at a rate of 1 percent per year. If this same rate were to persist through 2030 as expected, global industrial energy con-sumption will grow from 270 quadrillion Btu (quads) in 2013 to 416 quads in 2030. However, if the rate of energy productivity improvement is doubled to 2 percent per year through the combination of efficient hardware and Internet-enabled software,
© 2014 General Electric Company. All rights reserved.This material may not be copied or distributed in whole or in part without prior permission of the copyright owner.

6
then global industrial energy consumption will be held to 346 quads by 2030. That represents a reduction of 70 quads, which is equivalent to roughly 12 billion barrels of oil—or just over a third of the world’s annual oil consumption.
The important role that software can play in address-ing the global resource challenge is widely recog-nized by corporate leaders, and some are taking action in response. A 2014 survey of 254 corporate executives sponsored by GE and Accenture provides some insight . When asked about their top strate-gies related to big data and analytics over the next one to three years, 60 percent identified resource management as a top priority. More respondents identified resource management as a top strategy than any other category. Furthermore, 55 percent of corporate executives indicated that improving safety and environmental emissions was a top strategy. The importance of resource management and environ-mental stewardship is not only top of mind for many executives, it has become a strategic imperative in the context of big data and analytics initiatives.2
Digital Resource Productivity is not just a vision of the future—it is here today. Industrial Internet solutions developed by GE are already at work improv-ing resource productivity for our customers.
Digital Resource Productivity is not just a vision of the future—it is here today. Industrial Internet solu-tions developed by GE are already at work improving resource productivity for our customers. Since 2012, GE has released 40 Industrial Internet solutions with many more on the horizon. All of them are part of the Predictivity™ suite of solutions, which is now included in the ecomagination portfolio.
Consider GE’s PowerUp solution, which is available for wind turbine models across GE’s installed base and is part of GE’s ecomagination Brilliant Wind™ turbine platform. PowerUp harnesses the Industrial Internet to drive higher power output and create new revenue streams for wind farm operators. PowerUp analyzes tens of thousands of data points in a wind farm every second in order to fine-tune performance and increase output . PowerUp is already at work in the field, improving wind turbine performance. For example, since European utility E.ON’s 469 wind turbines enrolled in PowerUp, power output has increased by 4.1 percent , the equivalent of adding 19 additional GE wind turbines.
Ecomagination is GE’s commitment to creating technologies that maximize resource efficiency, economics, and environmental performance. Since its founding in 2005, the GE technologies and solutions in the ecomagination portfolio have generated $180 billion in revenue. GE has maintained its commitment to efficient resource solutions by investing $15 billion in research and development over this period.
The Industrial Internet is the integration of complex physical machinery with networked sensors and software. The Industrial Internet draws together fields such as machine learn-ing, big data, the Internet of Things (IoT), and machine-to-machine communication to ingest data from machines, analyze it (often in real time), and use it to optimize operations.
Digital Resource Productivity is the combina-tion of ecomagination solutions with Industrial Internet software innovations. By enabling opti-mization to occur on an industrial scale, the integration of efficient hardware and advanced software offers a new approach to achieving accelerated resource productivity.
© 2014 General Electric Company. All rights reserved.This material may not be copied or distributed in whole or in part without prior permission of the copyright owner.
EXECUTIVE SUMMARY

Source: GE.
Figure 1. The power of two: when hardware meets software
Continued ecomagination hardware advances combined with Industrial Internet software have the potential to transform global resource use. When hardware meets software, barriers to resource productivity im-provement can be broken.
Accelerated Resource Productivity
• Industrial-scale resource savings• Fuel consumption reductions• Water conservation• Reduced emissions
Ecomagination Hardware
• Design improvements• Advanced materials• Integrated hardware approaches
Industrial Internet Software
• Big data analysis• Machine learning techniques• Predictive maintenance• Asset and system optimization
EXECUTIVE SUMMARY
© 2014 General Electric Company. All rights reserved.This material may not be copied or distributed in whole or in part without prior permission of the copyright owner.
8© 2014 General Electric Company. All rights reserved.This material may not be copied or distributed in whole or in part without prior permission of the copyright owner.
Also consider GE’s Flight Efficiency Services™, an Internet-enabled aviation navigation service that examines flight data to design more efficient flight patterns. The result is a reduction in both fuel consumption and flight miles. Brazilian air-line Gol Linhas Aéreas Inteligentes has employed Flight Efficiency Services and has already realized US$100 million in savings over five years. They have saved an average of 22 miles per flight and 77 gallons of jet fuel per flight , and have reduced CO2 emissions by 1,628 pounds per flight .
Another example is GE’s Movement Planner™, which is the railroad equivalent of an air-traffic control system. The Movement Planner is breakthrough technology enabling more locomotives to run on the same railroad track at faster speeds and with greater efficiency—without laying new track. In the United States, Norfolk Southern has implemented Movement Planner along its entire 20,000 route miles in its 22-state rail network. Deborah Butler, Norfolk Southern’s chief information officer, says her railroad has seen a 6.3 percent reduction in fuel usage and 10–20 percent increases in velocity by installing Movement Planner on its network.3 In general, better velocity also means better cap-ital utilization—when trips are faster, the railroad needs less capital equipment to operate them. This saves even more resources.
GE’s Water & Process InSight solution also holds great promise as a resource productivity tool. InSight provides a method to improve water pro-ductivity as well as reduce water consumption in wastewater, boiler water, and cooling water treatment applications. InSight is a knowledge management system that transforms vast amounts of operating data at industrial water facilities into meaningful and actionable information that enables operational optimization, data visualiza-tion, diagnostics, and reporting. By providing a centralized data management and operations
tool, InSight opens the door to a range of possi-bilities that lead to increased water productivity and reduced water consumption.
These examples represent a handful of hardware and software solutions within GE’s ecomagination portfolio. Whether it’s reduced jet fuel consump-tion, lower natural gas use, diesel fuel savings, reductions in water consumption, or increases in wind power—each of these solutions provides direct benefits that enhance resource productivity. And this is just a sampling, with many more inno-vations on the horizon. That’s the most exciting part—the journey has just begun. A new world of possibilities is being unlocked through the Industrial Internet . Software solutions commer-cially available and under development are just the tip of the iceberg. That’s why we believe that the integration of ecomagination hardware and software has the potential to double the future rate of resource productivity improvement .
At GE, we are excited about the opportunity to play a role in helping to confront the global resource challenge. Today we are embarking upon a new frontier of Digital Resource Productivity by expand-ing ecomagination to encompass GE’s Predictivity suite of solutions. Join us as we help transform the future of global resource productivity.
We are embarking upon a new frontier of Digital Resource Productivity by expanding ecomagination to encompass GE’s Predictivity™ suite of solu-tions. Join us as we help transform the future of global resource productivity.
EXECUTIVE SUMMARY

9
I. INTRODUCTION
I. INTRODUCTIONA great global resource challenge is upon us. The demand for natural resources is outstripping avail-able supplies in many regions around the world. Regional resource imbalances are occurring for energy, water, food, and materials. These imbal-ances are driving up commodity prices and cre-ating resource stresses that have social, political, and economic implications.
Since its inception in 2005, GE’s ecomagination has been part of the solution to global resource challenges. Ecomagination is GE’s commitment to developing technologies that make the most of the world’s valuable natural resources. GE’s ecomagination program has been at the forefront of resource productivity solutions for a decade. However, given the pace of rising resource demand, it is clear that additional—more revolutionary—solutions will be required to hold resource demand in check without risking human or economic development .
That’s where the Industrial Internet comes in. By combining remote sensors, communications tech-nologies, and cloud-based computing with industrial
machinery, the Industrial Internet opens new ave-nues for increasing the productivity of the global industrial complex. The integration of industrial hardware with Internet-based software enables more efficient management and use of human, capital, and natural resources within industrial machines, fleets, facilities, and networks. The Industrial Internet enables resources to be opti-mized across the entire industrial system.
The combination of ecomagination solutions with the Industrial Internet has the potential to play a key role in solving the global resource challenge. The integration of efficient hardware with Internet- enabled software is the new frontier of natural resource productivity. This approach provides an avenue to achieve resource productivity improve-ments above and beyond those that can be achieved through hardware advances alone. We call this Digital Resource Productivity.
© 2014 General Electric Company. All rights reserved.This material may not be copied or distributed in whole or in part without prior permission of the copyright owner.

10
The demand for natural resources is on the rise across the globe. This is not new—natural resources have always been a critical input to economic growth and rising living standards. However, the rate of growth in natural resource use has accel-erated since the turn of the twenty-first century. This rapid rise in demand has created challenges for all natural resources. The challenges are most acute for water and minerals.
This trend is evident when we examine data for a subset of all natural resources—materials and energy. Figure 2 shows the growth in the extraction of materials and consumption of energy. Materials consumption includes biomass, fossil energy car-riers, ores, and industrial minerals, as well as bulk minerals used for construction.4 Since 2000, mate-rials extraction has grown at an average annual rate of 3.4 percent rising from 49.7 gigatons (Gt) in 2000 to an estimated 70 Gt by 2010. The larg-est growth has come from construction minerals, which have risen from 17.5 Gt in 2000 to approx-imately 30 Gt in 2012.
Energy consumption has also grown since 2000. According to the United States Energy Information Administration (EIA), total primary energy con-sumption grew by 33 percent, from 398 quadrillion
Btu (quads) to 530 quads in 2012.5 Coal and natural gas consumption grew the most. Coal consumption rose 59 percent from 96 to 152 quads and natu-ral gas consumption rose from 90 to 125 quads.6 These increases are being driven by population growth and the industrialization of the developing world, which has accelerated since 2000.
At the global, regional, and local level, natural resource supplies have often struggled to keep pace with accelerated demand. The imbalance between supply and demand is evident when we examine global traded commodity prices. Real prices for all commodities have increased significantly since the turn of the century. The World Bank’s real price indices have risen for all commodities since 1998. Energy prices have increased fivefold, non-energy prices have risen 60 percent , and precious metal prices have grown 360 percent .7
Some natural resources, such as water, are not traded in formalized commodity markets and do not have transparent prices that reflect increasing scarcity. In order to gain insight into these resources, it is necessary to examine resource availability and stresses at the local level. In the case of water, like energy, it is clear that in many parts of the world demand is outstripping available supplies.
© 2014 General Electric Company. All rights reserved.This material may not be copied or distributed in whole or in part without prior permission of the copyright owner.
II. THE GLOBAL NATURAL RESOURCE CHALLENGE
II. THE GLOBAL NATURAL RESOURCE CHALLENGE
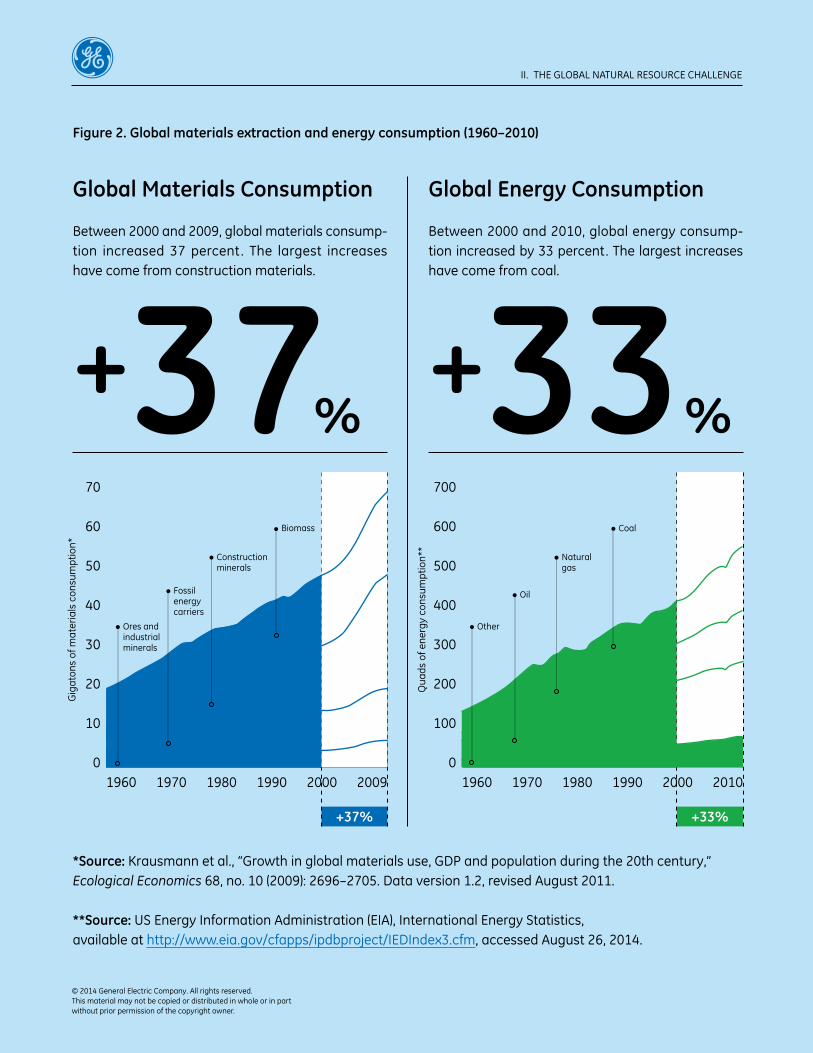
Figure 2. Global materials extraction and energy consumption (1960–2010)
Between 2000 and 2009, global materials consump-tion increased 37 percent . The largest increases have come from construction materials.
Gig
aton
s of
mat
eria
ls c
onsu
mpt
ion*
Qua
ds o
f ene
rgy
cons
umpt
ion*
*
1960 19600
100
200
300
400
500
600
700
2009
+37% +33%
20102000 20001990 19901980 19801970 1970
Between 2000 and 2010, global energy consump-tion increased by 33 percent. The largest increases have come from coal.
Global Materials Consumption Global Energy Consumption
*Source: Krausmann et al., “Growth in global materials use, GDP and population during the 20th century,”Ecological Economics 68, no. 10 (2009): 2696–2705. Data version 1.2, revised August 2011.
**Source: US Energy Information Administration (EIA), International Energy Statistics, available at http://www.eia.gov/cfapps/ipdbproject/IEDIndex3.cfm, accessed August 26, 2014.
+37%+33%
Ores and industrial minerals
Fossil energy carriers
Construction minerals
Biomass
Other
Oil
Natural gas
Coal
0
10
20
30
40
50
60
70
II. THE GLOBAL NATURAL RESOURCE CHALLENGE
© 2014 General Electric Company. All rights reserved.This material may not be copied or distributed in whole or in part without prior permission of the copyright owner.

12
The World Resources Institute (WRI) has exam-ined local water stress throughout the globe and found extreme stress in select areas across all seven continents. The most stressed regions are Africa, the Middle East , and Australia. According to the Organization for Economic Co-operation and Development (OECD), one billion people live in water-stressed regions today.8 Furthermore, WRI expects water stress to intensify over the next 15 years across all scenarios.9 Ensuring adequate supplies of water in many parts of the world will be a challenge in the face of rising population and economic output levels.
The trends are clear—since the year 2000, natural resource demand has risen rapidly, and this has had a direct and measurable impact on resource availability and commodity prices. In this environ-ment , the challenge is to ensure that communi-ties and businesses have the resources that they need to improve livings standards and sustain economic activities.
Natural Resources and Economic Growth
Natural resources are, and always have been, a critical ingredient to economic growth and rising income levels. The historical connection between natural resources and economic growth can be better understood by examining the link between materials consumption and incomes. The relation-ship between per capita resource consumption and income between 1900 and 2011 is illustrated in Figure 5.
In the past , there have been periods of time where both incomes and resource use rose slowly (1900–1950), periods where both have risen more rapidly (1951–1970), and periods where resource use has stagnated, but incomes have continued to rise (1971–1990). By the end of the twentieth century, the strength of the correlation between incomes
and resource consumption had weakened. However, since the turn of the twenty-first century, the link between global incomes and materials use has tightened. Between 2000 and 2010, resource use and incomes levels grew in tandem. Global incomes rose at an average annual rate of 2.4 percent , while per capita materials grew at an average annual rate of 2.2 percent .
The Vice Is Tightening
The stronger linkage between natural resource consumption and incomes has important implica-tions for the pace and direction of natural resource demand over the next 15 years. If the relationship persists, expected increases in gross domestic product (GDP) and population levels will translate into even stronger levels of resource demand. In fact , GE analysis indicates that in the absence of additional improvements in the intensity of resource use per dollar of GDP, both materials extraction and energy consumption will increase by 80 percent by 2030.
In the absence of improve-ments in the intensity of resource use per dollar of GDP, both materials extraction and energy consumption will increase by 80 percent by 2030.
This assessment of future resource consumption is based on population and economic growth out-looks. According to the United Nations, the global population level will increase from 7.2 to 8.4 billion by 2030. This means that 1.2 billion people will be added to the planet in the next 16 years. Over 90 percent of this population growth will occur in the developing world.
© 2014 General Electric Company. All rights reserved.This material may not be copied or distributed in whole or in part without prior permission of the copyright owner.
II. THE GLOBAL NATURAL RESOURCE CHALLENGE

Figure 3. Rising commodity prices reflect increasing resource scarcity (1960–2013)
Precious Metal Prices
Energy PricesGlobal Commodity Prices
Non-Energy Prices
Source: World Bank, Commodity Price Data (The Pink Sheet), updated August 4, 2014.
+360%
+500%
+60%
1960
Com
mod
ity P
rice
Inde
x
0
20
40
60
80
100
120
140
1985 1990 1995 2000 2005 2010 201319751965 19801970
The rise in commodity prices since the turn of the century is a reflection of the global resource crunch. Since 1998, energy prices have increased fivefold, non-energy prices have risen 60 percent, and pre-cious metal prices have grown 360 percent.
Energy prices
Precious metal prices
Non-energy prices
II. THE GLOBAL NATURAL RESOURCE CHALLENGE
© 2014 General Electric Company. All rights reserved.This material may not be copied or distributed in whole or in part without prior permission of the copyright owner.

Figure 4. 2013 global water stress map
Source: World Resources Institute (WRI) Aqueduct Project. Data provided by The Coca-Cola Company. Hydrologic modeling performed by ISciences, L.L.C.
Global Water Stress
Water is a critical natural resource. Water stress is present around the world and is expected to inten-sify over the next decade in the presence of rising economic and population levels.
The baseline water stress indicator estimates the degree to which freshwater availability is an ongo-ing concern. High levels of baseline water stress are associated with increased socioeconomic competi-tion for freshwater supplies and heightened political attention to issues of water scarcity.
Extremely High Stress (>80%)High Stress (40–80%)Medium-High Stress (20–40%)Moderate Stress (10–20%)Low Stress (<10%)Arid and Low Water Use (NA)Missing Data (No Data)
1.2billion people living with water stress
© 2014 General Electric Company. All rights reserved.This material may not be copied or distributed in whole or in part without prior permission of the copyright owner.
II. THE GLOBAL NATURAL RESOURCE CHALLENGE

15© 2014 General Electric Company. All rights reserved.This material may not be copied or distributed in whole or in part without prior permission of the copyright owner.
GDP is expected to rise too. GE estimates that world GDP will grow from an estimated $78.2 trillion by the end of 2014 to $138.4 trillion by 2030. That’s a 77 percent increase in global output. A full 75 percent of this growth will occur in the developing world.
This has important implications for resource use, because growth in less developed countries will require the construction of critical infrastructure such as buildings, transportation networks, energy systems, and water facilities. The development of this infrastructure requires increased resource use. There is strong evidence to support this. The surge in materials use over the last decade has coincided with a construction boom in China. As a result , 60 percent of the growth in materials use since 2000 has been due to growth in the con-sumption of construction-related minerals. The concentration of growth in the developing world over the next two decades also tells us that the majority of increase in resource demand will occur in these regions as well.
At the global level, the net result will be more indi-viduals at higher income levels by 2030. Global per capita incomes are expected to rise from US$10,794 (2005 purchasing power parity [PPP]) to US$16,430 (2005 PPP) by 2030. That’s a 52 percent increase in global per capita income. As we have seen, higher income levels are correlated with greater natural resource use. In fact , if there are no gains in resource productivity, the increase in global per capita incomes from $10,794 to $16,430 will translate into an 80 percent increase in material and energy consumption levels by 2030.
Given the costs and risks associated with expand-ing resource supplies, an 80 percent increase in natural resource consumption by 2030 is simply infeasible. A 2011 study by the McKinsey Global Institute (MGI) highlighted the challenges of growing global resource consumption.10 According to MGI:
The truth is, meeting projected resource demand would require historically unprecedented increases in supply. Rapid growth in supply can involve significant capital, infrastructure, and geopo-litical risks. Much of the solution to the global resource challenge is going to have to come from demand-side options in the form of increased resource productivity. The key question and the crux of the global resource challenge is: How can we do more with the world’s natural resources?
The Resource Productivity Imperative
Resource productivity is a measure of the quantity of goods or services provided per unit of resources used. At the economy level, it can be expressed in terms of resources consumed per dollar of GDP. We can calculate global resource productivity for materials and energy consumption. Similar data is not available to calculate water productivity at the global level.
The size of today’s challenge should not be underestimated; nor should the obstacles to diffusing more resource-efficient tech-nologies throughout the global economy. The next 20 years appear likely to be quite different from the resource-related shocks that have periodically erupted in history. Up to 3 billion more middle-class consum-ers will emerge in the next 20 years com-pared with 1.8 billion today, driving up demand for a range of different resources. This soaring demand will occur at a time when finding new sources of supply and extracting them is becoming increasingly challenging and expensive… Compounding the challenge are stronger links between resources, which increase the risk that shortages and price changes in one resource can rapidly spread to others.11
II. THE GLOBAL NATURAL RESOURCE CHALLENGE

16
II. THE GLOBAL NATURAL RESOURCE CHALLENGE
+31.3%
Figure 5. Global per capita materials use and income (1950–2010)
Per Capita Materials Consumption and Income Levels
Source: Krausmann et al., “Growth in global materials use, GDP and population during the 20th century,” Ecological Economics 68, no. 10 (2009): 2696–2705. Data version 1.2, revised August 2011. Population data from United Nations Population Division, Change to World Population Prospects: The 2012 Revision. Income data from GE.
1950
Per
Cap
ita In
com
e
0
1
2
3
4
5
6
7
8
9
10
11
$0
$1,000
$2,000
$3,000
$4,000
$5,000
$6,000
$7,000
$8,000
$9,000
$10,000
$11,000
1990 20121970 19801960 1965 1975 1985 1995 20051955
Per capita materials consumption and per capita incomes were correlated throughout the twentieth century. Since the turn of the century, the linkage has strengthened and they have grown in tandem.
Per capitaincome levels
Per capita materials consumption
Per
Cap
ita M
ater
ials
Con
sum
ptio
n (to
ns p
er p
erso
n)
+31.3%
2000
© 2014 General Electric Company. All rights reserved.This material may not be copied or distributed in whole or in part without prior permission of the copyright owner.

17© 2014 General Electric Company. All rights reserved.This material may not be copied or distributed in whole or in part without prior permission of the copyright owner.
In 2010, the global GDP was US$68.7 trillion (2005 PPP). Global materials consumption in 2010 was 70.7 Gt . Thus, the level of global materials productivity in 2010 was $970 per ton of materials. Materials productivity has actually fallen since 2000 from $976 per ton. Similarly, global energy consumption in 2012 was 530 quads. In 2012, the global GDP was US$73.5 trillion (2005 PPP). Thus, the level of global energy productivity in 2012 was $139 per million Btu.
Historically, due to the onward march of technol-ogy progress, resource productivity has steadily improved. Between 1970 and 1999, global mate-rials productivity improved at an average annual rate of 1.2 percent . However, more recently, in the period between 2000 and 2010, materials pro-ductivity improved at a much slower rate of 0.2 percent . Rapid growth in the developing world, which has led to a construction boom, is largely responsible for the reduction. The productivity of energy has also improved over time. Between 1970 and 2012, energy productivity improved at an average annual rate of 1.2 percent .
In the face of the global resource challenge, there is an urgent need to maintain continued resource productivity improvements and keep resource use in check. Because resource productivity improve-ments must occur without sacrificing economic growth, this is also known as decoupling resource use from economic growth. In the words of the OECD: “Rising income and aspirations for better living standards will increase the pressure on the planet’s natural resources. The economic prospects of many of the poorest countries are threatened by unsustainable use of natural resources, uncon-trolled pollution in rapidly growing cities, and the impacts of climate change.”12
The resource challenge is not limited to energy and materials. Water resources wil l also be stretched to the limit in order to keep up with
growing economies and population. According to the OECD, if current trends persist , the num-ber of people subject to water stress will grow from 1 billion today to over 3.9 billion by 2050. Already, 63 percent of the population in Brazil, Russia, India, and China together are living under medium-to-severe water stress; this share will increase to 80 percent by 2050.13
How will the world accelerate resource produc-tivity to meet the resource needs of growing economies and populations over the next two decades? After examining the global resource challenge, MGI identified resource productivity improvements that could address more than 80 percent of expected growth in demand for energy, 60 percent of anticipated growth in demand for water, and one-quarter of expected growth in demand for steel.14
MGI’s identified solutions are heavily focused on hardware and process improvements.15 The top solutions identified by MGI include building energy efficiency, large-scale farm yield improvements, and food waste reduction. The message from MGI’s research is that there is tremendous scope for con-tinued resource productivity improvements. They caution, however, that implementing the identified solutions will not be easy. They estimate that only 20 percent of the solutions are readily achievable and conclude that additional measures will be required to meet global resource demand by 2030.
Clearly, additional solutions beyond currently identified options will be required to solve the global resource challenge. Fortunately, there’s another set of potential solutions that haven’t been fully considered by MGI or others. These solutions are the product of 50 years of contin-uous innovation and are now in a position to transform how resources are used within the global industrial system.
II. THE GLOBAL NATURAL RESOURCE CHALLENGE

18
II. THE GLOBAL NATURAL RESOURCE CHALLENGE
Figure 6. Going up—population, GDP, and incomes expected to rise
Source: United Nations Population Division, World Population Prospects: The 2012 Revision, Medium Fertility Scenario.
0.1 10,0001 10 100 1,0000
2
10
50
200
1,000
5,000
20,000
100,000
400,000
Population Growth
Todays’ global population level of 7.2 billion will grow to 8.4 billion by 2030, an increase of 1.2 billion people on the planet. Ninety-one percent of the in-crease will occur in the developing world.
billion peopleby 2030
+1.2
Economic Growth
The size of the global economy will increase by US$18.8 trillion (2005 purchasing power parity) be- tween 2014 and 2030. Over 75 percent of this growth will occur in the developing world.
+$18.8 trillion2014–2030
USABrazil
Per Capita Income Growth
Growing populations and economies will push up income levels. Between 2014 and 2030, global per capita incomes will rise by 52 percent.
Popu
latio
n G
row
th (2
014–
2030
)
GDP Absolute Growth (2014–2030)
India
Nigeria
Iran
Indonesia
Japan
China
Ethiopia
UK
Developing countriesDeveloped countries
>1.5%
1.0–1.5%
0.5–1.0%
<0.5%
Per capitaincome growth
© 2014 General Electric Company. All rights reserved. This material may not be copied or distributed in whole or in part without prior permission of the copyright owner.

19© 2014 General Electric Company. All rights reserved.This material may not be copied or distributed in whole or in part without prior permission of the copyright owner.
Ecomagination
Ecomagination is GE’s commitment to devel-oping technologies that make the most of the world’s valuable natural resources. Established in 2005, GE’s ecomagination program has been at the forefront of resource productivity solu-tions. Since its founding, the GE technologies and solutions in the ecomagination portfolio have
generated more than $180 billion in revenue. GE has maintained its commitment to efficient resource solutions by investing $15 billion in research and development over this period. We have also reduced our environmental impact by reducing our greenhouse gas emissions and freshwater use.
III. WHEN HARDWARE MEETS SOFTWARE
III. WHEN HARDWARE MEETS SOFTWARE

20
III. WHEN HARDWARE MEETS SOFTWARE
Ecomagination technologies are at the cutting edge of resource productivity. For example, con-sider GE’s GEnx aircraft engines, GE’s turbofan engine family for select wide-body aircraft . GEnx engines use advanced GE propulsion technology to reduce fuel consumption, associated carbon dioxide (CO2) and oxides of nitrogen (NOx) emissions, noise, and operating cost , compared to the engines they replace. In comparison with the previous model (GE’s CF6 engine), the GEnx engine reduces fuel by more than 10 percent , which translates to a double double-digit reduction in CO2.
GE’s Evolution Series locomotive is another example of resource-efficient ecomagination technology. The Evolution locomotive is the most technologically advanced diesel-electric, heavy-haul locomotive in the world today. GE has just released the Evolution Series Tier 4 engine, which is the first mainline locomotive to meet the United States Environmental Protection Agency’s stringent Tier 4 emission standards, which call for the single-largest emission reduction in the rail sector’s history. The new locomotive will meet this standard without the use of aftertreatment . GE Transportation has invested $600 million in the Evolution Series since its introduction in 2005. The point is, thanks to continuous innovation and investment, these types of hardware improvements by GE and others will continue and will play a key role in increasing resource productivity over time.
A final example from the ecomagination portfolio is GE’s J920 FleXtra gas engine, which is at the top of its class for electrical efficiency and is designed for durability, simple installation, and maintainability. Based on the extensive experience of GE’s Type 6 gas engine combustion system, the J920 FleXtra unit is equipped with an advanced pre-chamber combustion system with spark ignition for longer part life. In addition, the individual gas mixing achieved by port injection in combination with cylinder-specific sensors allows each cylinder to
be controlled to operate at top performance. The J920 FleXtra mechanical structure is designed to allow high-peak firing pressure. In combination with the latest miller technology and two-stage turbocharging, the J920 FleXtra engine can achieve a top-of-its-class electrical efficiency of 48.7 per-cent for 50 Hz and 49 percent for 60 Hz.
Ecomagination solutions by GE will continue to play a key role in increasing resource produc-tivity over time.
These ecomagination solutions are concrete exam-ples of the latest hardware innovations that have improved resource productivity across industries over the last decade. At GE, given our commitment to continued research and development targeted toward resource-efficient solutions, we are excited about the continued prospects for additional tech-nology advances in the future. However, we also recognize that given the global resource challenge, there is a need for even greater resource productivity improvements than can be delivered by hardware improvements alone. In our view, the key to solving the great global resource challenge involves the integration of traditional advances in industrial equip-ment through an initiative like GE’s ecomagination program with the Internet-enabled software that squeezes the most out of hardware and enables broader optimization across the industrial system.
The Industrial Internet16
Software has been used in industrial processes since 1959. That’s the year that Texaco’s Port Arthur refinery became the first chemical plant to use digital control. The Port Arthur refinery used an RW-300 mainframe manufactured by Ramo-Wooldridge Corporation and led the way in
© 2014 General Electric Company. All rights reserved.This material may not be copied or distributed in whole or in part without prior permission of the copyright owner.

Figure 7. A decade of ecomagination
20142010200920072005
2005 Goals
In 2005, GE launched ecomagination, its commitment and strategy to solve the world’s biggest energy and environmental challenges.
GE commits to:1. Doubling its investment in clean research and development
(R&D) from $700 billion/year to $1.5 billion/year by 2010.2. Growing revenues from ecomagination
products to at least $20 billion.3. Reducing its greenhouse gas (GHG) emissions
by at least 1% by 2012.
2007 Expansion
In 2007, GE announced a new commitment in addition to the original three.
4. GE commits to reducing its global water use by 20 percent between 2006 and 2012.
2005GE creates the ecomagination product review scorecard, which quantifies a product’s or solution’s environmental benefits.
2005GE surpasses 5,000 installations for its 1.5 megawatt wind turbine.
2006GE increases its annual investment in clean R&D from $700 to $900 million and expands research on renewable energy, clean coal, carbon captures, water, and energy efficiency.
2006GE launches ecomagination in China, nearly 100 years since GE first began working in the country.
2010GE commits to buying 25,000 alternative fuel vehicles by 2015 to use in its fleets and those of its fleet- services business in 2010:
2010Ecomagination software solution, Movement Planner™, makes it possible for trains to move more freight faster and more efficiently on existing rail lines.
2010GE researchers set a world record of 12.8% thin film solar panel efficiency.
2010Proficy™, a software platform for measuring and managing the efficiency of manufacturing operations, is included in the ecomaginaton portfolio.
2011Ecomagination opens GE to outside innovation through the Ecomagination Challenge. Collaborating with venture capital firms, GE invests more than $130 million in 22 companies to help bring exciting new energy technologies to the world.
2014GE opens the ecomagination center in Masdar City, United Arab Emirates.
2014GE provides its ZeeWeed™ 1500 ultrafiltration system to the Santa Eufemia water treatment plant in Northern Portugal.
2014San Diego becomes the first city to install LightGrid™, GE’s wireless lighting control system.
2014 GE sets new ecomagination commitments. After investing $15 billion in clean R&D since 2005, GE commits to investing a total of $25 billion by 2020. GE also commits to reducing GHG emissions and water use by another 20% from the 2011 baseline.
2014 GE’s Predictivity™ Industrial Internet solutions are added to the ecomagination portfolio.
2007GE’s broad portfolio of ecomagination products spans the entire range of GE businesses.
2007GE invests more than $1 billion on clean R&D, drawing closer to the 2005 pledge to invest $1.5 billion by 2010.
2009GE surpasses its clean tech R&D goal of $1.5 billion one year early.
2007GE Transportation’s partner United Group Rail delivers 10 Evolution Series locomotives to Rio Tinto Iron Ore, bringing advanced locomotive technology to an energy-intensive industry.
2007The GEnx becomes the quietest, most energy-efficient and fastest-selling large engine in GE Aviation history. Emirates, an airline based in Dubai, is among those GE customers that have chosen GEnx engines to power their fleets.
2007GE Energy’s Jenbacher gas engines power Japan’s largest wood gas-to-energy plant.
Source: GE.
A Decade of Ecomagination
GE’s ecomatination initiative, launched in 2005, led to the development of ultra-efficient technologies that have provided resource productivity improvements across industries. Looking ahead, ecomagination and the Industrial Internet promise to unleash accelerated resource productivity improvements.
© 2014 General Electric Company. All rights reserved. This material may not be copied or distributed in whole or in part without prior permission of the copyright owner.
billion
$1
billion
$1.5billion
$15
million$900
5,000
12.8%
25,000
2010 Progress
1. $5 billion invested in clean R&D.2. $85 billion in ecomagination
product revenue.3. 22% reduction in GE’s GHG emissions
from the 2004 baseline.4. 30% reduction in water use from
the 2006 baseline.
2013 Success
1. $12 billion invested in clean R&D.2. $160 billion in ecomagination
product revenue.3. 32% reduction in GE’s GHG emissions
from the 2004 baseline.4. 45% reduction in GE’s water use
from the 2006 baseline.
2012
2012Ecomagination Nation, a global GE Power & Water initiative designed to protect the environment by encouraging employees to take action, gains increasing momentum within GE.
2012GE’s ecomagination portfolio expands to include CNG In A Box™, GE’s fully integrated CNG fuel supply system.
2013Ecomagination launches Brilliant™ Wind, a renewable energy system comprised of a wind turbine, battery and software. The system harnesses the power of the Industrial Internet and reaps the benefits of energy storage without the high costs.
III. WHEN HARDWARE MEETS SOFTWARE

22© 2014 General Electric Company. All rights reserved.This material may not be copied or distributed in whole or in part without prior permission of the copyright owner.
the development of industrial computer control.17 Since that time, software has become increasingly integrated into industrial machinery.
Industrial software developed in successive genera-tions. In the 1960s, the first generation of industrial software used large minicomputers with no connectivity to other systems. By the 1970s, second-generation software systems were in place that were distributed across multiple connected stations. Network proto-cols were proprietary and not standardized during this period. By the 1990s, third-generation industrial control software was in use. These systems were distributed and networked, and could be spread across multiple local area networks and geogra-phies, often with a single supervisor and historian.
The Internet was developed in parallel to the devel-opment of increasingly sophisticated industrial con-trol software. The first nodes of what would become the Advanced Research Projects Agency Network (ARPANET) were established in 1969. ARPANET was the precursor to today’s Internet. In 1982, the Internet protocol (TCP/IP) was established. This standard enabled seamless communication between interconnected networks. The Internet grew to over 300,000 hosts by 1990. In 1991, after the ARPANET project was con-cluded, all commercial restrictions on the use of the Internet were removed. As is well known, the Internet blossomed into a global force for communications and retail commerce in the 1990s and 2000s. The world was transformed in a myriad of well-docu-mented ways by the emergence of the Internet. By 2010, the number of Internet hosts exceeded 800 million.18 The amount of data stored digitally today reached 300 exabytes (10 to the power of 18).19
In 1994, the concept of the Internet of Things (IoT) was first developed. The basic idea was to affix sensors to common objects in order to connect these items to the Internet . This would create an interconnected universe where objects could
be tracked and controlled remotely. In 1999, the Massachusetts Institute of Technology (MIT) estab-lished the Auto-ID Center to conduct research focused on IoT. During the same year, the world’s first machine-to-machine protocol, MQ Telemetry Transport (MQTT), was developed. By 2008, the first international IoT conference took place in Zurich.
By 2010, improvements in information technologies enabled the IoT to be applied to industrial machin-ery. This led to the Industrial Internet , which is the fourth generation of industrial software systems. Technology advances include falling computing prices, the miniaturization of computers, increasing band-width, and the emergence of cloud computing. All of these technology trends together provided the tailwinds necessary to launch the Industrial Internet.
In 2011, GE announced its commitment to a $1 billion investment in industrial software and analytics over a three-year period. In 2013, GE released Predix, the first software platform for the Industrial Internet . By 2014, GE had developed 40 Industrial Internet applications in its Predictivity suite of solutions using the Predix platform. The Industrial Internet Consortium was founded in 2014 to further devel-opment, adoption, and widespread use of intercon-nected machines, intelligent analytics, and people at work. The momentum behind the Industrial Internet is explosive. Over 12.5 billion devices are connected to the Internet, and CISCO estimates that there will be 25 billion devices connected to the Internet by 2015 and 50 billion by 2020.20
The development of the Industrial Internet is a transformative milestone for industrial resource use because it adds a new dimension to resource produc-tivity. Starting in the 1960s, first-generation industrial software systems were able to optimize resource use at the machine level. In the 1970s and 1980s, interconnected second-generation industrial software systems enabled resources to be optimized at the
III. WHEN HARDWARE MEETS SOFTWARE

23
III. WHEN HARDWARE MEETS SOFTWARE
© 2014 General Electric Company. All rights reserved.This material may not be copied or distributed in whole or in part without prior permission of the copyright owner.

Source: GE research, the Computer History Museum (www.computerhistory.org).
Figure 8. Industrial Internet timeline
19901960 198019701950
1950s–1960s
MonolithicEnabled Machine-Level Resource Optimization
The first generation of industrial control soft-ware used large mini-computers connected to industrial machines with no connectivity to other systems. They had limited security.
1970s–1980s
DistributedEnabled Facility-Level Resource Optimization
The second generation of industrial control soft-ware was distributed across multiple independent workstations connected through proprietary com-munications protocols. They had limited security.
Evolution of Industrial Software Systems
Industrial software systems have evolved over the last 50 years from mono-lithic systems that enabled machine-level control to the Industrial Internet, which facilitates resource optimization for global industrial networks.
1959Texaco’s Port Arthur refinery becomes the first chemical plant to use digital control.
1969The first nodes of what will become the Advanced Research Projects Agency Network (ARPANET) are established. ARPANET was the precursor to today’s Internet.
1982The Internet protocol (TCP/IP) is established. This standard enabled seamless communication between interconnected networks.
1985The number of hosts on the Internet (all TCP/IP interconnected networks) reaches 2,000.
2000 202020101990
1990s–2000s
NetworkedEnabled Enterprise-Level Resource Optimization
The third generation of industrial control software were distributed and networked, and computers could be interconnected through a secure local area network (LAN). The systems spread across multiple LANs and across geographies.
2010s–Today
Industrial InternetEnables Global NetworkResource Optimization
Over the last decade, cloud computing, network bandwidth increases, hardware improvements, and software advances have enabled the emer-gence of the Industrial Internet.
1990The Internet grows to over 300,000 hosts.
1991After the ARPANET project was concluded, all commercial restrictions on the use of the Internet are removed.
1994The concept of the Internet of Things (IoT) is first developed. The basic idea was to affix sensors to common objects in order to connect these items to the Internet.
1999The Massachusetts Institute of Technology (MIT) establishes the Auto-ID Center to conduct research focused on IoT. During the same year, the world’s first machine-to-machine protocol, MQ Telemetry Transport (MQTT), is developed.
2008 The first international IoT conference takes place in Zurich.
2010 The number of Internet hosts exceeds 800 million.
2010Improvements in information technologies enable the IoT to be applied to industrial machinery.
2012 GE announces its commitment to a $1 billion investment in software and analytics and launches the Software and Analytical Center of Excellence in California.
2013GE develops Predix, the first software platform for the Industrial Internet.
2014GE’s portfolio grows to 40 Industrial Internet applications within its Predictivity™ suite of solutions using the Predix platform. The Industrial Internet Consortium is established to further the development, adoption, and widespread use of the Industrial Internet.
2015CISCO estimates that there will be 25 billion devices connected to the Internet by 2015 and 50 billion by 2020.
© 2014 General Electric Company. All rights reserved.This material may not be copied or distributed in whole or in part without prior permission of the copyright owner.
III. WHEN HARDWARE MEETS SOFTWARE

25© 2014 General Electric Company. All rights reserved.This material may not be copied or distributed in whole or in part without prior permission of the copyright owner.
facility level. By the 1990s, fully networked third-gen-eration industrial software systems enabled entire industrial enterprises to optimize their resource use.
However, it is only with the emergence of the Industrial Internet that optimization can occur at the global level, across entire industrial networks like rail-way, airline, and electric power. The efficiency and operation of entire airline or railroad networks can be controlled with emerging Industrial Internet solutions. Likewise, entire electricity grids can be controlled and optimized with intelligent software solutions. This level of optimization is new and it required 50 years of software innovation to get here. This new element offers promise for the accelera-tion of resource productivity improvements above and beyond a level that was previously possible.
This is why we believe the combination of ecomagination solutions with the Industrial Internet has the potential to play a key role in solv-ing the global resource challenge. Digital Resource Productivity, which is the integration of efficient hardware with Internet-enabled software, is the new frontier of natural resource productivity. This approach provides an avenue to achieve resource productivity improvements above and beyond those that can be achieved through hardware advances alone.
The integration of efficient hardware with Internet- enabled software is the new frontier in natural resource productivity. This approach provides an avenue to achieve resource productivity improve-ments above and beyond those that can be achieved through hardware advances alone.
Resource productivity improvements of this mag-nitude, due to the integration of industrial hard-ware and Internet-enabled software, would have major implications for global industrial energy consumption. Over the last decade, through advances in the efficiency of hardware, energy productivity improved at a rate of 1 percent per year. If this same rate were to persist through 2030 as expected, then global industrial energy consumption will grow from 270 quads in 2013 to 416 quads in 2030. However, if the rate of energy productivity improvement is doubled to 2 percent per year through the combination of efficient hard-ware and Internet-enabled software, then global industrial energy consumption will be held to 346 quads by 2030. That represents a reduction of 70 quads, which is equivalent to roughly 12 billion barrels of oil—or just over a third of the world’s annual oil consumption today.
The important role that software can play in address-ing the global resource challenge is widely recog-nized by corporate leaders, and some are taking action in response. A 2014 survey of 254 corpo-rate executives sponsored by GE and Accenture provides some insight .21 When asked about their top strategies related to big data and analytics over the next one to three years, 60 percent iden-tified resource management as a top priority. More respondents identified resource management as a top strategy than any other category. Furthermore, 55 percent of corporate executives indicated that improving safety and environmental emissions was a top strategy. The importance of resource management and environmental stewardship is not only top of mind for many executives, it has become a strategic imperative in the context of big data and analytics initiatives.
III. WHEN HARDWARE MEETS SOFTWARE

III. WHEN HARDWARE MEETS SOFTWARE
Figure 9. Potential global industrial energy savings by 2030
Source: US Energy Information Administration (EIA) historical data, GE projections.
Global Industrial Energy Consumption
-70We believe that continuous hardware advances inspired by programs like GE’s ecomagination ini-tiative combined with Industrial Internet software have the potential to accelerate resource produc-tivity up to two times. In this example, global indus-trial energy consumption can be reduced by up to 70 quadrillion British thermal units (Btu) if energy productivity improvements are accelerated from 1 to 2 percent per year. quadrillion Btu (quads)
20000
50
100
150
200
250
300
350
400
450
500
550
2016 2024 2026 2028 20302008 20122004 2006 2010 2014 2018 20222002
Glo
bal I
ndus
tria
l Ene
rgy
Con
sum
ptio
n (q
uads
)
2020
-70
2% per yearAccelerated improvement.(2012–2030) +76 quads consumption
1% per yearExpected improvement.(2012–2030) +146 quads consumption
0% per yearNo improvement.(2012–2030) +226 quads consumption
© 2014 General Electric Company. All rights reserved.This material may not be copied or distributed in whole or in part without prior permission of the copyright owner.

27© 2014 General Electric Company. All rights reserved.This material may not be copied or distributed in whole or in part without prior permission of the copyright owner.
Digital Resource Productivity is not just a vision of the future—it is here today. Industrial Internet solutions developed by GE are already at work improving resource productivity, resulting in energy and water savings, improved reliability, and greater levels of output for industrial machines. Since 2012, GE has released 40 Industrial Internet Predictivity solutions with many more on the hori-zon. GE’s Industrial Internet solutions are built on Predix, GE’s software platform for the Industrial Internet . This is just the start of the Industrial Internet era, and there is vast untapped poten-tial. Today’s Industrial Internet solutions repre-sent the beginning of a long journey to digitize the industrial system and maximize the use of all industrial resources in the process.
Today’s Industrial Internet solu-tions represent the beginning of a long journey to digitize the industrial system and maxi-mize the use of all industrial resources in the process.
Lighting
Consider the potential exhibited by GE’s LightGrid™ Outdoor Wireless Control System. This system allows remote operation and monitoring of all fixtures through a web-enabled central manage-ment system. In order to save energy and money, LightGrid enables controllers to turn off or dim streetlights as needed. Controllers can adjust each fixture, on every street , individually. They can brighten areas when more light is needed—or dim them when it’s not .
LightGrid is already in use in the city of San Diego. The city wanted to improve street lighting in its downtown district and installed GE’s Outdoor Wireless Control System. They replaced approx-imately 3,000 high-pressure sodium lamps in a move expected to save the city $254,000 in oper-ating costs annually. San Diego is the first in the United States to utilize LightGrid and the city can now offer residents, business owners, and visitors improved and energy-efficient lighting that will save energy and significantly reduce the city’s spending and maintenance needs.
IV. POWERINGTHE FUTURE
IV. POWERING THE FUTURE

28
Figure 10. GE Predictivity™ solutions
Source: GE.
Aviation
GE’s Industrial Internet Predictivity™ solutions enable resource productivity optimization.
IV. POWERING THE FUTURE
Flight Efficiency Services™• Fuel Management• Flight Synchronization• Navigation Services• Flight Risk ManagementIntelligent Operations
Healthcare
Healthcare Asset Optimization• Healthcare Asset Management• Dose Management• Safer Care ManagementPatient Flow Optimization• Patient Care Capacity Management• OR Capacity Management• ED Capacity Management• Care Facility Design
Oil & Gas
• Subsea Systems Optimization• Inspection Connect• Field Vantage™• LNG Max Reliability• BOP Advisor• System 1™ Evolution• Pipeline Management
Power Generation
Power Distribution
• Power FlexEfficiency™• Power LifeMax™ • On Site Power Visibility• On Site Power Reliability
Grid IQ™ Insight• Advanced Meter Insight
Water & Process Technology• Water & Process InSight™
Transportation
Rail Optimization• Rail Component Performance• Trip Optimizer• Shipper Connect• Rail Movement Planner™
• Wind PowerUpRenewables
Manufacturing• Food Safety Assurance
Mining• Mine Performance
© 2014 General Electric Company. All rights reserved. This material may not be copied or distributed in whole or in part without prior permission of the copyright owner.

29© 2014 General Electric Company. All rights reserved.This material may not be copied or distributed in whole or in part without prior permission of the copyright owner.
Aviation
Global aircraft fuel burn will reach 270 megatons (Mt) and is expected to grow to 438 Mt by 2030. This translates into 1,519 Mt of CO2 emissions in 2014 growing to 1,658 Mt by 2030.22 This means that even small improvements in the productivity of the global airline network will lead to very large reductions in jet fuel consumption and associated environmental emissions. Through intelligence from a global fleet of nearly 25,000 engines, advanced analytics, and GE’s collective engineering and indus-try expertise, GE’s aviation Industrial Internet solu-tions provide airlines with more control to enable network optimization in the service of resource productivity improvements. The net result is lower jet fuel consumption and CO2 emissions.
GE’s Flight Efficiency Services are the most pow-erful aviation Industrial Internet tool for enhanc-ing resource productivity because these services enable airlines to improve the route efficiency of their network and directly reduce jet fuel con-sumption. It’s proven technology. For example, GE has been collaborating with the airline Alitalia since 2011 in using data to identify and realize fuel efficiencies. By providing automatic reporting and analysis of daily fuel usage, GE helped Alitalia identify 1.5 percent savings in its fuel costs within the first year—a saving of US$15 million. In addition, Brazilian airline Gol Linhas Aéreas Inteligentes has employed Flight Efficiency Services and has already realized US$100 million in savings over five years. They have saved an average of 22 miles per flight and 77 gallons of jet fuel per flight , and have reduced C02 emissions by 1,628 pounds per flight .
Power
Electric power generation consumes 39 percent of total global energy use.23 Given the scale of power- related fuel consumption, even minor productivity
improvements in the global fleet of gas-fired gener-ators will have a big impact on natural gas use and concomitant CO2 emissions. The Industrial Internet provides a promising avenue for enhancing the pro-ductivity of gas-fired generators to achieve reduc-tions in gas consumption and CO2 emissions. GE’s portfolio of Industrial Internet solutions for power generation provides optimization and life extension for a range of power generation technologies from GE’s aeroderiviatives to heavy-duty gas turbines. By combining advanced software solutions and hardware design innovation, GE’s power generation solutions can transform existing gas turbines to meet today’s demands for power, efficiency, and flexibility.
GE’s FlexEfficiency Advantage for GE F-Class Gas Turbines portfolio delivers a suite of hardware- and software-blended solutions that improve performance and the long-term value of exist-ing GE F-Class gas turbine assets. FlexEfficiency Advantage enables the analysis of millions of hours of operating data from 100 physical and 300 virtual sensors attached to each gas turbine. This information is used to improve output and enhance fuel efficiency.
The Distributed Power offering from GE Predictivity is a new customized set of data-based solutions that improve the performance and flexibility of LM6000 aeroderivative gas turbines—providing you with increased uptime and efficiency, reduced life cycle costs, and the potential for improved economic benefits. Leveraging remote monitoring and diagnostics, these customized solutions are designed to reduce unplanned events and provide better insight into maintenance and operational data. This predict-and-prevent Industrial Internet–based suite of digital solutions supports reliability and can help reduce unplanned downtime. It pro-vides the potential for increased output of up to 10 percent , and faster starting and loading—cutting start-up time to full load by up to half.
IV. POWERING THE FUTURE

30
IV. POWERING THE FUTURE
These power generation solutions result in high output levels and greater efficiencies for large and small gas turbines. For example, North American energy company TransCanada has collaborated with GE on the implementation of FlexEfficiency Advantage on its gas turbine fleet . They’ve experienced fuel efficiency improvements by up to 2 percent .
In addition to these Industrial Internet solutions, GE is also providing offerings that promise to move beyond power plant optimization and improving resource pro-ductivity across entire electricity networks. GE’s Grid IQ™ Insight is an advanced analytical solution using a variety of data to better manage the electric grid. The platform consolidates data from a broad mix of sources, including smart meters and other intelligent power grid equipment, sensors, weather monitoring, and even unstructured social media content. Grid IQ Insight’s social media analysis can identify trouble spots and outage locations before customers call the utility. Grid IQ Insight enables utilities to respond more quickly to outages and minimizes customer disrup-tion. Customers Indianapolis Power & Light Company and American Electric Power are currently using Grid IQ through their participation in GE’s Grid IQ Insight Innovative Utility Program.
Rail
Rail diesel consumption is on the rise. The global rail system consumes nearly 300 million barrels of diesel annually. This figure is expected to grow to 326 million barrels by 2030.24 GE’s Industrial Internet solutions provide a pathway to curb the rate of growth of railway diesel consumption. As with lighting, avi-ation, and power generation, small improvements in productivity will have a large impact on global fuel consumption and associated CO2 emissions.
Movement Planner is the railroad equivalent of an air-traffic control system. Movement Planner System is breakthrough technology enabling more
locomotives to run on the same railroad at faster speeds and with greater efficiency—without laying new track. This product is the latest example of how GE Transportation’s $4 billion-a-year soft-ware and solutions services are helping customers improve resource productivity.
Movement Planner integrates railroad logistics with traffic-control systems and considers multiple fac-tors such as train schedules, traffic-control systems, and train movements relative to each other. The software then develops an optimized traffic plan for the trains, even down to the best speed at which to travel to keep the flow going throughout the railroad. Movement Planner is already being used to increase resource productivity. Norfolk Southern has implemented Movement Planner along its entire 20,000 route miles in its 22-state rail network.
Water
Against the backdrop of global water scarcity, the industrial sector is the fastest growing source of water consumption. In 2014, industrial water use will reach an estimated 463 cubic kilometers (km3). That’s up from just 200 km3 in 2000. If current trends persist , by 2030, industrial water use will rise by 65 percent to 764 km3.25
Water is a critical natural resource that enables most manufacturing, heavy processing, and power generation industries. Water-related applications and utilities include influent treatment prior to down-stream use as makeup, open recirculating cooling water systems, steam generators (fired and waste heat), and wastewater operations. These water assets should be thought of as critical profit-enabling functions. Their performance translates directly to throughput , yield, and energy consumption.
While the core performance goals for water assets of reliability, efficiency, and preservation haven’t
© 2014 General Electric Company. All rights reserved.This material may not be copied or distributed in whole or in part without prior permission of the copyright owner.

31© 2014 General Electric Company. All rights reserved.This material may not be copied or distributed in whole or in part without prior permission of the copyright owner.
changed, the complexities of achieving them have. Relentless cost-out pressures, extended produc-tion runs, and increasing demands on changing plant workforces are a few. Add to that expanding environmental regulation, demands for greener footprints, and unfavorable trends in availability and cost of fresh water. Combined, all these forces challenge the core goals today, and will in the future.
For example, petroleum refiners consume huge volumes of fresh water for the functions of cooling, steam generation, and washing. It is estimated to require 1–2.5 gallons of water for every gal-lon of petroleum product produced. In the United States alone, that translates to 1–2 billion gallons of water each day. Water scarcity and the cost of water will increasingly be a challenge for refiners. Inefficient use, the cost to pretreat influent water prior to downstream use, and the energy to move water around the refinery will drive optimization strategies and technology to consume less fresh water. The innovations of the Industrial Internet hold great promise as an enabler in this water space.
To use less fresh water, the industry has three basic options: (1) Increase the concentration factor (i.e., to effectively force the incoming fresh water to work harder, but as a result , create more adverse conditions that can aggravate water-related prob-lems that threaten the production process); (2) Use alternatives to fresh water, sourced from outside the plant site, that would previously be considered unthinkable or simply too risky (e.g., reclaimed municipal wastewater); and (3) Use alternatives to fresh water, sourced from inside the plant site, such as various contributing waste stream flows or the consolidated plant wastewater.
While they can all reduce fresh water consumption, no matter which of these strategies is employed, they all result in creating conditions that have an increased propensity to wreak havoc on the
production process. Being able to maintain pro-duction reliability, and at the same time employ one or more of these strategies is a challenge that the Industrial Internet can solve. The connectivity between people, machines, and data, and predictive analytics provide the insight necessary to control system chemistries and anticipate and respond to problems at their incipient stage.
For example, GE’s Water & Process InSight solution provides a method to improve the performance and reliability of production assets that are served by water and process chemical applications. InSight is a knowledge management system that enables vast amounts of operating data at industrial facilities to be transformed into meaningful and actionable information that enables operational optimization, data visualization, diagnostics, and reporting. By providing a centralized knowledge management and operations tool, InSight opens the door to a range of possibilities that lead to increased water productivity and reduced water consumption.
As a case in point , these capabilities are put to use at the power generation facilities of Lakeland Electric in Florida. At this location, the customer reuses municipal wastewater instead of fresh water to meet the demand for cooling. An integrated solution consisting of enabling chemistries, auto-mation, and InSight helps this customer to maintain efficient production operations and at the same time save some 12.4 billion gallons of fresh water each year, ensuring sustainable operations in the face of a water-scarce region, a reduced cost of water, and a smaller environmental footprint .
Wind
Wind power generation is increasing across the globe. As of 2012, wind turbines generated nearly 600 terawatt hours (TWh) of electricity annually.26 GE’s PowerUp Industrial Internet solution promises
IV. POWERING THE FUTURE
32
IV. POWERING THE FUTURE
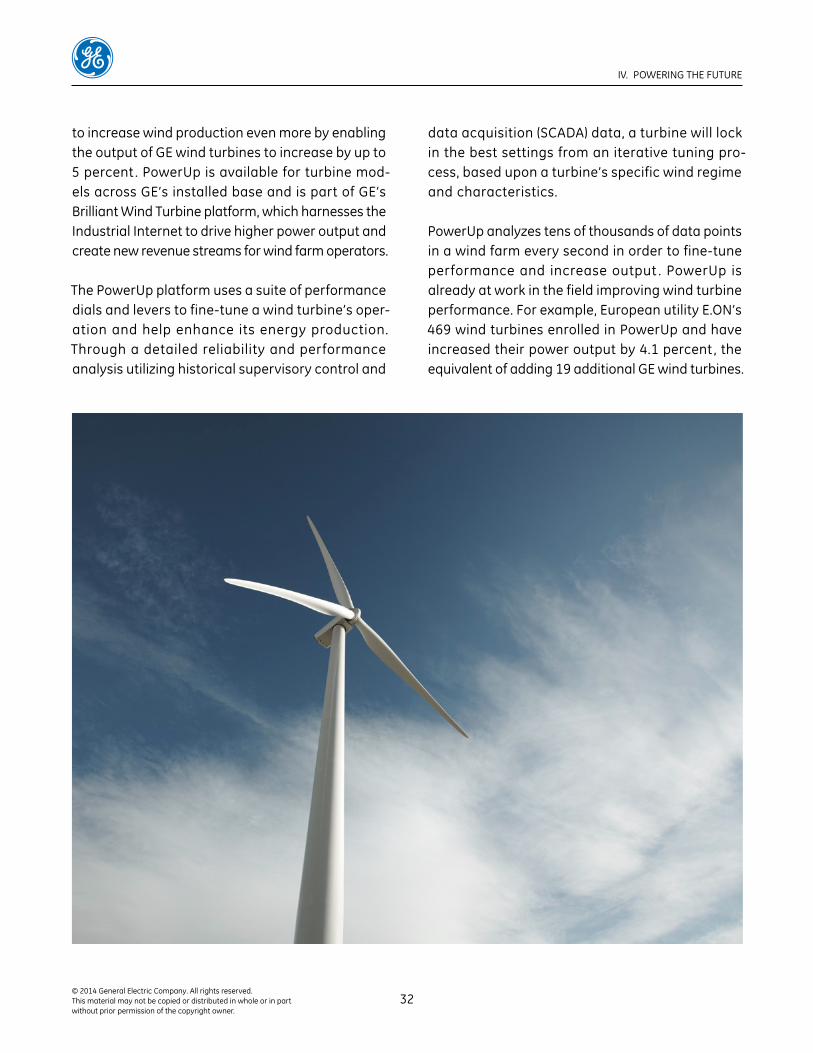
to increase wind production even more by enabling the output of GE wind turbines to increase by up to 5 percent . PowerUp is available for turbine mod-els across GE’s installed base and is part of GE’s Brilliant Wind Turbine platform, which harnesses the Industrial Internet to drive higher power output and create new revenue streams for wind farm operators.
The PowerUp platform uses a suite of performance dials and levers to fine-tune a wind turbine’s oper-ation and help enhance its energy production. Through a detailed reliability and performance analysis utilizing historical supervisory control and
data acquisition (SCADA) data, a turbine will lock in the best settings from an iterative tuning pro-cess, based upon a turbine’s specific wind regime and characteristics.
PowerUp analyzes tens of thousands of data points in a wind farm every second in order to fine-tune performance and increase output . PowerUp is already at work in the field improving wind turbine performance. For example, European utility E.ON’s 469 wind turbines enrolled in PowerUp and have increased their power output by 4.1 percent , the equivalent of adding 19 additional GE wind turbines.
© 2014 General Electric Company. All rights reserved.This material may not be copied or distributed in whole or in part without prior permission of the copyright owner.

33© 2014 General Electric Company. All rights reserved.This material may not be copied or distributed in whole or in part without prior permission of the copyright owner.
Oil and Gas
With energy demands rising and reserves of oil and gas becoming more challenging to access, the resource productivity transformation promoted by the Industrial Internet is of vital importance to the oil and gas sector. By combining decades of manufacturing expertise with its rapidly expand-ing software engineering capability, GE is leading the big data revolution so that its customers can operate both more effectively and efficiently.
In the oil and gas sector, GE is working to ensure the efficient operation of critical rotating machin-ery found on the energy company’s production facilities. Such equipment includes compressors, generators, and critical pumps that are vital to ensure the safe extraction and transportation of oil and gas around the globe.
By analyzing sensor data such as vibration, rotor position, temperature, pressure flow, and other parameters, GE is able to identify changes in the operating condition of the machine or determine that the machine is no longer performing at its optimal capacity. Identifying the early onset of abnormal operating conditions minimizes disruption and avoids unnecessary periods of downtime that often result in lost production or increased costs.
BP has deployed GE’s System 1™ and SmartSignal™ software across a number of its offshore produc-tion facilities located in the UK and Norwegian sectors of the North Sea, along with other key oil and gas areas such as the Gulf of Mexico, the Caspian Sea, and Angola. Gillian Goby, Performance Enhancements Team Leader of BP notes: “The oil and gas industry is an extremely dynamic sector that places great demands on its personnel and equip-ment. Any solution that helps to ensure the integrity of our assets whilst minimizing production disrup-tions, offers significant benefits for our operations.
BP highly values condition monitoring because it helps us manage our machines more effectively by allowing us to identify developing abnormal conditions and plan our maintenance activities.”
Beyond the Power of 1%
In 2012, GE discussed the Power of 1% to illustrate the potential impact that the Industrial Internet could have by improving the efficiency of industrial operations by just 1 percent. Today, as we consider the potential impact of the Industrial Internet , we find that in the context of resource productivity, the power of the Industrial Internet goes well beyond 1 percent . This is because when the Industrial Internet is used to optimize resources on global networks like rail or transportation systems, small improvements in efficiency lead to both operating expense reductions and reductions in the equipment required to power those same networks. This is the ripple effect of network-level resource optimiza-tion and one of the benefits of fourth-generation industrial software systems. Fewer capital expen-ditures ultimately translate into less equipment manufacturing and lower resource and materials use associated with manufacturing operations.
When the Industrial Internet is used to optimize resources on global net-works like rail or transpor- tation systems, small improvements in efficiency lead to both operating expense reductions and reductions in the equip-ment required to power those same networks.
IV. POWERING THE FUTURE

34
IV. POWERING THE FUTURE
This is already happening today in the auto indus-try as a result of consumer-facing Internet-based carsharing services such as Uber, Lyft , and Sidecar. By increasing the average utilization of personal cars, these services have the secondary impact of decreasing automotive ownership for those individuals and households who use these ride- sharing platforms. According to a recent study that examined the impact of carsharing on household vehicle ownership, carsharing not only reduces the number of personal vehicles, it can also deter carless households from acquiring a vehicle.27 The study was based on a sample of 6,281 households in 20 major metropolitan regions with access to carsharing services throughout North America. The study found that some carsharing members who consider buying a car ultimately decide against it and use carsharing instead.
The key here is that Internet-enabled software platforms can facilitate greater utilization of the existing automotive fleet , which ultimately leads to a decrease in demand for cars. This is the same effect that the Industrial Internet is now having on industrial operations. For example, Norfolk Southern is using GE’s Industrial Internet Movement Planner software to manage Norfolk Sothern’s rail-way system. According to Deborah Butler, Norfolk Southern’ s chief information officer, her railroad has seen a 6.3 percent reduction in fuel usage and 10–20 percent increases in velocity by installing Movement Planner on its network. Most impor-tantly, better velocity also means better capital utilization—when trips are faster, the railroad needs less capital equipment to operate them.
GE’s Flight Efficiency Services offers the same net-work-level optimization benefits as Movement Planner. Likewise, GE’s Grid IQ Insight solution improves the reliability of electricity networks. These Industrial Internet solutions hold the promise of reduced capital requirements as a result of increased operational
efficiency. Another GE Industrial Internet solution, GE LifeMax™ Advantage, achieves the same effect by working to directly extend hardware life and avoid the materials use associated with manu-facturing new equipment. The LifeMax Advantage platform is a blended suite of hardware and soft-ware solutions that help extend the life of GE gas turbine assets. Thus, either through operational efficiency improvements or direct life extensions, the Industrial Internet opens up a new world of possibilities for reducing capital requirements and their associated environmental impact .
© 2014 General Electric Company. All rights reserved.This material may not be copied or distributed in whole or in part without prior permission of the copyright owner.

35© 2014 General Electric Company. All rights reserved.This material may not be copied or distributed in whole or in part without prior permission of the copyright owner.
V. CONCLUSIONThese examples represent a handful of hardware and software solutions within GE’s ecomagination portfolio. Whether it’s reduced jet fuel consump-tion, lower natural gas use, diesel fuel savings, reductions in water consumption, or increases in wind power—each of these solutions provides direct benefits that enhance resource productivity. And this is just a sampling, with many more inno-vations on the horizon. That’s the most exciting part—the journey has just begun. A new world of possibilities is being unlocked through the Industrial Internet . Software solutions commer-cially available and under development are just the tip of the iceberg. That’s why we believe that the integration of ecomagination hardware and software has the potential to double the future rate of resource productivity improvement .
At GE, we are excited about the opportunity to play a role in helping to confront the global resource challenge. Today we are embarking upon a new frontier of digital resource productivity by expand-ing ecomagination to encompass GE’s Predictivity suite of solutions. Join us as we help transform the future of global resource productivity.
We are embarking upon a new frontier of digital resource produc-tivity by expanding ecomagination to encompass GE’s Predictivity™ suite of solutions. Join us as we help transform the future of global resource productivity.
V. CONCLUSION

DIGITAL RESOURCE PRODUCTIVITY
1. Organization for Economic Co-operation and Development (OECD), “OECD Environmental Outlook to 2030, Summary in English” (2008), Page 7.
2. GE and Accenture, “Industrial Internet Insights for 2015” (2014).
3. John Bruner, “The Industrial Internet: The Machines are Talking” (O’Reilly Media, 2013), Page 32.
4. Krausmann et al., “Growth in global materials use, GDP and population during the 20th century,” Ecological Economics 68, no. 10 (2009): 2696–2705. Data version 1.2, revised August 2011.
5. 1 quadrillion Btu is equivalent to 1.05 million terajoules (TJ).
6. US Energy Information Administration (EIA), International Energy Statistics, available at http://www.eia.gov/cfapps/ipdbproject/IEDIndex3.cfm, accessed August 26, 2014.
7. World Bank, Commodity Price Data (The Pink Sheet), updated August 4, 2014.
8. OECD, “OECD Environmental Outlook,” Page 7.
9. World Resources Institute (WRI), Aqueduct project. http://www.wri.org/our-work/project/aqueduct.
10. Dobbs et al., “Resource Revolution: Meeting the world’s energy, materials, food, and water needs” (McKinsey Global Institute, McKinsey & Company, 2011).
11. Dobbs et al., “Resource Revolution,” Page 2.
12. OECD, “OECD Environmental Outlook,” Page 6.
13. Ibid., Page 7.
14. Dobbs et al., “Resource Revolution,” Page 10.
15. Dobbs et al. does highlight some synergies between hardware and software that contribute to the productivity improvements they identify.
16. Specific events from the history of the Internet were taken from the Computer History Museum’s “A History of the Internet (1962–1992),” available at http://www.computerhistory.org/internet_history/, accessed September 29, 2014.
17. Peter H. Spitz, ed., The Chemical Industry at the Millennium: Maturity, Restructuring and Globalization (Chemical Heritage Foundation, 2003), Page 175.
18. https://www.isc.org/solutions/survey/history, accessed September 29, 2014.
19. http://www.computerworld.com/article/2513110/data-center/scientists-calculate-total-data-stored-to-date--295--exabytes.html, accessed September 29, 2014.
20. http://share.cisco.com/internet-of-things.html, accessed September 29, 2014.
21. GE and Accenture, “Industrial Internet Insights for 2015.”
22. International Civil Aviation Organization (ICAO), “Environmental Report: Aviation Outlook” (2010), Page 32.
23. Energy Information Administration (EIA), “International Energy Outlook 2013” (2014). Global energy use by sector data is available at http://www.eia.gov/tools/faqs/faq.cfm?id=447&t=1, accessed September 29, 2014.
24. International Energy Agency (IEA), “Transport, Energy and CO2: Moving Toward Sustainability” (2009), Page 277.
25. OECD, “Environmental Outlook to 2050: Key Findings on Water” (2012), Page 1.
26. IEA, “Technology Roadmap: Wind Energy” (2013), 10. IEA’s estimate of 527 TWh for 2012 was increased to 600 TWh based on the increase in global wind capacity between 2012 (282 GW) and 2013 (318 GW).
27. Elliott Martin and Susan Shaheen, “The Impact of Carsharing on Household Vehicle Ownership,” ACCESS 28 (Spring 2011).
NOTES

Copyright © 2014 General Electric
All rights reserved. No parts of this publication may be reproduced or transmitted in any form or by any means, electronical or mechanical, including photocopy, recording, or any information storage and retrieval system, without prior permission in writing from GE.