digging into the data to learn more about low performing student with disabilities
DESCRIPTION
Digging Into the Data to Learn More About Low Performing Student with Disabilities. Sheryl Lazarus Successfully Transitioning Away from the 2% Assessment Meeting Atlanta, GA February 11-12, 2014. Overview and Purpose. - PowerPoint PPT PresentationTRANSCRIPT

Digging Into the Data to Learn More About Low Performing
Student with Disabilities
Sheryl Lazarus
Successfully Transitioning Away from the
2% Assessment MeetingAtlanta, GA
February 11-12, 2014
National Center on Educational Outcomes (NCEO)

This presentation will describe how a few states are using data to learn more about low performing students with disabilities.
National Center on Educational Outcomes (NCEO)
Overview and Purpose
As you listen to this presentation, think about how your state might look at its own data to learn more about the students participating in the AA-MAS.


Some Questions States Had
National Center on Educational Outcomes (NCEO)
• What are the characteristics of low performing students?
• Is it an assessment issue or an instructional issue? o And, if it’s an assessment issue—is a new test
needed or more universally accessible general assessments?
o If it’s an instructional issue, is the issue—access to the content? . . . IEP teams that don’t know how to write and implement standards-based IEPs?. . .an accommodations issue? . . .

Longitudinal Analysis of State Data Sets
National Center on Educational Outcomes (NCEO)

Male Students
Source: Lazarus, Wu, Altman, & Thurlow (2010)
Reading, Grades 5 and 8

Minority
Source: Lazarus, Wu, Altman, & Thurlow (2010)
Reading, Grades 5 and 8

Free-Reduced Lunch
Source: Lazarus, Wu, Altman, & Thurlow (2010)
Reading, Grades 5 and 8

Special Education
.
Reading, grades 5 and 8
Source: Lazarus, Wu, Altman, & Thurlow (2010)

Percentage of Low Performing (LP) Students Who Stay or Move Out of LP Across Three Years
Legend: Dark Purple: PLP; Medium Purple: move in and out; Light Purple: first year only
Source: Lazarus, Wu, Altman, & Thurlow, (2010)

.
Digging Deeper
Individual State Analyses and Studies

Digging Deeper
Accommodations Issues
National Center on Educational Outcomes (NCEO)
Additional Individual State Analyses and Studies
•South Dakota
•Alabama

Digging Deeper
South Dakota
Source: Wu, Thurlow, Lazarus, Christian, & Turner (2011)Source: Wu, Lazarus, Thurlow, & Turner (2010)
Average Number of Accommodations by Performance Group

.
Average Number of Accommodations by Placement
Source: Wu, Lazarus, Thurlow & Turner (2010)

Qualitative Studies
• Cognitive Labs
• Focus Groups (Test Administrators)
National Center on Educational Outcomes (NCEO)

Student Performance
Source: Lazarus, Thurlow, Rieke, Halpin & Dillon (2012)

Number of Students Who Performed at Selected Levels With and Without the
Read Aloud Accommodation
.
Source: Lazarus, Thurlow, Rieke, Halpin & Dillon (2012)

Focus Groups
Purpose: The study sought to learn more about test administrators’ perceptions of the read-aloud accommodation.
Research questions:
1. What are appropriate practices in administration of the read-aloud accommodation?
2. How does the read-aloud accommodation benefit students?
3. What differences exist in the use of the read-aloud accommodation in math versus other content areas (e.g. reading, science)?
4. What differences exist between the read-aloud accommodation and other accommodations for students?
Source: Hodgson, Lazarus, Price, Altman, & Thurlow (2012)
.
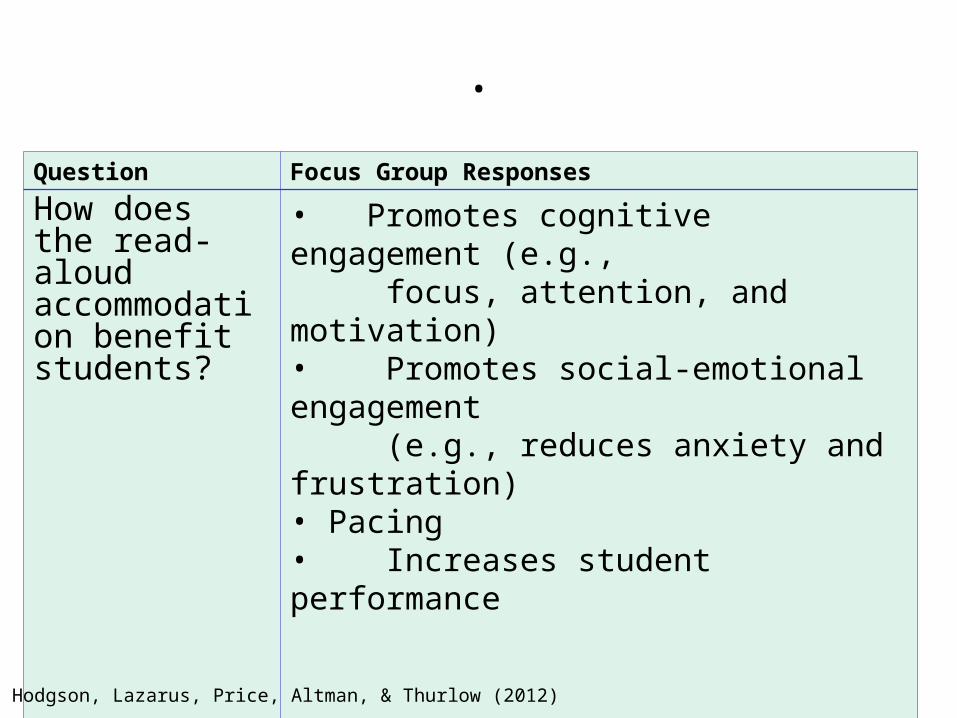
Question Focus Group Responses
How does the read-aloud accommodation benefit students?
• Promotes cognitive engagement (e.g., focus, attention, and motivation)• Promotes social-emotional engagement (e.g., reduces anxiety and frustration)• Pacing• Increases student performance
Source: Hodgson, Lazarus, Price, Altman, & Thurlow (2012)

Digging Deeper
Alabama
•Which factors influence IEP team decisions about how accommodations are used for instruction and assessment?
•Are there differences in the factors and considerations identified by respondents for selecting instructional and assessment accommodations?
•What are the most frequently used accommodations for instruction and assessment?
Source: Altman, et al. (2010)
Research Questions
Survey –Special Education Teachers

Special education teachers were asked to select three factors that influenced IEP decisions about accommodations used on statewide assessments
Source: Altman, et al. (2010)

Online Accommodations Training Modules
Available at: https://nceo.umn.edu/alabama/login.php

.
Fast Forward a Few Years . . . .

.
Lessons Learned in Federally Funded Projects That Can Improve the Instruction and Assessment
of Low Performing Students with Disabilities
• Summarizes findings of 14 projects involving 26 states.
• Projects funded by the U.S. Department of Education in 2006-2007 under three funding sources (General Supervision Enhancement Grants, Enhanced Assessment Grants, and Supplemental Funding)
Source: Thurlow, Lazarus & Bechard (Eds.) (2013)

ELLs with Disabilities
Example from One State
•State wanted to learn more about the characteristics of ELLs with disabilities
•Discovered data limitations– Data not collected for some relevant
variables
– Data silos (Special Education, ELL)
•State made revisions to its system so that better data will be available in the future
National Center on Educational Outcomes (NCEO)

National Center on Educational Outcomes (NCEO)
What questions do you have about low performing students with disabilities or the assessments they
take that data might help answer?
(If you need a some ideas, see handout for a few suggestions.)

For More Information
National Center on Educational Outcomes (NCEO)
www.nceo.info
Sheryl [email protected]

.
References(Available at www.nceo.info)
Hodgson, J.R., Lazarus, S.S., Price, L.M., Altman, J.R., & Thurlow, M.L. (2012). Test administrators’ perspectives on the use of the read aloud accommodation in math on state tests for accountability. (Technical Report 66). Minneapolis, MN: University of Minnesota, National Center on Educational Outcomes.
Lazarus, S.S., Thurlow, M.L., Rieke, R., Halpin, D. & Dillon, T. (2012). Using cognitive labs to evaluate student experiences with the read aloud accommodation in math. (Technical Report 67). Minneapolis, MN: University of Minnesota, National Center on Educational Outcomes.
Lazarus, S.S., Wu, Y., Altman, J., & Thurlow, M.L. (2010). The characteristics of low performing students on large-scale assessments (NCEO Brief). Minneapolis MN: University of Minnesota, National Center on Educational Outcomes
Thurlow, M.L., Lazarus, S.S. & Bechard, S. (Eds.) (2013). Lessons learned in federally funded projects that can improve the instruction and assessment of low performing students with disabilities. Minneapolis, MN: University of Minnesota, National Center on Educational Outcomes.
Wu, Y., Lazarus, S.S., Thurlow, M.L., & Turner, L. (2010). What have we learned about student characteristics, accommodations, and AA-MAS? Paper presented at the American Education Research Association (AERA) Annual Conference, Denver CO, April 30-May 4.