differences in regional brain responses to food ingestion
TRANSCRIPT
Differences in Regional BrainResponses to Food Ingestion AfterRoux-en-Y Gastric Bypass andthe Role of Gut Peptides:A Neuroimaging StudyDiabetes Care 2016;39:1787–1795 | DOI: 10.2337/dc15-2721
OBJECTIVE
Improved appetite control, possibly mediated by exaggerated gut peptide re-sponses to eating, may contribute to weight loss after Roux-en-Y gastric bypass(RYGB). This study compared brain responses to food ingestion between post-RYGB (RYGB), normal weight (NW), and obese (Ob) unoperated subjects andexplored the role of gut peptide responses in RYGB.
RESEARCH DESIGN AND METHODS
Neuroimaging with [18F]-fluorodeoxyglucose (FDG) positron emission tomogra-phy was performed in 12 NW, 21 Ob, and 9 RYGB (18 6 13 months postsurgery)subjects after an overnight fast, once FED (400 kcal mixedmeal), and once FASTED,in random order. RYGB subjects repeated the studies with somatostatin infusionand basal insulin replacement. Fullness, sickness, and postscan ad libitum mealconsumption were measured. Regional brain FDG uptake was compared usingstatistical parametric mapping.
RESULTS
RYGB subjects had higher overall fullness and food-induced sickness and lower adlibitum consumption. Brain responses to eating differed in the hypothalamus andpituitary (exaggerated activation in RYGB), left medial orbital cortex (OC) (activa-tion in RYGB, deactivation in NW), right dorsolateral frontal cortex (deactivation inRYGB and NW, absent in Ob), and regions mapping to the default mode network(exaggerated deactivation in RYGB). Somatostatin in RYGB reduced postprandialgut peptide responses, sickness, and medial OC activation.
CONCLUSIONS
RYGB induces weight loss by augmenting normal brain responses to eating inenergy balance regions, restoring lost inhibitory control, and altering hedonicresponses. Altered postprandial gut peptide responses primarily mediatechanges in food-induced sickness and OC responses, likely to associate withfood avoidance.
1Division of Diabetes and Nutritional Sciences,King’s College London, London, U.K.2King’s College Hospital NHS Foundation Trust,London, U.K.3Division of Imaging Sciences and BiomedicalEngineering, King’s College London, London, U.K.4Diabetes Complications Research Centre, Con-way Institute, University College Dublin, Dublin,Ireland5Investigative Science, Imperial College London,London, U.K.6North Middlesex University Hospital, London,U.K.
Corresponding author: Katharine F. Hunt, [email protected].
Received 16 December 2015 and accepted 8June 2016.
This article contains Supplementary Data onlineat http://care.diabetesjournals.org/lookup/suppl/doi:10.2337/dc15-2721/-/DC1.
© 2016 by the American Diabetes Association.Readers may use this article as long as the workis properly cited, the use is educational and notfor profit, and the work is not altered. More infor-mation is available at http://www.diabetesjournals.org/content/license.
Katharine F. Hunt,1,2 Joel T. Dunn,3
Carel W. le Roux,4,5 Laurence J. Reed,6
Paul K. Marsden,3 Ameet G. Patel,2 and
Stephanie A. Amiel1,2
Diabetes Care Volume 39, October 2016 1787
PATH
OPHYSIO
LOGY/COMPLIC
ATIO
NS
Roux-en-Y gastric bypass (RYGB) causesweight loss, improves metabolic param-eters, and reduces premature mortality(1), with little evidence of restriction ofmeal size or malabsorption (2). Sensationsof fullness are increased and food con-sumption reduced (3,4). Understandingchanges in gut-to-brain signaling and brainfunctionmediating theseeffectswould im-proveunderstandingofweight control andweight loss and may help develop novelapproaches to preventing and treatingobesity.Altered gut-to-brain signaling after
RYGB may be mediated by gut peptides(2). Glucagon-like peptide 1 (GLP-1) andpeptide YY (PYY) provide satiety signals.RYGB increases their postprandial re-sponses (2,5). The somatostatin analogoctreotide inhibits gut peptide secre-tion, increases food intake, reduces sa-tiety, and alters appetitive behaviorafter RYGB (6,7).In functional neuroimaging, surro-
gates are used to image regional brainactivity. In [18F]-fluorodeoxyglucosepositron emission tomography (FDG-PET), 18FDG is taken up as native glucoseand phosphorylated but not metabo-lized further, accumulating within cells(8). Brain FDG uptake correlates withbrain glucose metabolic rate, a markerfor brain activity. Comparing FDG-PETimages can therefore identify regionsof altered neuronal activation withoutpreconceived hypotheses. FDG-PET issuited to imaging responses to slowlychanging physiological stimuli, such aseating, but has not previously beenused for this. Other functional neuroimaging modalities have been used toinvestigate bariatric surgery (mainlyRYGB). Two dopamine receptor radioli-gand PET studies, imaging only path-ways using the ligand receptor, gaveconflicting results (9,10). FunctionalMRI (fMRI) studies of responses tofood cues (rather than food ingestion)have described reduced responses in re-gions including the dorsal striatum (re-ward), dorsolateral frontal cortex (DLFC)(inhibitory control), precuneus, andposterior cingulate in the fed state(11,12); and, examining predefined re-gions of interest in the fasted state, inthe orbitofrontal cortex (OFC) andamygdala, with evidence that octreotideincreases responses to food picturesin the fed state without affecting full-ness (7,13). One fMRI study reported
differences in response to oral glucosebetween lean and obese subjects in thehypothalamus, OFC, and somatosen-sory cortex were partially reversed afterRYGB (4).
The aim of our study was to use FDG-PET neuroimaging to identify regionswhere brain responses to food ingestionwere different between post-RYGB(RYGB), normal weight (NW), and obese(Ob) unoperated subjects and investi-gate the effect of using somatostatinto inhibit gut peptide responses inRYGB.
RESEARCH DESIGN AND METHODS
This research was approved by TheRoyal Marsden Research Ethics Commit-tee (08/H0801/152) and the Administra-tion of Radioactive Substances AdvisoryCommittee (261-1945[23765]) and con-ducted in accordance with the Declara-tion of Helsinki (2008).
Participants and RecruitmentRight-handed adults were recruitedfrom obesity and bariatric surgery clinicsat King’s College Hospital and by e-mailadvertisement to students and staff atKing’s College London in three groups:NW (BMI 20–25 kg/m2), Ob (BMI 30–40 kg/m2), and RYGB ($3 months afterRYGB,$10% excess weight loss, currentBMI 25–40 kg/m2). Exclusion criteria in-cluded contraindications to PET or MRI;pregnancy, planning pregnancy, breast-feeding; glucose .15 mmol/L during75 g oral glucose tolerance test (NWand Ob) or .11 mmol/L after 400 kcaltest meal (RYGB); glucose-loweringmedications (metformin permitted);significant brain disorder; use of psycho-tropic medication.
Study DesignNW and Ob underwent five visits:screening, 75 g oral glucose tolerancetest, two PET scanning visits (FASTEDand FED in random order), and a struc-tural MRI brain scan (Philips Achieva3.0 T scanner). RYGB underwent sevenvisits: screening, 400 kcal test meal(to determine capacity to consumethe meal and glucose response), fourPET scanning visits (placebo-FASTED,placebo-FED, somatostatin-FASTED, andsomatostatin-FED in random order) anda MRI brain scan. Subjects underwent adummy PET scan to diminish the effect ofthe first study (14).
FDG-PET VisitsFDG-PET visits were performed afterovernight fasting (.9 h), with water al-lowed. Premenopausal women werescanned in the first 10 days of their cycle.Arm intravenous catheters were sited. AtRYGB-somatostatin (RYGBss) visits, intra-venous infusions of somatostatin (Actavisor Eumedica, 0.1 mg/kg/min) (15,16)and soluble human insulin (Actrapid,in 4% autologous blood solution, 3.6mU/m2
body surface area/min; Novo Nordisk)were started at 295 min and contin-ued throughout. At RYGB-placebo(RYGBpl) visits, 0.9% saline was infused.Participants were blind to infusion con-tent. If nausea developed, the somato-statin infusion was reduced to 70%. Ifvenous plasma glucose (VPG) fell below3.8 mmol/L, 20% glucose was infused tomaintain at 4–4.5 mmol/L.
For FED studies, subjects consumed a400 kcal meal (Haagen-Dazs vanilla icecream, fat 27 g, carbohydrate 32 g, pro-tein 8 g) starting at25 min (NW and Obafter 20-min rest, RYGB after 90-min in-fusion). Three RYGB subjects unable toconsume the 400 kcal test meal weregiven the amount tolerated (220–256kcal). FDG (90 MBq) was injected intra-venously 15 min after meal completionin FED studies or equivalent time inFASTED. Scanning commenced at +55 minfor 15 min (GE Discovery PET scanner,15.8-cm axial field of view; GE MedicalSystem). A low-dose computed tomog-raphy brain scan was taken for attenu-ation correction.
After each PET scan, subjects under-went a 1-h ad libitum meal (6) in which100 kcal ice cream was presented every5 min, and subjects were instructed toeat until they felt full. Subjects ratedfullness and sickness on visual analogscales (VAS) at 2105 min (RYGB only),27 min, +10 min, and +80 min (6). Ve-nous blood was taken for insulin, GLP-1,PYY, glucose-dependent insulinotropicpolypeptide (GIP), and glucagon at2100 min (RYGB), 210 min, +30 min,and +80 min and for glucose every 5 to15 min. Plasma glucose was analyzedimmediately (YSI 2300 Stat analyzer).Serum insulin was measured by chem-iluminometric immunoassay (AdviaCentaur; Seimens) and gut peptidesGLP-1 and GIP by ELISA (Millipore)and PYY and glucagon by radioimmu-noassay (Millipore).
1788 Brain Responses to Food Ingestion After RYGB Diabetes Care Volume 39, October 2016
Statistical AnalysisStatistical analyses used SPSS 22 soft-ware (IBM). P # 0.05 was consideredsignificant. Uncorrected P values are re-ported. Continuous demographic datawere compared using one-way ANOVAwith post hoc comparisons, and categor-ical data were compared using theFisher exact test. Mixed ANOVA wasused for analysis of VAS fullness, ad libi-tum consumption, glucose, insulin, andgut peptide data. For significant interac-tions between fed state and group, posthoc comparisons for differences be-tween groups in “FED effect” (FED mi-nus FASTED) were performed using theFisher least significant difference test. Ifthere was no interaction, main effectsof fed state and group are reported.For the effect of somatostatin inRYGB, within–within-subjects ANOVAwas used. Kruskal-Wallis and Wilcoxonsigned-rank tests were used to comparenonnormally distributed sickness VAS.
FDG-PET Neuroimaging AnalysisDifferences in FDG uptake betweenscans were analyzed using StatisticalParametric Mapping (SPM8) (www.fil.ion.ucl.ac.uk). Images were recon-structed using the filtered back-projectionalgorithm. Images were acquired dy-namically (15 3 1 min frames), andframes showing motion were removed.Images were spatially normalized toMontreal Neurological Institute spaceusing each subject’s structural MRI.MRI was not available in one NW andone Ob subject, and mean PET imageswere warped directly to Montreal Neu-rological Institute space using the SPMPET template. Images were smoothedwith a Gaussian kernel of 8 mm. Thecerebellum (Tziortzi atlas [17]) was ex-cluded from further analysis. Globaldifferences in FDG uptake betweenscans were removed by normalizingvoxel values to the mean gray-mattervalue for each scan, scaled to 100. Whitematter was masked out by includingvoxels with values .60% mean andgray-matter probability.30%. The pitu-itary (defined by MRI template) and hy-pothalamus (Baroncini et al. [18]) weremasked in.Images were compared to identify
clusters with significant differences usingmixed ANOVA in SPM. For paired tests(effect of fed state), clusters of voxelswere considered to show significant
effect at voxel level P, 0.001 and clus-ter level P, 0.05 (corrected for family-wise error). For interactions betweenfed state and group, clusters were con-sidered to show significant interactionwith cluster size .100 voxels and twovoxel level thresholds: P , 0.01 (liberal)and P, 0.001 (stringent). Clusters werelocalized using the Tziortzi atlas (17)modified to include the pituitary andhypothalamus.
For clusters identified in SPM with asignificant interaction between fedstate and group, mean normalized voxelvalues were extracted for each clusterfor all scans and food-evoked signalchange (FESC) (FED minus FASTED) wascalculated. For each cluster, the natureof the difference in FESC betweengroups was analyzed using the Fisherleast significant difference test in SPSSand the effects of somatostatin in RYGBusing paired t tests. Exploratory Spear-man correlational analyses were per-formed between FESC and ad libitummeal consumption at the FASTED visit(i.e., in the fasted state), FED effect+10 min fullness and sickness, and FEDeffect +30 min insulin and gut peptides.
RESULTS
ParticipantsThe study included 12 NW, 21 Ob, and9 RYGB subjects, with a mean 6 SD ageof 34.4 6 11.5 years (RYGB subjectswere older), with no significant between-group differences in sex, ethnicity, or sys-tolic blood pressure (Table 1). RYGBsubjects were 18 6 12.6 months afterRYGB, having lost 30.9 6 8.5% of theirpreoperative weight. BMI was not dif-ferent between Ob and RYGB. HOMA2-insulin resistance, reflecting fastinginsulin resistance (19), was not differentbetween NW and RYGB but was higherin Ob. Medications included metformin(one Ob, one RYGB), orlistat (two Ob,one RYGB), and topiramate (one RYGB).
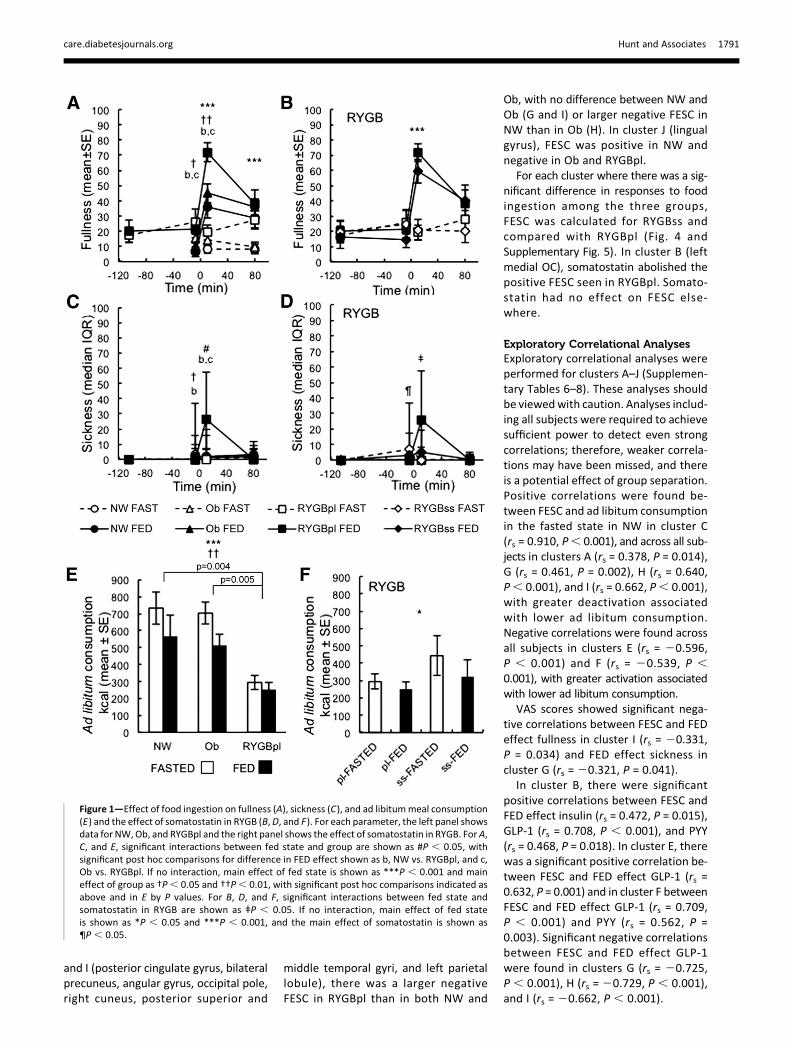
VAS for Fullness and SicknessAt27 min, VAS scores for fullness werehigher in RYGBpl than in NW or Ob,which were not different (Fig. 1). Acrossgroups, fullness was higher in FED ver-sus FASTED at +10 and +80 min. The nu-merically greater FED effect on fullnessat +10 min in RYGBpl did not reach sig-nificance (P = 0.14), although fullnessscores at +10minwere higher, irrespectiveof fed state, in RYGBpl compared with
NW and Ob. Somatostatin had no sig-nificant effect on fullness at27 min oron responses to food ingestion at +10or +80 min.
VAS scores for sickness were higherin NW versus RYGBpl at 27 min. At+10 min, sickness was higher in FED ver-sus FASTED in RYGBpl but not in NW orOb. Somatostatin was reduced in twoRYGB subjects due to nausea. Despitethis, sickness scores were higher withsomatostatin at 27 min. However, so-matostatin attenuated the increase insickness at +10 min in FED versusFASTED (median FED effect RYGBpl +26points, RYGBss +5 points; P = 0.05).
Ad Libitum MealSubjects consumed less at FED versusFASTED, with no significant between-group differences in the effect of the fedstate on the amount consumed (Fig. 1).Regardless of fed state, RYGBpl consumedless than NW and Ob. Ad libitum con-sumption in RYGBpl was (mean 6 SE)2726 38 kcal vs. 3716 99 kcal in RYGBss(P = 0.27 for main effect of somatostatin).
Glucose, Insulin, and Gut PeptidesMean VPG between 0 to +80 min washigher in FED versus FASTED, with nobetween-group differences (P = 0.214for interaction, P , 0.001 for main ef-fect fed state, and P = 0.166 for maineffect group): (mean 6 SD) NW-FASTED,4.9 6 0.4 mmol/L; NW-FED, 5.1 60.5mmol/L;Ob-FASTED,5.060.3mmol/L;Ob-FED, 5.560.6mmol/L; RYGBpl-FASTED4.7 6 0.5 mmol/L; RYGBpl-FED, 5.2 60.9 mmol/L; RYGBss-FASTED, 4.3 6 0.3mmol/L; and RYGBss-FED, 5.4 6 0.7mmol/L. There was no difference betweensomatostatin and insulin versus placeboon the FED effect (P = 0.152 for interaction)or VPG irrespective of fed state (P = 0.675for main effect). The highest VPG was7.9 mmol/L.
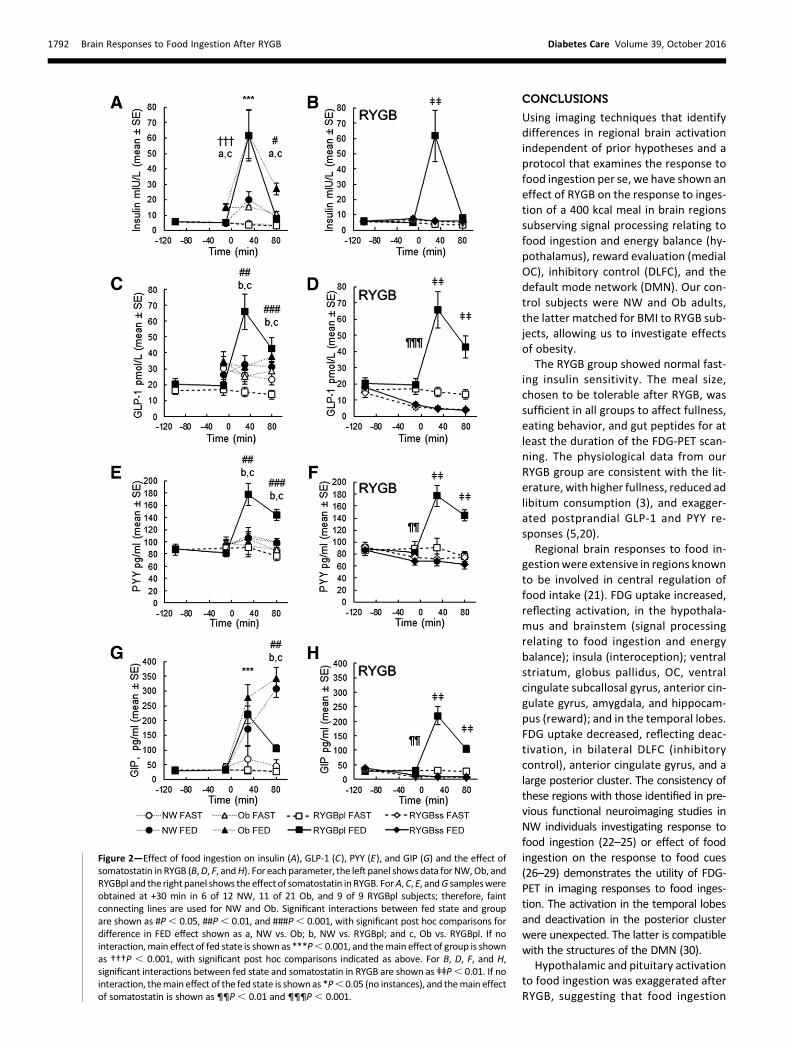
Insulin was higher at 210 min in Obversus NW or RYGBpl, and at +30 min inFED versus FASTED across all groups (Fig.2). Insulin was not different at +80 minbetween NW and RYGBpl, but remainedhigher in Ob, with a greater FED effectand higher concentrations overall.
There were no between-group differ-ences inGLP-1, PYY, GIP (Fig. 2) or glucagon(not shown) at 210 min. Between-groupdifferences were found in FED effect onGLP-1 and PYY at +30 and +80 min, whichwere larger in RYGBpl than in NW or Ob.
care.diabetesjournals.org Hunt and Associates 1789
GLP-1 was higher in FED versus FASTEDat +30 and +80 min in all groups (not sig-nificant in NW +30min). The FED effect onPYY was small in NW and Ob and statisti-cally significant only in NW at +80min. GIPwas higher in FED versus FASTED at+30 min, with no between-group differ-ences, and remained higher in all groupsat +80 min, with a smaller FED effect inRYGBpl. Glucagonwas higher in FED versusFASTED at +30 min, with no between-group differences in the FED effect andno between-state or between-group dif-ferences by +80 min.Somatostatin with insulin in RYGB
achieved no significant difference in in-sulin between placebo and somato-statin at210 min (85 min into infusions).GLP-1, PYY, GIP, and glucagon werelower with somatostatin at 210 min.Somatostatin abolished insulin, GLP-1,PYY, GIP, and glucagon responses tofood ingestion.
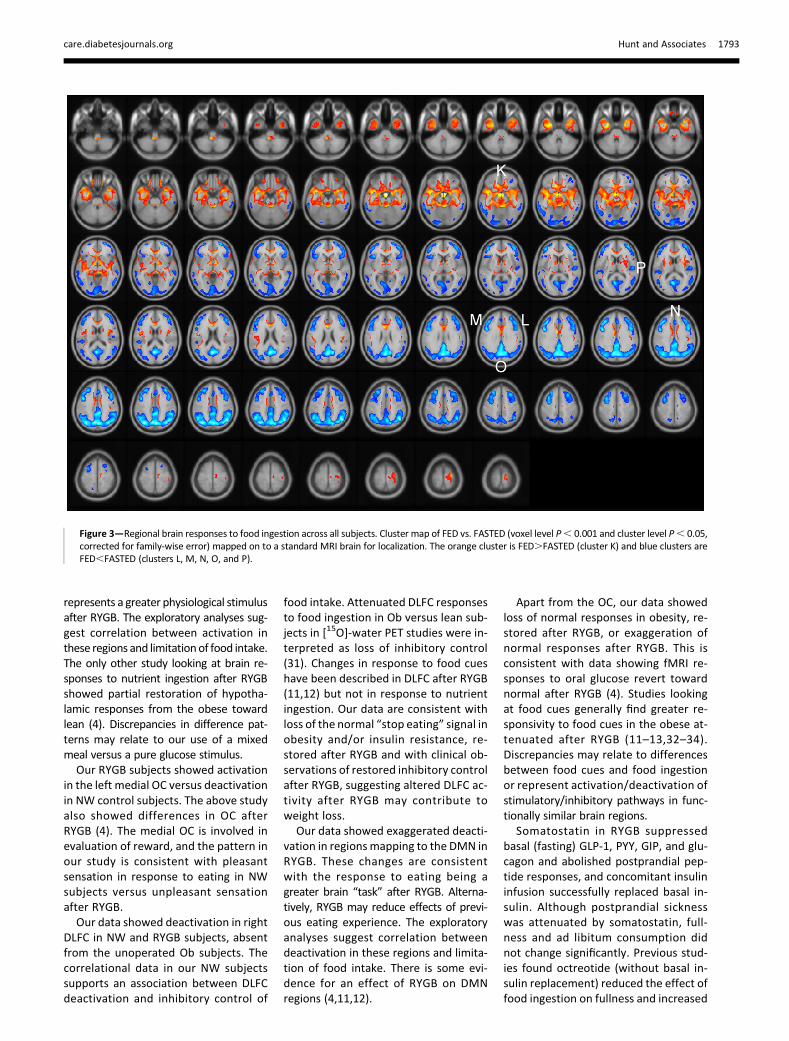
FDG-PET NeuroimagingSPM analysis for the main effect of thefed state across groups showed a singlelarge cluster (K) where FDG uptake washigher in FED versus FASTED and five
clusters (L-P) where FDG uptake waslower in FED versus FASTED (Fig. 3).
Cluster K (17,485 voxels) included thehypothalamus, ventral cingulate subcal-losal gyrus, anterior cingulate gyrus, bi-lateral ventral striatum, globus pallidus,temporal thalamus, insular cortex, or-bital cortex (OC), extensive regions inthe temporal lobes (including amyg-dala and hippocampus), and midbrain,pons, and medulla (SupplementaryTable 1).
Two FED,FASTED clusters (L, 5,079voxels; M, 4,571 voxels) included bilat-eral anterior and posterior DLFC, ex-tending into bilateral precentral gyrus,bilateral frontal operculum, and rightlateral OC. Cluster N (388 voxels) in-cluded anterior cingulate gyrus and dor-sal anterior cingulate gyrus. Clusters O(19,248 voxels) and P (200 voxels) in-cluded posterior cingulate gyrus, bilat-eral precuneus, and cuneus, extendingposteriorly to include bilateral calcarinecortex, lingual gyrus, occipital pole, andoccipital fusiform gyrus and laterallyto include bilateral parietal lobule, an-gular gyrus, supramarginal gyrus, parietaloperculum, central operculum (right), and
posterior temporal cortex (SupplementaryTable 2).
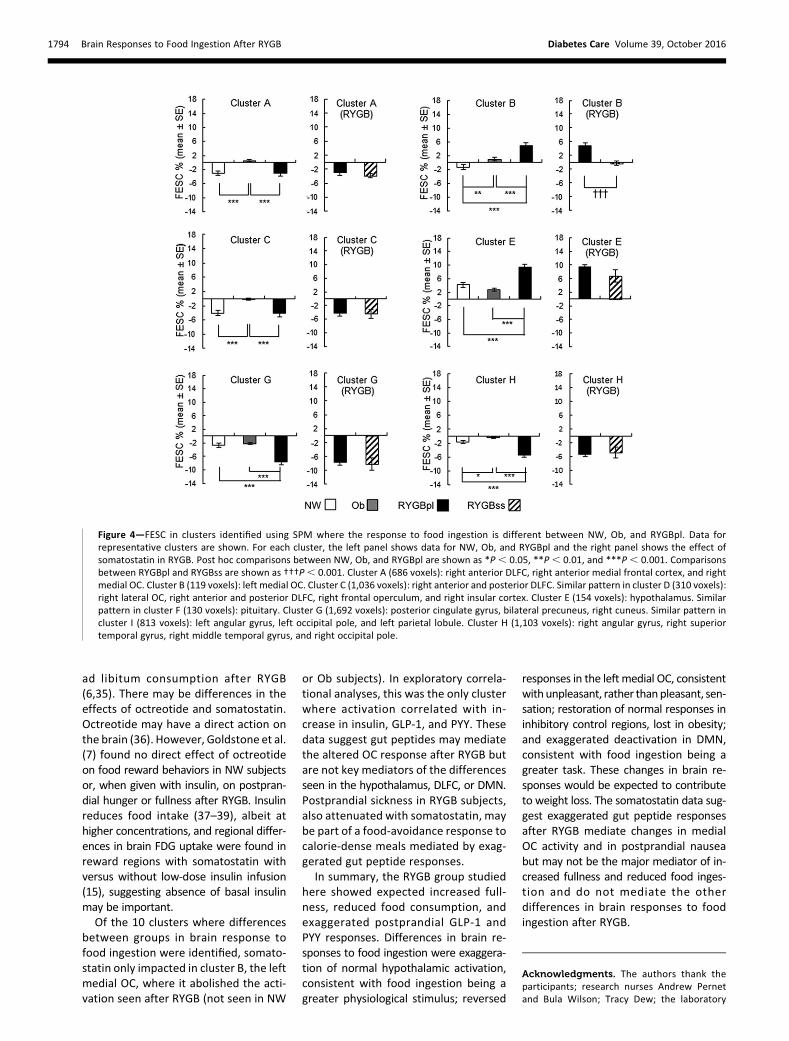
SPM analysis for interaction betweenfed state and group showed 10 clusters(A–J, voxel level P , 0.01, cluster sizethreshold 100 voxels) (SupplementaryFig. 3 and Supplementary Table 4). Amore stringent statistical threshold(voxel level P , 0.001) showed threeclusters corresponding to clusters C, F,and G (data not shown). Including ageas a covariate did not materially affectthe interaction clusters identified (datanot shown). For clusters A–J, FESC in NW,Ob, and RYGBpl are shown in Fig. 4 (repre-sentative clusters) and in SupplementaryFig. 5 (numerical data are reported inSupplementary Table 4). In E (hypothal-amus) and F (pituitary), FESC was largerin RYGBpl than in NW or Ob, with nodifference between NW and Ob. In A,C, and D (right DLFC, anterior medialfrontal cortex, medial and lateral OC,frontal operculum, and insular cortex),there was a similar negative FESC in NWand RYGBpl, absent in Ob. In B (left me-dial OC), there was a negative FESC inNW, with small positive FESC in Ob and alarger positive FESC in RYGBpl. In G, H,
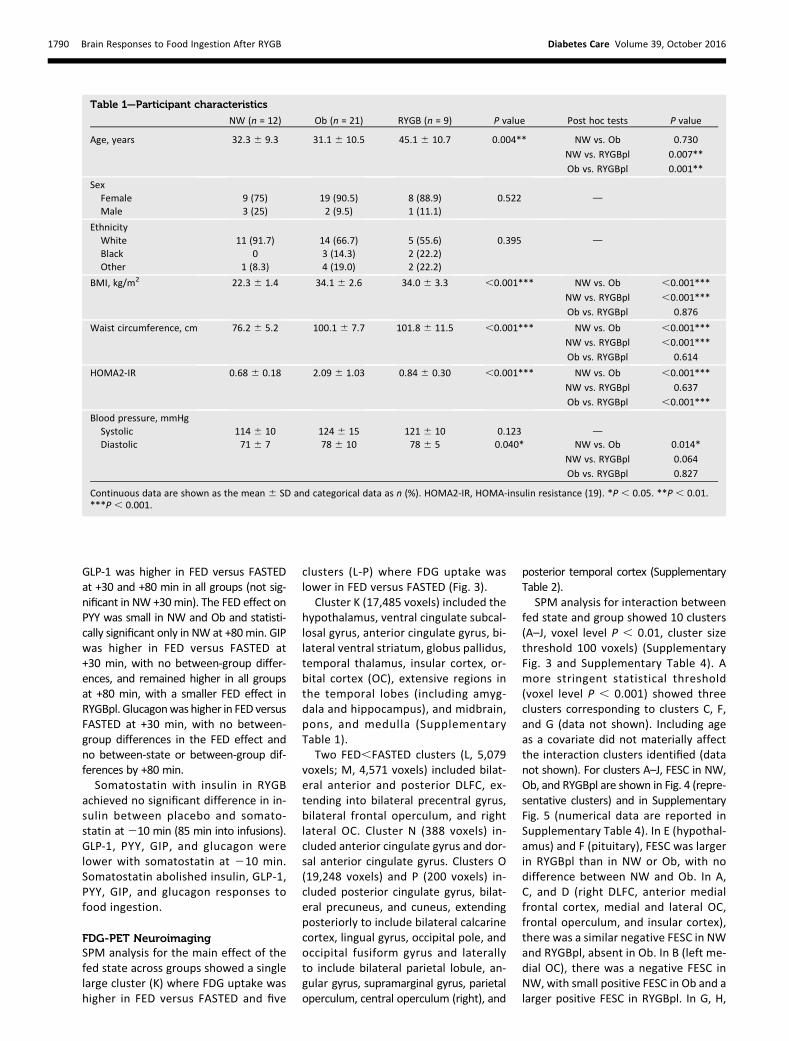
Table 1—Participant characteristics
NW (n = 12) Ob (n = 21) RYGB (n = 9) P value Post hoc tests P value
Age, years 32.3 6 9.3 31.1 6 10.5 45.1 6 10.7 0.004** NW vs. Ob 0.730
NW vs. RYGBpl 0.007**
Ob vs. RYGBpl 0.001**
SexFemale 9 (75) 19 (90.5) 8 (88.9) 0.522 dMale 3 (25) 2 (9.5) 1 (11.1)
EthnicityWhite 11 (91.7) 14 (66.7) 5 (55.6) 0.395 d
Black 0 3 (14.3) 2 (22.2)Other 1 (8.3) 4 (19.0) 2 (22.2)
BMI, kg/m2 22.3 6 1.4 34.1 6 2.6 34.0 6 3.3 ,0.001*** NW vs. Ob ,0.001***
NW vs. RYGBpl ,0.001***
Ob vs. RYGBpl 0.876
Waist circumference, cm 76.2 6 5.2 100.1 6 7.7 101.8 6 11.5 ,0.001*** NW vs. Ob ,0.001***
NW vs. RYGBpl ,0.001***
Ob vs. RYGBpl 0.614
HOMA2-IR 0.68 6 0.18 2.09 6 1.03 0.84 6 0.30 ,0.001*** NW vs. Ob ,0.001***
NW vs. RYGBpl 0.637
Ob vs. RYGBpl ,0.001***
Blood pressure, mmHgSystolic 114 6 10 124 6 15 121 6 10 0.123 dDiastolic 71 6 7 78 6 10 78 6 5 0.040* NW vs. Ob 0.014*
NW vs. RYGBpl 0.064
Ob vs. RYGBpl 0.827
Continuous data are shown as the mean 6 SD and categorical data as n (%). HOMA2-IR, HOMA-insulin resistance (19). *P , 0.05. **P , 0.01.***P , 0.001.
1790 Brain Responses to Food Ingestion After RYGB Diabetes Care Volume 39, October 2016
and I (posterior cingulate gyrus, bilateralprecuneus, angular gyrus, occipital pole,right cuneus, posterior superior and
middle temporal gyri, and left parietallobule), there was a larger negativeFESC in RYGBpl than in both NW and
Ob, with no difference between NW andOb (G and I) or larger negative FESC inNW than in Ob (H). In cluster J (lingualgyrus), FESC was positive in NW andnegative in Ob and RYGBpl.
For each cluster where there was a sig-nificant difference in responses to foodingestion among the three groups,FESC was calculated for RYGBss andcompared with RYGBpl (Fig. 4 andSupplementary Fig. 5). In cluster B (leftmedial OC), somatostatin abolished thepositive FESC seen in RYGBpl. Somato-statin had no effect on FESC else-where.
Exploratory Correlational AnalysesExploratory correlational analyses wereperformed for clusters A–J (Supplemen-tary Tables 6–8). These analyses shouldbe viewedwith caution. Analyses includ-ing all subjects were required to achievesufficient power to detect even strongcorrelations; therefore, weaker correla-tions may have been missed, and thereis a potential effect of group separation.Positive correlations were found be-tween FESC and ad libitum consumptionin the fasted state in NW in cluster C(rs = 0.910, P, 0.001), and across all sub-jects in clusters A (rs = 0.378, P = 0.014),G (rs = 0.461, P = 0.002), H (rs = 0.640,P, 0.001), and I (rs = 0.662, P, 0.001),with greater deactivation associatedwith lower ad libitum consumption.Negative correlations were found acrossall subjects in clusters E (rs = 20.596,P , 0.001) and F (rs = 20.539, P ,0.001), with greater activation associatedwith lower ad libitum consumption.
VAS scores showed significant nega-tive correlations between FESC and FEDeffect fullness in cluster I (rs = 20.331,P = 0.034) and FED effect sickness incluster G (rs = 20.321, P = 0.041).
In cluster B, there were significantpositive correlations between FESC andFED effect insulin (rs = 0.472, P = 0.015),GLP-1 (rs = 0.708, P , 0.001), and PYY(rs = 0.468, P = 0.018). In cluster E, therewas a significant positive correlation be-tween FESC and FED effect GLP-1 (rs =0.632, P = 0.001) and in cluster F betweenFESC and FED effect GLP-1 (rs = 0.709,P , 0.001) and PYY (rs = 0.562, P =0.003). Significant negative correlationsbetween FESC and FED effect GLP-1were found in clusters G (rs = 20.725,P , 0.001), H (rs = 20.729, P , 0.001),and I (rs = 20.662, P , 0.001).
Figure 1—Effect of food ingestion on fullness (A), sickness (C), and ad libitummeal consumption(E) and the effect of somatostatin in RYGB (B,D, and F). For each parameter, the left panel showsdata for NW,Ob, and RYGBpl and the right panel shows the effect of somatostatin in RYGB. ForA,C, and E, significant interactions between fed state and group are shown as #P , 0.05, withsignificant post hoc comparisons for difference in FED effect shown as b, NW vs. RYGBpl, and c,Ob vs. RYGBpl. If no interaction, main effect of fed state is shown as ***P , 0.001 and maineffect of group as †P, 0.05 and ††P, 0.01, with significant post hoc comparisons indicated asabove and in E by P values. For B, D, and F, significant interactions between fed state andsomatostatin in RYGB are shown as ǂP , 0.05. If no interaction, main effect of fed stateis shown as *P , 0.05 and ***P , 0.001, and the main effect of somatostatin is shown as¶P , 0.05.
care.diabetesjournals.org Hunt and Associates 1791
CONCLUSIONS
Using imaging techniques that identifydifferences in regional brain activationindependent of prior hypotheses and aprotocol that examines the response tofood ingestion per se, we have shown aneffect of RYGB on the response to inges-tion of a 400 kcal meal in brain regionssubserving signal processing relating tofood ingestion and energy balance (hy-pothalamus), reward evaluation (medialOC), inhibitory control (DLFC), and thedefault mode network (DMN). Our con-trol subjects were NW and Ob adults,the latter matched for BMI to RYGB sub-jects, allowing us to investigate effectsof obesity.
The RYGB group showed normal fast-ing insulin sensitivity. The meal size,chosen to be tolerable after RYGB, wassufficient in all groups to affect fullness,eating behavior, and gut peptides for atleast the duration of the FDG-PET scan-ning. The physiological data from ourRYGB group are consistent with the lit-erature, with higher fullness, reduced adlibitum consumption (3), and exagger-ated postprandial GLP-1 and PYY re-sponses (5,20).
Regional brain responses to food in-gestionwere extensive in regions knownto be involved in central regulation offood intake (21). FDG uptake increased,reflecting activation, in the hypothala-mus and brainstem (signal processingrelating to food ingestion and energybalance); insula (interoception); ventralstriatum, globus pallidus, OC, ventralcingulate subcallosal gyrus, anterior cin-gulate gyrus, amygdala, and hippocam-pus (reward); and in the temporal lobes.FDG uptake decreased, reflecting deac-tivation, in bilateral DLFC (inhibitorycontrol), anterior cingulate gyrus, and alarge posterior cluster. The consistency ofthese regions with those identified in pre-vious functional neuroimaging studies inNW individuals investigating response tofood ingestion (22–25) or effect of foodingestion on the response to food cues(26–29) demonstrates the utility of FDG-PET in imaging responses to food inges-tion. The activation in the temporal lobesand deactivation in the posterior clusterwere unexpected. The latter is compatiblewith the structures of the DMN (30).
Hypothalamic and pituitary activationto food ingestion was exaggerated afterRYGB, suggesting that food ingestion
Figure 2—Effect of food ingestion on insulin (A), GLP-1 (C), PYY (E), and GIP (G) and the effect ofsomatostatin in RYGB (B,D, F, andH). For each parameter, the left panel showsdata for NW,Ob, andRYGBpl and the right panel shows the effect of somatostatin in RYGB. ForA,C, E, andG sampleswereobtained at +30 min in 6 of 12 NW, 11 of 21 Ob, and 9 of 9 RYGBpl subjects; therefore, faintconnecting lines are used for NW and Ob. Significant interactions between fed state and groupare shown as #P, 0.05, ##P, 0.01, and ###P, 0.001, with significant post hoc comparisons fordifference in FED effect shown as a, NW vs. Ob; b, NW vs. RYGBpl; and c, Ob vs. RYGBpl. If nointeraction,main effect of fed state is shownas ***P, 0.001, and themain effect of group is shownas †††P , 0.001, with significant post hoc comparisons indicated as above. For B, D, F, and H,significant interactions between fed state and somatostatin in RYGB are shown as ǂǂP, 0.01. If nointeraction, themain effect of the fed state is shownas *P, 0.05 (no instances), and themain effectof somatostatin is shown as ¶¶P, 0.01 and ¶¶¶P, 0.001.
1792 Brain Responses to Food Ingestion After RYGB Diabetes Care Volume 39, October 2016
represents a greater physiological stimulusafter RYGB. The exploratory analyses sug-gest correlation between activation inthese regions and limitationof food intake.The only other study looking at brain re-sponses to nutrient ingestion after RYGBshowed partial restoration of hypotha-lamic responses from the obese towardlean (4). Discrepancies in difference pat-terns may relate to our use of a mixedmeal versus a pure glucose stimulus.Our RYGB subjects showed activation
in the left medial OC versus deactivationin NW control subjects. The above studyalso showed differences in OC afterRYGB (4). The medial OC is involved inevaluation of reward, and the pattern inour study is consistent with pleasantsensation in response to eating in NWsubjects versus unpleasant sensationafter RYGB.Our data showed deactivation in right
DLFC in NW and RYGB subjects, absentfrom the unoperated Ob subjects. Thecorrelational data in our NW subjectssupports an association between DLFCdeactivation and inhibitory control of
food intake. Attenuated DLFC responsesto food ingestion in Ob versus lean sub-jects in [15O]-water PET studies were in-terpreted as loss of inhibitory control(31). Changes in response to food cueshave been described in DLFC after RYGB(11,12) but not in response to nutrientingestion. Our data are consistent withloss of the normal “stop eating” signal inobesity and/or insulin resistance, re-stored after RYGB and with clinical ob-servations of restored inhibitory controlafter RYGB, suggesting altered DLFC ac-tivity after RYGB may contribute toweight loss.
Our data showed exaggerated deacti-vation in regions mapping to the DMN inRYGB. These changes are consistentwith the response to eating being agreater brain “task” after RYGB. Alterna-tively, RYGB may reduce effects of previ-ous eating experience. The exploratoryanalyses suggest correlation betweendeactivation in these regions and limita-tion of food intake. There is some evi-dence for an effect of RYGB on DMNregions (4,11,12).
Apart from the OC, our data showedloss of normal responses in obesity, re-stored after RYGB, or exaggeration ofnormal responses after RYGB. This isconsistent with data showing fMRI re-sponses to oral glucose revert towardnormal after RYGB (4). Studies lookingat food cues generally find greater re-sponsivity to food cues in the obese at-tenuated after RYGB (11–13,32–34).Discrepancies may relate to differencesbetween food cues and food ingestionor represent activation/deactivation ofstimulatory/inhibitory pathways in func-tionally similar brain regions.
Somatostatin in RYGB suppressedbasal (fasting) GLP-1, PYY, GIP, and glu-cagon and abolished postprandial pep-tide responses, and concomitant insulininfusion successfully replaced basal in-sulin. Although postprandial sicknesswas attenuated by somatostatin, full-ness and ad libitum consumption didnot change significantly. Previous stud-ies found octreotide (without basal in-sulin replacement) reduced the effect offood ingestion on fullness and increased
Figure 3—Regional brain responses to food ingestion across all subjects. Cluster map of FED vs. FASTED (voxel level P, 0.001 and cluster level P, 0.05,corrected for family-wise error) mapped on to a standard MRI brain for localization. The orange cluster is FED.FASTED (cluster K) and blue clusters areFED,FASTED (clusters L, M, N, O, and P).
care.diabetesjournals.org Hunt and Associates 1793
ad libitum consumption after RYGB(6,35). There may be differences in theeffects of octreotide and somatostatin.Octreotide may have a direct action onthe brain (36). However, Goldstone et al.(7) found no direct effect of octreotideon food reward behaviors in NW subjectsor, when given with insulin, on postpran-dial hunger or fullness after RYGB. Insulinreduces food intake (37–39), albeit athigher concentrations, and regional differ-ences in brain FDG uptake were found inreward regions with somatostatin withversus without low-dose insulin infusion(15), suggesting absence of basal insulinmay be important.Of the 10 clusters where differences
between groups in brain response tofood ingestion were identified, somato-statin only impacted in cluster B, the leftmedial OC, where it abolished the acti-vation seen after RYGB (not seen in NW
or Ob subjects). In exploratory correla-tional analyses, this was the only clusterwhere activation correlated with in-crease in insulin, GLP-1, and PYY. Thesedata suggest gut peptides may mediatethe altered OC response after RYGB butare not key mediators of the differencesseen in the hypothalamus, DLFC, or DMN.Postprandial sickness in RYGB subjects,also attenuated with somatostatin, maybe part of a food-avoidance response tocalorie-dense meals mediated by exag-gerated gut peptide responses.
In summary, the RYGB group studiedhere showed expected increased full-ness, reduced food consumption, andexaggerated postprandial GLP-1 andPYY responses. Differences in brain re-sponses to food ingestion were exaggera-tion of normal hypothalamic activation,consistent with food ingestion being agreater physiological stimulus; reversed
responses in the left medial OC, consistentwith unpleasant, rather thanpleasant, sen-sation; restoration of normal responses ininhibitory control regions, lost in obesity;and exaggerated deactivation in DMN,consistent with food ingestion being agreater task. These changes in brain re-sponses would be expected to contributeto weight loss. The somatostatin data sug-gest exaggerated gut peptide responsesafter RYGB mediate changes in medialOC activity and in postprandial nauseabut may not be the major mediator of in-creased fullness and reduced food inges-tion and do not mediate the otherdifferences in brain responses to foodingestion after RYGB.
Acknowledgments. The authors thank theparticipants; research nurses Andrew Pernetand Bula Wilson; Tracy Dew; the laboratory
Figure 4—FESC in clusters identified using SPM where the response to food ingestion is different between NW, Ob, and RYGBpl. Data forrepresentative clusters are shown. For each cluster, the left panel shows data for NW, Ob, and RYGBpl and the right panel shows the effect ofsomatostatin in RYGB. Post hoc comparisons between NW, Ob, and RYGBpl are shown as *P, 0.05, **P, 0.01, and ***P, 0.001. Comparisonsbetween RYGBpl and RYGBss are shown as †††P, 0.001. Cluster A (686 voxels): right anterior DLFC, right anterior medial frontal cortex, and rightmedial OC. Cluster B (119 voxels): left medial OC. Cluster C (1,036 voxels): right anterior and posterior DLFC. Similar pattern in cluster D (310 voxels):right lateral OC, right anterior and posterior DLFC, right frontal operculum, and right insular cortex. Cluster E (154 voxels): hypothalamus. Similarpattern in cluster F (130 voxels): pituitary. Cluster G (1,692 voxels): posterior cingulate gyrus, bilateral precuneus, right cuneus. Similar pattern incluster I (813 voxels): left angular gyrus, left occipital pole, and left parietal lobule. Cluster H (1,103 voxels): right angular gyrus, right superiortemporal gyrus, right middle temporal gyrus, and right occipital pole.
1794 Brain Responses to Food Ingestion After RYGB Diabetes Care Volume 39, October 2016
staff at Viapath, King’s College Hospital, London;the radiographers and administrative staff atthe PET Imaging Centre; and the staff of theClinical Research Facility, St Thomas’ Hospital,London.Funding. This study was funded by a projectgrant from The Diabetes Foundation UK.Duality of Interest. No potential conflicts ofinterest relevant to this article were reported.Author Contributions. K.F.H. and J.T.D. col-lected data. K.F.H., J.T.D., C.W.l.R., P.K.M., andS.A.A. wrote the manuscript. K.F.H., J.T.D., andL.J.R. analyzed the data. K.F.H. and A.G.P. re-cruited participants. All authors contributed toconception and design of the research and tointerpreting the data. S.A.A. is the guarantor ofthis work and, as such, had full access to all thedata in the study and takes responsibility for theintegrity of the data and the accuracy of the dataanalysis.Prior Presentation. Parts of these data werepresented at the 3rd World Congress onInterventional Therapies for Type 2 Diabetes,London, U.K., 28–30 September 2015. Theresults of the new correlational analyseswere presented in abstract form at the52nd European Association for the Study ofDiabetes Annual Meeting, Munich, Germany,12–16 September 2016.
References1. Sjostrom L, Peltonen M, Jacobson P, et al.Bariatric surgery and long-term cardiovascularevents. JAMA 2012;307:56–652. Sandoval D. Bariatric surgeries: beyond re-striction and malabsorption. Int J Obes 2011;35(Suppl. 3):S45–S493. Olbers T, Bjorkman S, Lindroos A, et al. Bodycomposition, dietary intake, and energy expendi-ture after laparoscopic Roux-en-Y gastric bypassand laparoscopic vertical banded gastroplasty: arandomized clinical trial. Ann Surg 2006;244:715–7224. van de Sande-Lee S, Pereira FRS, Cintra DE,et al. Partial reversibility of hypothalamic dys-function and changes in brain activity after bodymass reduction in obese subjects. Diabetes2011;60:1699–17045. Meek CL, Lewis HB, Reimann F, Gribble FM,Park AJ. The effect of bariatric surgery on gas-trointestinal and pancreatic peptide hormones.Peptides 2016;77:28–376. le Roux CW, Welbourn R, Werling M, et al.Gut hormones as mediators of appetite andweight loss after Roux-en-Y gastric bypass. AnnSurg 2007;246:780–7857. Goldstone AP, Miras AD, Scholtz S, et al. Linkbetween increased satiety gut hormones and re-duced food reward after gastric bypass surgery forobesity. J Clin EndocrinolMetab 2016;101:599–6098. Barrington S, Maisey M, Wahl R. Atlas ofClinical Positron Emission Tomography. 2nded. London, Hodder Arnold, 20069. Dunn JP, Cowan RL, Volkow ND, et al. De-creased dopamine type 2 receptor availability
after bariatric surgery: preliminary findings.Brain Res 2010;1350:123–13010. Steele KE, Prokopowicz GP, Schweitzer MA,et al. Alterations of central dopamine receptorsbefore and after gastric bypass surgery. ObesSurg 2010;20:369–37411. Ochner CN, Stice E, Hutchins E, et al. Re-lation between changes in neural responsivityand reductions in desire to eat high-caloriefoods following gastric bypass surgery. Neuro-science 2012;209:128–13512. Ochner CN, Kwok Y, Conceição E, et al. Se-lective reduction in neural responses to highcalorie foods following gastric bypass surgery.Ann Surg 2011;253:502–50713. Scholtz S, Miras AD, Chhina N, et al. Obesepatients after gastric bypass surgery have lowerbrain-hedonic responses to food than after gas-tric banding. Gut 2014;63:891–90214. Cranston I, Marsden P, Matyka K, et al. Re-gional differences in cerebral blood flow andglucose utilization in diabetic man: the effectof insulin. J Cereb Blood Flow Metab 1998;18:130–14015. Anthony K, Reed LJ, Dunn JT, et al. Attenu-ation of insulin-evoked responses in brain net-works controlling appetite and reward in insulinresistance: the cerebral basis for impairedcontrol of food intake in metabolic syndrome?Diabetes 2006;55:2986–299216. Bingham EM, Hopkins D, Smith D, et al. Therole of insulin in human brain glucose metabo-lism: an 18fluoro-deoxyglucose positron emis-sion tomography study. Diabetes 2002;51:3384–339017. Tziortzi AC, Searle GE, Tzimopoulou S, et al.Imaging dopamine receptors in humans with[11C]-(+)-PHNO: dissection of D3 signal andanatomy. Neuroimage 2011;54:264–27718. Baroncini M, Jissendi P, Balland E, et al. MRIatlas of the human hypothalamus. Neuroimage2012;59:168–18019. Levy JC, Matthews DR, Hermans MP. Cor-rect homeostasis model assessment (HOMA)evaluation uses the computer program. Diabe-tes Care 1998;21:2191–219220. le Roux CW, Aylwin SJ, Batterham RL, et al.Gut hormone profiles following bariatric sur-gery favor an anorectic state, facilitate weightloss, and improve metabolic parameters. AnnSurg 2006;243:108–11421. Berthoud HR. The neurobiology of food in-take in an obesogenic environment. Proc NutrSoc 2012;71:478–48722. Gautier JF, Del Parigi A, Chen K, et al. Effectof satiation on brain activity in obese and leanwomen. Obes Res 2001;9:676–68423. Small DM, Zatorre RJ, Dagher A, Evans AC,Jones-Gotman M. Changes in brain activity re-lated to eating chocolate: from pleasure to aver-sion. Brain 2001;124:1720–173324. Hinton EC, Parkinson JA, Holland AJ, AranaFS, Roberts AC, Owen AM. Neural contributionsto the motivational control of appetite in hu-mans. Eur J Neurosci 2004;20:1411–1418
25. Gautier JF, Chen K, Salbe AD, et al. Differ-ential brain responses to satiation in obese andlean men. Diabetes 2000;49:838–84626. Smeets PA, de Graaf C, Stafleu A, van OschMJ, Nievelstein RA, van der Grond J. Effect ofsatiety on brain activation during chocolatetasting in men and women. Am J Clin Nutr2006;83:1297–130527. Uher R, Treasure J, HeiningM, BrammerMJ,Campbell IC. Cerebral processing of food-related stimuli: effects of fasting and gender.Behav Brain Res 2006;169:111–11928. Fuhrer D, Zysset S, Stumvoll M. Brain activ-ity in hunger and satiety: an exploratory visuallystimulated FMRI study. Obesity (Silver Spring)2008;16:945–95029. LaBar KS, Gitelman DR, Parrish TB, Kim YH,Nobre AC, Mesulam MM. Hunger selectivelymodulates corticolimbic activation to food stimuliin humans. Behav Neurosci 2001;115:493–50030. Raichle ME. The brain’s default mode net-work. Annu Rev Neurosci 2015;38:433–44731. Le DS, Pannacciulli N, Chen K, et al. Lessactivation in the left dorsolateral prefrontal cor-tex in the reanalysis of the response to a meal inobese than in lean women and its associationwith successful weight loss. Am J Clin Nutr 2007;86:573–57932. McCaffery JM, Haley AP, Sweet LH, et al.Differential functional magnetic resonance im-aging response to food pictures in successfulweight-loss maintainers relative to normal-weight and obese controls. Am J Clin Nutr2009;90:928–93433. Stoeckel LE, Weller RE, Cook EW 3rd, TwiegDB, Knowlton RC, Cox JE. Widespread reward-system activation in obese women in responseto pictures of high-calorie foods. Neuroimage2008;41:636–64734. Rothemund Y, Preuschhof C, Bohner G,et al. Differential activation of the dorsal stria-tum by high-calorie visual food stimuli in obeseindividuals. Neuroimage 2007;37:410–42135. Elliott JA, Jackson S, King S, et al. Gut hor-mone suppression increases food intake afteresophagectomy with gastric conduit recon-struction. Ann Surg 2015;262:824–829; discus-sion 829–83036. Stengel A, Goebel M, Wang L, et al. Activa-tion of brain somatostatin 2 receptors stimu-lates feeding in mice: analysis of food intakemicrostructure. Physiol Behav 2010;101:614–62237. Woods SC, Lotter EC, McKay LD, Porte D Jr.Chronic intracerebroventricular infusion of in-sulin reduces food intake and body weight ofbaboons. Nature 1979;282:503–50538. Bruning JC, Gautam D, Burks DJ, et al. Roleof brain insulin receptor in control of bodyweight and reproduction. Science 2000;289:2122–212539. Benedict C, Kern W, Schultes B, Born J,Hallschmid M. Differential sensitivity of men andwomen to anorexigenic and memory-improvingeffects of intranasal insulin. J Clin EndocrinolMetab 2008;93:1339–1344
care.diabetesjournals.org Hunt and Associates 1795