dietary risk factors for prostate cancer and benign ... · conditions affecting the prostate gland;...
TRANSCRIPT

Dietary Risk Factors for Prostate Cancer
and
Benign Prostatic Hyperplasia
Gina L. Ambrosini
Bachelor of Applied Science (Food & Nutrition), Curtin University, 1989
Master of Public Health, University of Western Australia, 1997
This thesis is presented for the degree of Doctor of Philosophy of The University of Western
Australia.
School of Population Health
Discipline: Epidemiology
Submitted in August 2007

i
DECLARATION FOR THESES CONTAINING PUBLISHED WORK AND/OR
WORK PREPARED FOR PUBLICATION
This thesis contains published work and/or work prepared for publication , some of which
has been co-authored . Bibliographic details of the works are set out below along with the
percentage contribution from each author (%). Public health studies are collaborative
enterprises and rely on the contributions of many people to design the study, collect the data,
analyse the data and write the papers. Here, the contributions towards data analyses and the
writing of each specific paper has been estimated only:
1. Ambrosini GL (80%), de Klerk NH (5%), Fritschi L (5%), Mackerras L (5%) and Musk
AW (5%). Fruit, vegetable, vitamin A intakes and prostate cancer risk. Prostate Cancer
and Prostatic Diseases 2008; 11: 61-66.
2. Ambrosini GL (55%), van Roosbroeck SAH (20%), Mackerras D (10%), Fritschi L (5%),
de Klerk NH (5%) and Musk AW (5%). The reliability of ten-year dietary recall:
implications for cancer research. Journal of Nutrition 2003; 133: 2663-2668.
3. Ambrosini GL (80%), de Klerk NH (5%), Mackerras D (5%) , Leavy J (5%) and Fritschi L
(5%). Dietary patterns and benign prostatic hyperplasia: a case-control study in
Western Australia. BJU International 2008; 101: 853-860.

ii
4. Ambrosini GL (65%), Fritschi L (10%), de Klerk NH (10%), Leavy J (5%) and Mackerras
D (10%). Nutrient intakes and benign prostatic hyperplasia: a case-control study in
Western Australia (unpublished manuscript).
5. Ambrosini GL (70%), Fritschi L (10%), de Klerk NH (10%) , Mackerras D (5%) and
Leavy J (5%). Dietary patterns and prostate cancer: a case-control study in Western
Australia. Annals of Epidemiology in press : DOI: 10.1016/j.annepidem.2007.11.010
2008
6. Ambrosini GL (65%), Fritschi L (10%), de Klerk NH (10%), Leavy J (5%) and Mackerras
D (10%). A comparative analysis of nutrient intakes, nutrient patterns and prostate
cancer risk (unpublished manuscript).
Statement of Candidate Contribution
Gina Ambrosini proposed and designed the research plan for this thesis, conducted the
necessary research, and wrote this PhD thesis in its entirety.
With regard to manuscripts and published papers presented in this thesis the roles of each
co-author are as follows:
Gina Ambrosini: devised and wrote all manuscripts and conducted all data analyses, excepting
that for the published paper ‘The reliability of ten-year dietary recall: implications for cancer
research’ which was conducted by Sofie van Roosbroeck.
Dr Lin Fritschi co-designed the Prostate Health Study with Gina Ambrosini, supervised data
collection, and provided input to manuscript preparation.
Dr Nick de Klerk provided guidance for statistical analyses and data interpretation, and the
preparation of manuscripts.
Dr Dorothy Mackerras provided input to data interpretation and manuscript preparation.
Ms Justine Leavy co-ordinated the Prostate Health Study, was responsible for data acquisition,
data cleaning, and provided input to manuscript preparation.
Clin. Prof Bill (AW) Musk provided input to manuscript preparation

iii
We confirm that permission has been obtained from a ll co-authors to include the
manuscripts in this PhD thesis.
Signed:
Date:
Professor Matthew Knuiman
Co-ordinating Supervisor, School of Population Health, UWA
Date:
Ms Gina Ambrosini, PhD candidate

iv
ABSTRACT
Introduction
This thesis examines the potential role of dietary intake in the development of two common
conditions affecting the prostate gland; prostate cancer and benign prostatic hyperplasia (BPH).
Diet is of interest as a potential risk factor for prostate cancer because of geographical
variations in prostate cancer incidence and increased prostate cancer risks associated with
migration from Asian to western countries. Some geographical variation has been suggested
for BPH, but this is less certain. However, both prostate cancer and BPH have potential links
with diet through their positive associations with sex hormone levels, metabolic syndrome,
increased insulin levels and chronic inflammation. In addition, zinc is an essential dietary
micronutrient required for semen production in the prostate gland.
The original work for this thesis is presented in six manuscripts of which, four have been
published in peer-reviewed journals (at the time of thesis completion). BPH investigated in this
thesis is defined as surgically-treated BPH. The following hypotheses were investigated.
Regarding foods, nutrients and the risk of prostate cancer and BPH:
1. Increasing intakes of fruits, vegetables and zinc are inversely associated with the risk of
prostate cancer and BPH
2. Increasing intakes of total fat and calcium are positively associated with the risk of prostate
cancer and BPH.
3. Dietary patterns characterised by high meat, processed meat, calcium and fat content are
positively associated with the risk of prostate cancer and BPH.
4. Dietary patterns characterised by high fruit and vegetable and low meat content are
inversely associated with the risk of prostate cancer and BPH.

v
Regarding methodological issues related to the study of diet-disease relationships:
5. Dietary patterns (overall diet) elicited from principal components analysis yield stronger
diet-disease associations than when studying isolated nutrients.
6. Remotely recalled dietary intake is reliable enough to be used in studies of chronic
disease with long latency periods, such as prostate cancer and BPH.
Methods
Data from two studies was used to address the hypotheses above.
The Vitamin A Program was a cancer prevention program of randomly assigned beta-carotene
and retinol supplements to prevent mesothelioma and lung cancer, conducted in Western
Australia (WA). Participants were people previously exposed to asbestos through their
occupations or area of residence. At entry to the program, participants completed a short,
evaluated food frequency questionnaire (FFQ) and provided smoking, medical and occupational
histories. The program commenced in 1990. During 14 years of follow up on 1,985 male
participants, 97 cases of histologically confirmed prostate cancer were identified. The risk of
prostate cancer was examined in relation to intakes of fruit, vegetables, beta-carotene, and
retinol. Survival analyses were adjusted for age, body mass index, randomly assigned
beta-carotene or retinol supplement, source of asbestos exposure, and tobacco use at entry to
the program.
The Prostate Health Study was a population-based case-control study conducted in WA to
examine risk factors for prostate cancer and surgically-treated BPH. Histologically confirmed,
incident prostate cancer cases (n=546) were identified using WA cancer registry data. BPH
cases (n=406) were men aged 40 to 75 years hospitalised for their first prostatectomy with a
diagnosis of BPH in either a public or private hospital in WA during 2001-2002, without a history
of prostate cancer. Controls (n=447) were randomly selected from the WA electoral roll and
age-matched within 5 years of cases.

vi
As both prostate cancer and BPH have long latent periods, participants were asked to recall
their diet ten years before the study using a semi-quantitative FFQ developed by the
Anti-Cancer Council of Victoria (Australia). This FFQ’s reliability was evaluated by comparison
with a 28-day diet record completed ten years earlier in a similar population.
Empirically derived dietary patterns offer an alternative way of analysing dietary intake that
takes into account the whole diet and overcomes problems with colinear nutrients and foods,
and multiple statistical tests. Dietary patterns in the FFQ data were determined using principal
components analysis (factor analysis). Average daily nutrient intakes were estimated from FFQ
intakes using Australian Food Composition Tables and adjusted for energy intake using the
residual method. Dietary patterns based on nutrient intakes were also examined using factor
analysis.
The risk of prostate cancer and BPH was analysed according to food-based dietary patterns
and individual nutrient intakes using unconditional logistic regression, controlling for potential
confounders. In addition, a comparative analysis of individual nutrient intakes versus nutrient
patterns and prostate cancer risk was undertaken.
Results
Dietary patterns. Three food-based dietary patterns emerged: ‘Vegetable’, ‘Western’ and
‘Health-conscious’. Three nutrient intake patterns were also identified.
Disease risks, dietary patterns, foods and nutrients. The results suggested that increased
intakes of vitamin C-rich vegetables, peppers, broccoli, and zinc may decrease prostate cancer
risk. In addition, nutrient pattern 1, high in zinc, protein, fibre, folate and other B vitamins, iron
and magnesium, and low in total fat and saturated fat was associated with a reduced risk of
prostate cancer. The ‘Western’ dietary pattern was positively associated with prostate cancer
risk. These findings generally support the existing literature in this field.
Some similarities were seen with surgically-treated BPH. A decreased risk was associated with
higher intakes of total, dark yellow and other vegetables (excluding cruciferous vegetables and
vii
tomatoes) and the ‘Vegetable’ dietary pattern. In addition, the risk decreased with higher
intakes of zinc and beta-carotene, and with tofu consumption. High intakes of sugars, high fat
dairy products and retinol were associated with an increase in BPH risk. An increased risk was
suggested with higher calcium intake.
The use of empirically derived dietary patterns. Dietary patterns could differentially predict the
risk of prostate cancer and BPH. The comparative analysis highlighted how different results
arise when prostate cancer risk is analysed according to individual nutrient intakes compared
with patterns in nutrient intakes, which take the whole diet into account.
Remote dietary intakes. When compared with a 28-day diet record, ten year dietary recall was
as reliable as recent dietary recall. Remote dietary intake is relevant to the study of chronic
disease and is more likely to be related to the initiation or progression of a recently diagnosed
chronic disease than recent diet, which is commonly used in epidemiology.
Conclusions
Based on the literature reviewed and the original work for this thesis, the most important dietary
risk factors for prostate cancer and BPH appear to be those common to western style diets, i.e.
diets high in red meat, processed meat, refined grains, dairy products, and low in fruit and
vegetables. This type of diet is likely to result in marginal intakes of antioxidants and fibre,
excess intakes of fat and possibly, moderate intakes of carcinogens associated with processed
meat and meat cooked at high temperatures. These dietary factors have been linked with
biomarkers of inflammation, and they support the hypotheses that chronic inflammation is
involved in the development of both prostate cancer and BPH. In addition, this work builds on
evidence that zinc is an important factor in prostate health.
There is scope for more investigation into the reliability of dietary patterns and the use of
nutrient patterns as an alternative to focussing on single food components. Further studies on
the reliability of remote dietary intake would also be useful. Because of the latency of chronic
disease, it can be theorised that remote dietary recall may uncover more robust diet-disease
relationships.

viii
TABLE OF CONTENTS
LIST OF FIGURES xi
LIST OF ABBREVIATIONS xii
CHAPTER 1: INTRODUCTION 1
CHAPTER 2: BACKGROUND 3
The Prostate 4
Prostate Cancer 5
Rationale for Examining Diet and Prostate Cancer 11
Reviewing the Diet-Prostate Cancer Literature 15
Fruit, Vegetables and Meat and the Risk of Prostate Cancer 17
Table 1. Epidemiological studies of vegetable intake and prostate cancer risk 19
Table 2. Epidemiological studies of fruit intake and prostate cancer risk 26
Table 3. Epidemiological studies of tomato intake and prostate cancer risk 32
Table 4. Epidemiological studies of meat intake and prostate cancer risk 39
Selected Nutrients and Prostate Cancer Risk 43
Table 5. Epidemiological studies of dietary fat intake and prostate cancer risk 46
Table 6. Epidemiological studies of dietary calcium intake and prostate cancer risk 51
Table 7. Epidemiological studies of dietary zinc intake and prostate cancer risk 55
Benign Prostatic Hyperplasia 58
Rationale for Examining Diet and BPH 62
Studies of Diet and BPH Risk 63
Dietary Patterns in the Study of Diet and Disease 66
Remote Dietary Intake 71
Thesis Hypotheses 73
References 74

ix
CHAPTER 3: METHODS AND RESULTS 93
Paper 1 96
Fruit, vegetable, vitamin A intakes, and prostate c ancer risk. 96
Table 8. Characteristics of cases and non-cases at entry to the study. 103
Table 9. Dietary intakes at entry to the study and risk of prostate cancer 104
Paper 2 113
The reliability of ten-year dietary recall: implica tions for cancer research 113
Table 10. Baseline characteristics of reliability study and other trial subjects 119
Table 11. Nutrient intakes estimated by the diet record and FFQ completed 10yrs later 121
Table 12. Agreement between the diet record and FFQ completed 10 yrs later 122
Paper 3 131
Dietary patterns and surgically-treated benign pros tatic hyperplasia: a case-control
study in Western Australia. 131
Table 13. Dietary patterns and factor loadings 137
Table 14. Composition of food groups 138
Table 15. Quartile cut points for energy and food group intakes. 139
Table 16. Dietary pattern score and risk of surgically-treated BPH. 142
Table 17. Food groups and risk of surgically-treated BPH 143
Paper 4 153
Nutrient intakes and risk of surgery for benign pro static hyperplasia. 153
Table 18. Quartile cut points for energy-adjusted nutrient intakes 158
Table 19. Mean age, BMI and nutrient intakes for cases and controls. 159
Table 20. Energy adjusted nutrient intakes and risk of surgically-treated BPH. 161
Paper 5 171
Dietary patterns and prostate cancer risk: a case-c ontrol study in Western Australia. 171
Table 21. Characteristics of cases and controls 178
Table 22. Dietary patterns and factor loadings 179
Table 23. Pearson correlations between dietary pattern scores and key nutrients 180
Table 24. Dietary pattern score and prostate cancer risk 182
Paper 6 188
A comparative analysis of nutrient intakes, nutrien t patterns and prostate cancer risk. 188
Table 25. Quartile cut points for nutrient intakes 194
Table 26. Energy-adjusted nutrient intakes and risk of prostate cancer 195
Table 27. Nutrient patterns and factor loadings 200
Table 28. Nutrient patterns and prostate cancer risk 201

x
CHAPTER FOUR: DISCUSSION 208
Conclusions and Further Research 215
APPENDICES 219
Appendix 1. Example of Test for Publication Bias 220
Appendix 2. The International Prostate Symptom Sco re (I-PSS) 221
Appendix 3. Published Manuscripts Presented for th is Thesis 223
Appendix 4. The Cancer Council of Victoria’s Food Frequency Questionnaire 251
Appendix 5. Personal Characteristics and Food Inta ke by Quartiles of Food Patterns
(prostate cancer cases and controls) 256
Table 29. Personal characteristics by quartiles of (food based) dietary patterns. 257
Table 30. Food intake by quartiles of the 'Vegetable' pattern. 259
Table 31. Food intake by quartiles of the 'Western’ pattern. 260
Table 32. Food intake by quartile of the 'Health-conscious’ pattern. 261
Appendix 6. Personal Characteristics and Food Inta ke by Quartiles of Food Patterns
(BPH cases and controls) 262
Table 33. Personal characteristics by quartiles of (food based) dietary patterns. 263
Table 34. Food intake by quartiles of the 'Vegetable' pattern. 265
Table 35. Food intake by quartiles of the 'Western’ pattern. 266
Table 36. Food intake by quartiles of the 'Health-conscious’pattern. 267
Appendix 7. Personal Characteristics and Nutrient I ntake by Quartiles of Nutrient Patterns
(prostate cancer cases and controls) 268
Table 37. Personal characteristics by quartiles of nutrient intake patterns 269
Table 38. Nutrient intakes by quartiles of Nutrient Pattern 1 271
Table 39. Nutrient intakes by quartiles of Nutrient Pattern 2 272
Table 40. Nutrient intakes by quartiles of Nutrient Pattern 3 273
Appendix 8. Summary of Diet-Disease Findings 274
Table 41. Summary of Diet-Disease Findings 275

xi
LIST OF FIGURES
Figure 1. Male genitourinary tract 4
Figure 2. Incidence of Prostate Cancer in Australia, 1983-2001 5
Figure 3. Zones of the Prostate Gland 6
Figure 4. Incidence of Prostate Cancer by Region, 2002 12
Figure 5. Forest plot of total vegetable intake and prostate cancer risk 18
Figure 6. Forest plot of cruciferous vegetable intake and prostate cancer risk 24
Figure 7. Forest plot of total fruit intake and prostate cancer risk 25
Figure 8. Forest plot of citrus fruit intake and prostate cancer risk 25
Figure 9. Forest plot of cooked tomato intake and prostate cancer risk 30
Figure 10. Forest plot of raw tomato intake and prostate cancer risk 31
Figure 11. Forest plot of total meat intake and prostate cancer risk 37
Figure 12. Forest plot of red meat intake and prostate cancer risk 37
Figure 13. Forest plot of processed meat intake and prostate cancer risk 38
Figure 14. Forest plot of meat intakes and advanced prostate cancer 38
Figure 15. Forest plot of total fat intake and prostate cancer risk 45
Figure 16. Forest plot of saturated fat intake and prostate cancer risk 45
Figure 17. Forest plot of dietary calcium intake and prostate cancer risk (all cases) 50
Figure 18. Forest plot of dietary calcium intake and advanced prostate cancer risk 50
Figure 19. Forest plot of dietary zinc intake and prostate cancer risk 54
Figure 20. Mean agreement and upper and lower Limits of Agreement (LOA) between retinol
intakes estimated by the diet record and 10 yrs later using the FFQ 123
Figure 21. Mean agreement and upper and lower Limits of Agreement (LOA) between fiber
intakes estimated by the diet record and 10 yrs later using the FFQ 124
Figure 22. The International Prostate Symptom Score ( IPSS) Questionnaire 222
xii
LIST OF ABBREVIATIONS
BMI Body mass index
BPH Benign prostatic hyperplasia
CCV Cancer Council of Victoria, Australia
CI Confidence Interval
CRP Acute-phase C-reactive protein
DR Diet record
EPIC European Prospective Investigation into Cancer and Nutrition
FFQ Food frequency questionnaire
HPFS US Health Professionals Follow Up Study
IGF Insulin-like growth factor
IL-6 Interleukin-6
LOA Limits of agreement
LUTS Lower urinary tract symptoms
NHANES I US National Health and Nutrition Examination Survey 1971-1975
OR Odds ratio
PCA Principal components analysis
RR Relative Risk
TNF-alpha Tumor necrosis factor-alpha
WA Western Australia

xiii
Acknowledgements
Heartfelt thanks go to my husband Martin, daughter Sophie, and friends, who were so
understanding and patient while I wrote this thesis.
This thesis would also not have been possible without the help of my PhD supervisors. Special
thanks goes to Associate Professor Lin Fritschi, who oversaw the Prostate Health Study and
provided much practical advice and expediency. The statistical advice from Professor Nick de
Klerk and nutritional epidemiology support from Dr Dorothy Mackerras was invaluable.
I am very grateful for Justine Leavy’s commitment to organisation, documentation and data
cleaning, as the Project Co-ordinator of the Prostate Health Study.
And finally, thanks to all in the Occupational and Environmental Epidemiology Group at the
University of Western Australia for their friendship, support, and assistance with data collection
for the Vitamin A Program.

1
CHAPTER 1: INTRODUCTION

2
This thesis examines the potential role of dietary intake in the development of two common
conditions affecting the prostate gland; prostate cancer and benign prostatic hyperplasia (BPH).
The aims are to investigate:
A. The reliability of remote dietary intake in the study of diet and chronic disease.
B. Dietary patterns and the risk of surgery for BPH.
C. Dietary patterns and the risk of incident prostate cancer.
D. Dietary intakes of foods and nutrients and the risk of surgery for BPH.
E. Dietary intakes of foods and nutrients and the risk of incident prostate cancer.
The sections in this PhD are as follows, in order of presentation:
Background – a description of prostate cancer and benign prostatic hyperplasia and their risk
factors. The relevance of diet and the epidemiological evidence is reviewed. The thesis
hypotheses are presented.
Methods and Results – consists of a suite of published and yet to be published manuscripts
that investigate the thesis hypotheses.
Discussion – presents an overall synthesis of results and makes recommendations.
References – these are listed at the end of each chapter and manuscript.
Appendices – these include published manuscripts, questionnaires and additional data referred
to in the main body of the thesis.

3
CHAPTER 2: BACKGROUND

4
The Prostate
The prostate gland is a small androgen-responsive organ, approximately 3-4 centimetres long,
found in the male genitourinary tract. A mixture of fibro-muscular (stroma) and epithelial (gland)
tissue, it sits under the bladder and in front of the rectum, and is perforated by the urethra
(Figure 1). The fibro-muscular tissue consists of fibroblasts, smooth muscle cells and
endothelial cells, while the epithelial tissue is made up of secretory cells, basal cells and
neuroendocrine cells (1). The main function of the prostate gland is to contribute to semen
composition. Luminal epithelial cells in the glandular tissue secrete nutrients for sperm survival
and ions to maintain ideal semen pH (2).
Two age-related conditions commonly affect the prostate gland: prostate cancer and benign
prostatic hyperplasia, a non-malignant enlargement of the prostate gland.
Figure 1. Male genitourinary tract.
From (3)

5
Prostate Cancer
Prostate cancer is the most common cancer diagnosed among Australian men, excluding
non-melanoma skin cancer (4). After lung cancer, it is the second most common cause of
cancer death (4). The latest national data on cancer in Australia indicates that prostate cancer
made up 23.4 percent of all new cancers in Australia in 2001 (4). Although the
age-standardised incidence rate of prostate cancer in Australia is lower than that in the United
States (US), it exceeds the United Kingdom (UK) and other European countries (5).
In 2001, the Australian world age-standardised incidence rate was 88.1 per 100,000 males,
giving Australian men a 1 in 11 chance of developing prostate cancer before the age of 74
years (4). The population incidence of prostate cancer increased rapidly between 1990 and
1994 (Figure 2), and this trend has been attributed to the introduction of the prostate-specific
antigen (PSA) testing. However, the population incidence has fallen since 1994. Although the
number of PSA tests has continued to increase since 1994, the drop in prostate cancer
incidence is likely due to the large number of latent cases identified early, during the first few
years of PSA testing (6).
0
10
20
30
40
50
60
1982 1984 1986 1988 1990 1992 1994 1996 1998 2000 2002
Year
Wor
ld A
ge S
tand
ardi
sed
Rat
e/10
0,00
0 P
opul
atio
n
Figure 2. Incidence of Prostate Cancer in Australia, 1983-2001 (4)

6
The age-standardised mortality rate from prostate cancer in Australia in 2001 was 20.2 per
100,000 men, and prostate cancer made up 13.3 percent of cancer deaths (4). Since 1991, this
mortality rate has decreased by 1.8% per annum and is similar to that of the UK and US (4).
Clinical prostate cancer is associated (although not always) with increased serum
concentrations of PSA and may or may not include prostate enlargement. Treatment for clinical
prostate cancer varies but may include radical prostatectomy, radiotherapy and brachytherapy.
Decisions regarding treatment options are complex, and depend on factors relating to the
patient’s personal and clinical requirements (7).
Pathogenesis of Prostate Cancer
Prostate cancer arises from an androgen-dependent proliferation of prostate epithelial cells (8).
Approximately 75% of prostate cancers occur in the epithelial cells of the peripheral zone of the
prostate (Zone 1 in Figure 3), which sits at the rear of the prostate gland, near the rectum (1).
The remainder of tumours are detected in the transition zone of the prostate, which immediately
surrounds the urethra (Zone 3 in Figure 3).
Figure 3. Zones of the Prostate Gland
1= Peripheral Zone, 2= Central Zone, 3= Transition zone, 4= Anterior Fibromuscular Zone.
B= Bladder, U= Urethra, SV= Seminal Vesicle. From (1)

7
The exact mechanisms of prostate carcinogenesis are unclear. However, it is likely that a
multitude of genetic alterations initiate this disease (8). Genetic and biochemical alterations in
prostate epithelial cells are thought to lead to increased androgen levels, enhanced cell
proliferation and ultimately prostatic intraepithelial neoplasia (PIN); small, low grade cancers
that may remain latent for decades (9). PIN is thought likely to progresses to clinical prostate
cancer under the influence of hormones (including androgens) or growth factors that are either
incorrectly expressed or triggered by tumor-promoters such as environmental factors (8, 10).
Chronic inflammation and infections are known to cause other cancers, and chronic
inflammation has been implicated in the development of prostate cancer (8, 11, 12). One theory
is that chronic inflammation in the prostate gland brings about the genetic and biochemical
alterations that lead to increased androgen production and cell proliferation (8). Chronic
inflammation is associated with increases in cytokines, reactive oxygen species (ROS) and nitric
oxide, all of which can cause oxidative damage to DNA and extracellular components, including
lipids (8). The associated injury resulting in the prostate gland may lead to ‘proliferative
inflammatory atrophy’ (PIA), which has been associated with morphological transitions and low
grade PIN (11). Chronic inflammation in the prostate may be brought about by infection,
hormonal imbalances, environmental toxins (including dietary carcinogens), or autoimmunity
(11, 13). However, the most likely cause of chronic inflammation in the prostate is unclear at
this stage (12). Some studies suggest that non-steroidal anti-inflammatory drugs can reduce
prostate cancer risk, which supports the chronic inflammation theory, however the evidence is
mixed (11, 12, 14, 15).
Autopsy studies have found that latent prostate cancer can be detected in some men from the
age of thirty, and becomes increasingly more common with age (16). In the US, where prostate
cancer incidence appears to be the highest, the lifetime risk of clinical prostate cancer is
estimated to be 8% (17). Whereas the autopsy prevalence of prostate cancer is around 80% for
men in their 80’s, regardless of country or ethnicity (17). At this stage, the lack of understanding
about risk factors makes it difficult to predict which men are likely to develop clinical prostate
cancer or progressive prostate cancer. However, it is clear that prostate cancer has a long
latency period that may provide opportunities for interventions to prevent frank malignancy.

8
Prostate Cancer Subtypes
Prostate cancers are classified according to grade and stage. Prostate cancer ‘grade’ refers to
the histology or the degree of tumor differentiation in prostate tumour cells that is assessed by a
pathologist (7). The Gleason Score is commonly used to classify prostate cancer grade (18).
Prostate cancers with a total Gleason score ≥ 7 are usually considered histologically
aggressive, while those graded < 7 are regarded non-aggressive however, a cut-off of 8 is
sometimes used (7).
Prostate cancer ‘stage’ refers to how much of the prostate gland is affected by the tumour, and
if the tumour has spread or advanced outside the prostate gland. Tumours that have advanced
e.g. to regional lymph nodes, have a poorer prognosis than tumours localised in the prostate
gland (7) and are more likely to be fatal (19). Advanced prostate tumours are not always
aggressive (as defined by a high Gleason score), and aggressive prostate tumours do not
always advance beyond the prostate gland, therefore prostate tumour stage and grade should
be treated as separate entities (19).
There is some evidence that the risk factors for advanced, non-advanced, low-grade and
high-grade tumours may differ due to different pathways involved in their etiology (19). In
countries where the PSA test for prostate cancer has become popular, such as the US, the
incidence of prostate cancer has apparently risen and the proportion of cases diagnosed at an
advanced stage has decreased considerably, in comparison to the ‘pre PSA testing era’ (19).
As such, it may be necessary when considering the total prostate cancer literature, to consider
the prostate cancer screening practices in different countries and how these may influence the
incidence of prostate cancer subtypes and their observed risk factors.
Risk Factors for Prostate Cancer
Like most chronic diseases, age is a risk factor for prostate cancer owing to the disease’s
latency. Aging is associated with increased levels of damage to genetic material due to the
cumulative effects of endogenous and exogenous toxins. These can lead to the biochemical
changes that cause PIN, as discussed earlier. Increased circulating levels of proinflammatory
cytokines such as Interleukin (IL)-6 and Tumor Necrosis Factor (TNF)-alpha which may

9
contribute to chronic inflammation, are also associated with ageing (20). As the life span
increases, so does the likelihood that an environmental factor will trigger latent prostate cancer
(PIN) to progress to clinical prostate cancer. Another theory is that the concurrent decline in
androgen levels and increase in estrogen levels associated with aging increases the risk for
prostate cancer (21).
The role of hormones in prostate cancer is controversial. While testosterone is necessary for
the normal functioning of the prostate gland (22), prostate cancer is thought to be dependent on
increased testosterone levels (23). The ‘androgen hypothesis’ assumes that increased
testosterone levels increase the risk of prostate cancer. However, prospective epidemiological
studies of hormone levels and prostate cancer have not supported this hypothesis (22). A
recent prospective study has shown higher levels of androgens to be associated with decreased
risks for aggressive prostate cancer, but unrelated to non-aggressive prostate cancer (22). The
lack of supporting epidemiological evidence for the androgen hypothesis may be due to the
timing of androgen measurements, a need to measure intra-prostatic androgen levels rather
than circulating androgen levels, or modifying effects from genetic polymorphisms (23, 24).
The role of estrogens in prostate cancer is also unclear. Increased estrogen levels have been
proposed to increase the progression of prostate cancer, however this is inconclusive (21). The
aromatisation of testosterone produces estradiol-17β, which is thought to be genotoxic to the
prostate gland (25). On the other hand, estrogen is known to interfere with androgen production
via the hypothalamic-pituitary-gonadal axis, and for this reason has been used to treat
advanced prostate cancer in the past (21). In addition, dietary phytoestrogens have
demonstrated some in-vitro anti-tumour properties in prostate gland tissue (9).
Prostate cancer appears to have both familial and genetic components. The relative risk of
developing prostate cancer for first degree relatives of affected men increases with the number
and age of affected family members and relatedness (26). There are also greater rates of
concordance for monozygotic rather than dizygotic twin brothers (26). Familial prostate cancer,
where one or more relatives are affected, is thought to account for approximately 15% of cases
(26). This may indicate inherited genetic susceptibility to prostate cancer, or it may reflect
screening bias. However, at least nine candidate susceptibility genes have been implicated in

10
prostate cancer development. Of these, HPC1, the androgen receptor gene (AR) and vitamin
D receptor gene (VDR) have been the most widely studied. HPC1 is a rare autosomal dominant
gene that affects an enzyme involved in apoptosis and susceptibility to viral infections (26). The
HPC1 gene has high penetrance and HPC1 related cancers reportedly present with higher
grade and stage (26). The androgen receptor (AR) gene acts in combination with
dihydroxytestosterone (DHT) as a transcription factor for genes involved in androgen
responses, including cell proliferation and differentiation (27, 28). A smaller number of CAG
trinucleotide repeats in the AR is associated with a weak reduction in prostate cancer risk (27,
29) . The vitamin D receptor (VDR) gene controls the action of the hormone 1,25(OH)2D
(vitamin D), which is capable of inhibiting cell proliferation (30). The FokI polymorphism in the
VDR results in a decreased response to 1,25(OH)2D and in combination with low vitamin D
status, has recently been associated with an increased risk for aggressive and advanced
prostate cancers (30). However, none of these genetic candidates have been confirmed as
individual risk factors for prostate cancer, and it is likely that a set of genetic characteristics and
environmental factors is important in prostate cancer development (27).
There are racial differences in prostate cancer epidemiology. African-American men have a
disproportionately higher total incidence and mortality from prostate cancer than white American
men (23). Whether or not genetic differences in hormonal pathways are the cause is as yet,
unclear (23). However, social or cultural differences in symptom thresholds and the reporting of
symptoms, uptake of screening tests, use or access to health care or treatment options may
partially explain some of the disparity (17).
Few other risk factors for prostate cancer have been established. There is little evidence to
support alcohol (31) or vasectomy (32, 33) and limited evidence for occupational exposures e.g.
pesticides (31) in prostate cancer development. There is limited evidence that smoking may
increase the risk for fatal prostate cancer (19). The role of obesity in prostate cancer is unclear,
however it is thought to be weakly associated with a higher risk of advanced (34) and
aggressive tumours (35). It is probable that physical activity reduces prostate cancer risk (10,
31). Androgenic alopecia (male pattern balding), thought to be related to high androgen levels
(36), has been associated with increased risks for prostate cancer in some studies (36, 37) but
not in others.

11
Rationale for Examining Diet and Prostate Cancer
Geographical differences
Marked international differences in clinical prostate cancer incidence have been evident for
some time, with rates lowest in Asia and highest in western countries such as the US and
Europe (38). Yet, the prevalence of latent prostate cancer does not differ (39), suggesting that
environmental factors such as diet may influence the progression from latent to clinical prostate
cancer.
The risk of prostate cancer increases considerably in men who have migrated to the US from
low risk areas such as China and Japan (40, 41), although geographical variations in screening
and reporting practices may be a source of difference.
However, differences in androgen production between Caucasian and Chinese men have been
noted (39). Caucasian and Chinese men living in the US have been shown to produce
significantly higher levels of testosterone than Chinese men living in China, while no differences
in 5-alpha-reductase activity (the enzyme converting testosterone to more active
dihydroxy-testosterone) were observed (39). This suggests environmental or dietary rather than
genetic influences on androgen levels (39) which in turn, may influence prostate cancer risk.
One possible explanation is a high consumption of soy-based foods in traditional Asian diets.
Soy products contain high levels of phytoestrogens, which have been inversely associated with
prostate cancer (42).
Cancer incidence data from the International Agency for Research on Cancer (IARC) (5) shows
that the lowest incidence rates remain in Asian regions (Figure 4), but these are on the rise (38,
40) possibly due to increased ‘westernisation’ (40) and associated nutrition transition from an
Asian diet to a western one (43).

12
020406080100120
Northern America
Australia/New Zealand
Western Europe
Northern Europe
Carribean
South America
Southern Africa
Southern Europe
Central America
Middle Africa
Micronesia
Western Africa
Central & Eastern Europe
Eastern Africa
Western Asia
South-Eastern Asia
Northern Africa
Melanesia
South-Central Asia
Eastern Asia
Age Standardised (World) Incidence Rate per 100,000
Figure 4. Incidence of Prostate Cancer by Region, 2002 (5)
In 1975, an ecological study by Armstrong and Doll (44) reported that regions with the highest
incidence of prostate cancer consumed high levels of energy, meat, animal protein, milk, and
sugar, characteristic of a ‘western’ diet. Prostate cancer mortality was also recently shown to be
highest in regions consuming a more western diet (45). Lower incidence (44) and mortality (45)
from prostate cancer has been observed in regions with greater intakes of cereals, legumes,
soybeans and rice, which are characteristic of Asian diets. The geographical locations of these
dietary patterns correspond with the east-west gradient in prostate cancer incidence. Hence the
low fat, high plant food diet in Asian regions has been thought to partly explain their lower rates
of prostate cancer.

13
Prostate-specific nutrients
At least two nutrients sourced from the diet are concentrated in the prostate gland, zinc and
lycopene, indicating a possible role for diet in prostate carcinogenesis. Zinc is an essential
dietary micronutrient that is thought to be crucial for the prostate gland (46). It has been known
for some time that very high levels of zinc are concentrated in the peripheral zone of the
prostate gland (47), and that these levels markedly decrease with prostate cancer (48).
Lycopene is a potent antioxidant (49) that is concentrated in the prostate gland.
Oxidative stress and chronic inflammation
Nutrition has been suggested as “one of the most important causes of cancer after smoking”
(50). Given the proposed chronic inflammation and oxidative stress hypothesis for prostate
carcinogenesis, dietary antioxidants (e.g. lycopene, beta-carotene, vitamin C, vitamin E) may be
important for preventing prostate cancer. Conversely, dietary fat, particularly polyunsaturated
fats, may contribute to oxidative damage in the prostate gland as these present a significant
substrate for oxidative stress (51).
Links between diet and inflammation have been demonstrated. Acute-phase C-reactive protein
(CRP) in plasma, a biomarker for systemic inflammation, has been positively associated with
dietary patterns characterised by high intakes of fats, processed meats (52-54) and intake of
saturated fats (55). In contrast, dietary patterns including high intakes of wholegrains,
vegetables, fruits, fish, legumes and nuts have been inversely associated with plasma CRP and
proinflammatory cytokines such as (IL)-6 and (TNF)-alpha (53, 54, 56-58).
Metabolic syndrome is a cluster of risk factors for cardiovascular disease that includes, among
others: obesity, type 2 diabetes, dyslipidaemia and abnormal glucose metabolism, all of which
are closely associated with chronic inflammation (59). It is well known that dietary intake and
physical activity can modify these risk factors (60). An increased risk of prostate cancer has
been linked to metabolic syndrome or at least one of its risk factors in some, but not all studies
(61-64). Paradoxically, two meta-analyses have indicated that the risk of prostate cancer is
much lower among men with Type 2 diabetes (65, 66). This is likely to be due to hormonal
changes, as treatment for Type 2 diabetes leads to reductions in circulating insulin and

14
insulin-like growth factor (IGF)-1, both of which are growth factors for the prostate gland (65,
66). Furthermore, testosterone levels are thought to be lower in diabetic men (65, 66).
Diet and hormones
Observational and feeding studies have shown that higher levels of sex hormones, including
testosterone, are associated with greater total fat intakes and inversely associated with higher
fibre intake (67-69). Higher intakes of saturated fat and polyunsaturated fats has been
associated with increased levels of free (unbound) testosterone, while omega-3 polyunsaturated
fatty acids have been shown to decrease 5-alpha-reductase activity and the number of
androgen receptors (69). It is therefore possible that dietary intake influences prostate cancer
risk by directly affecting sex hormone levels.
A meta-analysis recently estimated that the risk of prostate cancer increased significantly with
increasing circulating levels of IGF-1 (70). High levels of IGF-1 have been associated with
increased intakes of milk, dairy products, calcium, carbohydrates and polyunsaturated fats (71,
72). Conversely, higher intakes of vegetables, especially tomatoes, have been associated with
decreased levels of circulating IGF-1 (71).

15
Reviewing the Diet-Prostate Cancer Literature
Many foods and nutrients have been studied in the context of prostate cancer risk since the
early 1990s. However, it is beyond the scope of this thesis to examine all of these. Instead, the
focus is on those dietary factors reviewed below. A rationale is included in each section. In
addition, forest plots summarise the reviewed studies.
Methods for Including Studies
Studies were sourced by searching PubMed for the following key words: prostate neoplasms,
fruit, vegetables, Brassica vegetables, cruciferous vegetables, tomatoes, meat, fat, zinc and
calcium. Searches were limited to studies written in English and on human subjects. Additional
studies were located through manual searches of reference lists in published papers. Only
studies examining dietary intake were reviewed. Studies were not included unless incident
prostate cancer was the outcome. Hospital-based case-control studies were not included if they
studied <100 cases, as these may be selective in their inclusion of cases and controls (in
relation to personal characteristics or severity of disease), and are likely to have underestimated
the number of cases occurring in a defined population. Where there were multiple publications
arising from the same study, only the most recent results were included in the meta-analysis.
Forest Plots
Forest plots can provide a useful visual synopsis of individual study effects and their pooled
effects. The ‘metan’ command in STATA was used to create the forest plots in this chapter
(73). In each of these, the odds ratio, relative risk or relative rate for each study is referred to as
the effect size (ES). The ES is plotted as a black square surrounded by a shaded area
representing the weight of each study’s contribution to the meta-analysis, or precision of the
study’s ES. An arrow through the black square represents the 95% confidence interval about
the ES. The diamond represents the pooled ES. The width of the diamond indicates the size of
its 95% confidence interval. A pooled ES for cohort and case-control studies is provided
separately (subtotal), along with a pooled estimate for all study types combined (overall ES). In
each forest plot, a fixed inverse-variance model was applied using the logged relative risk (RR)
and their confidence intervals from cohort studies, and logged odds ratios (OR) and their
confidence intervals from case-control studies. The ES is the RR comparing the highest

16
category of dietary intake (4th quartile or 5th quintile) to the lowest category of dietary intake (1st
quartile or quintile), as in Etminan et al (74). The percent of variation in the pooled ES
attributable to heterogeneity is represented by the I-squared value. Where there is significant
heterogeneity amongst pooled studies it is less appropriate to calculate the pooled ES, so that
the forest plot serves only to provide a visual summary of study findings.
To check for publication bias in the reviewed studies, the ‘metabias’ command was used in
STATA (73). This produced a funnel plot and Begg’s statistical test for bias. It should be
acknowledged that this test tends to overestimate publication bias when there are a small
number of studies (75). The funnel plots are not shown, although an example is shown in
Appendix 1. Where there was evidence of publication bias, this is noted in the text.

17
Fruit, Vegetables and Meat and the Risk of Prostate Cancer
In 1997, the World Cancer Research Fund (WCRF) and the American Institute for Cancer
Research (AICR), issued global dietary recommendations to increase the consumption of fruit
and vegetables in order to prevent cancer (76). This was based on epidemiological evidence
that higher intakes of fruit and vegetables were consistently associated with lower rates of some
cancers including colorectal, oesophageal, lung and stomach cancer (76). At the time, there
was unconvincing evidence for a relationship between fruit and prostate cancer, however it was
thought that vegetable intake might decrease prostate cancer risk (50). Fruits and vegetables
provide a vast array of micronutrients, and experimental studies have demonstrated that specific
bioactive compounds common to plant foods, including lycopene, beta-carotene, vitamin E,
vitamin C, and various phytoestrogens (e.g. soy-derived isoflavonoids) may significantly reduce
prostate cancer risk or prostate cancer cell growth (9).
Although several reviews of fruit and vegetable intake and prostate cancer have considered the
evidence published since the 1997 WCRF/AIRC report, the latest comprehensive reviews were
published in 2004 (17, 77). An up-to-date review of the relevant literature is presented below.
Vegetables
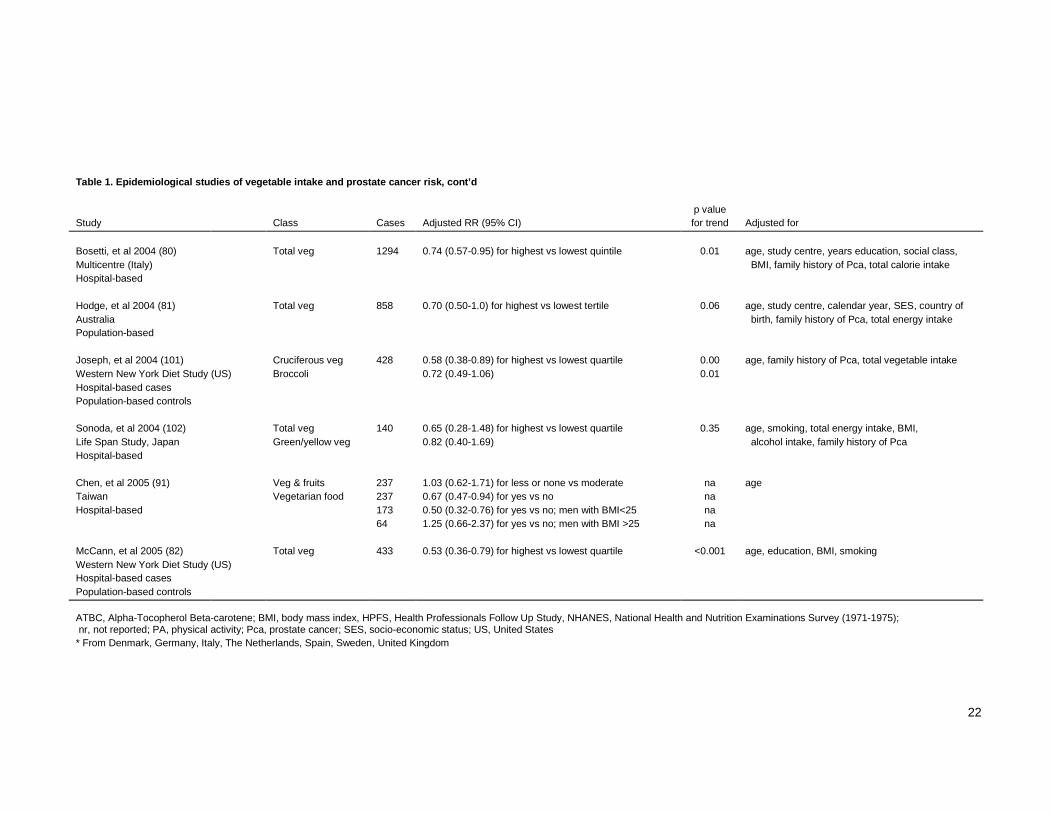
Epidemiological studies of vegetable intake and prostate cancer risk are summarised in Table 1.
Five case-control studies have reported significant reductions in risk with increased total
vegetable consumption, with odds ratios ranging from 0.52 to 0.74 (78-82). Two of these
studies were hospital-based (80, 82) and all except one (82) adjusted for family history of
prostate cancer. An additional population-based case-control study has reported reduced risks
with high intakes of green vegetables (83). No significant associations between total vegetable
intake and prostate cancer have been reported in cohort studies, including the large Health
Professionals Follow Up Study (HPFS) (84), European Prospective Investigation into Cancer
and Nutrition (EPIC) (85) and Hawaii-Los Angeles Multiethnic Cohort (86). Therefore, the
evidence supporting total vegetable intake is based on case-control studies, which are prone to
recall bias because the disease status of respondents may influence dietary recall, resulting in
errors in effect estimates. Furthermore, more than half of all studies (78, 79, 82, 83, 87-91)
including those reporting significant effects (78, 79, 82, 83) did not report using a validated

18
instrument to assess dietary intake. One hospital-based case-control study was excluded as its
analyses of leafy green vegetables was based on only 8 cases in the highest quartile of intake
(92). Another hospital-based case-control study was excluded because more than half of its
controls were admitted to hospital due to malignant conditions, including lymphohaemopoietic
cancers and bone and soft tissue sarcomas (93).
In Figure 5, although the pooled ES for total vegetables is significant for case-control studies
and across all studies, there is significant heterogeneity (p<0.05). Two case-control studies
were not included in the pooled analysis as they did not report confidence intervals or the data
to calculate them (87, 89). There was evidence of publication bias (Begg’s test p=0.013, see
Appendix 1), indicating that studies reporting an increased prostate cancer risk with increasing
vegetable intakes may not have been published.
Heterogeneity between groups: p = 0.014Overall (I-squared = 45.0%, p = 0.027)
Stram 2006
Villeneuve 1999
Key 1997Denio-Pellegrini 1999
Subtotal (I-squared = 0.0%, p = 0.682)
Cohen 2000
McCann 2005
Bosetti 2004
Subtotal (I-squared = 47.3%, p = 0.041)
Schuurman 1998
Tzonou 1999
cohort
Key 2004
Hodge 2004
Jain 1999
Chan 2000
Kolonel 2000
Giovannucci 1995
Study ID
case control
Sonoda 2004
0.91 (0.86, 0.96)
1.00 (0.90, 1.10)
1.00 (0.80, 1.30)
0.71 (0.34, 1.48)0.60 (0.30, 1.10)
0.98 (0.90, 1.06)
0.65 (0.45, 0.94)
0.53 (0.36, 0.79)
0.74 (0.57, 0.95)
0.85 (0.78, 0.92)
0.80 (0.57, 1.12)
0.97 (0.85, 1.10)
1.00 (0.81, 1.22)
0.70 (0.50, 1.00)
0.95 (0.68, 1.33)
0.80 (0.50, 1.30)
0.74 (0.58, 0.96)
0.96 (0.75, 1.21)
ES (95% CI)
0.65 (0.28, 1.48)
100.00
33.25
5.68
0.620.79
51.48
2.47
2.17
5.13
48.52
2.93
20.14
7.98
2.79
2.98
1.47
5.27
5.85
Weight
0.48
%
1.5 1.5
effect size
Figure 5. Forest plot of total vegetable intake and prostate cancer risk.

19
Table 1. Epidemiological studies of vegetable intak e and prostate cancer risk
Mean p value
Study Follow Up
Class Cases Adjusted RR (95% CI) for trend Adjusted for
Cohort Studies Giovannucci, et al 1995 (94) 7 yrs Mixed veg 773 0.96 (0.75-1.21) for highest vs lowest quartile 0.68 age, total energy intake HPFS (US) Broccoli 1.05 (0.83-1.34) 0.17 47,365 men
Schuurman, et al 1998 (95) 6.3 yrs Total veg 704 0.80 (0.57-1.12) for highest vs lowest quintile 0.51 age, family history of Pca, SES The Netherlands Brassica veg 0.82 (0.59-1.12) 0.06 age, family history of Pca, SES, total vegetable intake Population-based Leafy veg, cooked 0.95 (0.68-1.32) 0.76 58,279 men Leafy veg, raw 1.06 (0.75-1.50) 0.85
Chan, et al 2000 (96) 8 yrs Total veg 233 0.8 (0.50-1.30) for highest vs lowest quintile 0.84 supplementation group (alpha-tocopherol, ATBC Trial (Finland) beta-carotene, both, or placebo), 27,111 male smokers education, age, BMI, energy, smoking
Giovannucci, et al 2003 (84) 14 yrs Cruciferous veg 2,969 0.91 (0.79-1.04) for highest vs lowest quintile; all cases 0.13 age, BMI at age 21, BMI in 1986, height, smoking, HPFS (US) 591 0.72 (0.54-0.97) organ confined Pca, men aged <65 0.01 family history of Pca, history of diabetes mellitus, 47,365 men 1090 0.96 (0.78-1.19) organ-confined Pca, men aged >65 0.60 vigorous PA, intakes of total energy, red meat,
132 0.90 (0.48-1.70) extra-prostatic Pca, men aged <65 0.25 processed meat, fish, alpha-linolenic acid, calcium 317 1.10 (0.64-1.33) extra-prostatic Pca, men aged >65 0.07 and tomato sauce
Allen, et al 2004 (97) 16.9 yrs Yellow/green veg 196 0.98 (0.66-1.44) for highest vs lowest tertile 0.87 age, calendar period, city of residence, Hiroshima, Nagasaki, Japan Pickled/salted veg 1.06 (0.78-1.45) 0.55 radiation dose, education level Population-based 18,115 men
Key, et al 2004 (85) 4.8yrs Total veg 1,104 1.00 (0.81-1.22) for highest vs lowest quintile 0.74 height, weight, energy intake, study centre European Prospective Investigation Into Cancer and Nutrition (EPIC) 130,544 men *

20
Table 1. Epidemiological studies of vegetable intak e and prostate cancer risk, cont’d Mean p value
Study Follow Up
Class Cases Adjusted RR (95% CI) for trend Adjusted for
Stram, et al 2006 (86) 7 yrs Total veg 3,922 1.00 (0.90-1.10) for highest vs lowest quintile 0.47 age, BMI, education, family history of Pca, ethnicity Hawaii-Los Angeles (US) Cruciferous veg 1.03 (0.92-1.14) 0.77 Multiethnic Cohort Study Dark green veg 1.09 (0.98-1.20) 0.26 82,486 men Broccoli 1.08 (0.98-1.19) 0.27
Dark leafy greens 1.09 (0.99-1.21) 0.05
Case-control Studies
Le Marchand, et al 1991 (87) Dark green veg 189 0.7 for highest vs lowest quartile; men aged <70 yrs 0.21 age, ethnicity Oahu, Hawaii 263 1.3 for highest vs lowest quartile; men aged >70 0.39 Population-based Cruciferous veg 189 0.8 for highest vs lowest quartile; men aged <70 0.27
263 1.1 for highest vs lowest quartile; men aged >70 0.40
Key, et al 1997 (98) Cooked veg 328 0.71 (0.34-1.48) for highest vs lowest quartile 0.42 age, energy intake, social class England Dark leafy greens 328 1.24 (0.79-1.94) 0.82 Population-based
Deneo-Pellegrini, et al 1999 (88) Vegetables 175 0.60 (0.30-1.10) for highest vs lowest quartile 0.02 age, residence, urban/rural status, education Uruguay family history of Pca, BMI, energy intake Hospital-based
Hayes, et al 1999 (89) Vegetables 932 1.00 (p >0.05) for highest vs lowest quartile; all cases 0.89 age, study site, race Multicentre (US) 293 1.10 (p >0.05); advanced cases 0.006 Population-based
Jain, et al 1999 (83) Total veg 617 0.95 (0.68-1.33) for highest vs lowest quartile nr age, energy intake, smoking, marital status, Canada Leafy veg 0.94 (0.78-1.14) for >median vs < median intakes nr study area, BMI, education, dietary fibre, Population-based Green veg 0.54 (0.40-0.71) for highest vs lowest quartile nr multivitamin supplements
Cruciferous veg 0.85 (0.64-1.13) nr

21
Table 1. Epidemiological studies of vegetable intak e and prostate cancer risk, cont’d p value
Study Class Cases Adjusted RR (95% CI) for trend Adjusted for
Tzonou, et al 1999 (99) Total veg 320 0.97 (0.85-1.10) per quintile increment in consumption age, height, BMI, years of schooling, energy intake Greece Hospital-based
Villeneuve, et al 1999 (90) Total veg 1623 1.00 (0.80-1.30) for highest vs lowest quartile 0.79 age, province of residence, race, BMI, smoking Canadian National Enhanced Yellow/green veg 1.10 (0.70-1.60) 0.69 family history of Pca, smoking, income, various Cancer Surveillance System Cruciferous veg 0.90 (0.70-1.10) 0.57 other dietary intakes
Cohen, et al 2000 (78) Total veg 628 0.65 (0.45-0.94) for highest vs lowest quartile 0.01 age, race (white or black), family history of Pca, Seattle (US) using sum of all vegetables # PSA test within 5 yrs, education, BMI, Population-based 0.52 (0.31-0.84) for highest vs lowest quartile 0.05 total energy and fat intakes
using summary ('5-a-day') question Cruciferous veg 0.59 (0.39-0.90) for highest vs lowest quartile 0.02 age, race (white or black), family history of Pca, Green leafy veg 1.06 (0.49-2.26) 0.41 # PSA test within 5 yrs, education, BMI, Other veg 1.19 (0.53-2.66) 0.38 total energy, fat and vegetable intakes
Kolonel, et al 2000 (79) Total veg 1619 0.74 (0.58-0.96) for highest vs lowest quintile; all cases 0.04 age, geographic region, education, caloric intake, US, Canada 514 0.67 (0.46-0.96); advanced cases 0.04 ethnicity Population-based Dark green veg 1619 0.98 (0.77-1.25); all cases 0.41
514 0.88 (0.62-1.24); advanced cases 0.35 Yellow/orange 1619 0.79 (0.63-1.00); all cases 0.14 514 0.67 (0.48-0.94); advanced cases 0.01 Cruciferous veg 1619 0.78 (0.61-1.00); all cases 0.02 514 0.61 (0.42-0.88); advanced cases 0.01
Norrish, et al 2000 (100) Green leafy veg 317 1.09 (0.72-1.64) for highest vs lowest quartile 0.54 age, total calorie intake New Zealand Hospital/clinic cases Population controls
22
Table 1. Epidemiological studies of vegetable intak e and prostate cancer risk, cont’d p value
Study Class Cases Adjusted RR (95% CI) for trend Adjusted for
Bosetti, et al 2004 (80) Total veg 1294 0.74 (0.57-0.95) for highest vs lowest quintile 0.01 age, study centre, years education, social class, Multicentre (Italy) BMI, family history of Pca, total calorie intake Hospital-based Hodge, et al 2004 (81) Total veg 858 0.70 (0.50-1.0) for highest vs lowest tertile 0.06 age, study centre, calendar year, SES, country of Australia birth, family history of Pca, total energy intake Population-based
Joseph, et al 2004 (101) Cruciferous veg 428 0.58 (0.38-0.89) for highest vs lowest quartile 0.00 age, family history of Pca, total vegetable intake Western New York Diet Study (US) Broccoli 0.72 (0.49-1.06) 0.01 Hospital-based cases Population-based controls
Sonoda, et al 2004 (102) Total veg 140 0.65 (0.28-1.48) for highest vs lowest quartile 0.35 age, smoking, total energy intake, BMI, Life Span Study, Japan Green/yellow veg 0.82 (0.40-1.69) alcohol intake, family history of Pca Hospital-based
Chen, et al 2005 (91) Veg & fruits 237 1.03 (0.62-1.71) for less or none vs moderate na age Taiwan Vegetarian food 237 0.67 (0.47-0.94) for yes vs no na Hospital-based 173 0.50 (0.32-0.76) for yes vs no; men with BMI<25 na
64 1.25 (0.66-2.37) for yes vs no; men with BMI >25 na
McCann, et al 2005 (82) Total veg 433 0.53 (0.36-0.79) for highest vs lowest quartile <0.001 age, education, BMI, smoking Western New York Diet Study (US) Hospital-based cases Population-based controls
ATBC, Alpha-Tocopherol Beta-carotene; BMI, body mass index, HPFS, Health Professionals Follow Up Study, NHANES, National Health and Nutrition Examinations Survey (1971-1975); nr, not reported; PA, physical activity; Pca, prostate cancer; SES, socio-economic status; US, United States * From Denmark, Germany, Italy, The Netherlands, Spain, Sweden, United Kingdom

23
Brassica (Cruciferous) Vegetables
Brassica vegetables include cauliflower, broccoli, brussels sprouts, cabbage, bok choy, mustard
greens, radish and watercress, among others (103). A 2002 epidemiological review concluded
that there was modest support for high intakes of Brassica or cruciferous vegetables for the
prevention of prostate cancer (103). This was further corroborated by a 2003 report from the
HPFS (84). The glucosinolate phytoestrogens in Brassica vegetables exhibit various inhibitory
effects in prostate carcinogenesis in-vitro, (103, 104) and these are thought responsible for the
potentially protective effect of Brassica vegetables.
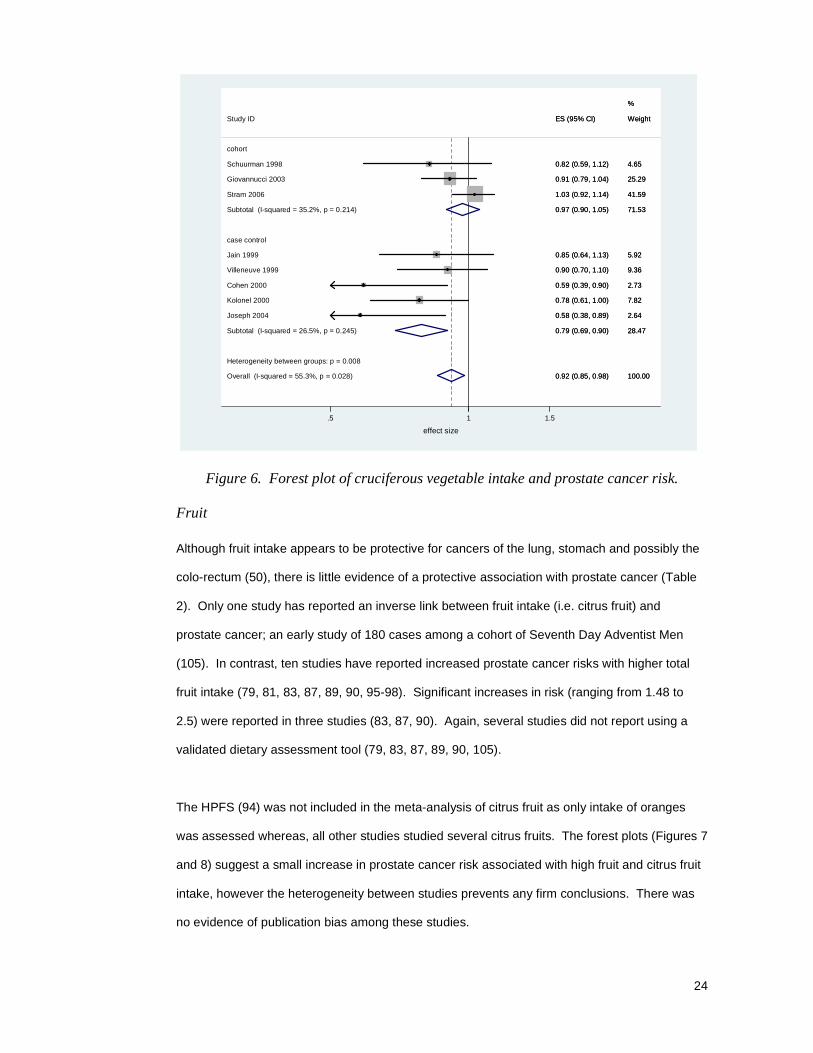
Ten studies have reported prostate cancer risk according to either cruciferous vegetables or
broccoli consumption (Table 1). Of these, four have reported significant reductions in prostate
cancer risk (odds ratios from 0.58 to 0.72) (78, 79, 84, 101). Most of the supporting evidence
comes from case-control studies (78, 79, 101) that have included a reasonable number of
cases, but none of these reported using a validated dietary instrument. The single cohort study
to find an association was the HPFS, and this was only in organ-confined cases under 65 years
of age, while an increased risk was suggested for advanced cases aged over 65 years (84).
The forest plot (Figure 6) indicates an inverse association between cruciferous vegetables and
prostate cancer in case-control studies but not cohort studies. However, there is evidence of
heterogeneity across all studies. There was evidence of publication bias (p=0.004), although
the number of studies is relatively small. The case-control study by Le Marchand et al could not
be included as confidence intervals were not reported (nor was the data to calculate them) (87).
24
Heterogeneity between groups: p = 0.008
Overall (I-squared = 55.3%, p = 0.028)
Study ID
case control
Stram 2006
Joseph 2004
Subtotal (I-squared = 26.5%, p = 0.245)
Villeneuve 1999
Kolonel 2000
cohort
Giovannucci 2003
Schuurman 1998
Jain 1999
Cohen 2000
Subtotal (I-squared = 35.2%, p = 0.214)
0.92 (0.85, 0.98)
ES (95% CI)
1.03 (0.92, 1.14)
0.58 (0.38, 0.89)
0.79 (0.69, 0.90)
0.90 (0.70, 1.10)
0.78 (0.61, 1.00)
0.91 (0.79, 1.04)
0.82 (0.59, 1.12)
0.85 (0.64, 1.13)
0.59 (0.39, 0.90)
0.97 (0.90, 1.05)
100.00
Weight
41.59
2.64
28.47
%
9.36
7.82
25.29
4.65
5.92
2.73
71.53
0.92 (0.85, 0.98)
ES (95% CI)
1.03 (0.92, 1.14)
0.58 (0.38, 0.89)
0.79 (0.69, 0.90)
0.90 (0.70, 1.10)
0.78 (0.61, 1.00)
0.91 (0.79, 1.04)
0.82 (0.59, 1.12)
0.85 (0.64, 1.13)
0.59 (0.39, 0.90)
0.97 (0.90, 1.05)
100.00
Weight
41.59
2.64
28.47
%
9.36
7.82
25.29
4.65
5.92
2.73
71.53
1.5 1.5
effect size
Figure 6. Forest plot of cruciferous vegetable intake and prostate cancer risk.
Fruit
Although fruit intake appears to be protective for cancers of the lung, stomach and possibly the
colo-rectum (50), there is little evidence of a protective association with prostate cancer (Table
2). Only one study has reported an inverse link between fruit intake (i.e. citrus fruit) and
prostate cancer; an early study of 180 cases among a cohort of Seventh Day Adventist Men
(105). In contrast, ten studies have reported increased prostate cancer risks with higher total
fruit intake (79, 81, 83, 87, 89, 90, 95-98). Significant increases in risk (ranging from 1.48 to
2.5) were reported in three studies (83, 87, 90). Again, several studies did not report using a
validated dietary assessment tool (79, 83, 87, 89, 90, 105).
The HPFS (94) was not included in the meta-analysis of citrus fruit as only intake of oranges
was assessed whereas, all other studies studied several citrus fruits. The forest plots (Figures 7
and 8) suggest a small increase in prostate cancer risk associated with high fruit and citrus fruit
intake, however the heterogeneity between studies prevents any firm conclusions. There was
no evidence of publication bias among these studies.

25
Heterogeneity between groups: p = 0.623Overall (I-squared = 45.1%, p = 0.034)
cohort
Kolonel 2000
McCann 2005
Study ID
Chan 2000
Subtotal (I-squared = 64.1%, p = 0.007)
Mills 1989
Denio-Pellegrini 1999
Hodge 2004
case control
Allen 2004Key 2004Stram 2006Subtotal (I-squared = 0.0%, p = 0.559)
Villeneuve 1999Jain 1999
Schuurman 1998
Cohen 2000Tzonou 1999
1.06 (1.00, 1.12)
1.01 (0.79, 1.28)
0.82 (0.56, 1.20)
ES (95% CI)
1.31 (0.80, 2.20)
1.04 (0.96, 1.14)
0.70 (0.32, 1.51)
0.80 (0.40, 1.40)
1.10 (0.90, 1.50)
1.20 (0.83, 1.74)1.06 (0.84, 1.34)1.05 (0.94, 1.12)1.07 (0.99, 1.16)
1.50 (1.10, 1.90)1.51 (1.14, 2.01)
1.31 (0.96, 1.79)
1.07 (0.72, 1.60)0.92 (0.86, 1.11)
100.00
%
5.59
2.24
Weight
1.27
44.08
0.54
0.83
4.99
2.385.9742.4155.92
4.364.05
3.35
2.0419.99
1.5 2
effect size
Figure 7. Forest plot of total fruit intake and prostate cancer risk.
Heterogeneity between groups: p = 0.548
Overall (I-squared = 63.7%, p = 0.007)
Subtotal (I-squared = 55.1%, p = 0.064)
cohort
Bosetti 2004
Key 1997
Study ID
Subtotal (I-squared = 80.0%, p = 0.007)
case control
Mills 1989
Kolonel 2000
Schuurman 1998
Cohen 2000
Stram 2006
Jain 1999
1.08 (1.00, 1.17)
1.12 (0.98, 1.28)
0.90 (0.70, 1.16)
1.45 (0.83, 2.52)
ES (95% CI)
1.06 (0.97, 1.17)
0.53 (0.34, 0.86)
1.15 (0.91, 1.45)
1.27 (0.93, 1.73)
0.89 (0.60, 1.31)
1.08 (0.97, 1.19)
1.48 (1.12, 1.96)
100.00
33.85
9.36
1.94
Weight
66.15
2.77
11.01
6.20
3.92
57.17
7.63
%
1.08 (1.00, 1.17)
1.12 (0.98, 1.28)
0.90 (0.70, 1.16)
1.45 (0.83, 2.52)
ES (95% CI)
1.06 (0.97, 1.17)
0.53 (0.34, 0.86)
1.15 (0.91, 1.45)
1.27 (0.93, 1.73)
0.89 (0.60, 1.31)
1.08 (0.97, 1.19)
1.48 (1.12, 1.96)
100.00
33.85
9.36
1.94
Weight
66.15
2.77
11.01
6.20
3.92
57.17
7.63
%
1.5 2
effect size
Figure 8. Forest plot of citrus fruit intake and prostate cancer risk.

26
Table 2. Epidemiological studies of fruit intake a nd prostate cancer risk
Study Mean Class Cases Adjusted RR (95% CI) p value Adjusted for
Follow Up for trend
Cohort Studies
Mills, et al 1989 (105) 6 yrs Fresh citrus fruit 180 0.53 (0.34-0.86) for highest vs lowest tertile 0.008 age Seventh Day Adventists (US) Fruit index (canned, frozen 0.70 (0.32-1.51) for highest vs lowest tertile 0.04 14,000 men fresh citrus, winter, dried
and other fruit)
Giovannucci, et al 1995 (94) 7 yrs Oranges 773 0.94 (0.72-1.22) for highest vs lowest quintile 0.80 age, total energy intake HPFS (US) 47,365 men
Schuurman, et al 1998 (95) 6.3 yrs Fruit 704 1.31 (0.96-1.79) for highest vs lowest quintile 0.02 age, family history of Pca, SES Netherlands, pop’ based Citrus fruit 1.27 (0.93-1.73) for highest vs lowest quintile 0.01 age, family history of Pca, SES, total fruit intake 58,279 men
Chan, et al 2000 (96) 8 yrs Fruit 581 1.3 (0.80-2.2) for highest vs lowest quintile 0.13 supplementation group (alpha-tocopherol, ATBC Trial (Finland) beta-carotene, both, or placebo), 27,111 male smokers education, age, BMI, energy, smoking
Allen, et al 2004 (97) 16.9 yrs Fruit 196 1.20 (0.83-1.74) for highest vs lowest quintile 0.40 age, calendar period, city of residence, Hiroshima, Nagasaki, Japan radiation dose, education level Population-based 18,115 men
Key, et al 2004 (85) 4.8yrs Total Fruit 1,104 1.06 (0.84-1.34) for the highest vs lowest quintile 0.74 height, weight, energy intake, study centre European Prospective Investigation Into Cancer and Nutrition (EPIC) 130,544 men *

27
Table 2. Epidemiological studies of fruit intake a nd prostate cancer risk, cont’d
Study Mean Class Cases Adjusted RR (95% CI) p value Adjusted for Follow Up for trend
Stram, et al 2006 (86) 7 yrs All fruits and juices 3,922 1.05 (0.94-1.12) for highest vs lowest quintile 0.60 age, BMI, education, family history of Pca, ethnicity Hawaii-Los Angeles (US) Citrus fruit 1.08 (0.97-1.19) 0.23 Multiethnic Cohort Study Yellow or orange fruit 1.05 (0.94-1.16) 0.17 82,486 men Papaya 0.93 (0.85-1.02) for highest vs lowest tertile 0.24
Case-control Studies
Le Marchand, et al 1991 (87) Papaya 189 1.3 (0.8-2.1) for highest vs lowest quartile; men aged <70 0.43 age, ethnicity Oahu, Hawaii 263 2.5 (1.6-4.0) for highest vs lowest quartile; men aged >70 0.00 Population-based Mangoes 189 1.2 (0.7-2.0) for highest vs lowest quartile; men aged <70 0.18
263 0.9 (0.6-1.5) for highest vs lowest quartile; men aged >70 0.78
Key, et al 1997 (98) Citrus fruit 328 1.45 (0.83-2.52) for highest vs lowest quartile 0.09 age, energy intake, social class England Other fruit 328 0.99 (0.58-1.68) 0.54 Population-based
Deneo-Pellegrini, et al 1999 (88) Fruit 175 0.80 (0.40-1.40) for highest vs lowest quartile 0.08 age, residence, urban/rural status, education Uruguay family history of Pca, BMI, energy intake Hospital-based
Hayes, et al 1999 (89) Fruit 932 1.10 (p>0.05) for highest vs lowest quartile; all cases 0.48 age, study site, race Multicentre (US) 293 1.00 (p>0.05); advanced cases 0.9 Population-based
Jain, et al 1999 (83) Total fruit 617 1.51 (1.14-2.01) for highest vs lowest quartile nr age, energy intake, smoking, marital status, Canada Citrus fruit 1.48 (1.12-1.96) nr study area, BMI, education, dietary fibre, Population-based Fruit, non citrus 1.54 (1.07-2.22) nr education, multivitamin supplements
Tzonou, et al 1999 (99) Fruit 320 0.92 (0.86-1.11) per quintile increment in consumption nr age, height, BMI, years of schooling, energy intake Greece Hospital-based

28
Table 2. Epidemiological studies of fruit intake a nd prostate cancer risk, cont’d
Study Class Cases Adjusted RR (95% CI) p value Adjusted for for trend
Villeneuve, et al 1999 (90) Fruits and fruit juices 1623 1.50 (1.10-1.90) for highest vs lowest quartile 0.03 age, province of residence, race, BMI, smoking Canadian National Enhanced family history of Pca, smoking, income, various Cancer Surveillance System other dietary intakes
Cohen, et al 2000 (78) Fruit 628 1.07 (0.72-1.60) for highest vs lowest quartile 0.86 age, race (white or black), energy and fat intake, Seattle (US) using sum of all fruit education, BMI, #PSA test within 5 yrs, Population-based 0.80 (0.53-1.23) for highest vs lowest quartile 0.38 family history of Pca
using summary ('5-a-day') question Citrus fruit 0.89 (0.60-1.31) highest vs lowest quartile 0.70 Other fruit 0.99 (0.54-1.18) 0.99
Kolonel, et al 2000 (79) Fruit 1619 1.01 (0.79-1.28) for highest vs lowest quintile; all cases 0.48 age, geographic region, education, caloric intake, US, Canada 514 1.13 (0.80-1.60); advanced cases 0.36 ethnicity Population-based Citrus fruit 1619 1.15 (0.91-1.45); all cases 0.40
514 1.22 (0.88-1.70); advanced cases 0.45
Bosetti, et al 2004 (80) Citrus fruit 1294 0.90 (0.70-1.16) for highest vs lowest quintile 0.12 age, study centre, years education, social class, Multicentre (Italy) Other fruit 0.85 (0.65-1.10) 0.12 family history of Pca, total calorie intake, BMI Hospital-based
Hodge, et al 2004 (81) Fruit 858 1.1 (0.9-1.5) for highest vs lowest tertile 0.60 age, study centre, calendar year, SES, country of Australia birth, family history of Pca, energy intake Population-based
McCann, et al 2005 (82) Fruit and fruit juices 433 0.82 (0.56-1.20) for highest vs lowest quartile 0.25 age, education, BMI, smoking Western New York Diet Study (US) Hospital-based cases Population-based controls ATBC, Alpha-Tocopherol Beta-carotene; BMI, body mass index, HPFS, Health Professionals Follow Up Study, NHANES, National Health and Nutrition Examinations Survey (1971-1975); nr, not reported; PA, physical activity; Pca, prostate cancer; SES, socio-economic status; US, United States * From Denmark, Germany, Italy, The Netherlands, Spain, Sweden, United Kingdom

29
Tomatoes
Interest in tomato intake and its predominant carotenoid, lycopene, was stimulated by the 1995
findings from the HPFS which reported significant inverse relationships between tomato intake
and prostate cancer risk (94). A meta-analysis of studies published before March 2003 reported
that for a high intake (fifth quintile) of cooked tomato, the pooled RR was 0.81 (95% CI,
0.71-0.92) (74). The pooled RR for high intake of raw tomatoes was 0.89 (95% CI, 0.80-1.00)
reflecting possibly, the greater bioavailability of lycopene in cooked tomato than raw tomato
(74). The pooled RR for high lycopene intake was 0.89 (95% CI, 0.81-0.98). Intervention trials
have failed to support lycopene supplements for prostate cancer prevention, but suggest that
increasing doses of tomatoes or tomato products may protect against DNA damage and
possibly, prostate cancer (106).
The US Food and Drug Administration (FDA) systematically reviewed the tomatoes, lycopene
and prostate cancer literature in 2007, but did not undertake a meta-analysis. Based on this
review, the FDA concluded that there was ‘very limited evidence’ to support a relationship
between tomato consumption and a reduced risk of prostate cancer (107). Additionally, there
was ‘no credible evidence’ of an association between lycopene intake and a reduced risk of
prostate cancer (107).
To date, sixteen original papers have examined tomato intake and prostate cancer risk (Table
3). Of these, only four have reported statistically significant inverse relationships. This includes
evidence from the HPFS (94, 108); a large, well-conducted cohort study of male health
professionals living in the US (94, 108). The Seventh Day Adventist cohort study (105) and two
population-based case-control studies (81, 83) also reported significant reductions in risk.
However, only two of these studies used validated instruments and controlled for family history
of prostate cancer and total energy intake (81, 94, 108). In some studies there were problems
relating to not specifying cooked or raw tomato (87, 102), the use of hospital-based cases and
possibly incomplete case ascertainment (100, 102), relatively small numbers of cases (87, 102),
and many did not adjust for family history of prostate cancer (79, 87, 89, 98, 100).

30
Studies not specifying cooked or raw tomato were excluded from the pooled analyses. The
forest plots below show that cooked tomato intake (Figure 9) appears protective against
prostate cancer, without significant heterogeneity between studies. There appears to be no
association with raw tomato intake (Figure 10). There was no evidence of publication bias.
Heterogeneity between groups: p = 0.203
Overall (I-squared = 10.7%, p = 0.344)
Stram 2006
Cohen 2000
Key 1997
Subtotal (I-squared = 0.0%, p = 0.824)
Hodge 2004
Giovannucci 2002
cohort
Kolonel 2000
Kirsch 2006
case-control
Tzonou 1999
Jain 1999
Study ID
Subtotal (I-squared = 64.2%, p = 0.061)
Norrish 2000
0.87 (0.80, 0.94)
0.95 (0.85, 1.06)
0.90 (0.57, 1.42)
0.92 (0.59, 1.42)
0.80 (0.69, 0.93)
0.80 (0.60, 1.00)
0.72 (0.59, 0.89)
0.94 (0.58, 1.52)
0.99 (0.81, 2.21)
0.46 (0.04, 3.60)
0.64 (0.45, 0.91)
ES (95% CI)
0.90 (0.81, 0.99)
0.77 (0.50, 1.18)
100.00
53.63
3.14
3.39
28.31
10.02
15.47
2.82
2.59
0.13
5.27
Weight
71.69
3.55
%
1.5 2
effect size
Figure 9. Forest plot of cooked tomato intake and prostate cancer risk

31
Heterogeneity between groups: p = 0.892
Overall (I-squared = 0.0%, p = 0.970)
Key 1997
case-control
Subtotal (I-squared = 0.0%, p = 0.864)
Subtotal (I-squared = 0.0%, p = 0.866)
Kolonel 2000
Norrish 2000
cohort
Stram 2006
Study ID
Tzonou 1999
Kirsch 2006
Cohen 2000
1.06 (0.98, 1.15)
1.06 (0.55, 1.62)
1.07 (0.90, 1.28)
1.06 (0.96, 1.16)
1.07 (0.83, 1.38)
0.96 (0.63, 1.46)
1.06 (0.96, 1.18)
ES (95% CI)
0.53 (0.08, 2.90)
1.04 (0.86, 1.27)
1.22 (0.83, 1.80)
100.00
2.26
20.78
79.22
10.19
%
3.73
61.88
Weight
0.20
17.34
4.40
1.06 (0.98, 1.15)
1.06 (0.55, 1.62)
1.07 (0.90, 1.28)
1.06 (0.96, 1.16)
1.07 (0.83, 1.38)
0.96 (0.63, 1.46)
1.06 (0.96, 1.18)
ES (95% CI)
0.53 (0.08, 2.90)
1.04 (0.86, 1.27)
1.22 (0.83, 1.80)
100.00
2.26
20.78
79.22
10.19
%
3.73
61.88
Weight
0.20
17.34
4.40
1.5 2
effect size
Figure 10. Forest plot of raw tomato intake and prostate cancer risk

32
Table 3. Epidemiological studies of tomato intake and prostate cancer risk
Mean p value
Study Follow Up Class Cases Adjusted RR (95% CI) for trend Adjusted for
Cohort Studies
Mills, et al 1989 (105) 6 yrs Tomato, unspec. 180 0.57 (0.35-0.93) for highest vs lowest tertile 0.06 age Seventh Day Adventists (US) 14,000 men
Giovannucci, et al 1995 (94) 7 yrs Tomato based 773 0.65 (0.44-0.95) for highest vs lowest quintile; all cases 0.01 age, total energy intake HPFS (US) foods 271 0.47 (0.22-1.00);advanced cases 0.03 47,365 men Tomato sauce 773 0.66 (0.49-0.90) for highest vs lowest quartile; all cases 0.00
Tomatoes 773 0.74 (0.58-0.93) for highest vs lowest quartile; all cases 0.03
Giovannucci, et al 2002 (108) 20 yrs Tomato sauce 1320 0.72 (0.59-0.89) for highest vs lowest quartile; organ confined cases <0.001 age, time period, ancestry, BMI age 21, HPFS (US) 354 0.65 (0.42-0.99); advanced cases 0.02 intakes of total energy, calcium, 47,365 men 278 0.64 (0.39-1.05); metastatic cases 0.03 phosphorous, fructose, vitamin D,
vitamin E, total fat and α-linolenic acid
Kirsh, et al 2006 (109) 4.2 yrs Total tomato servings 1,338 0.99 (0.81-2.21) for highest vs lowest quintile 0.36 age, family history of Pca, BMI, PA, Prostate, Lung Colorectal Raw tomato 1.04 (0.86-1.27) 0.84 smoking, type II diabetes, aspirin use, and Ovarian Trial Canned tomatoes 0.96 (0.79-1.16) for highest vs lowest quartile 0.50 supplemental vitamin E intake, US, population-based Spaghetti/tomato sauce 0.96 (0.76-1.19) 0.65 # screening exams, total energy, fat
Pizza 0.83 (0.67-1.03) 0.06 red meat intake Ketchup 0.99 (0.82-1.19) 0.68
Stram, et al 2006 (86) 7 yrs Cooked tomato 3,922 0.95 (0.85-1.06) for highest vs lowest quintile 0.38 age, BMI, education, ethnicity, family Hawaii-Los Angeles (US) Raw tomato 1.06 (0.96-1.18) 0.61 history of Pca Multiethnic Cohort Study 82,486 men

33
Table 3. Epidemiological studies of tomato intake and prostate cancer risk, cont'd p value
Study Class Cases Adjusted RR (95% CI) for trend Adjusted for
Case-control studies
Le Marchand, et al 1991 (87) Tomatoes, unspec. 189 0.90 for highest vs lowest quartile; men aged <70 yrs 0.35 age, ethnicity Oahu, Hawaii 263 1.10 for highest vs lowest quartile; men aged >70 0.57 Population-based
Hayes, et al 1999 (89) Cooked tomatoes and 932 1.30 (p >0.05) for highest vs lowest quartile; all cases 0.71 age, study site, race Multicentre (US) tomato sauce 293 1.60 (p >0.05); advanced cases 0.95 Population-based Raw tomato 932 0.80 (p >0.05) for highest vs lowest quartile; all cases 0.16
293 0.50 (p <0.05); advanced cases 0.04
Jain, et al 1999 (83) Tomatoes 617 0.64 (0.45-0.91) for highest vs lowest quartile nr age, smoking, education, marital status Canada incl. tomato soups, study area, BMI, energy intake, Population-based sauces dietary fibre, multivitamin supplements
Key, et al 1997 (98) Cooked tomato 328 0.92 (0.59-1.42) for highest vs lowest quartile 0.64 age, energy intake, social class England Raw tomato 1.06 (0.55-1.62) 0.88 Population-based
Tzonou, et al 1999 (99) Cooked tomatoes 320 0.46 (0.04-3.60) for highest vs lowest quintile age, height, BMI, years of schooling, Greece Raw Tomatoes 320 0.53 (0.08-2.90) energy intake Hospital-based
Villeneuve, et al 1999 (90) Tomatoes or tomato 1623 1.00 (0.70-1.13) for highest vs lowest quartile 0.29 age, province of residence, race, BMI Canadian National Enhanced juice family history of Pca, smoking, income Cancer Surveillance System various other dietary intakes
Kolonel, et al 2000 (79) Tomatoes, cooked 1619 0.94 (0.58-1.52) for highest vs lowest quintile; all cases 0.56 age, geographic region, education, US, Canada 514 0.96 (0.48-1.93); advanced cases 0.76 caloric intake, ethnicity Population-based Tomatoes, raw 1619 1.07 (0.83-1.38); all cases 0.85
514 1.08 (0.75-1.56); advanced cases 0.78

34
Table 3. Epidemiological studies of tomato intake and prostate cancer risk, cont’d p value
Study Class Cases Adjusted RR (95% CI) for trend Adjusted for
Norrish, et al 2000 (100) Tomatoes and 317 0.77 (0.50-1.18) for highest vs lowest quartile 0.17 age, total calorie intake New Zealand tomato based foods Hospital/clinic cases Raw Tomato 0.96 (0.63-1.46) 0.67 Population controls
Cohen, et al 2000 (78) Tomatoes, cooked 628 0.90 (0.57-1.42) for highest vs lowest quartile 0.68 age, race (white or black), BMI, family Seattle (US) Tomatoes, raw 1.22 (0.83-1.80) for highest vs lowest quartile 0.26 history of Pca, education, # PSA Population-based tests within 5 yrs, total energy
fat and vegetable intakes
Hodge, et al 2004 (81) Tomatoes, 858 0.80 (0.60-1.0) for the highest vs lowest tertile 0.03 age, study centre, calendar year, family Australia pizza, pasta history of Pca, country of birth, SES, Population-based total energy intake
Sonoda, et al 2004 (102) Tomatoes, unspec. 140 0.86 (0.37-2.01) for highest vs lowest quartile 0.87 age, smoking, total energy intake, BMI, Life Span Study, Japan alcohol intake, family history of Pca Hospital-based
BMI, body mass index; HPFS, Health Professionals Follow Up Study; nr, not reported; PA, physical activity, Pca, prostate cancer; PLCO, Prostate, Lung, Colorectal and Ovarian; PSA, prostate specific antigen; SES, socio-economic status; unspec., unspecified; US, United States * From Denmark, Germany, Italy, The Netherlands, Spain, Sweden, United Kingdom

35
Meat
High meat intake is characteristic of a ‘western’ diet, and is hypothesised to increase prostate
cancer risk through several possible mechanisms albeit, none confirmed: i) the saturated fat
content of meat, which provides a substrate for oxidative stress (51), ii) the carcinogenic
heterocyclic amines formed when meat is cooked at high temperatures (110), which have been
hypothesised as causing inflammation in the prostate (11) and iii) the nitrosamine content of
processed and cured meats, some of which have been classified as probable human
carcinogens (111).
Of the sixteen studies of meat intake and prostate cancer reviewed (Table 4), five reported
statistically significant results (89, 112-114). A large case-control study by Hayes et al (89)
reported significantly higher risks with total meat and red meat intake, however they did not
account for family history of prostate cancer and validation of the dietary instrument was not
reported. Le Marchand et al (112) reported significantly higher risks with increasing beef intake,
after controlling for ethnicity. The cohort study by Rodriguez et al (113) reported significantly
increased risks with higher intakes of processed and unprocessed red meat among black men
only.
Three cohort studies reported statistically non-significant increases in risk with high intakes of
processed meats (114-116). Of these, Schuurman et al reported a 37% increase in risk for
cured meats but this result is based on only 71 of the 524 cases (114). Two studies suggested
increased risks for advanced prostate cancer with higher intakes of processed meat (115, 116),
but these were not statistically significant.
The largest cohort study to date (involving over 4,000 cases) by Park et al (117) reported no
statistically significant relationships between total meat, red meat or processed meat and
prostate cancer risk, after adjusting for tumour stage and ethnicity, and attempting to calibrate
dietary variables. One difference with this study is that grams of meat per 1000 kilocalories was
examined, whereas some (118) have argued against using this method to adjust for total energy
intake. Most other studies have examined absolute meat intakes (grams meat/day) and
included energy intake as a potential confounder.

36
Eight other studies were excluded from this review as they were either small hospital-based
case-control studies (92, 119, 120) or their analysis included very small cell sizes (97, 121). An
additional hospital-based case-control study was excluded because more than half of its
controls were cancer patients (93). Two studies that combined meat and fish intake were
excluded (99, 105) as fish has been reported to reduce prostate cancer risk in some studies
(122). One cohort study was excluded as it analysed a total of 22 incident cases (123).
Overall, the evidence for total meat intake as a risk factor is not convincing. Most of the
reported risks were close to one, and several studies included relatively small numbers of cases
in their sub-analyses (88, 98, 114, 115). For all cancer stages combined, the forest plots show
no obvious relationships between prostate cancer risk and total meat intake (Figure 11), red
meat (Figure 12) or processed meat (Figure 13). Similarly, in the pooled analysis of advanced
cases (Figure 14) there are no convincing relationships for any meat type. However, when the
study by Park et al (117) is excluded because it analysed meat intake as a grams/1000
kilocalories, a very different ES results for processed meat and advanced prostate cancer
(forest plot not shown). The pooled ES shifts to 1.32 (95% CI, 1.03-1.71) and the heterogeneity
between studies is reduced (p for heterogeneity=0.374, overall p=0.296), indicating a significant
positive relationship between processed meat intake and advanced prostate cancer. The
pooled ES did not change substantially when Park et al was removed from the other forest plots
(Figures 11-13). Publication bias was not evident in any of these meta-analyses.

37
Heterogeneity between groups: p = 0.668
Overall (I-squared = 5.8%, p = 0.388)
Subtotal (I-squared = 18.1%, p = 0.296)
Park 2007
Michaud 2001
Villeneuve 1999
Sonoda 2004
Denio-Pellegrini 1999
Hodge 2004
Rorhmann 2007
Key 1997
McCann 2005
cohort
Study ID
Schuurman 1999
case control
Subtotal (I-squared = 8.2%, p = 0.352)
1.04 (0.96, 1.12)
1.00 (0.85, 1.19)
1.10 (0.91, 1.12)
0.93 (0.78, 1.10)
1.00 (0.70, 1.30)
1.80 (0.81, 3.98)
1.60 (0.80, 3.40)
1.00 (0.80, 1.40)
0.90 (0.60, 1.33)
0.64 (0.36, 1.14)
0.94 (0.62, 1.43)
ES (95% CI)
1.07 (0.77, 1.47)
1.05 (0.96, 1.14)
100.00
19.92
52.14
19.02
5.87
0.89
1.07
%
7.18
3.55
1.69
3.22
Weight
5.38
80.08
1.5 2
effect size
Figure 11. Forest plot of total meat intake and prostate cancer risk
Heterogeneity between groups: p = 0.444
Overall (I-squared = 30.1%, p = 0.178)
Michaud 2001
Park 2007
Denio-Pellegrini 1999
case control
Rodriguez 2006
Subtotal (I-squared = 34.3%, p = 0.166)
Study ID
Rorhmann 2007
Bosetti 2004
Neuhouser 2007
Cross 2005
Le Marchand 1994
Subtotal (I-squared = 42.0%, p = 0.189)
cohort
0.98 (0.92, 1.04)
0.91 (0.75, 1.10)
0.97 (0.87, 1.07)
1.70 (0.80, 3.40)
1.00 (0.90, 1.10)
0.97 (0.92, 1.04)
ES (95% CI)
0.87 (0.59, 1.32)
1.01 (0.76, 1.34)
0.95 (0.75, 1.20)
0.81 (0.62, 1.06)
1.60 (1.10, 2.40)
1.08 (0.83, 1.41)
100.00
9.77
33.47
0.68
%
35.59
94.86
Weight
2.21
4.46
6.49
4.98
2.35
5.14
1.5 2
effect size
Figure 12. Forest plot of red meat intake and prostate cancer risk

38
Heterogeneity between groups: p = 0.492
Overall (I-squared = 13.1%, p = 0.325)
Schuurman 1999
Study ID
Le Marchand 1994
McCann 2005
Denio-Pellegrini 1999
Subtotal (I-squared = 35.9%, p = 0.167)
cohort
Subtotal (I-squared = 0.0%, p = 0.628)
Rorhmann 2007
Park 2007
Rodriguez 2006
Bosetti 2004
case control
Cross 2005
1.04 (0.97, 1.10)
1.37 (1.00, 1.89)
ES (95% CI)
1.20 (0.80, 1.90)
0.87 (0.58, 1.32)
0.80 (0.40, 1.40)
1.04 (0.98, 1.11)
0.96 (0.76, 1.21)
1.53 (0.98, 2.39)
1.01 (0.91, 1.12)
1.00 (0.90, 1.10)
1.06 (0.76, 1.42)
1.16 (0.91, 1.50)
100.00
4.00
%
Weight
2.16
2.39
1.03
92.43
7.57
2.04
37.55
40.20
4.14
6.48
1.5 2
effect size
Figure 13. Forest plot of processed meat intake and prostate cancer risk
Heterogeneity between groups: p = 0.503Overall (I-squared = 0.0%, p = 0.469)
Total meat
Michaud 2001
Processed meat
Rorhmann 2007
Cross 2005
Rorhmann 2007
Subtotal (I-squared = 0.0%, p = 0.782)
Subtotal (I-squared = 58.6%, p = 0.064)
Michaud 2001
Rodriguez 2006
Park 2007
Rodriguez 2006
Park 2007
Cross 2005
Subtotal (I-squared = 0.0%, p = 0.850)
Park 2007Rorhmann 2007
Red meat
Study ID
0.97 (0.89, 1.06)
1.15 (0.80, 1.70)
0.90 (0.41, 1.93)
0.92 (0.66, 1.29)
0.87 (0.39, 1.93)
0.95 (0.83, 1.09)
1.04 (0.90, 1.21)
0.85 (0.61, 1.20)
0.80 (0.50, 1.13)
0.95 (0.79, 1.14)
1.10 (0.70, 1.70)
0.95 (0.79, 1.14)
1.37 (0.99, 1.90)
0.93 (0.79, 1.08)
0.92 (0.77, 1.11)2.24 (0.90, 5.59)
ES (95% CI)
100.00
5.06
1.20
6.41
1.13
38.32
32.80
6.29
4.33
21.39
3.65
21.39
6.77
%
28.88
21.510.86
Weight
1.5 2.4
effect size
Figure 14. Forest plot of meat intakes and advanced prostate cancer
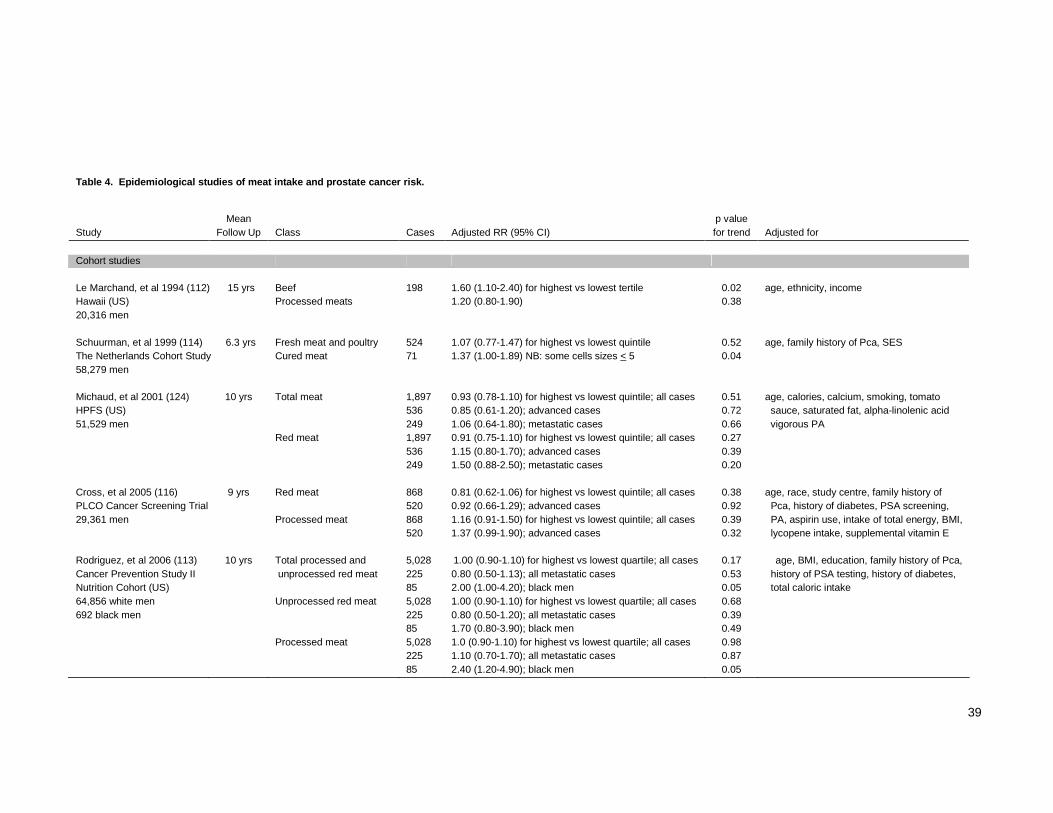
39
Table 4. Epidemiological studies of meat intake an d prostate cancer risk.
Mean p value
Study Follow Up Class Cases Adjusted RR (95% CI) for trend Adjusted for
Cohort studies
Le Marchand, et al 1994 (112) 15 yrs Beef 198 1.60 (1.10-2.40) for highest vs lowest tertile 0.02 age, ethnicity, income Hawaii (US) Processed meats 1.20 (0.80-1.90) 0.38 20,316 men
Schuurman, et al 1999 (114) 6.3 yrs Fresh meat and poultry 524 1.07 (0.77-1.47) for highest vs lowest quintile 0.52 age, family history of Pca, SES The Netherlands Cohort Study Cured meat 71 1.37 (1.00-1.89) NB: some cells sizes < 5 0.04 58,279 men
Michaud, et al 2001 (124) 10 yrs Total meat 1,897 0.93 (0.78-1.10) for highest vs lowest quintile; all cases 0.51 age, calories, calcium, smoking, tomato HPFS (US) 536 0.85 (0.61-1.20); advanced cases 0.72 sauce, saturated fat, alpha-linolenic acid 51,529 men 249 1.06 (0.64-1.80); metastatic cases 0.66 vigorous PA
Red meat 1,897 0.91 (0.75-1.10) for highest vs lowest quintile; all cases 0.27 536 1.15 (0.80-1.70); advanced cases 0.39 249 1.50 (0.88-2.50); metastatic cases 0.20
Cross, et al 2005 (116) 9 yrs Red meat 868 0.81 (0.62-1.06) for highest vs lowest quintile; all cases 0.38 age, race, study centre, family history of PLCO Cancer Screening Trial 520 0.92 (0.66-1.29); advanced cases 0.92 Pca, history of diabetes, PSA screening, 29,361 men Processed meat 868 1.16 (0.91-1.50) for highest vs lowest quintile; all cases 0.39 PA, aspirin use, intake of total energy, BMI,
520 1.37 (0.99-1.90); advanced cases 0.32 lycopene intake, supplemental vitamin E
Rodriguez, et al 2006 (113) 10 yrs Total processed and 5,028 1.00 (0.90-1.10) for highest vs lowest quartile; all cases 0.17 age, BMI, education, family history of Pca, Cancer Prevention Study II unprocessed red meat 225 0.80 (0.50-1.13); all metastatic cases 0.53 history of PSA testing, history of diabetes, Nutrition Cohort (US) 85 2.00 (1.00-4.20); black men 0.05 total caloric intake 64,856 white men Unprocessed red meat 5,028 1.00 (0.90-1.10) for highest vs lowest quartile; all cases 0.68 692 black men 225 0.80 (0.50-1.20); all metastatic cases 0.39
85 1.70 (0.80-3.90); black men 0.49 Processed meat 5,028 1.0 (0.90-1.10) for highest vs lowest quartile; all cases 0.98 225 1.10 (0.70-1.70); all metastatic cases 0.87 85 2.40 (1.20-4.90); black men 0.05

40
Table 4. Epidemiological studies of meat intake an d prostate cancer risk, cont’d Mean p value
Study Follow Up Class Cases Adjusted RR (95% CI) for trend Adjusted for
Neuhouser, et al 2007 (125) 11 yrs Red meat 890 0.95 (0.75-1.20) for highest vs lowest quartile; all cases 0.25 age, energy intake, BMI, smoking, family CARET (US) history of Pca 18, 314 heavy smokers and asbestos exposed workers Park, et al 2007 (117) 8 yrs Total meat 1.01 (0.91-1.12); highest vs lowest quintile; all cases 0.63 time on study, ethnicity, family history of Pca Multiethnic Cohort Study 1.07 (0.89-1.28); high grade cancers 0.67 education, BMI, smoking, energy intake Hawaii and Los Angeles Red meat 0.97 (0.87-1.07); highest vs lowest quintile; all cases 0.40 82,483 men 0.95 (0.79-1.14); high grade cancers 0.56 Processed meat 1.01 (0.91-1.12); highest vs lowest quintile; all cases 0.49 0.92 (0.77-1.11); high grade cancers 0.21
Rohrmann, et al 2007 (115) 16 yrs Total meat 199 0.90 (0.60-1.33) for highest vs lowest tertile; all cases 0.99 age, energy intake, BMI at age 21, intake CLUE II Study 74 0.66 (0.34-1.29); low stage cases (18 in highest tertile) 0.22 of tomato products, saturated fat Washington County (US) 54 0.90 (0.41-1.93); high stage cases (13 in highest tertile) 0.76 3,892 men Red meat 199 0.87 (0.59-1.32); all cases 0.52
74 0.60 (0.31-1.18); low stage cases (18 in highest tertile) 0.13 54 0.87 (0.39-1.93); high stage cases (13 in highest tertile) 0.74 Processed meats 199 1.53 (0.98-2.39); all cases 0.20 74 1.30 (0.62-2.74); low stage cases (35 in highest tertile) 0.93 54 2.24 (0.90-5.59); high stage cases (18 in highest tertile) 0.22
Case-control studies Key, et al 1997 (98) Meat of any type 328 0.64 (0.36-1.14) for highest vs lowest quartile 0.13 age, energy intake, social class England Roast or grilled meat 328 1.12 (0.50-2.49) 0.81 Population-based Villeneuve, et al 1999 (90) Total meat 1623 1.00 (0.70-1.30) for highest vs lowest quartile 0.41 age, province of residence, race, BMI, Canadian National Enhanced family history of Pca, smoking, income, Cancer Surveillance System various other dietary intakes

41
Table 4. Epidemiological studies of meat intake an d prostate cancer risk, cont’d p value
Study Class Cases Adjusted RR (95% CI) for trend Adjusted for
Hayes, et al 1999 (89) Total meat 932 1.40 (p<0.05) for highest vs lowest quartile; all cases 0.06 age, study site, race Multicentre (US) 293 1.80 (p<0.05); advanced cases <0.01 Population-based Red meat 932 1.40 (p<0.05) for highest vs lowest quartile; all cases 0.04
293 2.0 (p<0.05); advanced cases 0.00
Deneo-Pellegrini, et al 1999 (88) Total meat 175 1.60 (0.80-3.40) for highest vs lowest quartile 0.59 age, residence, urban/rural status, Uruguay Red meat 1.70 (0.80-3.40) 0.17 education, family history of Pca, BMI, Hospital-based Processed meats 0.80 (0.40-1.40) 0.31 energy intake
Hodge, et al 2004 (81) Total meat 858 1.00 (0.80-1.40) for highest vs lowest tertile 0.80 age, study centre, calendar year, family Australia history of Pca, country of birth, SES, Population-based total energy intake
Bosetti, et al 2004 (80) Red meat 1294 1.01 (0.76-1.34) for highest vs lowest quintile 0.79 age, study centre, years education, Multicentre (Italy) Processed meats 1.06 (0.76-1.42) 0.47 family history of Pca, total calorie intake, Hospital-based social class, BMI
Sonoda, et al 2004 (102) Meat 140 1.80 (0.81-3.98) for highest vs lowest quartile 0.46 age, smoking, total energy intake, BMI, Life Span Study, Japan alcohol intake, family history of Pca Hospital-based
McCann, et al 2005 (82) Total meat 433 0.94 (0.62-1.43) for highest vs lowest quartile 0.73 age, education, BMI, smoking Western New York Diet Study (US) Processed meats 0.87 (0.58-1.32) 0.33 Hospital-based cases Population-based controls BMI, body mass index; CARET, The Carotene and Retinol Efficacy Trial; HPFS, Health Professionals Follow Up Study; kcal, kilocalories, PA, physical activity, Pca, prostate cancer; PLCO, Prostate, Lung, Colorectal and Ovarian; PSA, prostate specific antigen, SES, socio-economic status; US, United States

42
Summary
The evidence for cruciferous vegetables and total vegetable intake in reducing prostate cancer
risk is limited. Fruit intake does not appear to influence prostate cancer risk. Although the
number of studies reporting significant relationships with tomato intake are few, the pooled
analysis indicates that higher intakes of cooked tomato, but not raw tomato, reduces prostate
cancer risk. There is insufficient evidence of a positive relationship between total meat or red
meat intake and prostate cancer. An increased risk of advanced prostate cancer is suggested
for processed meat.
The majority of evidence for fruit, vegetables and tomatoes comes from case-control studies,
whereas, cohort studies are considered more a rigorous design for establishing causal
relationships. In addition, approximately half of all studies did not use a validated instrument to
assess dietary intake and/or did not adjust for family history of prostate cancer, which is known
to be a risk factor for prostate cancer.

43
Selected Nutrients and Prostate Cancer Risk
The 1975 ecological analysis referred to earlier suggested that rates of prostate cancer were
positively associated with ‘western style’ diets, i.e. diets higher in energy, meat, animal protein,
milk, and sugar (44). Many nutrients associated with a ‘western style’ diet have since been
investigated in light of prostate cancer risk, with calcium and fat receiving considerable
attention. Zinc may be important due to its accumulation in the prostate gland. The latest
reviews tend to favour fats and calcium as increasing prostate cancer risk, and zinc decreasing
risk (10, 77, 110), however these reviews are not always systematic, up to date, or critical of
study design. The latest epidemiological evidence on dietary intakes of fat, calcium and zinc is
critically reviewed below.
Fat
The potential mechanisms by which fat intake could increase the risk of prostate cancer are still
speculative. However, the main hypotheses propose that high fat intakes i) promote free radical
damage (as a substrate for lipid peroxidation) (51), ii) increase insulin-like growth factors e.g.
IGF-1 (70, 71) or iii) increase the levels of circulating sex hormones, including testosterone (67,
126). Saturated fats are of interest as a component of meat, which has been associated with
prostate cancer in some studies (reviewed earlier).
The relationship between fat intake and prostate cancer risk appears generally positive,
however, studies have largely produced statistically non-significant results. Of the seventeen
studies reviewed (Table 5), only the population-based case-control study by Hayes et al (89)
(reviewed earlier) reports a statistically significant relationship between total fat intake and
prostate cancer risk. Hayes et al found that the highest quartile of total fat intake was
associated with a 40% increased risk of prostate cancer (all cases) and a doubling in risk for
advanced prostate cancer cases, although confidence intervals were not reported (89). The
corresponding author was not able to provide additional data for this review. Moderately
increased, but non-significant risks have been associated with total fat intake in five other
case-control studies (88, 90, 127-129). A few small case-control studies reported decreased
risks (98, 129-131), whereas two of the largest case-control studies reported null results (81,
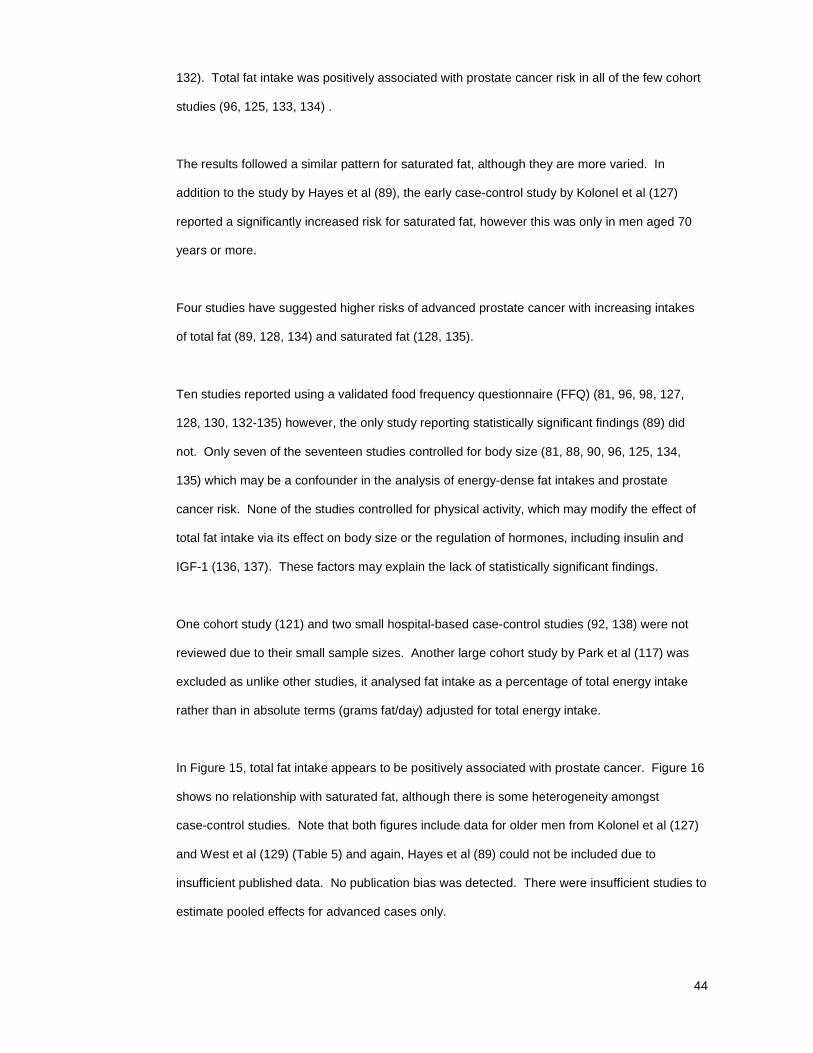
44
132). Total fat intake was positively associated with prostate cancer risk in all of the few cohort
studies (96, 125, 133, 134) .
The results followed a similar pattern for saturated fat, although they are more varied. In
addition to the study by Hayes et al (89), the early case-control study by Kolonel et al (127)
reported a significantly increased risk for saturated fat, however this was only in men aged 70
years or more.
Four studies have suggested higher risks of advanced prostate cancer with increasing intakes
of total fat (89, 128, 134) and saturated fat (128, 135).
Ten studies reported using a validated food frequency questionnaire (FFQ) (81, 96, 98, 127,
128, 130, 132-135) however, the only study reporting statistically significant findings (89) did
not. Only seven of the seventeen studies controlled for body size (81, 88, 90, 96, 125, 134,
135) which may be a confounder in the analysis of energy-dense fat intakes and prostate
cancer risk. None of the studies controlled for physical activity, which may modify the effect of
total fat intake via its effect on body size or the regulation of hormones, including insulin and
IGF-1 (136, 137). These factors may explain the lack of statistically significant findings.
One cohort study (121) and two small hospital-based case-control studies (92, 138) were not
reviewed due to their small sample sizes. Another large cohort study by Park et al (117) was
excluded as unlike other studies, it analysed fat intake as a percentage of total energy intake
rather than in absolute terms (grams fat/day) adjusted for total energy intake.
In Figure 15, total fat intake appears to be positively associated with prostate cancer. Figure 16
shows no relationship with saturated fat, although there is some heterogeneity amongst
case-control studies. Note that both figures include data for older men from Kolonel et al (127)
and West et al (129) (Table 5) and again, Hayes et al (89) could not be included due to
insufficient published data. No publication bias was detected. There were insufficient studies to
estimate pooled effects for advanced cases only.

45
Heterogeneity between groups: p = 0.673Overall (I-squared = 11.5%, p = 0.324)
Hodge 2004Bidoli 2005
Chan 2000Schuurman 1999
Key 1997Andersson 1996
Whittemore 1995
Kolonel 1988
Ghadirian 1995
cohort
case control
Study ID
Subtotal (I-squared = 33.4%, p = 0.131)
Subtotal (I-squared = 0.0%, p = 0.891)
West 1991
Villeneuve 1999
Neuhouser 2007
Denio-Pellegrini 1999
Giovannucci 1993
Rohan 1995
1.13 (1.04, 1.24)
1.00 (0.80, 1.40)1.00 (0.80, 1.30)
1.10 (0.70, 1.70)1.10 (0.80, 1.52)
0.85 (0.57, 1.25)1.08 (0.77, 1.52)
1.40 (1.10, 1.89)
1.50 (0.90, 2.30)
0.83 (0.46, 1.51)
ES (95% CI)
1.12 (1.01, 1.25)
1.17 (0.98, 1.41)
1.70 (1.00, 3.10)
1.20 (0.90, 1.50)
1.19 (0.84, 1.67)
1.80 (0.90, 3.40)
1.32 (0.91, 1.92)
0.73 (0.42, 1.30)
100.00
10.6314.12
4.238.08
5.407.20
11.36
3.78
2.36
Weight
74.68
25.32
2.60
12.75
7.05
1.88
5.97
2.61
%
1.5 2
effect size
Figure 15. Forest plot of total fat intake and prostate cancer risk
Heterogeneity between groups: p = 0.984
Overall (I-squared = 36.6%, p = 0.091)
Andersson 1996
Subtotal (I-squared = 49.4%, p = 0.038)
Hodge 2004
Subtotal (I-squared = 0.0%, p = 0.574)
Denio-Pellegrini 1999
Whittemore 1995
Ghadirian 1995
cohort
Bidoli 2005
Rohan 1995
Giovannucci 1993
Neuhouser 2007
West 1991
Key 1997
case control
Kolonel 1988
Schuurman 1999
Study ID
1.02 (0.91, 1.13)
1.14 (0.81, 1.60)
1.02 (0.90, 1.15)
1.00 (0.70, 1.14)
1.02 (0.81, 1.28)
0.90 (0.50, 1.70)
1.60 (1.10, 2.40)
0.69 (0.40, 1.18)
0.90 (0.70, 1.20)
0.58 (0.33, 1.01)
0.84 (0.48, 1.47)
0.98 (0.71, 1.35)
1.30 (0.70, 2.30)
0.84 (0.58, 1.28)
1.70 (1.00, 2.80)
1.19 (0.80, 1.76)
ES (95% CI)
100.00
9.88
77.89
19.25
22.11
3.06
7.52
3.91
15.76
3.66
3.65
11.09
3.24
7.31
4.32
7.36
Weight
%
1.5 2
effect size
Figure 16. Forest plot of saturated fat intake and prostate cancer risk

46
Table 5. Epidemiological studies of dietary fat in take and prostate cancer risk Mean p value
Study Follow Up Class Cases Adjusted RR (95% CI) for trend Adjusted for
Cohort Studies
Giovannucci, et al 1993 (134) 4 yrs Total fat 300 1.32 (0.91-1.92) for highest vs lowest quintile; all cases 0.32 age, calories, BMI, ancestry, vasectomy status, HPFS (US) 126 1.68 (0.97-2.90); advanced cases 0.14 intake of saturated fat, monounsaturated fat, 47,855 men Saturated fat 300 0.84 (0.48-1.47) for highest vs lowest quintile; all cases 0.93 linoleic acid and alpha-linolenic acid
126 0.95 (0.41-2.21); advanced cases 0.56
Schuurman, et al 1999 (133) 6.3 yrs Total fat 642 1.10 (0.80-1.52) for highest vs lowest quintile; all cases 0.78 age, family history of Pca, SES, energy intake The Netherlands Cohort Study Saturated fat 642 1.19 (0.80-1.76) 0.43 58,279 men
Chan, et al 2000 (96) 8 yrs Total fat 233 1.10 (0.70-1.70) for highest vs lowest quintile 0.89 supplementation group (alpha-tocopherol, ATBC Trial (Finland) beta-carotene, both, or placebo), 27,111 male smokers education, age, BMI, energy, smoking
Neuhouser, et al 2007 (125) 11 yrs Total fat 811 1.19 (0.84-1.67) for highest vs lowest quartile; all cases 0.59 age, energy intake, BMI, smoking, family CARET (US) Saturated fat 279 0.98 (0.71-1.35); all cases 0.75 history of Pca, race/ethnicity 18, 314 heavy smokers and asbestos exposed workers
Case-control studies
Kolonel, et al 1988 (127) Total fat 189 1.00 (0.60-1.70) for highest vs lowest quartile; men <70 yrs 0.96 age, ethnicity Hawaii (US) 263 1.50 (0.90-2.30); men 70+ yrs 0.13 Population-based Saturated fat 189 1.00 (0.60-1.90); men <70 yrs 0.77
263 1.70 (1.00-2.80); 70+ yrs old 0.02
West, et al 1991 (129) Total fat 179 0.80 (0.40-1.30) for highest vs lowest quartile; 45-67 yr olds nr Nil (crude Ors) Mormons (US) 179 1.70 (1.00-3.10); 68-74 yrs nr Population-based Saturated fat 179 0.70 (0.40-1.20); 45-67 yrs nr
179 1.3 (0.70-2.30); 68-74 yrs nr

47
Table 5. Epidemiological studies of dietary fat in take and prostate cancer risk, cont’d
p value Study Class Cases Adjusted RR (95% CI) for trend Adjusted for Ghadirian, et al 1995 (130) Total fat 232 0.83 (0.46-1.51) for highest vs lowest quartile 0.64 age, energy intake, family history of Pca Montreal, Canada Saturated fat 0.69 (0.40-1.18) 0.05 Hospital-based cases Population-based controls
Rohan, et al 1995 (131) Total fat 207 0.73 (0.42-1.30) for highest vs lowest quartile 0.2 age, energy intake, family history of Pca Ontario, Canada Saturated fat 0.58 (0.33-1.01) 0.01 Population-based
Whittemore, et al 1995 (139) Total fat 1,608 1.40 (1.10-1.89) for highest vs lowest quintile; all cases 0.04 age, region, education Multicentred (US) Saturated fat 1,608 1.60 (1.10-2.40); all cases 0.02 Population-based Andersson, et al 1996 (128) Total fat 526 1.08 (0.77-1.52) for highest vs lowest quartile; all cases 0.57 age, energy intake Sweden 296 1.15 (0.77-1.72); advanced cases 0.49 Population-based Saturated fat 526 1.14 (0.81-1.60) for highest vs lowest quartile; all cases 0.39
296 1.21 (0.80-1.81); advanced cases 0.29
Key, et al 1997 (98) Total fat 328 0.85 (0.57-1.25) for highest vs lowest quartile 0.58 age, energy intake, social class England Saturated fat 328 0.87 (0.58-1.28) 0.40 Population-based
Villeneuve, et al 1999 (90) Total fat 1623 1.20 (0.90-1.50) for highest vs lowest quintile 0.96 age, province of residence, race, BMI, smoking Canadian National Enhanced family history of Pca, smoking, income, various Cancer Surveillance System other dietary intakes
Deneo-Pellegrini, et al 1999 (88) Total fat 175 1.80 (0.90-3.40) for highest vs lowest quartile 0.04 age, residence, urban/rural status, education Uruguay Saturated Fat 0.90 (0.50-1.70) 0.78 family history of Pca, BMI, energy intake Hospital-based
Hayes, et al 1999 (89) Total fat 932 1.4 (p<0.05) for highest vs lowest quartile; all cases 0.003 age, study site, race Multicentre (US) 293 2.00 (p<0.05); advanced cases 0.003 Population-based

48
Table 5. Epidemiological studies of dietary fat in take and prostate cancer risk, cont’d
p value
Study Class Cases Adjusted RR (95% CI) for trend Adjusted for
Kristal, et al 2002 (135) Saturated fat 443 1.09 (0.69-1.72) for highest vs lowest quintile; localised cases 0.86 age, race, family history Pca, education, BMI King County Washington (US) 162 1.82 (0.93-3.56); regional and distant cancers 0.06 PSA testing, vegetable and energy intakes, Population-based supplemental vitamin E, vitamin C and zinc Hodge, et al 2004 (81) Total fat 858 1.00 (0.80-1.40) for highest vs lowest quartile 0.70 age, residence, year, country of birth, SES, Australia Saturated fat 1.00 (0.70-1.14) 0.50 family history of Pca, total energy intake Population-based
Bidoli, et al 2004 (132) Total fat 1294 1.00 (0.80-1.30) for highest vs lowest quintile 0.81 age, study centre, years education, Multicentre (Italy) Saturated fat 0.90 (0.70-1.20) 0.69 family history of Pca, total calorie intake, Hospital-based
ATBC, Alpha-Tocopherol Beta-carotene; BMI, body mass index; CARET, The Carotene and Retinol Efficacy Trial; HPFS, Health Professionals Follow Up Study; NHANES, National Health and Nutrition Examinations Survey (1971-1975); nr, not reported; PA, physical activity; Pca, prostate cancer; SES, socio-economic status; US, United States

49
Calcium
Milk and dairy products are an integral part of a ‘western’ diet and these have been positively
correlated with higher prostate cancer incidence (44) and mortality (45) in ecological studies. A
meta-analysis of 11 case-control studies of milk and prostate cancer risk has estimated a
pooled odds ratio of 1.68 (95% CI, 1.34-2.12) (140). Investigations have focused on the
components of milk that might be responsible for the increased risk, namely fat and calcium.
There is now epidemiological evidence that points to calcium as a risk factor for prostate cancer.
It has also been established in-vitro using human prostate cells that high intakes of calcium
inhibit vitamin D activity, which has an antiproliferative effect in the prostate (141, 142).
Seven cohort studies provide fairly consistent evidence that increased calcium intake is a risk
factor for prostate cancer (Table 6). In studies reporting significant findings (143-147), there
were moderate increases in risk, ranging from 1.20 to 2.20 for all prostate cancer cases and
1.46 to 4.57 for advanced and/or fatal cases. Significant trends in risk were seen in two out of
three studies that examined supplementary calcium (115, 145, 147). Some studies suggested
that the association with calcium intake was greater for advanced or fatal prostate cancer (143,
145, 147), however this was based on small numbers of advanced cases.
One cohort study was excluded from this review as it included 69 prevalent and incident cases
(148). Selection bias may have also been a problem in this study, as only 454 men (27%) in the
original cohort of 1,665 completed a FFQ.
Most studies used validated FFQs and adjusted for family history of prostate cancer and energy
intake. Two studies examining advanced and localised cancers separately had small sample
sizes (115, 145). However, the forest plots illustrate a statistically significant, positive
relationship between dietary calcium intake and the risk of prostate cancer (Figure 17), but no
additional increase in risk for advanced cases (Figure 18). Note that the calcium intake
analysed in the study by Rohrmann et al (115) includes both dietary and supplemental calcium,
whereas all other study results are based on dietary calcium intake only. No publication bias
was detected among these cohort studies.

50
Overall (I-squared = 29.4%, p = 0.204)
Study ID
Schuurman 1999
Chan 2001
Tseng 2005
Rorhmann 2007
Rodriguez 2003
Chan 2000
Giovannucci 2006
1.30 (1.15, 1.46)
ES (95% CI)
1.09 (0.79, 1.50)
1.32 (1.08, 1.63)
2.20 (1.14, 3.50)
0.99 (0.70, 1.41)
1.60 (1.10, 2.30)
1.60 (0.80, 3.00)
1.28 (1.02, 1.60)
100.00
Weight
13.14
31.88
4.29
11.02
9.93
3.09
26.65
%
1.30 (1.15, 1.46)
ES (95% CI)
1.09 (0.79, 1.50)
1.32 (1.08, 1.63)
2.20 (1.14, 3.50)
0.99 (0.70, 1.41)
1.60 (1.10, 2.30)
1.60 (0.80, 3.00)
1.28 (1.02, 1.60)
100.00
Weight
13.14
31.88
4.29
11.02
9.93
3.09
26.65
%
1.5 3
effect size
Figure 17. Forest plot of dietary calcium intake and prostate cancer risk (all cases).
Overall (I-squared = 49.0%, p = 0.117)
Rodriguez 2003
Study ID
Schuurman 1999
Giovannucci 2006
Rorhmann 2007
1.29 (1.04, 1.59)
2.20 (0.90, 5.30)
ES (95% CI)
0.83 (0.52, 1.34)
1.46 (1.11, 1.90)
1.06 (0.55, 2.04)
100.00
5.81
Weight
20.37
63.19
%
10.63
1.29 (1.04, 1.59)
2.20 (0.90, 5.30)
ES (95% CI)
0.83 (0.52, 1.34)
1.46 (1.11, 1.90)
1.06 (0.55, 2.04)
100.00
5.81
Weight
20.37
63.19
%
10.63
1.5 3
effect size
Figure 18. Forest plot of dietary calcium intake and advanced prostate cancer risk.

51
Table 6. Epidemiological cohort studies of dietary calcium intake and prostate cancer risk Mean p value
Study Follow Up Class Cases Adjusted RR (95% CI) for trend Adjusted for
Schuurman, et al 1999 (114) 6.3 yrs Total dietary calcium 642 1.09 (0.79-1.50) for highest vs lowest quintile; all cases 0.34 age, family history of Pca, SES, Netherlands Cohort Study 224 1.21 (0.79-1.86); localised tumours 0.10 total energy intake 58,279 men 210 0.83 (0.52-1.34); advanced tumours 0.45
Giovannucci, et al 1998 (143) 8 yrs Total dietary calcium 1,369 1.71 (1.19-2.46) for highest vs lowest quintile; all cases 0.36 age, BMI at age 21, total energy, fat, HPFS (US) 423 2.97 (1.61-5.50); advanced cases (27 in highest quintile) <.005 vitamin D, phosphorus, vitamin E, 47,781 men 201 4.57 (1.88-11.1); metastatic cases (15 in highest quintile) <.001 fructose and lycopene
Chan, et al 2000 (96) 8 yrs Total dietary calcium 233 1.60 (0.80-3.00) for highest vs lowest quintile; all cases 0.13 supplementation group (α-tocopherol, ATBC Trial (Finland) beta-carotene, both, or placebo), 27,111 male smokers education, age, BMI, energy, smoking
Chan, et al 2001 (144) 11 yrs Calcium from 1,102 1.32 (1.08-1.63) for highest vs lowest quartile 0.03 age, randomised treatment (aspirin, beta- Physician's Health Study (US) dairy foods, cold NB. Accounted for 85% of dietary calcium carotene, or placebo), smoking, BMI, Aspirin, Beta-carotene Trial breakfast cereals smoking, vigorous PA 20,885 men
Rodriguez, et al 2003 (145) 8 yrs Total calcium incl. 3,811 1.2 (1.00-1.60) for highest vs lowest quintile; all cases 0.02 age, race, family history Pca, energy, Cancer Prevention Study II supplements 569 1.6 (0.90-3.00); advanced cases (15 in highest quintile) 0.08 fat, phosphorus and vitamin D intakes, Nutrition Cohort (US) Total dietary calcium 3,450 1.6 (1.10-2.30); for highest vs lowest quintile; all cases 0.10 education 65,321 men 522 2.2 (0.90-5.30); advanced cases (8 in highest quintile) 0.27
Tseng, et al 2005 (146) 9 yrs Total dietary calcium 131 2.20 (1.14-3.50) for highest vs lowest tertile 0.00 age, race, energy intake, US region, rural NHANES I Calcium (low fat milk) 1.70 (1.10-2.60) 0.02 urban, suburban residence, education, 3,612 men Calcium (whole milk) 0.80 (0.50-1.30) 0.27 recreational sun exposure, PA,
smoking, alcohol intake
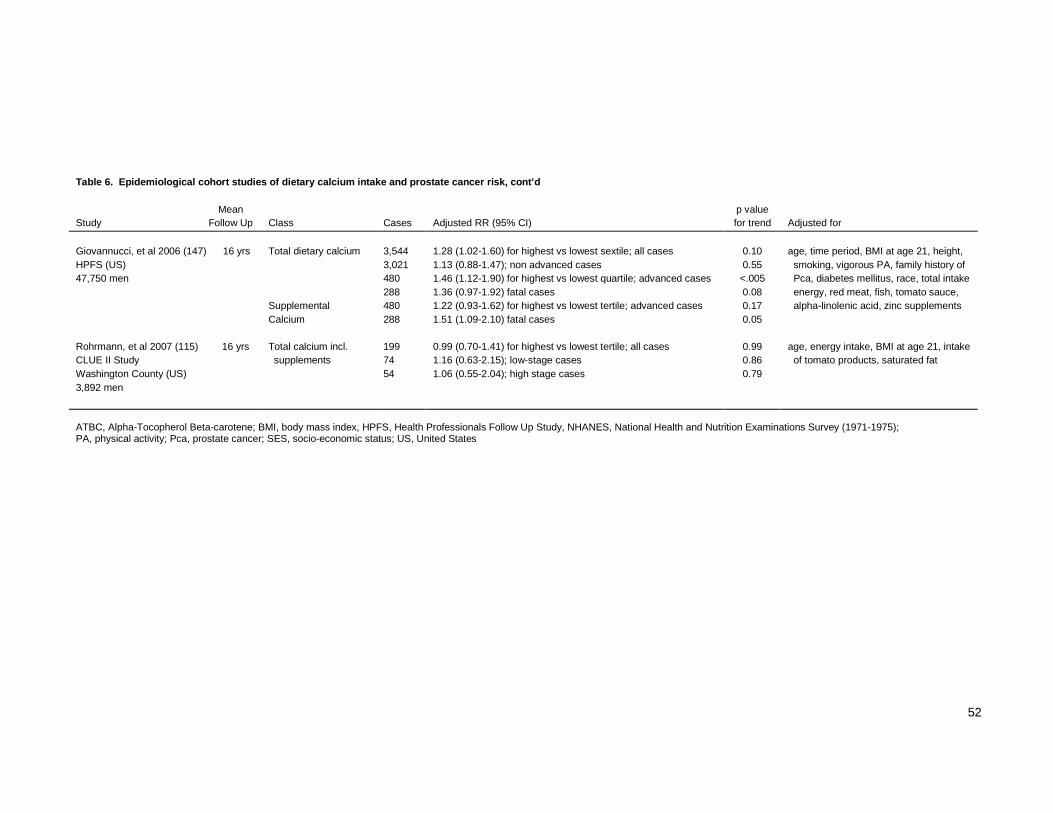
52
Table 6. Epidemiological cohort studies of dietary calcium intake and prostate cancer risk, cont’d Mean p value
Study Follow Up Class Cases Adjusted RR (95% CI) for trend Adjusted for
Giovannucci, et al 2006 (147) 16 yrs Total dietary calcium 3,544 1.28 (1.02-1.60) for highest vs lowest sextile; all cases 0.10 age, time period, BMI at age 21, height, HPFS (US) 3,021 1.13 (0.88-1.47); non advanced cases 0.55 smoking, vigorous PA, family history of 47,750 men 480 1.46 (1.12-1.90) for highest vs lowest quartile; advanced cases <.005 Pca, diabetes mellitus, race, total intake
288 1.36 (0.97-1.92) fatal cases 0.08 energy, red meat, fish, tomato sauce, Supplemental 480 1.22 (0.93-1.62) for highest vs lowest tertile; advanced cases 0.17 alpha-linolenic acid, zinc supplements Calcium 288 1.51 (1.09-2.10) fatal cases 0.05
Rohrmann, et al 2007 (115) 16 yrs Total calcium incl. 199 0.99 (0.70-1.41) for highest vs lowest tertile; all cases 0.99 age, energy intake, BMI at age 21, intake CLUE II Study supplements 74 1.16 (0.63-2.15); low-stage cases 0.86 of tomato products, saturated fat Washington County (US) 54 1.06 (0.55-2.04); high stage cases 0.79 3,892 men
ATBC, Alpha-Tocopherol Beta-carotene; BMI, body mass index, HPFS, Health Professionals Follow Up Study, NHANES, National Health and Nutrition Examinations Survey (1971-1975); PA, physical activity; Pca, prostate cancer; SES, socio-economic status; US, United States

53
Zinc
Zinc is needed for the synthesis of DNA and is a component of superoxide dismutase and
various metallothioneins, which act as free radical scavengers (149). Zinc is also involved in the
stabilisation of cell membranes, the release of insulin, and is imperative for a competent
immune system (149). Zinc is of particular interest in prostate carcinogenesis, because it is
known to accumulate in the peripheral zone of the normal prostate gland via zinc uptake
transporters (48). In-vitro, zinc has been shown to inhibit the growth, proliferation and migration
of prostate cancer cells (46). Prostate zinc levels markedly decrease in prostate cancer and as
a result, neoplastic cells lose their ability to accumulate zinc (48). Without the apoptotic effect of
zinc, neoplastic cells are able to proliferate as malignant cells (48). Both zinc bioavailability and
zinc transportation into the prostate are thought to be crucial in avoiding prostate malignancies
(46).
To date, the research on zinc intake and prostate cancer is conflicting and is based on only a
small number of studies, of which only two are cohort design (Table 7). Three studies (98, 150,
151) suggest non-statistically significant decreases in risk with higher zinc intakes. This
includes one cohort study that used toenail concentrations of zinc as a proxy for dietary intake
(150) and a small hospital-based case-control study (151). In contrast, another hospital-based
case-control study recently reported statistically significant increased risks of prostate cancer
with increasing dietary zinc (152). Another three case-control studies (127-129) reported
moderate but non-statistically significant increases in prostate cancer risk with higher dietary
zinc intakes (including a small case-control study that reported crude ORs only (129)).
Kolonel et al (127) showed that higher total zinc intakes (including supplements) were
significantly associated with prostate cancer risk in men aged 70 years or more. In the HPFS,
dose (>100mg/day) and duration of zinc supplementation (10+ years) were both moderately and
statistically significantly related to advanced prostate cancer risk (153). However, the
relationship with dose of zinc supplement was based on 10 cases in the highest quintile of zinc
supplement dose. Dietary intake of zinc was reportedly not associated with prostate cancer risk
(results not shown) (153). Explanations for the increased prostate cancer risks associated with
high zinc intakes are as yet unclear, but suggestions include contamination of zinc supplements

54
with heavy metals (e.g. cadmium) and zinc-induced increases in testosterone and telomerase
activity (46). An excess zinc intake has also been reported to impair immune response (154).
Nearly all of the studies (98, 127, 128, 152, 153) used a FFQ tested for its reliability.
The forest plot (Figure 19) highlights the variation in research findings so far.
Overall (I-squared = 34.1%, p = 0.168)
Andersson 1996
West 1991
Kolonel 1988
Key 1997
Vlajinac 1997
Gallus 2007
Platz 2002
Study ID
1.07 (0.89, 1.28)
1.04 (0.74, 1.46)
1.10 (0.60, 1.90)
1.30 (0.70, 2.20)
0.78 (0.52, 1.17)
0.81 (0.28, 2.34)
1.56 (1.07, 2.26)
0.63 (0.31, 1.29)
ES (95% CI)
100.00
%
28.11
9.77
9.90
19.74
2.88
23.22
6.39
Weight
1.07 (0.89, 1.28)
1.04 (0.74, 1.46)
1.10 (0.60, 1.90)
1.30 (0.70, 2.20)
0.78 (0.52, 1.17)
0.81 (0.28, 2.34)
1.56 (1.07, 2.26)
0.63 (0.31, 1.29)
ES (95% CI)
100.00
%
28.11
9.77
9.90
19.74
2.88
23.22
6.39
Weight
1.5 2
effect size
Figure 19. Forest plot of dietary zinc intake and prostate cancer risk

55
Table 7. Epidemiological studies of dietary zinc i ntake and prostate cancer risk Mean p value
Study Follow Up Class Cases Adjusted RR (95% CI) for trend Adjusted for
Cohort Studies
Platz, et al 2002 (150) 7 yrs Toenail zinc concentration 115 0.63 (0.31-1.29) for highest vs lowest quintile 0.20 toenail weight, height, education, family CLUE II history of Pca, current BMI, BMI at age 3,892 men 21, smoking, multivitamin use
Leitzmann, 2003 (153) 14 yrs Supplemental zinc 2,901 1.37 (0.94-2.01) for highest vs non users; all cases 0.17 age, time period, BMI at age 21, height, HPFS (US) (mg/day) 1,653 0.96 (0.53-1.72); organ-confined cases (14 cases in highest quintile) 0.35 smoking, family history of Pca, intake 46,974 men 434 2.39 (1.13-5.11); advanced cases (10 cases in highest quintile) <0.01 of energy, calcium (incl. supplements),
Duration of supplemental 2,901 1.09 (0.85-1.41) for highest vs lowest quartile (non users); all cases 0.67 fructose, tomato-based foods, fish, zinc use (years) 1,653 0.79 (0.54-1.16); organ-confined cases 0.16 red meat, alpha-linolenic acid, aspirin 434 2.56 (1.54-4.26); advanced cases <0.001 use, vigorous PA, PSA testing
Case-control Studies
Kolonel, et al 1988 (127) Dietary zinc 189 1.30 (0.70-2.20) for highest vs lowest quartile; men <70 yrs 0.71 age, ethnicity Hawaii (US) 263 1.10 (0.70-1.70); men 70+ yrs 0.62 Population-based Total zinc incl. supp’s 189 1.20 (0.70-2.20); men <70 yrs 0.86
263 1.70 (1.10-2.70); men 70+ yrs <0.01
West, et al 1991 (129) Dietary zinc 179 1.10 (0.60-1.90) for highest vs lowest quartile; 45-67 yr olds nr Nil (crude Ors) Mormons (US) 179 1.30 (0.80-2.30); 68-74 yr olds nr Population-based
Andersson, et al 1996 (128) Dietary zinc 526 1.04 (0.74-1.46) for highest vs lowest quartile; all cases 0.50 age, energy intake Sweden 296 1.14 (0.77-1.70); advanced cases 0.37 Population-based
Key, et al 1997 (98) Dietary zinc 328 0.78 (0.52-1.17) for highest vs lowest tertile 0.23 age, energy intake, social class England Population-based
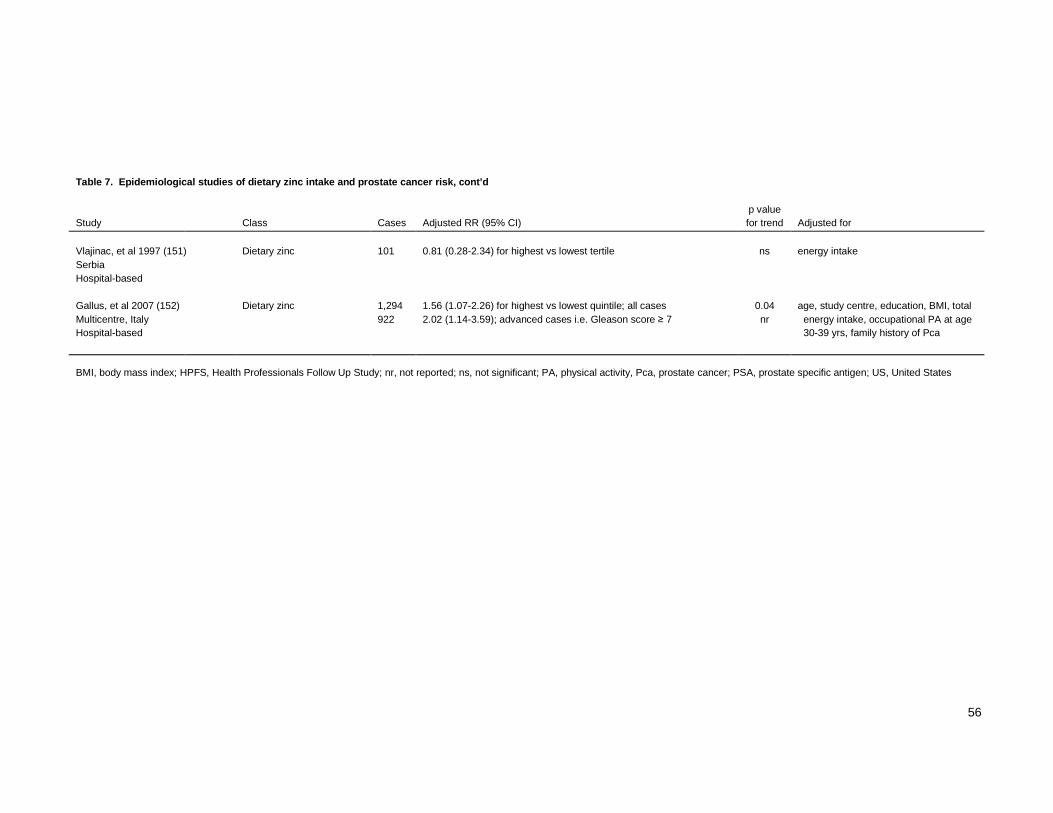
56
Table 7. Epidemiological studies of dietary zinc i ntake and prostate cancer risk, cont’d p value
Study Class Cases Adjusted RR (95% CI) for trend Adjusted for
Vlajinac, et al 1997 (151) Dietary zinc 101 0.81 (0.28-2.34) for highest vs lowest tertile ns energy intake Serbia Hospital-based Gallus, et al 2007 (152) Dietary zinc 1,294 1.56 (1.07-2.26) for highest vs lowest quintile; all cases 0.04 age, study centre, education, BMI, total Multicentre, Italy 922 2.02 (1.14-3.59); advanced cases i.e. Gleason score ≥ 7 nr energy intake, occupational PA at age Hospital-based 30-39 yrs, family history of Pca
BMI, body mass index; HPFS, Health Professionals Follow Up Study; nr, not reported; ns, not significant; PA, physical activity, Pca, prostate cancer; PSA, prostate specific antigen; US, United States

57
Summary
The forest plots indicate a significant increase in prostate cancer risk with higher total fat
intakes, but not saturated fat. However, most studies of dietary fat and prostate cancer are
case-control studies, the majority of which have reported null or statistically insignificant positive
findings. Most studies of dietary fat have not controlled for important confounders such as body
size, and none have controlled for physical activity. The mechanisms by which dietary fat might
be involved in prostate carcinogenesis is also yet to be confirmed. There is consistent evidence
from cohort studies that high calcium intakes increase prostate cancer risk, and this is
supported by in-vitro evidence. There is insufficient evidence to determine whether or not
dietary zinc intake influences prostate cancer risk.

58
Benign Prostatic Hyperplasia
Benign Prostatic Hyperplasia (BPH) is an non-malignant enlargement of the prostate gland
which commonly manifests in the form of lower urinary tract symptoms (LUTS) that interfere
with daily life and sleep patterns. As the prostate with BPH enlarges it compresses the urethra,
resulting in urinary symptoms such as incomplete bladder emptying, nocturia, weak stream,
intermittency and urgency.
BPH is thought to affect at least one third of men aged in their sixties, increasing to one half of
men aged 80 years or more (155). Urinary symptoms are often assessed using the
International Prostate Symptom Score (IPSS) questionnaire (Appendix 2). The prevalence of
one or more urinary symptoms in Australian men has been reported to range from 25% in 45-54
year olds, to 48% in those over 65 years old (156), with higher figures reported in other
developed countries (157-159).
BPH imposes a considerable health burden in terms of its costs of treatment and diminishing
effects on quality of life. In 2000, health care expenditure on BPH in the US was estimated at
US$1.1 billion (160). The costs of treating BPH are likely to rise in those countries where the
aging population is increasing. The progressive nature of BPH often necessitates eventual
treatment to alleviate symptoms or in severe cases, urinary retention. This may involve the use
of drugs to relax the muscles of the prostate (alpha-blockers) or reduce prostate size
(5-alpha-reductase inhibitors) (161). Surgical procedures include vaporisation, heat or laser
treatment, open prostatectomy, and the most common procedure to treat BPH, transurethral
resection of the prostate (TURP) (161). Approximately 10% of men are expected to undergo
TURP in their lifetime and in 1997, this procedure was the most common surgical operation on
an internal organ in Western Australian men (162). Complications that may arise from the
surgical treatment of BPH include perforation of the bladder, incontinence, retrograde
ejaculation, impotence and haemorrhage (162). Ten percent of TURP patients require further
treatment for BPH within five years (161).

59
Pathogenesis of BPH
There is no universally accepted clinical definition for BPH however, the American Urological
Association (AUA) refers to BPH in its clinical guidelines as: “any symptomatic conditions
characterized by bothersome lower urinary tract symptoms (LUTS) attributed to histological
hyperplasia or increased tone of the prostate” (163). Urinary symptoms do not always equate
with a diagnosis of BPH or enlarged prostate, and while the IPSS is useful for determining the
patient’s perceptions of urinary symptoms and their impact, it is not used to diagnose BPH
without a physical examination (163, 164).
Histologically, BPH is identified by stromal and epithelial cell hyperplasia in the transitional zone
of the prostate (163). Pathological or early stage BPH is asymptomatic, and it is thought that all
men develop it if they live long enough (1). However, not all BPH progresses to clinical BPH
heralded by LUTS. This suggests that particular factors may trigger BPH progression (1) and
therefore, the modification of these factors may prevent the onset of clinical BPH and the
associated treatment costs and losses in quality of life.
Untergasser (2) describes the pathophysiology of BPH as age-related “massive tissue
remodelling in the transition zone of the prostate, characterised by:
i) basal cell hypertrophy
ii) altered secretions of luminal cells leading to calcification, clogged ducts and
inflammation
iii) increased infiltrates of lymphocytes and production of proinflammatory cytokines
iv) increased reactive oxygen species (ROS) production that damages epithelial and
stromal cells
v) increased basic fibroblast growth factor (bFGF) and transforming growth factor
beta 1 (TGF-β1) production leading to stromal proliferation and
transdifferentiation, and excess deposits of extracellular matrix
vi) altered autonomous innervations, leading to less relaxation and a high
adrenergic tonus
vii) altered neuroendocrine cell function and release of neuroendocrine peptides.”

60
It has been hypothesised that BPH, like prostate cancer, is a product of chronic inflammation in
the prostate gland (165). Chronic inflammatory infiltrates, consisting mostly of chronically
activated T cells and macrophages, are frequently found in BPH tissue (11, 165). These are
thought to stimulate cytokine production and fibromuscular growth in the prostate, leading to
BPH (165).
Metabolic syndrome, which is closely associated with chronic inflammation (59), has also been
linked to BPH (160). Increased insulin secretion, such as that which occurs with insulin
resistance, enhances the synthesis of insulin-like growth factors (IGFs) (166) which have been
shown to stimulate prostate gland growth in vitro (160). Higher levels of fasting serum insulin
and plasma IGF-1 have been positively linked with surgery for BPH (167, 168) and prostate
enlargement measured by ultrasonography (169). Elevated fasting glucose (>110mg/dl) and
Type 2 diabetes have been positively associated with increased prostate volume measured by
magnetic resonance imaging and with high-moderate to severe LUTS (160).
Risk Factors for BPH
Few risk factors for BPH have been established. The changes in prostate cell-cell interactions
described by Untergasser (2) occur with aging, hence aging is a major risk factor for BPH.
Prostate cell growth and proliferation is enhanced by androgens, and increased circulating
androgen levels have been established as a risk factor for BPH (2). Estrogens produced by the
aromatisation of androgens have also been implicated in the smooth muscle cell growth that
takes place in the prostate, with BPH (2).
Evidence of a genetic contribution to BPH has been recently identified. A hereditary form of
BPH is thought to exist, that is characterised by early age of onset and prostate enlargement
(170). Segregation analysis suggests that it has a strong genetic component that is inherited
via autosomal dominant or co-dominant genes (170). There is also evidence that any family
history of “bothersome BPH” (i.e. bothersome symptoms or treatment with TURP) increases the
risk of BPH. The risk of “bothersome BPH” has been reported to increase by 2-4 fold for fathers
and brothers of men with BPH (170).

61
There is no clear evidence that BPH increases the risk of prostate cancer, although some
studies have reported an increased risk (171). Having a family history of prostate cancer is not
thought to increase the risk of BPH (172).
Genetic polymorphisms can influence steroid hormone synthesis and therefore, BPH risk.
Shorter CAG (trinucleotide) repeats in the AR gene have been associated with increased
transcriptional activity for genes involved in androgen responses, and shorter CAG repeats have
been associated with an increased risk for BPH (28, 173).
Various lifestyle factors have been examined in relation to BPH. Abdominal obesity has been
associated with an increased risk of BPH (28, 174). Explanations for this include endocrine
disturbances e.g. increased synthesis of estrogens, increased circulating levels of free fatty
acids or insulin, and increases in sympathetic nervous system activity, which can affect prostate
smooth muscle and urinary symptoms (28). Physical activity (28, 175, 176) is thought to be
protective against BPH via its effects on the sympathetic nervous system and body size (28).
Alcohol intake also appears to be protective (28, 176-178) possibly through its influence on
steroid hormone production (28). There is inconclusive evidence for smoking as a risk factor for
BPH (28).

62
Rationale for Examining Diet and BPH
Early studies suggested that the risk of BPH was lower among Asian men compared to black
men and white men (179). However more recently, the Health Professionals Follow Up Study
(HPFS) reported lower risks for surgery for BPH among Asian men compared with white men
but their relative risk for urinary symptoms was similar (179). The definition of BPH varies
widely and differences in BPH incidence within white populations have also been observed
(179). It is not clear if these apparent differences are due to variations in biological risk factors
for BPH or cultural differences in symptom thresholds, the seeking of medical treatment, or
uptake of different treatments (179). Not withstanding these issues, suggested geographical
differences have prompted researchers to consider environmental factors such as diet, as
potential risk factors for BPH. For example, it has been postulated that lower rates of BPH
among Asian men might be explained by their high consumption of soy products, which are rich
in phytoestrogens (180, 181).
There are more direct links between BPH and diet. The fatty acid profile of the diet may
influence the level of sex hormones which can in turn, affect BPH risk (28, 67, 68, 126). In-vitro
examinations have shown that genistein, a phytoestrogen found in soy beans, is capable of
inhibiting the growth of human BPH tissue (182). There is some evidence that prostate zinc
concentrations increase with BPH (48), and lycopene (49) is highly concentrated in the prostate
gland, suggesting that the development of BPH may be related to these nutrients.
The proposed relationships between chronic inflammation, metabolic syndrome and BPH
suggest a potential role for diet in the development of clinical BPH. The relationships between
diet, obesity and Type 2 diabetes are well known (60). Dietary intakes are capable of activating
pro-inflammatory states and providing free radical scavengers (183). Therefore dietary intake
may play a role in BPH development at the very least, indirectly.

63
Studies of Diet and BPH Risk
Few studies have examined dietary intake and BPH risk. Two studies have been conducted in
southern European populations, two on men of Asian ancestry, and one in the US, with most
using surgically-treated BPH as the endpoint.
A Greek case-control study of 184 surgically-treated BPH cases (184) reported an increased
risk for increasing intake of added fats, including butter, margarine, seed oils and olive oil
(OR=1.30, 95% CI, 1.12-1.52) and a lower risk with high fruit intakes (OR=0.79, 95% CI
0.67-0.93) after adjustment for age, BMI, education and total energy intake. Milk and dairy
products as well as meats, fish and eggs (combined) were positively associated with BPH risk,
but were statistically non-significant.
A multicentred case-control study in Italy included 1,369 surgically-treated BPH cases (185,
186). The analyses controlled for study centre, age, education, total energy intake,
occupational physical activity, BMI, smoking and alcohol intake. Increased BPH risks were
seen in the highest quintiles of intake for cereals (OR=1.55, 95% CI, 1.14-2.11), bread
(OR=1.69, 95% CI, 1.26-2.27) and poultry (OR=1.39, 95% CI, 1.0-1.91) (185). Lower risks were
associated with the highest intakes of cooked vegetables (OR=0.66, 95% CI, 0.50-0.86), soups
including minestrone (OR=0.74, 95% CI, 0.57-0.95), and pulses (OR=0.74, 95% CI, 0.61-0.91)
(185). Decreasing trends in BPH risk were observed with increasing intakes of vitamin C,
carotene and iron, while an increasing trend in risk was associated with increasing zinc intakes
(186).
A Japanese case-control study of 100 BPH cases reported increased risk ratios (p<0.05,
confidence intervals not reported) for milk consumption (RR=2.25) and irregular intakes of green
and yellow vegetables (RR=3.91) (187). However, the cases and controls were sourced from a
mass screening program for prostate disease, and it is unclear if BPH cases were
surgically-treated. Many important details of the statistical analysis were also not reported.

64
In a cohort study of American men with Japanese ancestry living in Hawaii, 846 cases of
surgically-treated BPH were identified during 19 years of follow up (188). A large number of
foods was investigated, but only beef intake appeared important after adjustment for age. The
RR in the highest tertile of beef intake was 1.25 (95% CI, 0.91-1.73) and a trend was observed
across tertiles (p<0.05) (188).
The largest study to report on diet and BPH to date comes from the US Health Professionals
Follow Up Study (189). In 2002, intakes of macronutrients were examined according to four
definitions of BPH; i) surgically-treated cases of BPH (n=1589), ii) men who reported
high-moderate to severe LUTS (an IPSS of 15-35) who did not have surgical treatment for BPH
(n=1934), iii) total BPH, including cases defined as surgically-treated and symptomatic (n=3523)
and iv), enlarged prostate identified by digital-rectal examination (n=3180). After adjusting for
ethnicity, physical activity, BMI, smoking, alcohol consumption and total energy intake, a
positive association was observed between energy-adjusted protein intake and
surgically-treated BPH (OR=1.26, p for trend=0.003) and total BPH (RR=1.23, p for trend
=0.004). Increased intakes of energy were positively associated with total BPH (RR=1.51, p for
trend <0.001) and with high-moderate to severe LUTS (RR=1.43, p for trend<0.001). Using
additional follow up, a recent analysis of 6,092 cases in 2007 (190) showed the risk for total
BPH (defined as iii) above) was significantly and inversely associated with intakes of total
vegetables and fruit and vegetables rich in beta-carotene, lutein and vitamin C. Similarly,
dietary intakes of vitamin C, lutein and beta-cryptoxanthin were significantly and inversely
associated with total BPH risk. However, when the analysis was restricted to incident BPH
cases (n=1,161), only fruit and vegetables rich in beta-carotene and intakes of
beta-cryptoxanthin remained significant. This study is credible as it is very large, is prospective
and has measured many potential confounders.

65
Summary
In the few published studies of diet and risk of BPH, increased intakes of protein, energy, fats,
zinc, beef, poultry, milk and cereals have been suggested as risk factors. Higher intakes of fruit
and pulses have been proposed as protective. The most consistent evidence, although based
on only a few studies, indicates that high intakes of fruit and vegetables confer a decreased risk
of BPH.
Given the limited number of studies and quality of research in this area to date, there is
insufficient evidence to conclude on dietary risk factors for BPH. However, the findings
published so far and their biological plausibility suggest that this is an area of research that
deserves further attention.
66
Dietary Patterns in the Study of Diet and Disease
Rationale
Epidemiological studies have mostly reported weak associations between dietary intakes and
disease. There are several possible explanations for this. Imperfect dietary assessment tools,
and the within-person variation in diet contribute to measurement error, which reduces the
statistical power to detect diet-disease associations (191-193). Study conditions within
populations may not be suitable for testing relationships between nutrient exposures and
disease, especially where homogenous diets are common, or there is a restricted range of
nutrient intake (193).
A less explored reason is the predominant use of individual foods and nutrients when studying
diet and disease risk. The human diet provides a vast array of nutrients, and the effects of
dietary intake are complex and multifactorial (194, 195). The effects of individual nutrients may
therefore, be too small to detect (196). Nutrients and biologically active non-nutrients in food
continue to be identified. There is very little known about nutrient and non-nutrient interactions,
and it would be virtually impossible to test all of these individually. By not taking into account
the effect of the whole diet, important relationships between diet and disease may be
overlooked.
The separation of individual dietary effects is made more difficult due to the colinearity of many
nutrient intakes. For example, retinol intake is highly correlated with total fat intake as it a
fat-soluble vitamin. Similarly, zinc and protein intakes are highly correlated. Food intakes may
also be correlated, depending on the individual’s dietary pattern (197) e.g. red meat and fried
potatoes tend to be positively correlated in western-style diets (198, 199). Because many
dietary intakes are not independent of each other, modelling their effects simultaneously is
inappropriate for standard statistical models, which assume independent effects. However,
examining individual dietary intakes in separate models does not account for their potentially
synergistic effects, and conducting multiple statistical tests increases the likelihood of chance
findings. It has been noted previously that conclusions about diet-disease risks that are based
on a single nutrient may be seriously flawed because of the multi-collinearity of nutrients (198).

67
By studying dietary patterns, whereby the whole effect of diet and the potentially synergistic
effects of foods and nutrients is considered, these problems may be overcome (195, 196, 198,
200, 201). Dietary patterns reflect ‘real life’ dietary intake, such that humans eat meals
consisting of an assortment of foods, not isolated nutrients (198). Although the interpretation of
dose-response relationships in dietary patterns is slightly more complex (197), food-based
dietary patterns may be easier for the public to translate into healthy behaviour than
recommendations to increase or decrease specific nutrient intakes (198).
Typical dietary patterns identified in US studies include ‘western’ (high meat, refined grains,
French fries, high-fat dairy, snacks and sweets intake) and ‘fruit-vegetable’ (high fruit and
vegetable intakes) (199, 202, 203). Studies have demonstrated that dietary patterns identified
using empirical methods (such as factor or cluster analysis) can differentially predict colon
(203), stomach (204) and prostate (205) cancer risk, all-cause mortality (206), coronary heart
disease risk (198), cardiovascular disease risk (52), Type 2 diabetes (207), metabolic syndrome
(208) and plasma indicators of obesity (52). Others have identified differences in
socio-economic status and health behaviours across dietary patterns (209).
Empirical Determination of Dietary Patterns
Although the methodology has been around for some time, disease risks have not been studied
widely according to dietary patterns. Dietary patterns are sometimes defined a priori, based on
current nutritional knowledge e.g. applying the Health Eating Index (210). Alternatively,
empirically derived dietary patterns are identified via the statistical manipulation of dietary
intakes and are interpreted a posteriori (197). The most popular method for identifying dietary
patterns uses factor analysis, which is based on principal components analysis (PCA) (197).
PCA is a standard procedure in most statistical software packages that essentially, reduces a
large number of variables into a smaller number based on their correlations. Therefore, factor
analysis can transform multiple dietary variables into several mutually exclusive patterns
(factors) based on their intercorrelations (197). Another method used is cluster analysis, which
aggregates individuals according to differences in their average dietary intakes (197).

68
Factor analysis can identify independent patterns in the dietary intake of a population or sample,
based on their food or nutrient intakes. The foods or nutrients contributing to dietary patterns
and their weights are identified using the correlation loadings provided by factor analysis output.
In most studies of diet and disease, foods or nutrients with a loading of ± 0.25 - 0.30 are
considered important contributors to dietary patterns (198, 199, 211). The naming of dietary
patterns is arbitrary and subject to different interpretations based on their factor loadings. For
example, dietary patterns of varying composition have been named ‘healthy’ in different studies
(197). As there is no standardised method for naming dietary patterns, the components of each
pattern, rather than the pattern name alone, need to be considered carefully when comparing
the results of dietary pattern-disease studies.
Factor analysis requires a predefined number of factors (dietary patterns) to be retained in the
final steps of the analysis. An associated function, the scree plot, can indicate how much
variation in intake is explained by each factor, and this is useful for assigning the number of
factors to be retained. Sensitivity analyses using different numbers of factors (199) can also
help to confirm the most appropriate number of factors to retain. Once the main dietary patterns
are identified in a sample, a score for each dietary pattern is assigned to each subject, based on
their dietary intake. Scores can be calculated manually or by using a scoring procedure in a
statistical software package such as SAS (proc score) (212).
Some researchers have collapsed large numbers of foods or FFQ items into smaller food
groups before conducting factor analysis. Although using a smaller number of variables can
increase the amount of variance in intakes explained, collapsing items into arbitrary groupings
can introduce error and has been shown to attenuate the odds ratios associated with dietary
patterns (197).
Dietary patterns identified using factor analysis have been shown to be valid in comparison to
diet records (202, 213) and blood biomarkers (202), and repeatable over short (213) and long
time periods (214).

69
Dietary Patterns and Prostate Cancer Risk
Only three recently published studies have examined dietary patterns and prostate cancer risk
(199, 205, 211).
In 2004, prostate cancer and dietary patterns were analysed in the National Health and Nutrition
Examination Survey (NHANES I) Epidemiological Follow-up Study (1971-1975) (199). In
applying factor analysis to FFQ data, three dietary patterns emerged; a Vegetable-fruit pattern,
Red meat-starch pattern and Southern pattern (characterised by cornbread, grits, sweet
potatoes, okra, beans and rice). Both black and non-black men in the highest tertile for the
Southern pattern had a reduced risk of prostate cancer (RR=0.60, 95% CI, 0.40-1.10, trend
p=0.08). Although recreational sun exposure was one of the many potential confounders
included in the analysis (as well as race), the authors suggested that the Southern style diet
may be ‘an integrated marker’ for living in the Southern US and having greater sunlight
exposure and increased vitamin D status, which is thought to be protective against prostate
cancer (199). This was a relatively small study with only 89 histologically confirmed cases and
47 probable cases identified from interview or death certificate data.
A Canadian case-control study identified four dietary patterns using factor analysis on FFQ
data; Healthy Living, Traditional Western, Beverages and Processed (205). Men in the highest
tertile for the Processed pattern had an OR of 2.75 (95% CI, 1.40-5.39, trend p=0.0035) for
prostate cancer. The Processed pattern was positively loaded for red meats, organ meats,
processed meats, refined grains, vegetable oil, soft drinks, tomatoes and onions. Men in the
highest tertile for the Traditional Western pattern had an OR of 1.43 (95% CI, 0.79-2.59, p for
trend=0.22). A decreased risk was suggested for the Healthy Living pattern (OR=0.78, 95% CI,
0.42-1.45, p for trend=0.45) which was positively loaded for fish, wholegrains, fruit and
vegetables. Again, this study included a relatively small number of cases (n=80), and both
cases and controls were sourced from selected urology clinics rather than a population-based
tumour registry.

70
In 2006, dietary patterns and prostate cancer risk was examined in the Health Professionals
Follow Up Study of over 47,000 men (211). Two dietary patterns were identified using factor
analysis on FFQ intakes. The Prudent pattern was positively loaded for fruit, vegetables,
legumes, wholegrains, fish and poultry. The Western pattern was positively loaded for meats,
refined grains, sweets, high fat dairy, potatoes, french fries, margarine and butter. Based on
their analysis of 3,002 incident cases, no significant relationships were found between total
prostate cancer risk and either of these dietary patterns. However, the authors examined the
risk of advanced prostate cancer separately in men aged <65 and ≥65 years. Advanced
prostate cancers were defined as tumours that had spread to the seminal vesicle or adjacent
organs, or cases metastatic at diagnosis or fatal by the end of follow up. Higher scores for the
Western pattern suggested an increase in advanced prostate cancer risk among the older men
(RR=1.34, 95% CI, 0.96-1.88; p for trend=0.07). Intake of processed meat, a component of the
Western pattern, was a better predictor of advanced prostate cancer in older men (RR=1.51,
95% CI, 1.00-2.26; p=0.03). Red meat intake, another contributor to the Western pattern, was a
better predictor of advanced prostate cancer in the younger men (RR=2.12, 95% CI, 1.18-3.78;
p=0.0002).
Dietary Patterns and BPH Risk
To date, no published studies have examined dietary patterns and the risk of BPH.
Summary
Based on the limited data, it is possible that a dietary pattern characterised by high intakes of
red meat, processed meat, high fat dairy products and refined grains (commonly referred to as a
‘western’ pattern) increases the risk of prostate cancer. However, more studies are needed to
confirm this. The risk of BPH according to dietary patterns has not been examined.

71
Remote Dietary Intake
It is well established that clinical prostate cancer has a long latency phase (16), and the same is
likely for clinical BPH (155). The long latency periods for these and other chronic diseases
(including most cancers) implies that dietary and other lifestyle factors throughout life may
influence their onset and progression. Therefore, dietary intake from the distant past (or remote
dietary intake) is likely to be etiologically more relevant than recent or current dietary intake
when studying the nutritional determinants of BPH and prostate cancer. For example,
glucosinolates from cruciferous vegetables appear to play a protective role in the early stages of
prostate carcinogenesis by inducing enzymes that protect against DNA damage (84). As the
time between initiation and diagnosis of prostate cancer usually involves many years or even
decades, recent intake (or intake near the time of diagnosis) of cruciferous vegetables may be
irrelevant when studying prostate cancer risk (84).
It is possible that weak associations have been observed in many studies of diet and cancer
because most have depended on estimates of recent diet and therefore, misclassified dietary
intakes and underestimated the true effect of diet. Recent or current dietary intake is not
thought to be a reliable predictor of remote dietary intake, as level of activity, lifestyle, income
and food supply (215) are liable to change over time, and dietary habits are known to alter
significantly with advancing age (216). This is even more pertinent to cancer epidemiology as
estimates of recent diet from older people, whom the majority of cancers affect, are unlikely to
reflect the diet consumed over the most of their adult life. In addition, people diagnosed with
cancer may be prone to change their diet (217, 218), so that their recent diet is also less likely to
reflect past diet.
Thus, remote dietary recall ought to be of considerable interest in cancer epidemiology, yet few
studies have utilised or studied the reliability of remote dietary recall. Most epidemiological
studies of diet and chronic disease have relied on assessments of recent or current diet,
venturing no further than one to three years in the past when assessing diet. This is probably
due to an assumption that recall would be unreliable and/or a perceived level of difficulty in
obtaining compliant respondents. However, based on the few published studies (mostly using

72
correlation coefficients), dietary intakes recalled from a maximum of ten years prior have been
regarded as acceptable (118).
Most studies that have examined retrospective dietary intake have repeated a single dietary
method 3 to 5 years later (219) i.e. tested the reproducibility, rather than the validity or reliability
of a method. Generally these studies have concluded that although often influenced by current
diet (219-222) remote dietary recall correlates better with past diet than current diet (221, 223,
224). One study has compared multiple diet records to a FFQ completed 10-15 years later and
reported correlation coefficients ranging from 0.07 (vitamin A) to 0.46 (saturated fats) (225).
The reliability of remote dietary intake has not been explored well. Yet, there is logic for using
remote dietary intakes over recent dietary intakes in the study of chronic diseases such as BPH
and prostate cancer. Without studying the reliability of remote dietary recall, assumptions
regarding its appropriateness in epidemiology are not justified.

73
Thesis Hypotheses
Based on the evidence reviewed in this chapter, the hypotheses to be examined in this thesis
are:
Regarding foods, nutrients and risk of prostate cancer and BPH:
1. Dietary patterns characterised by high meat, processed meat, calcium and fat
content are positively associated with the risk of prostate cancer and
surgically-treated BPH.
2. Dietary patterns characterised by high fruit and vegetable and low meat content are
negatively associated with the risk of prostate cancer and surgically-treated BPH.
3. Increasing intakes of fruits, vegetables and zinc are negatively associated with the
risk of prostate cancer and surgically-treated BPH.
4. Increasing intakes of total fat and calcium are positively associated with the risk of
prostate cancer and surgically-treated BPH.
Regarding methodological issues related to the study of diet-disease relationships:
5. Dietary patterns (overall diet) elicited from principal components analysis yield
stronger diet-disease associations than when studying isolated nutrients.
6. Remotely recalled dietary intake is reliable enough to be used in studies of chronic
disease with long latency periods, such as prostate cancer and BPH.

74
References
1. Frydenberg M, Lawrentschuk N. Endocrinology of Male Reproduction. In: McLachlan R,
editor. Benign prostate disorders. [Electronic Book] 2004 [cited 11 June 2007]; Available
from: http://www.endotext.org/male/male9/male9.htm.
2. Untergasser G, Madersbacher S, Berger P. Benign prostatic hyperplasia: age-related
tissue remodelling. Exp Gerontology. 2005;40:121-8.
3. Repatriation General Hospital, Daw Park, South Australia, Prostate Health Improvement
Program (PHIP). Prostate cancer: should I be tested ? [Electronic Information Sheet].
2004 [cited 23 March 2007]; Available from:
http://www.prostatehealth.org.au/v3/html/sheet_1.htm#Overview
4. Australian Institute of Health and Welfare (AIHW) and the Australasian Association of
Cancer Registries (AACR). Cancer in Australia 2001. Canberra: AIHW; 2004.
5. Ferlay J, Bray F, Pisani P, Parkin DM. GLOBOCAN 2002: Cancer incidence, mortality
and prevalence worldwide. [Electronic database] 2004 [cited 17 July 2007]; Available
from: http://www-dep.iarc.fr/
6. Coory MD, Baade PD. Urban–rural differences in prostate cancer mortality, radical
prostatectomy and prostate-specific antigen testing in Australia. Med J Aust.
2005;182:112-5.
7. American Urological Association (AUA). Guideline for the Management of Clinically
Localised Prostate Cancer: 2007 Update. [cited 31 March 2008]; Available from:
http://www.auanet.org/guidelines/main_reports/proscan07/content.pdf
8. Shukla S, Gupta S. Dietary agents in the chemoprevention of prostate cancer. Nutr
Cancer. 2005;53:18-32.
9. Willis MS, Wians FH. The role of nutrition in preventing prostate cancer: a review of the
proposed mechanism of action of various dietary substances. Clin Chim Acta.
2003;330:57-83.
10. Wolk A. Diet, lifestyle and risk of prostate cancer. Acta Oncologica. 2005;44:277-81.
11. De Marzo AM, Platz EA, Sutcliffe S, Xu J, Gronberg H, Drake CG, et al. Inflammation in
prostate carcinogenesis. Nat Rev Cancer. 2007;7:256-69.
75
12. Sutcliffe S, Platz EA. Inflammation in the etiology of prostate cancer: An epidemiologic
perspective. Urol Oncol: Semin Orig Investig. 2007;25:242-9.
13. Palapattu GS, Sutcliffe S, Bastian PJ, Platz EA, De Marzo AM, Isaacs WB, et al. Prostate
carcinogenesis and inflammation: emerging insights. Carcinogenesis. 2005;26:1170-81.
14. Jacobs EJ, Rodriguez C, Mondul AM, Connell CJ, Henley SJ, Calle EE, et al. A large
cohort study of aspirin and other nonsteroidal anti-inflammatory drugs and prostate
cancer incidence. J Natl Cancer Inst. 2005;97:975-80.
15. Pereg D, Lishner M. Non-steroidal anti-inflammatory drugs for the prevention and
treatment of cancer. J Intern Med. 2005;258:115-23.
16. Clinton SK, Giovannucci E. Diet, nutrition and prostate cancer. Annu Rev Nutr.
1998;18:413-40.
17. Bostwick DG, Burke HB, Djakiew D, Euling S, Ho S-M, Landolph J, et al. Human prostate
cancer risk factors. Cancer. 2004;101:2371-490.
18. Fujikawa K, Sasaki M, Arai Y, Yamabe H, Ogawa O, Yishida O. Prognostic criteria in
patients with prostate cancer: Gleason score versus volume-weighted mean nuclear
volume. Clin Cancer Res. 1997;3:613-8.
19. Giovannucci E, Liu Y, Platz EA, Stampfer MJ, Willett WC. Risk factors for prostate cancer
incidence and progression in the health professionals follow-up study. Int J Cancer.
2007;121:1571-8.
20. Maggio M, Basaria S, Ceda GP, Ble A, Ling SM, Bandinelli S, et al. The relationship
between testosterone and molecular markers of inflammation in older men. J Endocrinol
Investig. 2005;28:116-9.
21. Harkonen PL, Makela SI. Role of estrogens in development of prostate cancer. J Steroid
Biochem Molec Biol. 2004;92:297-305.
22. Severi G, Morris HA, MacInnis RJ, English DR, Tilley W, Hopper JL, et al. Circulating
steroid hormones and the risk of prostate cancer. Cancer Epidemiol Biomarkers Prev.
2006;15:86-91.
23. Platz EA, Giovannucci E. The epidemiology of sex steroid hormones and their signalling
and metabolic pathways in the etiology of prostate cancer. J Steroid Biochem Molec
Biol. 2004;92:237-53.
24. Chokkalingam AP, Stanczyk FZ, Reichardt JK, Hsing AW. Molecular epidemiology of
prostate cancer: hormone-related genetic loci. Frontiers Bioscience. 2007;1:3436-60.

76
25. Bosland MC. Sex steroids and prostate carcinogenesis: integrated, multifactorial working
hypothesis. Ann NY Acad Sci. 2006;1089:168-76.
26. Klein EA, Casey G, Silverman R. Genetic susceptibility and oxidative stress in prostate
cancer: Integrated model with implications for prevention. Urology. 2006;68:1145-51.
27. Ntais C, Polycarpou A, Tsatsoulis A. Molecular epidemiology of prostate cancer:
androgens and polymorphisms in androgen-related genes. Eur J Endocrinol.
2003;149:469-77.
28. Neuhouser ML, Kristal AR, Penson DF. Steroid hormones and hormone-related genetic
and lifestyle characteristics as risk factors for benign prostatic hyperplasia: review of
epidemiologic literature. J Urol. 2004;64:201-11.
29. Zeegers MP, Kiemeney LALM, Nieder AM, Ostrer H. How strong is the association
between CAG and GGN repeat length polymorphisms in the androgen receptor gene and
prostate cancer risk? Cancer Epidemiol Biomarkers Prev. 2004;13:1765-71.
30. Li H, Stampfer MJ, Hollis JBW, Mucci LA, Gaziano JM, Hunter D, et al. A prospective
study of plasma vitamin D metabolites, vitamin D receptor polymorphisms, and prostate
cancer. PLoS Medicine. 2007;4:e103.
31. Wigle DT, Turner MC, Gomes J, Parent M, Eacute, lise. Role of hormonal and other
factors in human prostate cancer. J Toxicol Environ Health, Part B. 2008;11:242 - 59.
32. Cox B, Wneyd JJ, Paul C, Delehunt B, Skegg DCG. Vasectomy and risk of prostate
cancer. JAMA. 2002;287:3110-5.
33. Bernal-Delgado E, Latour-Perez J, Pradas-Arnal F, Gomez-Lopez LI. The association
between vasectomy and prostate cancer: a systematic review of the literature. Fertilit
Steril. 1998;70:191-200.
34. MacInnis RJ, English DR. Body size and composition and prostate cancer risk:
systematic review and meta-regression analysis. Cancer Causes Control. 2006;17:989-
1003.
35. Hsing AW, Sakoda LC, Chua SC, Jr. Obesity, metabolic syndrome, and prostate cancer.
Am J Clin Nutr. 2007;86:843S-57.
36. Giles GG, Severi G, Sinclair R, English ER, McCredie MRE, Johnson W, et al.
Androgenic alopecia and prostate cancer: findings from an Australian case-control study.
Cancer Epidemiol Biomarkers Prev. 2002;11:549-53.

77
37. Hawk E, Breslow RA, Graubard BI. Male pattern baldness and clinical prostate cancer in
the epidemiologic follow-up of the First National Health and Nutrition Examination
Survey. Cancer Epidemiol Biomarkers Prev. 2000;9:523-7.
38. Hsing AW, Tsao L, Devesa SS. International trends and patterns of prostate cancer
incidence and mortality. Int J Cancer. 2000;85:60-7.
39. Santner SJ, Albertson B, Zhang G-y, Zhang G-h, Santulli M, Wang C, et al. Comparative
rates of androgen production and metabolism in Caucasian and Chinese subjects. J Clin
Endocrinol Metab. 1998;83:2104-9.
40. Sim HG, Cheng CWS. Changing demography of prostate cancer in Asia. Eur J Cancer.
2005;41:834-45.
41. Sonn GA, Aronson W, Litwin MS. Impact of diet on prostate cancer: a review. Prostate
Cancer Prostatic Dis. 2005;8:304-10.
42. Yan L, Spitznagel EL. Meta-analysis of soy food and risk of prostate cancer in men. Int J
Cancer. 2005;117:667-9.
43. Popkin BM. Nutrition in transition: The changing global nutrition challenge. Asia Pac J
Clin Nutr. 2001;10:S13-S8.
44. Armstrong B, Doll R. Environmental factors and cancer incidence and mortality in
different countries, with special reference to dietary practices. Int J Cancer. 1975;15:617-
31.
45. Colli JL, Colli A. International comparisons of prostate cancer mortality rates with dietary
practices and sunlight levels. Urol Oncol: Sem Orig Investig. 2006;24:184-94.
46. Costello L, Franklin R. The clinical relevance of the metabolism of prostate cancer; zinc
and tumor suppression: connecting the dots. Molec Cancer. 2006;5:17.
47. Mawson CA, Fischer MI. The occurrence of zinc in the human prostate gland. Canad J
Med Sci. 1952;30:336-9
48. Costello LC, Franklin RB, Feng P, Tan M, Bagasra O. Zinc and prostate cancer: a critical
scientific, medical, and public interest issue (United States). Cancer Causes Control.
2005;V16:901-15.
49. Giovannucci E. Tomatoes, tomato-based products, lycopene and cancer: review of the
epidemiologic literature. JNCI. 1999;91:317-31.
50. Gonzalez CA. Nutrition and cancer: the current epidemiological evidence. Br J Nutr.
2006;96 Suppl 1:S42-5.

78
51. Fleshner NE, Kucuk O. Antioxidant dietary supplements: Rationale and current status as
chemopreventive agents for prostate cancer. Urology. 2001;57:90-4.
52. Fung T, Rimm E, Spiegelman D, Rifai N, Tofler G, Willett W, et al. Association between
dietary patterns and plasma biomarkers of obesity and cardiovascular disease risk. Am J
Clin Nutr. 2001;73:61-7.
53. Lopez-Garcia E, Schulze MB, Fung TT, Meigs JB, Rifai N, Manson JE, et al. Major
dietary patterns are related to plasma concentrations of markers of inflammation and
endothelial dysfunction. Am J Clin Nutr. 2004;80:1029-35.
54. Nettleton JA, Steffen LM, Mayer-Davis EJ, Jenny NS, Jiang R, Herrington DM, et al.
Dietary patterns are associated with biochemical markers of inflammation and endothelial
activation in the Multi-Ethnic Study of Atherosclerosis (MESA). Am J Clin Nutr.
2006;83:1369-79.
55. King D, Egan BM, Geesey ME. Relation of dietary fat and fiber to elevation of C-reactive
protein. Am J Cardiol. 2003;92:1335-9.
56. Ford ES, Mokdad AH, Liu S. Healthy Eating Index and C-reactive protein concentration:
findings from the National Health and Nutrition Examination Survey III, 1988-1994. Eur J
Clin Nutr. 2004;59:278-83.
57. Fung TT, McCullough ML, Newby PK, Manson JE, Meigs JB, Rifai N, et al. Diet-quality
scores and plasma concentrations of markers of inflammation and endothelial
dysfunction. Am J Clin Nutr. 2005;82:163-73.
58. Chrysohoou C, Panagiotakos DB, Pitsavos C, Das UN, Stefanadis C. Adherence to the
Mediterranean diet attenuates inflammation and coagulation process in healthy adults:
The Attica study. J Am Coll Cardiol. 2004;44:152-8.
59. Hotamisligil GS. Inflammation and metabolic disorders. Nature. 2006;444:860-7.
60. World Health Organisation (WHO) and the Food and Agriculture Organisation of the
United Nations (FAO). Diet, nutrition and the prevention of chronic diseases. Report of a
joint WHO/FAO expert consultation. Geneva: World Health Organisation; 2003.
61. Lund Haheim L, Wisloff TF, Holme I, Nafstad P. Metabolic syndrome predicts prostate
cancer in a cohort of middle-aged Norwegian men followed for 27 years. Am J Epidemiol.
2006;164:769-74.

79
62. Laukkanen JA, Laaksonen DE, Niskanen L, Pukkala E, Hakkarainen A, Salonen JT.
Metabolic syndrome and the risk of prostate cancer in Finnish men: a population-based
study. Cancer Epidemiol Biomarkers Prev. 2004;13:1646-50.
63. Tande AJ, Platz EA, Folsom AR. The metabolic syndrome is associated with reduced risk
of prostate cancer. Am J Epidemiol. 2006;164:1094-102.
64. Hammarsten J, Hogstedt B. Hyperinsulinaemia: A prospective risk factor for lethal clinical
prostate cancer. Eur J Cancer. 2005;41:2887-95.
65. Kasper JS, Giovannucci E. A meta-analysis of diabetes mellitus and the risk of prostate
cancer. Cancer Epidemiol Biomarkers Prev. 2006;15:2056-62.
66. Bonovas S, Filioussi K, Tsantes A. Diabetes mellitus and risk of prostate cancer: a meta-
analysis. Diabetologia. 2004;47:1071-8.
67. Dorgan JF, Judd JT, Longcope D, Brown C, Schatzkin A, Clevidence BA, et al. Effects of
dietary fat and fiber on plasma and urine androgens and estrogens in men: a controlled
feeding study. J Nutr. 1996;64:850-5.
68. Habito R, Ball MJ. Postprandial changes in sex hormones after meals of different
composition. Metabolism. 2001;50:505-11.
69. Gromadzka-Ostrowska J. Effects of dietary fat on androgen secretion and metabolism.
Reproductive Biology. 2006;6:13-20.
70. Renehan AG, Zwahlen M, Minder C, O'Dwyer ST, Shalet SM, Egger M. Insulin-like
growth factor (IGF)-I, IGF binding protein-3, and cancer risk: systematic review and meta-
regression analysis. The Lancet. 2004;363:1346-53.
71. Gunnell D, Oliver SE, Peters TJ, Donovan JL, Persad R, Maynard M, et al. Are diet-
prostate cancer associations mediated by the IGF axis ? A cross sectional analysis of
diet, IGF-1 and IGFBP-3 in healthy middle-aged men. Br J Cancer. 2003;88:1682-9.
72. McGreevy KM, Hoel BC, Lipsitz SR, Hoel DG. Impact of nutrients on insulin-like growth
factor-I, insulin-like growth factor binding protein-3 and their ratio in African American and
white males. Public Health Nutr. 2007;10:97-105.
73. Stata. Intercooled Stata 9.0 for Windows. 9.0 ed. College Station: StataCorp LP; 2005.
74. Etminan M, Takkouche B, Caamano-Isorna F. The role of tomato products and lycopene
in the prevention of prostate cancer: a meta-analysis of observational studies. Cancer
Epidemiol Biomarkers Prev. 2004;13:340-5.

80
75. Begg CB, Mazumdar M. Operating characteristics of a rank correlation test for publication
bias. Biometrics. 1994;50:1088-101.
76. World Cancer Research Fund (WCRF) and American Institute for Cancer Research
(AICR). Food, nutrition and the prevention of cancer: a global perspective. Washington,
DC: American Institute for Cancer Research; 1997.
77. Dagnelie PC, Schuurman AG, Goldbohm RA, van den Brandt PA. Diet, anthropometric
measures and prostate cancer risk: a review of prospective cohort and intervention
studies. BJU International. 2004;93:1139-50.
78. Cohen JH, Kristal AR, Stanford JL. Fruit and vegetable intakes and prostate cancer risk.
JNCI. 2000;92:61-8.
79. Kolonel LN, Hankin JH, Whittemore AS, Wu AH, Gallagher RP, Wilkens L, et al.
Vegetables, fruits, legumes and prostate cancer: a multiethnic case-control study. Cancer
Epidemiol Biomarkers Prev. 2000;9:795-804.
80. Bosetti C, Micelotta S, Dal Maso L, Talamini R, Montella M, Negri E, et al. Food groups
and risk of prostate cancer in Italy. Int J Cancer. 2004;110:424-8.
81. Hodge AM, English DR, McCredie MRE, Severi G, Boyle P, Hopper JL, et al. Foods,
nutrients and prostate cancer. Cancer Causes Control. 2004;15:11-20.
82. McCann SE, Ambrosone CB, Moysich KB, Brasure J, Marshall JR, Freudenheim JL, et
al. Intakes of selected nutrients, foods, and phytochemicals and prostate cancer risk in
Western New York. Nutr Cancer. 2005;53:33-41.
83. Jain M, Hislop G, Howe G, Ghadirian P. Plant foods, antioxidants, and prostate cancer
risk: findings from case-control studies in Canada. Nutr Canc Int J. 1999;34:173-84.
84. Giovannucci E, Rimm EB, Liu Y, Stampfer MJ, Willett WC. A prospective study of
cruciferous vegetables and prostate cancer. Cancer Epidemiol Biomarkers Prev.
2003;12:1403-9.
85. Key TJ, Allen N, Appleby P, Overvad K, Tjonneland A, Miller A, et al. Fruits and
vegetables and prostate cancer: no association among 1104 cases in a prospective
study of 130544 men in the European Prospective Investigation into Cancer and Nutrition
(EPIC). Int J Cancer. 2004;109:119-24.
86. Stram DO, Hankin JH, Wilkens LR, Park S, Henderson BE, Nomura AMY, et al. Prostate
cancer incidence and intake of fruits, vegetables and related micronutrients: the
multiethnic cohort study (United States). Cancer Causes Control. 2006;17:1193-207.

81
87. Le Marchand L, Hankin JH, Kolonel LN, Wilkens LR. Vegetables and fruit consumption in
relation to prostate cancer risk in Hawaii: a reevalution of the effect of dietary beta-
carotene. Am J Clin Nutr. 1991;133:215-9.
88. Deneo-Pellegrini H, De Stefani E, Ronco A, Mendilaharsu M. Foods, nutrients and
prostate cancer: a case-control study in Uruguay. Br J Cancer. 1999;80:591-7.
89. Hayes RB, Ziegler RG, Gridley G, Swanson C, Greenberg RS, Swanson GM, et al.
Dietary factors and risks for prostate cancer among blacks and whites in the United
States. Cancer Epidemiol Biomarkers Prev. 1999;8:25-34.
90. Villeneuve PJ, Johnson KC, Kreiger N, Mao Y. Risk factors for prostate cancer: results
from the Canadian National Enhanced Cancer Surveillance System. Cancer Causes
Control. 1999;10:355-67.
91. Chen YC, Chiang CI, Lin RS, Pu YS, Lai MK, Sung FC. Diet, vegetarian food and
prostate carcinoma among men in Taiwan. Br J Cancer. 2005;93:1057-61.
92. Ewings P, Bowie C. A case-control study of cancer of the prostate in Somerset and east
Devon. Br J Cancer. 1996;74:661-6.
93. De Stefani E, Fierro L, Barrios E, Ronco A. Tobacco, alcohol, diet and risk of prostate
cancer. Tumori. 1995;81:315-20.
94. Giovannucci E, Ascherio A, Rimm EB, Stampfer MJ, Colditz GA, Willett WC. Intake of
carotenoids and retinol in relation to risk of prostate cancer. JNCI. 1995;87:1767-76.
95. Schuurman AG, Goldbohm RA, Dorant E, Vandenbrandt PA. Vegetable and fruit
consumption and prostate cancer risk - a cohort study in the Netherlands. Cancer
Epidemiol Biomarkers Prev. 1998;7:673-80.
96. Chan J, Pietinen P, Virtanen M, Malila N, Tangrea J, Albanes D, et al. Diet and prostate
cancer risk in a cohort of smokers, with a specific focus on calcium and phosphorus
(Finland). Cancer Causes Control. 2000;11:859-67.
97. Allen N, Sauvaget C, Roddam AW, appleby P, Nagano J, Suzuki G, et al. A prospective
study of diet and prostate cancer in Japanese men. Cancer Causes Control.
2004;15:911-20.
98. Key TJ, Silcocks PB, Davey GK. A case control study of diet and prostate cancer. Br J
Cancer. 1997;76:678-87.
99. Tzonou A, Signorello LB, Lagiou P, Wuu J, Trichopoulos D, Trichopoulos A. Diet and
cancer of the prostate: a case-control study in Greece. Int J Cancer. 1999;80:704-8.

82
100. Norrish AE, Jackson RT, Sharpe SJ, Skeaff CM. Prostate cancer and dietary
carotenoids. Am J Epidemiol. 2000;151:119-23.
101. Joseph MA, Moysich KB, Freudenheim JL, Shields PG, Bowman ED, Zhang Y, et al.
Cruciferous vegetables, genetic polymorphisms in glutathione S-transferases M1 and T1,
and prostate cancer risk. Nutr Cancer. 2004;50:206-13.
102. Sonoda T, Nagata Y, Mori M, Miyanaga N, Takashima N, Okumura K, et al. A case-
control study of diet and prostate cancer in Japan: possible protective effect of traditional
Japanese diet. Cancer Science. 2004;95:238-42.
103. Kristal AR, Lampe JW. Brassica vegetables and prostate cancer risk: a review of the
epidemiological evidence. Nutr Cancer. 2002;42:1-9.
104. Sarkar FH, Li Y. Indole-3-Carbinol and Prostate Cancer. J Nutr. 2004;134:3493S-8.
105. Mills PK, Beeson WL, Philips RL, Fraser GE. Cohort study of diet, life style and prostate
cancer in Adventist men. Cancer. 1989;64:598-604.
106. Ellinger S, Ellinger J, Stehle P. Tomatoes, tomato products and lycopene in the
prevention and treatment of prostate cancer: do we have the evidence from intervention
studies ? Curr Opin Clin Nutr Metab Care. 2006;9:722-7.
107. Kavanaugh CJ, Trumbo PR, Ellwood KC. The U.S. Food and Drug Administration's
evidence-based review for qualified health claims: tomatoes, lycopene, and cancer. J
Natl Cancer Inst. 2007;99:1074-85.
108. Giovannucci E, Rimm E, Liu Y, Stampfer M, Willet W. A prospective study of tomato
products, lycopene, and prostate cancer risk. JNCI. 2002;94:391-8.
109. Kirsh VA, Mayne ST, Peters U, Chatterjee N, Leitzmann MF, Dixon LB, et al. A
prospective study of lycopene and tomato product intake and risk of prostate cancer.
Cancer Epidemiol Biomarkers Prev. 2006;15:92-8.
110. Chan JM, Gann PH, Giovannucci EL. Role of diet in prostate cancer development and
progression. J Clin Oncol. 2005;23:8152-60.
111. International Agency for Research on Cancer (IARC). Some N-nitroso compounds. In:
IARC Monographs on the Evaluation of Carcinogenic Risks to Humans Vol. 17, Suppl 7,
1978 [cited 20 August 2007, last updated 27 March 1998]. Available from:
http://monographs.iarc.fr/ENG/Monographs/vol17/volume17.pdf

83
112. Le Marchand L, Kolonel LN, Wilkens LR, Myers BC, Hirohata T. Animal fat consumption
and prostate cancer: a prospective study in Hawaii. Epidemiology. 1994;5:276-82.
113. Rodriguez C, McCullough ML, Mondul AM, Jacobs EJ, Chao A, Patel AV, et al. Meat
consumption among Black and White men and risk of prostate cancer in the Cancer
Prevention Study II Nutrition Cohort. Cancer Epidemiol Biomarkers Prev. 2006;15:211-6.
114. Schuurman AG, van den Brandt PA, Dorant E, Goldbohm RA. Animal products, calcium,
and protein and prostate cancer risk in the Netherlands Cohort Study. Br J Cancer.
1999;80:1107-13.
115. Rohrmann S, Platz EA, Kavanaugh CJ, Thuita L, Hoffman SC, Helzlsouer KJ. Meat and
dairy consumption and subsequent risk of prostate cancer in a US cohort study. Cancer
Causes Control. 2007;18:41-50.
116. Cross AJ, Peters U, Kirsh VA, Andriole GL, Reding D, Hayes RB, et al. A prospective
study of meat and meat mutagens and prostate cancer risk. Cancer Res. 2005;65:11779-
84.
117. Park S-Y, Murphy SP, Wilkens LR, Henderson BE, Kolonel LN. Fat and meat intake and
prostate cancer risk: The multiethnic cohort study. Int J Cancer. 2007;121:1339-45.
118. Willett WC, Stampfer M. Implications of total energy intake for epidemiological analyses.
In: Willett W, editor. Nutritional Epidemiology. Second ed. New York: Oxford University
Press; 1998. p. 273-98.
119. Bravo MP, Castellanos E, del Ray Calero J. Dietary factors and prostate cancer. Urology
International. 1991;46:163-6.
120. Sung JFC, Lin RS, Pu Y-S, Chen Y-C, Chang HC, Lai M-K. Risk factors for prostate
carcinoma in Taiwan. Cancer. 1999;86:484-91.
121. Veierød MB, Laake P, Thelle DS. Dietary fat intake and risk of prostate cancer: A
prospective study of 25,708 Norwegian men. Int J Cancer. 1997;73:634-8.
122. Terry PD, Rohan TE, Wolk A. Intakes of fish and marine fatty acids and the risks of
cancer of the breast and prostate and of other hormone-related cancers: a review of the
epidemiologic evidence. Am J Clin Nutr. 2003;77:532-43.
123. Hsieh LJ, Carter BH, Landis PK, Tucker KL, Metter EJ, Newschaffer CJ, et al.
Association of energy intake with prostate cancer in a long-term aging study: Baltimore
Longitudinal Study of Aging (United States). Urology. 2003;61:297-301.

84
124. Michaud DS, Augustsson K, Rimm EB, Stampfer MJ, Willett WC, Giovannucci E. A
prospective study on intake of animal products and risk of prostate cancer. Cancer
Causes Control. 2001;12:557-67.
125. Neuhouser ML, Barnett MJ, Kristal AR, Ambrosone CB, King I, Thornquist M, et al. (n-6)
PUFA increase and dairy foods decrease prostate cancer risk in heavy smokers. J Nutr.
2007;137:1821-7.
126. Habito R, Monatalto J, Leslie E, Ball M. Effects of replacing meat with soyabean in the
diet on sex hormone concetnrations in healthy adult males. Br J Nutr. 2000;84:557-63.
127. Kolonel LN, Yoshizawa CN, Hankin JH. Diet and prostatic cancer: a case-control study in
Hawaii. Am J Epidemiol. 1988;127:999-1012.
128. Andersson SO, Wolk A, Bergstrom R, Giovannucci E, Lindgren C, Baron J, et al. Energy,
nutrient intake and prostate cancer risk: a population-based case-control study in
Sweden. Int J Cancer. 1996;68:716-22.
129. West DW, Slattery ML, Robison LM, French TK, Mahoney AW. Adult dietary intake and
prostate cancer risk in Utah: a case-control study with special emphasis on aggressive
tumors. Cancer Causes Control. 1991;2:85-94.
130. Ghadirian P, Lacroiz A, Maisonneuve P, Perret C, Drouin G, Perrault JP, et al. Nutritional
factors and prostate cancer: a case-control study of French Canadians in Montreal,
Canada. Cancer Causes Control. 1996;7:428-36.
131. Rohan TE, Howe GR, David Burch J, Jain M. Dietary factors and risk of prostate cancer:
a case-control study in Ontario, Canada. Cancer Causes Control. 1995;6:145-54.
132. Bidoli E, Talamini R, Bosetti C, Negri E, Maruzzi D, Montella M, et al. Macronutrients,
fatty acids, cholesterol and prostate cancer risk. Annals of Oncology. 2005;16:152-7.
133. Schuurman AG, van den Brandt PA, Dorant E, Brants HA, Goldbohm RA. Association of
energy and fat intake with prostate carcinoma risk: results from The Netherlands Cohort
Study. Cancer. 1999;86:1019-27.
134. Giovannucci E, Rimm EB, Colditz GA, Stampfer MJ, Ascherio A, Chute CC, et al. A
prospective study of dietary fat and risk of prostate cancer. J Natl Cancer Inst.
1993;85:1571-9.
135. Kristal AR, Cohen JH, Qu P, Stanford JL. Associations of energy, fat, calcium, and
vitamin D with prostate cancer risk. Cancer Epidemiol Biomarkers Prev. 2002;11:719-25.

85
136. Barnard RJ, Aronson WJ, Tymchuk CN, Ngo TH. Prostate cancer: another aspect of the
insulin-resistance syndrome? Obesity Reviews. 2002;3:303-8.
137. Tymchuk CN, Tessler SB, Aronson WJ, Barnard RJ. Effects of diet and exercise on
insulin, sex hormone-binding globulin, and prostate-specific antigen. Nutr Cancer.
1998;31:127-31.
138. Lee MM, Wang R-T, Hsing AW, Gu F-L, Wang T, Spitz M. Case-control study of diet and
prostate cancer in China. Cancer Causes Control. 1998;9:545-52.
139. Whittemore AS, Kolonel LN, Wu AH, E.M. J, Gallagher RP, Howe GR, et al. Prostate
cancer in relation to diet, physical activity and body size in blacks, whites and asians in
the USA and Canada. JNCI. 1995;87:652-61.
140. Qin L-Q, Xu J-Y, Wang P-Y, Kaneko T, Hoshi K, Sato A. Milk consumption is a risk factor
for prostate cancer: meta-Analysis of case-control studies. Nutr Cancer. 2004;48:22-7.
141. Schwartz GG, Wang MH, Zang M, Singh RK, Siegal GP. 1 alpha,25-Dihydroxyvitamin D
(calcitriol) inhibits the invasiveness of human prostate cancer cells. Cancer Epidemiol
Biomarkers Prev. 1997;6:727-32.
142. Lokeshwar BL, Schwartz GG, Selzer MG, Burnstein KL, Zhuang S-H, Block NL, et al.
Inhibition of Prostate Cancer Metastasis in Vivo: A Comparison of 1,25-Dihydroxyvitamin
D (Calcitriol) and EB1089. Cancer Epidemiol Biomarkers Prev. 1999;8:241-8.
143. Giovannucci E, Rimm EB, Wolk A, Ascherio A, Stampfer MJ, Colditz GA, et al. Calcium
and fructose intake in relation to risk of prostate cancer. Cancer Res. 1998;53:442-7.
144. Chan JM, Stampfer MJ, Ma J, Gann PH, Gaziano JM, Giovannucci EL. Dairy products,
calcium, and prostate cancer risk in the Physicians' Health Study. Am J Clin Nutr.
2001;74:549-54.
145. Rodriguez C, McCullough ML, Mondul AM, Jacobs EJ, Fakhrabadi-Shokoohi D,
Giovannucci EL, et al. Calcium, dairy products, and risk of prostate cancer in a
prospective cohort of United States men. Cancer Epidemiol Biomarkers Prev.
2003;12:597-603.
146. Tseng M, Breslow RA, Graubard BI, Ziegler RG. Dairy, calcium, and vitamin D intakes
and prostate cancer risk in the National Health and Nutrition Examination Epidemiologic
Follow-up Study cohort. Am J Clin Nutr. 2005;81:1147-54.

86
147. Giovannucci E, Liu Y, Stampfer MJ, Willett WC. A prospective study of calcium intake
and incident and fatal prostate cancer. Cancer Epidemiol Biomarkers Prev. 2006;15:203-
10.
148. Berndt SI, Carter BH, Landis PK, Tucker KL, Hsieh LJ, Metter EJ, et al. Calcium intake
and prostate cancer risk iin a long-term aging study: the Baltimore Longitudinal Study of
Aging. Urology. 2002;60:1118-23.
149. Smolin LA, Grosvenor MB. The Trace Elements. In: Nutrition Science and Applications.
Hoboken, NJ, USA: John Wiley and Sons Inc.; 2007. p. pp458-95.
150. Platz EA, Helzlsouer KJ, S.C. H, Morris JS, Baskett CK, Comstock GW. Prediagnostic
toenail cadmium and zinc and subsequent prostate cancer risk. The Prostate.
2002;52:288-96.
151. Vlajinac HD, Marinkovic JM, Ilic MD, Kocev NI. Diet and prostate cancer: a case-control
study. Eur J Cancer. 1997;33:101-7.
152. Gallus S, Foschi R, Negri E, Talamini R, Franceschi S, Montella M, et al. Dietary zinc and
prostate cancer risk: a case-control study from Italy. Euro Urol. 2007;52:1052-6
153. Leitzmann MF, Stampfer MJ, Wu K, Colditz GA, Willett WC, Giovannucci EL. Zinc
supplement use and risk of prostate cancer. J Natl Cancer Inst. 2003;95:1004-7.
154. Kontogianni MD, Zampelas A, Tsigos C. Nutrition and inflammatory load. Ann N Y Acad
Sci. 2006;1083:214-38.
155. Kramer G, Mitteregger D, Marberger M. Is benign prostatic hyperplasia (BPH) an immune
inflammatory disease? Euro Urol. 2007;51:1202-16.
156. Pinnock C, Marshall V. Troublesome lower urinary tract symptoms in the community: a
prevalence study. Med J Aust. 1997;167:72-5.
157. Andersson S-O, Rashidkhani B, Karlberg L, Wolk A, Johansson J-E. Prevalence of lower
urinary tract symptoms in men aged 45-79 years: a population-based study of 40,000
Swedish men. BJU International. 2004;94:327-31.
158. Platz EA, Smit E, Curhan GC, Nyberg JLM, Giovannucci E. Prevalence of and
racial/ethnic variation in lower urinary tract symptoms and noncancer prostate surgery in
U.S. men. Urology. 2002;59:877-83.
159. Trueman P, Hood SC, Nayak USL, Mrazek MF. Prevalence of lower urinary tract
symptoms and self-reported diagnosed 'benign prostatic hyperplasia', and their effect on

87
quality of life in a community-based survey of men in the UK. BJU International.
1999;83:410-5.
160. Parsons JK, Carter HB, Partin AW, Windham BG, Metter EJ, Ferrucci L, et al. Metabolic
factors associated with benign prostatic hyperplasia. J Clin Endocrinol Metab.
2006;91:2562-8.
161. American Urological Association (AUA). Benign prostatic hyperplasia: a patient's guide.
2003 [cited 26 March 2007]; Available from:
http://www.auanet.org/guidelines/patient_guides/bph_guide_2003.pdf
162. Holman CDJ, Wisniewski ZS, Semmens J, Rouse IL, Bass AJ. Quality of surgical care
project. outcomes of surgery for benign prostatic hypertrophy in Western Australia 1980-
1995. Technical Report Series. Perth: University of Western Australia and Health
Department of Western Australia; 1997 November.
163. American Urological Association (AUA). AUA Guideline on the management of benign
prostatic hyperplasia. Chapter 1: Diagnosis and treatment recommendations. 2006
[cited 29 March 2007]; Available from:
http://www.auanet.org/guidelines/main_reports/bph_management/chapt_1_appendix.pdf
164. Barry MJ. Evaluation of symptoms and quality of life in men with benign prostatic
hyperplasia. Urology. 2001;58:25-32.
165. Kramer G, Marberger M. Could inflammation be a key component in the progression of
benign prostatic hyperplasia ? Curr Opin Urol. 2006;16:25-9.
166. Kaaks R, Lukanova A. Energy balance and cancer: the role of insulin and insulin-like
growth factor-I. Proc Nutr Soc. 2001;60:91-106.
167. Dahle SE, Chokkalingam AP, Gao Y-T, Deng JT, Stanczyk FZ, Hsing AW. Body size and
serum levels of insulin and leptin in relation to the risk of benign prostatic hyperplasia. J
Urology. 2002;168:599-604.
168. Chokkalingam AP, Gao Y-T, Deng JT, Stanczyk FZ, Sesterhenn IA, Mostofi FK, et al.
Insulin-like growth factors and risk of benign prostatic hyperplasia. The Prostate.
2002;52:98-105.
169. Nandeesha H, Koner BC, Dorairajan LN, Sen SK. Hyperinsulinemia and dyslipidemia in
non-diabetic benign prostatic hyperplasia. Clin Chim Acta. 2006;370:89-93.

88
170. Pearson JD, Lei H-H, Beaty TH, Wiley KE, Isaacs SD, Isaacs WB, et al. Familial
aggregation of bothersome benign prostatic hyperplasia symptoms. Urology.
2003;61:781-5.
171. Guess HA. Benign prostatic hyperplasia and prostate cancer. Epidemiol Rev.
2001;23:152-8.
172. Negri E, Pelucchi C, Talamini R, Montella M, Gallus S, Bosetti C, et al. Family history of
cancer and the risk of prostate cancer and benign prostatic hyperplasia. Int J Cancer.
2005;114:648-52.
173. Roberts RO, Bergstralh EJ, Cunningham JM, Hebbring SJ, Thibodeau SN, Lieber MM, et
al. Androgen receptor gene polymorphisms and increased risk of urologic measures of
benign prostatic hyperplasia. Am J Epidemiol. 2004;159:269-76.
174. Giovannucci E, Rimm EB, Chute CG, Kawachi I, Colditz GA, Stampfer MJ, et al. Obesity
and benign prostatic hyperplasia. Am J Epidemiol. 1994;140:989-1002.
175. Dal Maso L, Zucchetto A, Tavani A, Montella M, Ramazzotti V, Polesel J, et al. Lifetime
occupational and recreational physical activity and risk of benign prostatic hyperplasia.
Int J Cancer. 2005;118:2632-5.
176. Parsons JK. Modifiable risk factors for benign prostatic hyperplasia and lower urinary
tract symptoms: new approaches to old problems. J Urology. 2007;178:395-401.
177. Crispo A, Talamini R, Gallus S, Negri E, Gallo A, Bosetti C, et al. Alcohol and the risk of
prostate cancer and benign prostatic hyperplasia. Urology. 2004;64:717-22.
178. Kang D, Andriole GL, van de Vooren RC, Crawford D, Chia D, Urban DA, et al. Risk
behaviours and benign prostatic hyperplasia. BJU International. 2004;93:1241-5.
179. Platz E, Kawachi I, Rimm E, Willett W, Giovannucci. Race, ethnicity and benign prostatic
hyperplasia in the health professionals follow-up study. J Urology. 2000;163:490-5.
180. Denis L, Morton MS, Griffiths K. Diet and its preventive role in prostatic disease. Euro
Urol. 1999;35:377-87.
181. Gu FL. Changes in the prevalence of benign prostatic hyperplasia in China. Chinese
Medical Journal. 1997;110:163-6.
182. Geller J, Sionit L, Partido C, Li L, Tan X, Youngkin T, et al. Genistein inhibits the growth
of human-patient BPH and prostate cancer in histoculture. The Prostate. 1998;34:75-9.
183. Giugliano D, Ceriello A, Esposito K. The Effects of diet on inflammation: emphasis on the
metabolic syndrome. J Am Coll Cardiol. 2006;48:677-85.

89
184. Lagiou P, Wuu J, Trichopoulou A, Hsieh C, Adami H, Trichopoulos D. Diet and benign
prostatic hyperplasia: A study in Greece. Urology. 1999;54:284-90.
185. Bravi F, Bosetti C, Dal Maso L, Talamini R, Montella M, Negri E, et al. Food groups and
risk of benign prostatic hyperplasia. Urology. 2006;67:73-9.
186. Tavani A, Longoni E, Bosetti C, Maso LD, Polesel J, Montella M, et al. Intake of selected
micronutrients and the risk of surgically treated benign prostatic hyperplasia: a case-
control study from Italy. Euro Urol. 2006;50:549-54.
187. Araki H, Watanabe H, Mishina T, Nakao M. High-risk group for benign prostatic
hypertrophy. Prostate. 1983;4:253-64.
188. Chyou P-H, Nomura AMY, Stemmermann GN, Hankin JH. A prospective study of
alcohol, diet, and other lifestyle factors in relation to obstructive uropathy. The Prostate.
1993;22:253-64.
189. Suzuki S, Platz E, Kawachi I, Willett W, Giovannucci E. Intakes of energy and
macronutrients and the risk of benign prostatic hyperplasia. Am J Clin Nutr. 2002;75:689-
97.
190. Rohrmann S, Giovannucci E, Willett WC, Platz EA. Fruit and vegetable consumption,
intake of micronutrients, and benign prostatic hyperplasia in US men. Am J Clin Nutr.
2007;85:523-9.
191. Sempos CT, Liu K, Ernst ND. Food and nutrient exposures: what to consider when
evaluating epidemiologic evidence. Am J Clin Nutr. 1999;69:1330S-8S.
192. Potischman N, Weed DL. Causal criteria in nutritional epidemiology. Am J Clin Nutr.
1999;69:1309S-14S.
193. Wirfalt AK, Jeffery RW. Using cluster analysis to examine dietary patterns: nutrient
intakes, gender, and weight status differ across food pattern clusters. J Am Diet Assoc.
1997;97:272-9.
194. Greenwood DC, Cade JE, Draper A, Barrett JH, Calvert C, Greenhalgh A. Seven unique
food consumption patterns identified among women in the UK women's cohort study. Eur
J Clin Nutr. 2000;54:314-20.
195. Wirfalt E, Mattisson I, Gullberg B, Berglund G. Food patterns defined by cluster analysis
and their utility as dietary exposure variables: a report from the Malmo Diet and Cancer
Study. Public Health Nutr. 2000;3:159-73.

90
196. Hu FB. Dietary pattern analysis: a new direction in nutritional epidemiology. Curr Opinion
Lipidol. 2002;13:3-9.
197. Newby PK, Tucker KL. Empirically derived eating patterns using factor or cluster
analysis: a review. Nutr Rev. 2004;62:177-203.
198. Hu FB, Rimm EB, Stampfer MJ, Ascherio A, Spiegelman D, Willett WC. Prospective
study of major dietary patterns and risk of coronary heart disease in men. Am J Clin Nutr.
2000;72:912-21.
199. Tseng M, Breslow RA, De Vellis RF, Ziegler RG. Dietary patterns and prostate cancer
risk in the National Health and Nutrition Examination Survey Epidemiological Follow Up
Study Cohort. Cancer Epidemiol Biomarkers Prev. 2004;13:71-7.
200. Jacques PF, Tucker KL. Are dietary patterns useful for understanding the role of diet in
chronic disease? Am J Clin Nutr. 2001;73:1-2.
201. Schulze MB, Hoffman K, Kroke A, Boeing H. Dietary patterns and their association with
food and nutrient intake in the European Prospective Investigation into Cancer and
Nutrition (EPIC) - Potsdam study. Br J Nutr. 2001;85:363-73.
202. Hu FB, Rimm E, Smith-Warner SA, Feskanich D, Stampfer MJ, Ascherio A, et al.
Reproducibility and validity of dietary patterns assessed with a food-frequency
questionnaire. Am J Clin Nutr. 1999;69:243-9.
203. Slattery ML, Boucher KM, Caan BJ, Potter JD, Ma KN. Eating patterns and risk of colon
cancer. Am J Epidemiol. 1998;148:4-16.
204. Chen H, Ward MH, Graubard BI, Heineman EF, Markin RM, Potischman NA, et al.
Dietary patterns and adenocarcinoma of the esophagus and distal stomach. Am J Clin
Nutr. 2002;75:137-44.
205. Walker M, Aronson KJ, King W, Wilson JWL, Fan W, Heaton JPW, et al. Dietary patterns
and risk of prostate cancer in Ontario, Canada. Int J Cancer. 2005;116:592-8.
206. Kumagai S, Shibata H, Watanabe S, Suzuki T, Haga H. Effect of food intake pattern on
all-cause mortality in the community elderly: a 7-year longitudinal study. J Nutr Health
Aging. 1999;3:29-33.
207. Hodge AM, English DR, O'Dea K, Giles GG. Dietary patterns and diabetes incidence in
the Melbourne Collaborative Cohort Study. Am J Epidemiol. 2007;165:603-10.
91
208. Esmaillzadeh A, Kimiagar M, Mehrabi Y, Azadbakht L, Hu FB, Willett WC. Dietary
patterns, insulin resistance, and prevalence of the metabolic syndrome in women. Am J
Clin Nutr. 2007;85:910-8.
209. Margetts BM, Thompson RL, Speller V, McVey D. Factors which influence 'healthy'
eating patterns: results from the 1993 Health Education Authority health and lifestyle
survey in England. Public Health Nutr. 1998;1:193-8.
210. Haines PS, Siega-Riz AM, Popkin BM. The Diet Quality Index revised: a measurement
instrument for populations. J Am Diet Assoc. 1999;99:697-704.
211. Wu K, Hu FB, Willett WC, Giovannucci E. Dietary patterns and risk of prostate cancer in
US men. Cancer Epidemiol Biomarkers Prev. 2006;15:167-71.
212. SAS. SAS for Windows. 9.1.3 ed. Cary, NC, USA: SAS Institute Incorporated; 2002-
2003.
213. Khani BR, Ye W, Terry P, Wolk A. Reproducibility and validity of major dietary patterns
among Swedish women assessed with a food-frequency questionnaire. J Nutr.
2004;134:1541-5.
214. Newby PK, Weismayer C, Akesson A, Tucker KL, Wolk A. Long-term stability of food
patterns identified by use of factor analysis among Swedish women. J Nutr.
2006;136:626-33.
215. Dwyer J, Gardner J, Halvorsen K, Krall E, Cohen A, Valadian I. Memory of food intake in
the distant past. Am J Epidemiol. 1989;130:1033-46.
216. Drewnowski A, Shultz JM. Impact of aging on eating behaviors, food choices, nutrition,
and health status. J Nutr Health Aging. 2001;5:75-9.
217. Blanchard CM, Denniston MM, Baker F, Ainsworth SR, Courneya KS, Hann DM, et al.
Do adults change their lifestyle behaviours after a cancer diagnosis ? American Journal
of Health Behaviour. 2003;27:246-56.
218. Satia JA, Campbell MK, Galanko JA, James A, Carr C, Sandler RS. Longitudinal
changes in lifestyle behaviors and health status in colon cancer survivors. Cancer
Epidemiol Biomarkers Prev. 2004;13:1022-31.
219. Friedenreich CM, Slimani N, Riboli E. Measurement of past diet: review of previous and
proposed methods. Epidemiol Rev. 1992;14:177-96.

92
220. Bakkum A, Bloemberg B, Van Staveren W, Verschuren M, West C. The relative validity
of a retrospective estimate of food consumption based on a current dietary history and a
food frequency list. Nutr Cancer. 1988;11:41-53.
221. Byers T, Rosenthal R, Marshall J, Rzepka T, Cummings K, Graham S. Dietary history
from the distant past:a methodological study. Nutr Cancer. 1983;5:69-77.
222. Thompson F, Metzner H, Lamphiear D, Hawthorne V. Characteristics of individuals and
long term reproducibility of dietary reports: the Tecumseh Diet Methodology Study. J Clin
Epidemiol. 1990;43:1169-78.
223. Wilkens L, Hankin J, Yoshizawa C, Kolonel L, Lee J. Comparison of long-term dietary
recall between cancer cases and noncases. Am J Epidemiol. 1992;136:825-35.
224. Byers T, Marshall J, Anthony E, Fiedler R, Zielezny M. The reliability of dietary history
from the distant past. Am J Epidemiol. 1987;125:999-1011.
225. Sobell J, Block G, Koslowe P, Tobin J, Andres R. Validation of a retrospective
questionnaire assessing diet 10-15 years ago. Am J Epidemiol. 1989;130:173-87.

93
CHAPTER 3: METHODS AND RESULTS

94
This chapter consists of six manuscripts, some published in peer-reviewed journals, presented
in order of completion:
Paper 1: Ambrosini GL, de Klerk NH, Fritschi L, Mackerras L and Musk AW. Fruit,
vegetable, vitamin A intakes and prostate cancer risk. Prostate Cancer and
Prostatic Diseases 2008; 11: 61-66.
Paper 2: Ambrosini GL, van Roosbroeck SAH, Mackerras D, Fritschi L, de Klerk NH and
Musk AW. The reliability of ten-year dietary recall: implications for cancer
research. Journal of Nutrition 2003; 133: 2663-2668.
Paper 3: Ambrosini GL, de Klerk NH, Mackerras D, Leavy J and Fritschi L. Dietary
patterns and benign prostatic hyperplasia: a case-control study in Western
Australia. BJU International 2008; 101: 853-860.
Paper 4: Ambrosini GL, Fritschi L, de Klerk NH, Leavy J and Mackerras D. Nutrient intakes
and benign prostatic hyperplasia: a case-control study in Western Australia.
(unpublished manuscript).
Paper 5: Ambrosini GL, Fritschi L, de Klerk NH, Mackerras D and Leavy J. Dietary
patterns and prostate cancer: a case-control study in Western Australia. Annals
of Epidemiology in press : DOI: 10.1016/j.annepidem.2007.11.010 2008
Paper 6: Ambrosini GL, Fritschi L, de Klerk NH, Leavy J and Mackerras D. A comparative
analysis of nutrient intakes, nutrient patterns and prostate cancer risk
(unpublished manuscript).

95
Paper 1 arises from a cancer prevention program of beta-carotene and retinol supplements,
conducted in Western Australia during 1990-1996 (Vitamin A Program). Subjects were persons
previously exposed to asbestos through their occupations or area of residence.
Papers 2 to 6 contain results from the Prostate Health Study (PHS), a population-based
case-control study conducted in Western Australia during 2001 and 2002, to examine risk
factors for prostate cancer and surgically-treated BPH. Paper 2 evaluates the use of a food
frequency questionnaire (FFQ) modified to estimate dietary intakes from ten years earlier, which
was administered in the PHS. Papers 3 to 6 examine dietary intakes and disease risk in the
PHS.

96
Paper 1
Fruit, vegetable, vitamin A intakes, and prostate c ancer
risk.
Gina L Ambrosini1, Nicholas H de Klerk1, Lin Fritschi2, Dorothy Mackerras3,4, Bill Musk1.
1School of Population Health, University of Western Australia.
2Western Australian Institute for Medical Research, Western Australia.
3Menzies School of Health Research, Northern Territory, Australia
4Institute of Advanced Studies, Charles Darwin University, Northern Territory, Australia.
The identical published version of this paper can b e found in Appendix 3:
Ambrosini GL, de Klerk NH, Fritschi L, Mackerras L and Musk AW. Fruit, vegetable, vitamin A
intakes and prostate cancer risk. Prostate Cancer and Prostatic Diseases, 2008; 11; 61-66.

97
Abstract
Prostate cancer risk was examined in relation to intakes of fruit, vegetables, beta-carotene, and
retinol. Subjects were a cohort of 1,985 men previously exposed to asbestos who participated
in a cancer prevention program of beta-carotene and retinol supplements that commenced in
July, 1990. Diet was assessed at entry to the program. Ninety-seven cases of prostate cancer
were identified during follow up until the end of 2004. A decreased prostate cancer risk was
observed with increasing intakes of vitamin C-rich vegetables, including bell peppers and
broccoli. Fruit, other vegetables and vitamin A intakes did not appear to be strong factors in the
development of prostate cancer in this study.
98
Introduction
Much of the global variation in prostate cancer incidence is thought to be attributable to diet (1),
and several observational studies have examined intakes of different fruit and vegetables and
prostate cancer risk (2-9), Although it is widely accepted that a diet rich in fruits and vegetables
may protect against some cancers (10, 11) the evidence in relation to prostate cancer is
inconclusive (12). However, clinical studies have demonstrated that specific bioactive
compounds common to plant foods, including lycopene, beta-carotene, vitamin E, vitamin C and
various phytoestrogens (e.g. soy-derived isoflavonoids), as well as vitamin A and retinoids, may
significantly reduce prostate cancer risk or prostate cancer cell growth (12). This study
examined the risk of prostate cancer during 12 years of follow-up in relation to intakes of fruit
and vegetables, beta-carotene, and retinol.
Materials and methods
Subjects
Blue asbestos (crocidolite) was mined and milled in the remote town of Wittenoom Gorge in
Western Australia from 1943 until 1966. We have maintained follow up on cohorts of former
workers (n= 6,908) and residents (n=4,890) of Wittenoom Gorge since 1975, to document the
epidemiology of asbestos-related diseases including asbestosis, malignant mesothelioma and
lung cancer (13). The cohorts and estimation of their cumulative asbestos exposures
(residential and occupational) have been described in detail elsewhere (14, 15).
In July 1990 all surviving members of the Wittenoom workers cohort who could be traced
(n=2,373) were invited to take part in a cancer prevention program to examine the efficacy of
beta-carotene (synthetic all-trans) and retinol (retinyl palmitate) supplements (hereafter referred
to as vitamin A supplements) in reducing the risk of malignant mesothelioma, lung cancer and
other cancers (16). The program was subsequently opened to members of the Wittenoom
residents cohort and persons who had experienced an equivalent of at least three months of full
time occupational exposure to crocidolite elsewhere (i.e. not at Wittenoom) e.g. carpenters,
waterside workers, plumbers. These two groups were not actively recruited.

99
At entry to the program, all participants were asked to complete a food frequency questionnaire
(FFQ) and to provide smoking, medical and occupational histories. Height and weight was also
measured. Former Wittenoom workers were randomly assigned to take either 30mg
beta-carotene or 7.5mg retinol daily except those with abnormal liver function tests, who were
randomised to either 0.75 mg or 30mg of beta-carotene daily. Former Wittenoom residents and
all other participants were randomly assigned to receive either 0.75 mg or 30mg of
beta-carotene daily. All participants were given one year’s supply of the randomly allocated
vitamin A supplement, and were required to attend a follow up appointment every twelve
months. Preliminary analyses in 1995 established that the 5 year incidence of mesothelioma in
former Wittenoom workers was lower in those assigned to retinol compared to those assigned
to beta-carotene (RR=0.24, 95% CI 0.07-0.86). This, in combination with overseas trials
showing increased rates of lung cancer among smokers taking similar doses of beta-carotene
(17, 18), led to supplementation with beta-carotene being discontinued in 1996. All men were
thereafter assigned to 7.5mg of retinol/day only, except those with abnormal liver function, who
were supplemented with 0.4mg of retinol/day.
Food Frequency Questionnaire
A semi-quantitative FFQ ascertaining usual diet during the previous year was specially designed
for the program to estimate average daily intakes of dietary beta-carotene and retinol. The FFQ
was posted to study candidates to complete at home and was checked for completeness at their
induction interview. This questionnaire was administered to all participants enrolling in the
program up until the end of 1996.
The 45 foods (23 fruit and vegetables) included in the FFQ were chosen using a ranking
analysis of 7-day diet records from 60 control subjects participating in a local case-control study
of renal calculus disease (unpublished data). The ranking criteria were based upon the food’s
carotene and retinol content, its ability to discriminate these intakes, and other nutritional
significance e.g. cruciferous vegetables. More detail on the FFQ and agreement between
estimates of carotene and retinol intakes and a 28-day diet record have been reported in detail
elsewhere (19).

100
The size of a medium serve of each food was specified in the FFQ, and subjects were asked to
record their usual serve size as small, medium or large, in relation to this quantity. Serve sizes
were derived from those reported in the renal calculus study. There were eight options for the
frequency of consumption ranging from ‘never or less than once per month’ up to ‘2 or more
times per day’. The consumption of fruits and vegetables was collected separately for summer
and winter.
Follow Up
All program participants were followed up for incident prostate cancer diagnosed after enrolment
in the program up until December 31st 2004, or date of death, which ever occurred first.
Prostate cancer cases were identified via record linkage with the Western Australian Cancer
Registry and the Australian National Cancer Statistics Clearing House. Cancer registration by
pathology laboratories is mandatory in Australia and these cancers were
histologically-confirmed cases classified according to the second edition of the International
Classification of Diseases for Oncology.
Statistical Analysis
FFQ responses were standardised to a medium serve (e.g. small serve = ½ medium serve,
large serve = 1.5 medium serve) before average serves consumed per day or week were
calculated for each FFQ item. Total daily fruit and vegetable intake was calculated as the sum of
all medium (standardised) fruit and vegetable serves consumed per day. This was truncated to
a maximum of 10 serves per day, to reduce the effect of probable incorrect values (20). Less
than 1% of respondents reported either total fruit or total vegetable intake greater than 10
serves per day. Weekly intakes of the following groups of fruit and vegetables were calculated:
carotene-rich vegetables (carrot, sweet potato, pumpkin, bell peppers), carotene-rich fruits
(peaches, apricots, rockmelon), vitamin C-rich fruit (fresh oranges, orange juice, rockmelon) and
vitamin C-rich vegetables (peppers, broccoli, spinach). Intake of cooked tomato was estimated
by summing weekly serves of tomato sauce (with and without meat), and pizza. Raw tomato
intake included fresh tomato and tomato juice. Individual fruit and vegetable intakes were also
examined, but only those of interest are reported for brevity. As the FFQ was designed to
estimate beta-carotene (beta-carotene equivalents) and retinol intakes, we also examined

101
prostate cancer risk according to these nutrients. Intakes of beta-carotene and retinol were
estimated using Australian Food Composition Tables (21).
Prostate cancer risk was analysed with Cox proportional hazards models using Stata software
version 9.0 (22). Dietary intakes were analysed as tertiles created using the ‘xtile’ command in
Stata. It was not possible to adjust for energy intakes in our analyses, as the FFQ was not
designed to estimate total energy intake. However, the intakes of interest generally have low
correlations with energy intake. Each model was adjusted for total fruit and vegetable
consumption (serves/day) to determine whether associations between specific fruit or
vegetables and prostate cancer risk were independent of overall fruit and vegetable intake. The
following potential confounders (measured at baseline) were investigated: age, body mass
index (BMI), source of asbestos exposure and smoking status (previous smoker, current
smoker or never smoked). To control for randomly assigned vitamin A supplements, an
intention-to-treat analysis was conducted, whereby each subject was analysed according to the
original supplement assigned to them at entry to the program. The level for significance was set
to 5% for all statistical tests.
All participants gave their informed consent, and this study was approved by the University of
Western Australia’s Human Research Ethics Committee and the Clinical Drug Trials Committee
of the Sir Charles Gairdner Hospital.
Results
A total of 2,183 men enrolled in the program prior to the end of 1996. Of the 1,985 (91%) who
completed an FFQ, 49% were former Wittenoom workers, 17% were former Wittenoom
residents and 34% were exposed to asbestos elsewhere. During a median of 12.7 years of
follow-up, 441 men died, 97 incident cases of prostate cancer were identified, and 35 men were
lost to follow up (could not be traced). Prostate cancer cases were older than non-cases at
baseline (p<0.0001), were less likely to be former Wittenoom residents (p=0.001), and were
more likely to have been exposed to blue asbestos in occupations outside Wittenoom (p=0.005)
(Table 8). As dietary intakes were skewed, Mann-Whitney tests were used to compare median
dietary intakes for cases and non-cases (Table 8). There were no differences in total fruit and

102
vegetable intake, but cases had significantly lower median intakes of cooked tomato, broccoli
and bell peppers. Estimated beta-carotene and retinol intakes did not differ between cases and
non-cases.
In multivariate analyses, age (RR=1.06, 95% CI, 1.04-1.09 per year) and source of asbestos
exposure were significantly associated with prostate cancer risk. Men exposed to asbestos
outside of Wittenoom were at greater risk (RR=2.03, 95% CI 1.22-3.36) than former workers
from Wittenoom. Body mass index, smoking status, and randomly assigned vitamin A
supplement were not predictors of prostate cancer risk.
After adjusting for age, source of asbestos exposure and randomly assigned vitamin A
supplement, total fruit and vegetable intakes were not related to prostate cancer risk (Table 9).
With increasing intakes of vitamin C-rich vegetables, i.e. peppers, broccoli and spinach, the risk
of prostate cancer tended to decrease (p for trend=0.056). For men in the highest tertile of
vitamin C-rich vegetable intake (>4 serves/week; 1 serve equivalent to ½ cup), the RR was 0.53
(95% CI, 0.29 - 0.99). No association was observed between prostate cancer risk and intake of
vitamin C rich fruit, or other groups of fruit and vegetables.
We also analysed individual fruit and vegetable intakes that were used in grouped analyses
(Table 9). None of the fruits examined were associated with prostate cancer risk (not shown).
Two vegetables from the vitamin-C rich group showed inverse relationships with prostate cancer
risk. A trend was observed across tertiles of bell pepper intake (p=0.007), with men in the
highest tertile (>1.5 serves per week; 1 serve equal to ½ cup) having a RR of 0.46 (95% CI,
0.25-0.85) . A decreased risk was suggested for men in the highest tertile of broccoli intake
(>1.5 serves/week; 1 serve equivalent to ½ cup), with a RR of 0.56 (95% CI, 0.31-1.02, p for
trend=0.056). Although cases had significantly lower median intakes of cooked tomato (Table
8), multivariate analyses showed a non-significantly decreased prostate cancer risk in the
highest tertile of cooked tomato intake (RR=0.67, 95% CI, 0.38-1.16; p for trend=0.134). Intake
of raw tomato was not associated with prostate cancer risk, nor was dietary beta-carotene or
retinol intake (Table 9).

103
Table 8. Characteristics of cases and non-cases at entry to the study.
Cases (n=97) Non-cases (n=1888) P- value 2 Median IQR 1 Median IQR 1 Age (years) 62.6 59.2 - 66.2 54.7 47.5 - 62.4 0.000 Body Mass Index (kg/m2) 27.4 24.6 - 30.8 27.2 24.8 - 29.8 0.478 Total fruit & vegetables (serves/day) 4.0 2.7 - 5.9 4.0 2.7 - 5.9 0.852 Total vegetables (serves/day) 2.1 1.4 - 3.2 2.1 1.4 - 3.1 0.826 Total fruit (serves/day) 1.5 0.8 - 2.7 1.7 0.8 - 2.8 0.784 Carotene-rich fruit (serves/week) 1.3 0.5 - 3.8 1.4 0.4 - 3.5 0.587 Carotene-rich vegetables (serves/week) 5.8 3.3 - 9.2 5.5 3.0 - 9.0 0.708 Vitamin C-rich fruit (serves/week) 3.2 1.0 - 7.0 3.5 1.2 - 7.3 0.512 Vitamin C-rich vegetables (serves/week) 2.0 0.8 - 3.8 2.5 0.9 - 5.0 0.126 Cooked tomato (serves/week) 0.7 0.2 - 2.1 1.3 0.3 - 2.7 0.001 Raw tomato (serves/week) 2.5 1.5 - 5.4 3.0 1.5 - 5.2 0.975 Broccoli (serves/week) 0.6 0 - 1.5 0.8 0.1 - 1.7 0.040 Bell Peppers (serves/week) 0.2 0 - 1.5 0.4 0 - 1.5 0.037 Dietary beta-carotene (ug/day) 3994 2 389 – 5 777 3531 2 222 – 5 295 0.535 Dietary retinol (ug/day) 156 95.3 - 274.4 166 103 - 293 0.530 N % N % P-value3 Source of Exposure
Former Wittenoom Worker 47 48.5 927 49.1 0.909 Former Wittenoom Resident 4 4.1 326 17.3 0.001 Other Worker Exposed to Crocidolite 46 47.4 635 33.6 0.005
Smoking Status Never Smoked 4 24 24.7 447 23.7 0.810 Former Smoker 4 60 61.9 1021 54.1 0.134 Current Smoker 4 13 13.4 415 22.0 0.045
1 IQR, interquartile range; 2 P-value for Mann-Whitney test; 3 P-value for chi-squared test; 4 5 non-cases had missing smoking data

104
Table 9. Dietary intakes at entry to the study and risk of prostate cancer 1
Tertiles of Intake 2 Trend test 1 2 3 P-value
Total fruit & veg N cases (non cases)
serves per day RR
95% CI
37 (612) 0 - 3 1.0
27 (631) >3- 5 0.69 0.42 - 1.13
33 (645) >5 0.81 0.51 - 1.30
0.388
Total vegetables
N cases (non cases) serves per day
RR 95 % CI
35 (609) 0 - 1.6 1.0
31 (636) >1.6 - 2.8 0.80 0.46 - 1.38
31 (643) >2.8 0.73 0.38 - 1.40
0.350
Total fruit
N cases (non cases) serves per day
RR 95 % CI
30 (635) 0 - 1 1.0
35 (619) >1 - 2.3 1.08 0.62 - 1.87
32 (634) >2.3 0.94 0.46 - 1.89
0.848
Carotene-rich veg
N cases (non cases) serves per week
RR 95 % CI
31 (631) 0 - 3.7 1.0
31 (628) >3.7 - 7.6 1.04 0.59 - 1.83
35 (629) >7.6 1.11 0.56 - 2.20
0.753
Carotene-rich fruit N cases (non cases)
serves per week RR
95 % CI
34 (690) 0 - 0.8 1.0
30 (606) >0.8 - 2.6 1.04 0.62 - 1.77
33 (592) >2.6 1.14 0.63 - 2.04
0.667
Vit C-rich fruit
N cases (non cases) serves/week
RR 95% CI
35 (639) 0 - 1.8 1.0
27 (606) >1.8 - 5.7 1.06 0.60 - 1.88
35 (643) >5.7 1.38 0.74 - 2.61
0.301
Vit C-rich veg
N cases (non cases) serves/week
RR 95% CI
39 (694) 0 -1.5 1.0
35 (569) >1.5 - 4.0 0.94 0.58 - 1.53
23 (625) >4.0 0.53 0.29 - 0.99
0.056
Broccoli N cases (non cases)
serves per week RR
95 % CI
44 (698) 0 - 0.3 1.0
34 (671) >0.3 - 1.5 0.80 0.50 - 1.26
19 (519) >1.5 0.56 0.31 - 1.02
0.056
Peppers
N cases (non cases) serves/week
RR 95 % CI
46 (644) 0 - 0.1 1.0
35 (781) >0.1 - 1.5 0.65 0.41 - 1.01
16 (463) >1.5 0.46 0.25 - 0.85
0.007

105
Table 9. Dietary intakes at entry to the study and risk of prostate cancer, cont’d 1.
Tertiles of Intake 2 Trend test 1 2 3 P-value
Cooked Tomato N cases (non cases)
serves per week RR
95 % CI
44 (618) 0 - 0.6 1.0
33 (674) >0.6 - 2.2 0.78 0.50 - 1.24
20 (596) >2.2 0.67 0.38 - 1.16
0.134
Raw Tomato
N cases (non cases) serves per week
RR 95 % CI
34 (659) 0 - 1.7 1.0 0.62 - 1.73
30 (621) >1.7 - 4.1 1.04 0.62 - 1.73
33 (608) >4.1 1.04 0.60 - 1.80
0.885
Beta-carotene3
N cases (non cases) mg per day
RR 95 % CI
28 (604) 0.1 - 2.6 1.0
34 (600) >2.6 - 4.6 1.19 0.72 - 1.97
31 (607) >4.6 0.96 0.58 - 1.61
0.869
Retinol
N cases (non cases) ug per day
RR 95 % CI
34 (561) 0.1 - 117 1.0
28 (622) >117 - 215 0.80 0.48 - 1.30
31 (628) >215 0.85 0.52 - 1.39
0.520
1 All models were adjusted for age, total fruit and vegetable intake (except beta-carotene and retinol models), randomly assigned retinol or beta-carotene supplement and source of crocidolite exposure.
2 Due to discrete portion sizes in the FFQ, distributions are not continuous and tertile groups
are of variable size. 3 Measured as beta-carotene equivalents in the Australian Food Composition Tables (21).

106
Discussion
This study has found that prostate cancer risk does not appear to be strongly associated with
the intake of beta-carotene, retinol, fruits or vegetables, except possibly with vitamin C-rich
vegetables such as bell peppers and broccoli. Vitamin C is a strong antioxidant that has been
shown to inhibit prostate cancer cell growth in-vitro (12) however, a protective effect from
increased vitamin C intakes against prostate cancer has not been consistently demonstrated in
epidemiological studies (23-26). Furthermore, no effect from vitamin C-rich fruit was observed
in this study, even though the bioavailability of vitamin C is usually higher in fruit, due to it being
eaten most often raw, rather than cooked.
No association was observed between carotene-rich fruit, carotene-rich vegetables or
beta-carotene intake and prostate cancer in this study. A 2004 review of dietary intake and
prostate cancer concluded that there was no evidence that dietary carotenoids, apart from
lycopene and others found in tomato, are associated with prostate cancer risk (27). However,
the Health Professionals Follow Up Study has since published significant inverse associations
between beta-carotene plasma/diet scores and prostate cancer risk in men aged under 65 years
(28), and a multi-centred case-control study in Italy reported a significant inverse relationship
between dietary beta-carotene and prostate cancer risk (29). Like other studies, our findings do
not support a protective role for retinol in prostate cancer (27).
There is reasonably consistent evidence that broccoli offers anticarcinogenic effects as a
Brassica (cruciferous) vegetable. An epidemiological review published in 2002 concluded there
was modest support that high intakes of Brassica vegetables reduce prostate cancer risk (30).
More recently, the Health Professionals Follow-Up Study reported significantly decreased risks
for prostate cancer with increasing cruciferous vegetable intakes among men who had a
prostate-specific antigen test (4). However, the European Prospective Investigation into Cancer
and Nutrition (EPIC) which included over 1000 cases in a cohort of over 130,000 men sourced
from 7 European countries, reported no association in 2004 (3),
107
This study found no effect on prostate cancer risk with increased total fruit or vegetable intakes,
or both combined. Generally, fruit intake has not been associated with prostate cancer risk (3).
Small benefits from increased total vegetable consumption have been reported by several
studies (2, 5, 7, 24, 31) but not supported by others (8, 9). In particular, no associations were
found in the large EPIC cohort (3). Our findings suggest that intakes of particular vegetable
types may be more important than total vegetable intake for the prevention of prostate cancer.
Modest epidemiological evidence supports a protective effect from high intake of cooked tomato
against prostate cancer (27, 32, 33), although this remains a controversial area (34). A
protective effect has generally been attributed to lycopene which is more bioavailable from
cooked tomato than from raw tomato (33). One other cohort study has reported a RR of 0.77
(95% CI, 0.66-0.90) for men consuming high intakes (at least two serves per week) of cooked
tomato,(35) and odds ratios for case-control studies are in the range of 0.46 to 0.94 (33). Our
RR of 0.67 for high intake of cooked tomato (>1.8 serves/week) is of similar magnitude,
although possibly not significant due to having a smaller sample size.
The fruit and vegetables included in the FFQ used in this study were selected because of their
contribution to usual vitamin A intakes in the study population. Therefore ‘total fruit and
vegetable’ intakes analysed in this paper may not be directly comparable to typical definitions of
total fruit and vegetable intakes. These commonly include contributions from a wider range of
fruit and vegetables, as well as potato intake, which contributes to at least 40% of vegetable
intake in Australia (36). Therefore, total serves of fruit and vegetables and serves of fruit and
vegetable groups may have been under-estimated or misclassified by our FFQ, possibly
explaining the lack of significant associations observed for these. However, there is no reason
to believe that estimates of individual vegetable intakes (e.g. broccoli) would have been affected
by the questionnaire design.
Repeated assessments of dietary intake might have improved this study, especially given that
subjects were taking part in a cancer prevention program. Participation in the program could
have affected subsequent dietary behaviour in this cohort, and led to a reduction in cancer risk
during the follow up period.

108
We observed that prostate cancer risk was greater for those men in this study who had not
worked at Wittenoom but experienced asbestos exposure in jobs elsewhere. We are currently
extracting occupational histories for all men in this study so that we may examine prostate
cancer risk according to various occupational exposures. In future it will also be possible to
study other lifestyle factors such as physical activity, which could explain the increased risk
among other asbestos workers.
Although our results are consistent with other studies, careful interpretation is needed, as some
of the results may have arisen by chance due to the number of statistical tests carried out.
However, this study does benefit from more than twelve years of follow up after dietary
assessment and the matching of subjects with national cancer records. The cohort design of
the study was advantageous for reducing recall bias, particularly as the main focus was
mesothelioma and lung cancer, not prostate cancer.
Prostate cancer risk in this study does not appear to be strongly associated with the intake of
beta-carotene, retinol, fruits or vegetables, except possibly with vitamin C-rich vegetables such
as peppers and broccoli. Although the association with cooked tomatoes was not significant, it
was consistent with earlier reports.
Acknowledgements
Funds for this study were provided by the Western Australian (WA) Cancer Council, the WA
Department of Health, the WA Workers’ Compensation and Rehabilitation Commission, Iain and
Penny MacGregor, and the Australian National Health and Medical Research Council. The
authors are grateful for research assistance provided by Nola Olsen, Lynne Defrenne, Jan
Sleith, Naomi Hammond, and Barbara Telfer, and data management provided by Philip
Etherington.

109
References
1. Bosetti C, Tzonou A, Lagiou P, Negri E, Trichopoulos D, Hsieh CC. Fraction of prostate
cancer incidence attributed to diet in Athens, Greece. Eur J Cancer Prev. 2000;9:119-23.
2. Bosetti C, Micelotta S, Dal Maso L, Talamini R, Montella M, Negri E, et al. Food groups
and risk of prostate cancer in Italy. Int J Cancer. 2004;110:424-8.
3. Key TJ, Allen N, Appleby P, Overvad K, Tjonneland A, Miller A, et al. Fruits and
vegetables and prostate cancer: No association among 1104 cases in a prospective
study of 130544 men in the European Prospective Investigation into Cancer and Nutrition
(EPIC). Int J Cancer. 2004 Mar10;109:119-24.
4. Giovannucci E, Rimm EB, Liu Y, Stampfer MJ, Willett WC. A prospective study of
cruciferous vegetables and prostate cancer. Cancer Epidemiol Biomarkers Prev.
2003;12:1403-9.
5. Cohen JH, Kristal AR, Stanford JL. Fruit and vegetable intakes and prostate cancer risk.
JNCI. 2000;92:61-8.
6. Norrish AE, Jackson RT, Sharpe SJ, Skeaff CM. Prostate cancer and dietary carotenoids.
Am J Epidemiol. 2000;151(2):119-23.
7. Kolonel LN, Hankin JH, Whittemore AS, Wu AH, Gallagher RP, Wilkens L, et al.
Vegetables, fruits, legumes and prostate cancer: a multiethnic case-control study. Cancer
Epidemiol Biomarkers Prev. 2000;9:795-804.
8. Schuurman AG, Goldbohm RA, Dorant E, Vandenbrandt PA. Vegetable and fruit
consumption and prostate cancer risk - a cohort study in the Netherlands. Cancer
Epidemiol Biomarkers Prev. 1998;7:673-80.
9. Tzonou A, Signorello LB, Lagiou P, Wuu J, Trichopoulos D, Trichopoulos A. Diet and
cancer of the prostate: A case-control study in Greece. Int J Cancer. 1999;80(5):704-8.
10. Report of the Working Group on Diet and Cancer of the Committee on Medical Aspects of
Food and Nutrition Policy (COMA). Department of Health Report on Health and Social
Subjects Vol 48 - Nutritional Aspects of the Development of Cancer. Norwich: Her
Majesty's Stationery Office; 1998.
11. World Cancer Research Fund (WCRF) and American Institute for Cancer Research
(AICR). Food, nutrition and the prevention of cancer: a global perspective. Washington,
DC: American Institute for Cancer Research; 1997.

110
12. Willis MS, Wians FH. The role of nutrition in preventing prostate cancer: A review of the
proposed mechanism of action of various dietary substances. Clin Chim Acta.
2003;330:57-83.
13. Musk A, de Klerk N, JL E, Hobbs M, Armstrong B, Layman L, et al. Wittenoom Western
Australia: a modern industrial disaster. Am J Industr Med. 1992;21:735-47.
14. de Klerk NH, Musk AW, Armstrong BK, Hobbs MST. Diseases in miners and millers of
crocidolite from Wittenoom, Western Australia: a further follow-up to December 1986. Ann
Occup Hyg. 1994;38(Suppl 1):S647-S55.
15. Hansen J, de Klerk NH, Musk AW, Eccles JL, Hobbs MST. Mesothelioma after
environmental crocidolite exposure. Ann Occup Hyg. 1997;41(S1):189-93.
16. Musk AW, de Klerk NH, Ambrosini GL, Eccles JL, Hansen J, Olsen NJ, et al. Vitamin A
and cancer prevention I: observations in workers previously exposed to asbestos at
Wittenoom, Western Australia. Int J Cancer. 1998;75:335-61.
17. Omenn G, Goodman G, Thornquist M, Balmes J, Cullen M, Glass A, et al. Effects of a
combination of beta-carotene and vitamin A on lung cancer and cardiovascular disease.
N Engl J Med. 1996;334:1150-5.
18. Albanes D, Heinonen OP, Huttunen JK, Taylor PR, Virtamo J, Edwards BK, et al. Effects
of alpha-tocopherol and beta-carotene supplements on cancer incidence in the Alpha-
Tocopherol Beta-Carotene Cancer Prevention Study. Am J Clin Nutr. 1995;62(6 Suppl
S):S1427-S30.
19. Ambrosini GL, de Klerk NH, Musk AW, Mackerras D. Agreement between a brief food
frequency questionnaire and diet records using two statistical methods. Public Health
Nutr. 2001;4:255-64.
20. Michels K, Giovannucci E, Joshipura K, Rosner B, Stampfer M, Fuchs C, et al.
Prospective study of fruit and vegetable consumption and incidence of colon and rectal
cancers. JNCI. 2000;92:1740-52.
21. Food Standards Australia and New Zealand. NUTTAB91-92. [Database] 1992. Canberra:
Commonwealth Government of Australia.
22. Stata Corp. Intercooled Stata 9.0 for Windows. 9.0 ed. College Station: StataCorp LP;
2005.

111
23. Schuurman A, Goldbohm R, Brants H, van den Brandt P. A prospective cohort study of
intake of retinol, vitamin c and e, and carotenoids and prostate cancer risk (Netherlands).
Cancer Causes Control. 2002;13:573-82.
24. Deneo-Pellegrini H, De Stefani E, Ronco A, Mendilaharsu M. Foods, nutrients and
prostate cancer: A case-control study in Uruguay. Br J Cancer. 1999;80:591-7.
25. Kristal AR, Stanford JL, Cohen JH, Wicklund K, Patterson RE. Vitamin and mineral
supplement use is associated with reduced risk of prostate cancer. Cancer Epidemiol
Biomarkers Prev. 1999 October 1, 1999;8:887-92.
26. Daviglus ML, Dyer AR, Persky V, Chavez N, Drum M, Goldberg J, et al. Dietary
beta-carotene, vitamin C, and the risk of prostate cancer: results from the Western
Electric Study. Epidemiology. 1997;7:472-7.
27. Kristal AR. Vitamin A, retinoids and carotenoids as chemopreventive agents for prostate
cancer. J Urol. 2004;171:S54-S8.
28. Wu K, Erdman JW, Jr., Schwartz SJ, Platz EA, Leitzmann M, Clinton SK, et al. Plasma
and dietary carotenoids, and the risk of prostate cancer: A nested case-control study.
Cancer Epidemiol Biomarkers Prev. 2004 February 1, 2004;13:260-9.
29. Bosetti C, Talamini R, Montella M, Negri E, Conti E, Franceschi S, et al. Retinol,
carotenoids and the risk of prostate cancer: a case-control study from Italy. Int J Cancer.
2004 Nov 20;112:689.
30. Kristal AR, Lampe JW. Brassica vegetables and prostate cancer risk: A review of the
epidemiological evidence. Nutr Cancer. 2002;42(1):1-9.
31. Hodge AM, English DR, McCredie MRE, Severi G, Boyle P, Hopper JL, et al. Foods,
nutrients and prostate cancer. Cancer Causes Control. 2004;15:11-20.
32. Chan JM, Gann PH, Giovannucci EL. Role of diet in prostate cancer development and
progression. J Clin Oncol. 2005 Nov 10;23:8152-60.
33. Etminan M, Takkouche B, Caamano-Isorna F. The role of tomato products and lycopene
in the prevention of prostate cancer: a meta-analysis of observational studies. Cancer
Epidemiol Biomarkers Prev. 2004;13:340-5.
34. Giovannucci E. Tomato products, lycopene, and prostate cancer: A review of the
epidemiological literature. J Nutr. 2005 Aug;135:2030S-1S.
35. Giovannucci E, Rimm E, Liu Y, Stampfer M, Willet W. A prospective study of tomato
products, lycopene, and prostate cancer risk. JNCI. 2002;94:391-8.

112
36. Australian Bureau of Statistics (ABS). Report No. 4306.0. Apparent consumption of
foodstuffs 1997-98 and 1999-99. Canberra: Australian Bureau of Statistics; 2000.
113
Paper 2
The reliability of ten-year dietary recall: implica tions for
cancer research
Gina L Ambrosini,1 Sofie AH van Roosbroeck,1 Dorothy Mackerras,2 Lin Fritschi,1 Nicholas H de
Klerk,1 A William Musk 1, 3.
1 School of Population Health, University of Western Australia
2 Menzies School of Health Research, Northern Territory, Australia
3 Department of Respiratory Medicine, Sir Charles Gairdner Hospital, Western Australia.
The identical published version of this manuscript can be found in Appendix 3:
Ambrosini GL, van Roosbroeck SAH, Mackerras D, Fritschi L, de Klerk NH and Musk AW. The
reliability of ten-year dietary recall: implications for cancer research. Journal of Nutrition 2003;
133:2663-2668.
The FFQ used in this study can be found in Appendix 4.
Note that after the publication of this paper, the Anti-Cancer Council of Victoria (referred to in
this manuscript) changed its name to the Cancer Council of Victoria.

114
Abstract
Remote dietary intakes may be more important than recent diet in the etiology of cancer
because of the long latency in cancer development. We examined the reliability of remote
dietary recall over ten years. Subjects were 56 adults participating in a cancer prevention trial in
Western Australia. All subjects completed a 28 day diet record (DR) in 1991. A food frequency
questionnaire (FFQ) modified to ask respondents about their diet 10 years earlier was sent to
each subject for completion in 2001. Remote intakes recalled from ten years earlier using the
FFQ were compared to the DR using the limits of agreement (LOA) method and Pearson
correlation coefficients. Mean intakes of most nutrients were similar for both dietary methods.
The LOA indicated that the FFQ could under- or over-estimate DR estimates by 50% or more.
For many nutrients, agreement between methods depended on the magnitude of intake.
Pearson’s correlation coefficients ranged from 0.02 for retinol to 0.66 for alcohol. These
findings are similar to other studies that have examined the reliability of recent and remote
dietary intakes. They also show that using this FFQ, remote diet recalled from ten years earlier
may be as reliable as recent dietary recall.

115
Introduction
When studying the nutritional determinants of cancer and other chronic illness, remote dietary
intake (from many years in the past) may be more important than recent diet because of the
long latency of these diseases. It is possible that weak associations have been observed in
many studies of diet and cancer because most have depended on estimates of recent diet, and
have possibly underestimated the true effect of diet because of misclassification of intake.
Recent or current dietary intake is not thought to be a reliable predictor of past intake (1), and
dietary habits change significantly with advancing age (2). This is pertinent to cancer
epidemiology, as estimates of recent diet from older people, whom the majority of cancers
affect, are therefore unlikely to reflect the diet consumed over most of their adult life. Similarly,
people diagnosed with cancer may be prone to change their diet, so their estimates of recent
diet may also be less likely to reflect past diet. Thus, the reliability of remote dietary recall is of
considerable interest in cancer epidemiology. To investigate this, we compared dietary intakes
recalled from ten years earlier using a modified food frequency questionnaire in 2001, with
intakes from a diet record collected in 1991. Although this type of study is commonly referred to
as a validation study, it is more correctly described as an intermethod reliability study (3).
Subjects and Methods
Study population
Subjects were recruited from a cancer prevention trial examining the efficacy of β-carotene and
retinol supplements in reducing the risk of mesothelioma after asbestos exposure (4). Trial
participants were 3240 healthy people aged 8 to 87 years (80% men) recruited from two large
cohorts of former workers and residents of a blue asbestos mining and milling town in Western
Australia (4). All participants gave their informed consent, and the trial was approved by the
Human Research Ethics Committee of the University of Western Australia and the Clinical Drug
Trials Committee of the Sir Charles Gairdner Hospital, Nedlands, Western Australia. The
reliability study was approved by the Human Research Ethics Committee of the University of
Western Australia.

116
Diet records
All subjects joining the trial during December 1990 were asked during their enrolment interview
if they would provide four 7 day diet records (DR) over the following year, except subjects with
apparent language or literacy difficulties. Those who agreed were shown how to record
everything consumed for seven consecutive days using household units (not weights). One 7
day DR was completed in December 1990 and then in April, July and October of 1991.
Participants were followed up by telephone two wk after each commencement date to set a date
for person to person checking of their DR. All DR were entered into a database by the same
nutritionist (GLA) using Diet1 nutrient analysis software (5) and linked with Australian Food
Composition Tables (6) to calculate daily nutrient intakes.
Food frequency questionnaire
The semi-quantitative food frequency questionnaire (FFQ) was developed by the Anti-Cancer
Council of Victoria (ACCV) Australia for use in the ethnically diverse Australian population (7). It
includes 74 food items and 3 questions on alcohol intake, with 10 frequency options for each,
ranging from ‘never’ to ‘3 or more times daily’. Respondents are asked to nominate usual
portion sizes from a series of photographs in the FFQ. Information is also collected on types of
milk, bread, spread and cheese consumed, the number of pieces of fresh fruit and how many
different vegetables are usually consumed daily.
We modified the FFQ to ask respondents to recall their usual dietary intake from ten years
earlier, rather than over the past year (Appendix 4). In July of 2001, the modified FFQ was
posted to all surviving subjects who had provided four 7 day DR during 1990 and 1991. A
covering letter explained how to complete the questionnaire. Respondents were encouraged to
think about where they lived and their job ten years ago to assist dietary recall. Any missing
values were followed up with the participant by telephone. Completed questionnaires were sent
to the ACCV for computerised scanning of responses and the calculation of daily nutrient
intakes using Australian Food Composition Tables (8).

117
Internal validity
Energy intakes from both dietary methods were checked for extreme values. We utilised limits
used by the ACCV (personal communication, A. Hodge, ACCV) and others (9), where energy
intakes less than 3,000 kJ or above 21,000 kJ were considered implausible.
Subjects who completed the FFQ in 2001 were compared to those who failed to complete the
FFQ and other trial participants who did not participate in the reliability study i.e. those invited
but who declined. Reliability study subjects who died after completing their DR and before July
2001 were not included in this comparison. Gender, smoking status and use of vitamin A
supplements in addition to the trial supplement at entry to the trial were compared using chi-
square and Fisher's exact tests. Mean age, body mass index and alcohol intake at entry to the
trial were compared using t-tests.
Limits of agreement
Although correlation coefficients are often used to compare two different methods, they can be
misleading, since the correlation coefficient expresses the strength of a linear relationship
between two variables, but not the agreement between them (10, 11). It has been shown that
highly correlated data, including dietary intakes, may not actually agree (12, 13).
To examine agreement in this study, we used the limits of agreement (LOA) method
recommended by Bland and Altman (12, 14). All nutrient intakes were first transformed to their
natural logarithms. For each subject, the difference between nutrient intakes from each method
was then calculated, e.g. FFQ(energy)–DR(energy). The mean difference and its standard
deviation (SDdiff) were calculated for each nutrient. The mean difference represents mean
agreement between methods for the study population. The 95% LOA provide an interval within
which 95% of all individual differences between methods are expected to lie. These were
estimated for each nutrient by calculating: mean agreement ± (1.96 x SDdiff). For each nutrient
we plotted the differences between methods against the mean of the two to detect any
variations in level of agreement. This was formally tested by fitting the regression line of
differences. A significant slope in the regression line (Ho: β=0, α=0.05) indicated that
agreement varied according to the magnitude of intake.

118
Because dietary intakes were log transformed, antilogging was necessary to interpret
agreement. Antilogging mean agreement, the LOA, and their 95% confidence limits results in
ratios, i.e. a multiple of the FFQ relative to the DR (14). All were expressed as a percentage,
with 100% indicating exact agreement. For example, mean agreement of 120% indicates that
on average, FFQ estimates for that nutrient were 1.2 times the DR estimate. LOA of 50-200 %
indicate that 95% of all subjects’ FFQ estimates were between one-half and two times their DR
estimate.
Using the LOA method, levels of acceptable agreement are arbitrary, but should reflect the
required sensitivity of a measure or method (14). We classified agreement between the FFQ
and DR as being acceptable when (i) the LOA were between 50 and 200% and (ii) there was a
lack of dependency between agreement and the magnitude of intake, i.e. the slope in the
regression line of differences was not significantly different from zero. Although we (13) and
others (10, 11) have argued against its use, we also calculated Pearson's correlation
coefficients between methods to enable comparisons with other studies that have not used the
LOA method.
Results
During December of 1990, 569 people enrolled in the Vitamin A Program. One hundred and
eighteen (21%) agreed to provide four 7 day DR over the following year, of which 83 (70%)
completed all four DR. Fifty six of these (68%) went on to complete the FFQ in July 2001 (19
women and 37 men). One person was excluded as his FFQ intake was over 21,000
kilojoules/day. Twelve subjects died after completing their DR and before the FFQ could be sent
to them. Four subjects refused to complete the FFQ, eight were noncompliant, two reported
that they were unable to recall past diet, and one could not be traced.
After adjusting for gender, no differences were found in mean age, body mass index, alcohol
intake or supplement use, between reliability and trial subjects (Table 10). Statistical
comparisons of smoking habits were hampered by the small numbers in each category. The
proportion of subjects who had never smoked was higher in reliability subjects for men (p=0.03)
and probably women also (p=0.16) (Table 10). The proportion of previous smokers was also

119
Table 10. Baseline characteristics of reliability study and other trial subjects, December 1990.1
1 values are means ± SD or % 2 Reliability subjects; includes subjects who completed diet records in 1990/91 and the food frequency questionnaire (FFQ) in 2001. 3 Trial subjects; includes trial subjects who did not agree to complete diet records in 1990/91 and reliability subjects who did not complete the FFQ in 2001
Women Men
Reliability Subjects 2
Trial Subjects 3
p value
Reliability Subjects 2
Trial Subjects 3
p value
N (%) 19 (34) 112 (22) 0.05 37 (66) 389 (78) 0.05
Age, years 49 ± 10.5 50 ± 13.3 0.88 53 ± 8.3 54 ± 11.0 0.42
Body mass index 28 ± 5.0 27 ± 4.9 0.32 27 ± 4.8 28 ± 4.3 0.49
Alcohol, g/d 5.3 ± 8.4 4.2 ± 6.2 0.46 24.5 ± 29.0 22.7 ± 27.5 0.67
Smoking status, %
Never 68 51 0.16 38 22 0.03
Previous 16 29 0.22 35 50 0.07
Current 16 20 0.69 27 28 0.93
Cigarettes smoked, n/d 28 ± 12.3 17 ± 8.0 0.62 11 ± 8.2 15 ± 9.1 0.28
Supplement use, % 11 13 0.29 5 9 0.22

120
lower among reliability subjects (Table 10). The proportion of current smokers was similar, but
female reliability subjects smoked more cigarettes per day than female trial subjects (Table 10).
Most mean intakes for the FFQ and the DR including percent of energy obtained from
carbohydrates and fat did not differ greatly between methods (Table 11). However, mean
intakes for carotene, retinol, retinol equivalents and potassium were significantly lower, and
calcium, thiamine, riboflavin and phosphorus intakes significantly higher, when estimated by the
FFQ.
The mean agreement between methods (i.e. FFQ relative to the DR) ranged from 66% for
carotene to 130% for riboflavin (Table 12). Mean agreement was not significantly different from
100% for most nutrients excepting alcohol, calcium, carotene, potassium, retinol equivalents,
riboflavin and thiamine (Table 12).
The LOA showed that for most nutrients, the FFQ could under- or over-estimate DR estimates
by 50% or more (Table 12). For example, the LOA for energy are 55 and 178%, meaning that
95% of the subjects in this study sample had an FFQ estimate for energy that was between
55% (underestimating by 45%) and 178% (overestimating by 78%) of their corresponding DR
estimate. Particularly wide LOA were observed for alcohol, carotene, cholesterol, retinol, and
retinol equivalents. In contrast, the LOA were narrowest for percent of energy from
carbohydrates and fat.
Even after log transformation of the data, agreement depended on magnitude of intake for 11 of
the 29 nutrients assessed: niacin, niacin equivalents, phosphorous, potassium, protein, retinol,
retinol equivalents, saturated fat, sodium, vitamin C and zinc (p<0.05). For all of these except
retinol and retinol equivalents, the slope of the regression line of differences was positive,
meaning that the FFQ increasingly over-estimated intakes as overall intake increased (Table
12). The negative slopes observed for retinol (Figure 20) and retinol equivalents indicate that
the FFQ significantly underestimated retinol intakes when higher levels of intake were reported.
For all remaining nutrients, agreement was independent of intake (see Fiber in Figure 21).
Pearson's correlation coefficients ranged from 0.02 for retinol equivalents to 0.66 for alcohol
(Table 12). Moderate Pearson's correlations were observed for sodium (0.56), protein (0.48),

121
saturated fat (0.47), zinc (0.46), polyunsaturated fat (0.45) and vitamin C (0.43), yet all of these
(in addition to alcohol) exhibited a dependency between agreement and magnitude of intake,
and/or very wide LOA.
Table 11. Nutrient intakes estimated by the diet record and FFQ completed 10 y later1
Diet Record FFQ p
value2
Alcohol, g/d 17 ± 20 (0 - 97) 19 ± 18 (0 - 73) 0.34
Calcium, mg/d 753 ± 229 (329 - 1437) 900 ± 301 (366 - 1612) 0.01
Carbohydrate, g/d 217 ± 64 (107 -398) 222 ± 75 (79 - 511) 0.61
Energy from CHO, % 41 ± 6 (28 - 58) 40 ± 6 (24 - 55) 0.44
Carotene, ug/d 3947 ± 1644 (1717 - 10865) 2641 ± 1146 (996 - 5522) 0.00
Cholesterol, mg/d 307 ± 116 (97 - 679) 306 ± 124 (65 - 636) 0.98
Energy, kj/d 8758 ± 2385 (4433 - 14090) 8857 ± 3042 (3176 - 19896) 0.77
Fat, total (g) 83 ± 27 (39 - 157) 81 ± 33 (21 - 184) 0.55
Energy from Fat, % 33 ± 5 (19 - 43) 35 ± 5 (21 - 47) 0.05
Fiber, g/d 24 ± 8 (11 - 45) 23 ± 8 (12 - 44) 0.12
Iron, mg/d 13 ± 3 (6 - 19) 13 ± 4 (6 - 26) 0.29
Magnesium, mg/d 319 ± 77 (195 - 566) 316 ± 97 (148 - 641) 0.84
Monounsaturated fat, g/d 29 ± 10 (13 - 55) 28 ± 12 (7 - 66) 0.70
Niacin, mg/d 22 ± 6 (13 - 38) 24 ± 9 (9 - 59) 0.10
Niacin equiv. mg/d 39 ± 9 (22 - 61) 42 ± 15 (16 - 95) 0.11
Phosphorus, mg/d 1434 ± 327 (826 - 2236) 1571 ± 491 (698 - 3120) 0.03
Polyunsaturated fat, g/d 13 ± 6 (4 - 34) 12 ± 6 (3 - 30) 0.22
Potassium, mg/d 3341 ± 717 (2235 - 5683) 3070 ± 882 (1392 - 6092) 0.04
Protein, g/d 92 ± 21 (53 - 133) 94 ± 32 (39 - 193) 0.47
Retinol, ug/d 670 ± 1029 (122 - 5518) 410 ± 180 (59 - 838) 0.07
Retinol equiv. ug/d 1329 ± 1074 (529 - 5974) 851 ± 297 (225 - 1758) 0.01
Riboflavin, mg/d 1.8 ± 0.6 (0.8 - 3.7) 2.4 ± 0.9 (0.9 - 5.4) 0.00
Saturated fat, g/d 34 ± 13 (15 - 75) 33 ± 15 (8 - 78) 0.59
Starch, g/d 120 ± 39 (56 - 217) 124 ± 48 (38 - 317) 0.44
Sodium, mg/d 2737 ± 779 (1517 - 4201) 2648 ± 1050 (944 - 6511) 0.45
Sugars, g/d 97 ± 35 (41 - 202) 96 ± 35 (32 - 193) 0.93
Thiamine, mg/d 1.3 ± 0.4 (0.6 - 2.4) 1.6 ± 0.6 (0.6 - 3.7) 0.00
Vitamin C, mg/d 120 ± 45 (50 - 289) 134 ± 78 (34 - 447) 0.14
Zinc, mg/d 12 ± 3 (6 - 19) 12 ± 4 (4 - 25) 0.26
1 values are mean ± SD, n=55. 2 paired t-test

122
Table 12. Agreement between the diet record and FFQ completed 10 yrs later1
Mean %
Agreement
95% CI 2 95% LOA 3 β 4 p
value 5
r 6 p
value 7
Alcohol 103 74 -142 9 - 1150 -0.08 0.54 0.66 0.00
Calcium 118 107 - 131 57 - 248 0.12 0.52 0.36 0.07
Carbohydrate 101 93 - 109 56 - 183 0.16 0.28 0.57 0.00
Carbohydrate, % energy 102 98 - 106 76 - 136 -0.15 0.36 0.50 0.00
Carotenes 66 58 - 75 25 - 175 0.18 0.36 0.29 0.03
Cholesterol 97 85 - 111 36 - 260 0.35 0.08 0.31 0.02
Energy 99 92 - 107 55 - 178 0.24 0.08 0.59 0.00
Fat, total 95 85 - 105 42 - 213 0.25 0.14 0.45 0.00
Fat, % energy 95 91 - 100 67 - 136 0.22 0.24 0.34 0.01
Fiber 94 87 - 102 52 - 170 -0.03 0.86 0.55 0.00
Iron 103 95 - 112 56 - 189 0.15 0.36 0.47 0.00
Magnesium 98 91 - 105 57 - 169 0.26 0.11 0.49 0.00
Monounsaturated fat 96 86 - 107 42 - 221 0.20 0.24 0.45 0.00
Niacin 105 96 - 115 54 - 205 0.44 0.01 0.46 0.00
Niacin equiv. 105 96 - 114 56 - 195 0.43 0.01 0.45 0.00
Phosphorous 107 99 - 116 60 - 192 0.41 0.02 0.47 0.00
Polyunsaturated fat 90 79 - 103 34 - 244 0.13 0.44 0.45 0.00
Potassium 90 84 - 97 51 - 160 0.48 0.02 0.34 0.01
Protein 100 92 - 109 55 - 184 0.48 0.01 0.48 0.00
Retinol 83 65 - 105 14 - 505 -0.63 0.02 0.02 0.95
Retinol equiv. 71 61 - 83 22 - 230 -0.51 0.03 0.16 0.24
Riboflavin 130 117 - 143 61 - 276 0.13 0.50 0.35 0.01
Saturated fat 92 81 - 104 36 - 235 0.43 0.01 0.47 0.00
Sodium 94 86 - 102 50 - 178 0.32 0.03 0.56 0.00
Starch 101 92 - 111 50 - 207 0.20 0.18 0.55 0.00
Sugars 99 89 - 109 45 - 215 0.16 0.35 0.44 0.00
Thiamine 128 117 - 139 66 - 247 0.30 0.07 0.48 0.00
Vitamin C 104 92 - 118 41 - 268 0.48 0.01 0.43 0.00
Zinc 102 94 - 111 56 - 189 0.40 0.02 0.46 0.00
1 n=55 2 95% confidence interval for mean agreement. 3 95% Limits of Agreement 4 Regression slope of mean of both methods on difference between methods (H0: β=0, α=0.05). 5 p value for regression slope 6 Pearson 's correlation coefficient. 7 p value for Pearson’s correlation coefficient

123
-4
-3
-2
-1
0
1
2
3
4
4.75 5 5.25 5.5 5.75 6 6.25 6.5 6.75 7 7.25 7.5
Average ln(FFQ), ln(DR)
Diff
eren
ce ln
(FF
Q)
- ln
(DR
)
Upper and Lower LOA
Mean Agreement
Trend in Differences
Figure 20. Mean agreement and upper and lower Limits of Agreement (LOA) between
retinol intakes estimated by the diet record and 10 yrs later using the FFQ. The trend
in differences is equivalent to the regression line of differences (p=0.02).

124
-1.5
-1
-0.5
0
0.5
1
1.5
2.5 2.7 2.9 3.1 3.3 3.5 3.7 3.9
Average ln(FFQ), ln(DR)
Diff
eren
ce ln
(FF
Q)-
ln(D
R)
Upper and Lower LOA
Mean Agreement
Trend in Differences
Figure 21. Mean agreement and upper and lower Limits of Agreement (LOA) between
fiber intakes estimated by the diet record and 10 yrs later using the FFQ. The trend in
differences is equivalent to the regression line of differences (p=0.86).

125
Discussion
Most studies rely on assessments of recent or current diet when investigating diet and chronic
disease relationships, probably because of a perceived level of difficulty in obtaining compliant
respondents or reliable information. Yet, given the long latency of most chronic diseases
especially cancer, it is likely that remote dietary intake is etiologically more important than recent
intake.
We found that for most nutrients, the FFQ could under- or over-estimate DR intakes by 50% or
more. According to our criteria, adequate agreement was observed for carbohydrate, energy,
fiber, iron, magnesium, percent of energy from carbohydrates and percent of energy from fats.
Wide LOA were observed especially for alcohol, carotene, retinol, and retinol equivalents. The
LOA may become narrower when using more subjects however; estimates of carotene, retinol
and retinol equivalent intakes have shown poor agreement in many other reliability studies of
current diet (13, 15-17). Retinol and carotene intakes (vitamin A) can be especially difficult to
estimate because these nutrients are highly concentrated in some foods. Sporadically high
intakes of vitamin A in the DR are not likely to agree with more general intakes estimated by a
FFQ. In the case of alcohol, extremes in day to day variation are common (18).
Agreement decreased significantly with increasing intakes for many nutrients. Sporadically high
intakes of vitamin A may also explain the negative slope observed between agreement and
overall intake for retinol and retinol equivalents, where the FFQ underestimated very high
intakes reported in the DR (Figure 20). For the other nine nutrients where a positive slope was
observed between agreement and overall intake, the FFQ tended to over-estimate the DR,
which is not uncommon for a FFQ (13, 19).
Very few published reliability studies have used the LOA method, and we could find none that
had used this method to assess remote dietary recall. One reliability study that compared a 10
day DR with a FFQ designed to estimate recent diet reported LOA for ascorbic acid, energy
and fiber only (16). These showed that the FFQ could underestimate the DR by as much as
30%, or over-estimate it by up to 90%.

126
Most studies examining retrospective dietary intake have repeated a single dietary method 3 to
5 years later (20). Generally these studies have concluded that although remote dietary recall is
often influenced by current diet (20-23) remote dietary recall correlates better with past diet than
current diet (22, 24, 25). It would be useful to examine whether the reliability of remote dietary
recall varies according to whether or not the respondent’s current diet is different to their remote
diet. We administered an annual questionnaire during the cancer prevention trial (still running in
2003) that included a question asking all subjects if they had made any major changes to their
diet. Among the reliability study subjects, 64% reported making major dietary changes during
the 10 years follow up, i.e. after the DR was completed. Their small number (n=55) prevented
comparisons of reliability according to whether dietary changes were reported or not reported.
This does imply however, that the results of this study reflect a study sample where the majority
of respondents’ current diets are likely to be different to their diet of 10 years earlier.
In one study that compared multiple diet records to a FFQ completed 10-15 years later, the
reported correlation coefficients ranged from 0.07 (vitamin A) to 0.46 (saturated fats) (26), which
are similar to our findings. The correlation coefficients observed in this study are also very
similar to those seen in reliability studies examining recent dietary intake (27-30). However, we
and others have identified the limitations of using correlation coefficients to assess reliability (10,
11, 13).
We recently applied the LOA method in another reliability study in the same study sample, to
evaluate a FFQ developed by the Commonwealth Scientific Industrial Research Organisation
(CSIRO) of Australia to estimate recent diet (31). In comparing the CSIRO FFQ administered at
the end of 1991 to the DR used in this study, we similarly found that for most nutrients, the FFQ
could under- or over-estimate DR intakes by 50% or more. The results for men and women
combined showed a greater number of nutrients where agreement was dependent on the
magnitude of intake, in comparison to the ACCV FFQ. This dependency shows that FFQ errors
vary across the range of intakes for that nutrient, which can lead to differential misclassification
of intakes. Mean agreement was also better for the ACCV FFQ. The main difference was that
the upper LOA for the ACCV FFQ were generally higher, which might be acceptable, given that
intakes were recalled from ten years earlier. Although a different FFQ, we expected agreement
for the ACCV FFQ to be substantially worse than that found for the CSIRO FFQ because it

127
asked respondents to recall their diet from ten years earlier. However, we believe this not to be
the case.
We acknowledge the small sample size as the main drawback of this study. The recruitment
rate for this study was also quite low (21%) and for this reason, a convenience sample of
approximately 100 subjects was sought during the recruitment phase. A low response rate is
not unusual when a labour intensive method like the DR is required. The majority of subjects
were asked to volunteer for the reliability study immediately after they had completed their
induction interview for the cancer prevention trial. This required the completion of several other
questionnaires and tests, which might explain the low response rate. The completion rates in
this reliability study were however, relatively good (70 and 67% for the DR and FFQ,
respectively).
In comparing the baseline characteristics of study subjects with those who did not take part (but
were invited), mean age, BMI, alcohol intake and supplement use were similar. Although not all
differences were significant, there were more non-smokers and fewer previous smokers
amongst the reliability subjects. As these are the only obvious differences between our
reliability and trial subjects, we do not believe the two groups to be sufficiently different enough
to reduce the generalisability of this study.
This study and the few others using the LOA method have shown that it is difficult to gain high
levels of agreement between a FFQ and DR. Given that they are different tools in that the FFQ
provides a summary of intake whereas the DR provides several detailed ‘snapshots’, and given
the natural within-person variation in diet, it is unreasonable to expect perfect agreement
between the two. Furthermore, reliability studies examining dietary methods are hampered by
the lack of a 'gold standard'. The diet record method is influenced by random and systematic
errors and as such, is not an error free method.
Our results show that whether the correlation coefficient or the LOA method is used to assess
agreement, the FFQ used in this study to collect dietary information from ten years earlier may
provide estimates as reliable as other FFQ designed to collect information about recent diet.

128
Based on these findings, there is no obvious reason to collect information about recent diet as a
surrogate when remote dietary intake is the factor of interest.
Acknowledgements
The authors are grateful to Barbara Telfer, Lynne Watts, Nola Olsen, Caroline Hickling, Irene
Foundas and Fiona Smith for their assistance with data collection for this study.
References
1. Dwyer J, Gardner J, Halvorsen K, Krall E, Cohen A, Valadian I. Memory of food intake in
the distant past. Am J Epidemiol. 1989;130:1033-46.
2. Drewnowski A, Shultz JM. Impact of aging on eating behaviours, food choices, nutrition,
and health status. J Nutr Health Aging. 2001;5:75-9.
3. Armstrong BK, White E, Saracci R. Principles of exposure measurement in epidemiology.
New York: Oxford University Press; 1992.
4. Musk AW, de Klerk NH, Ambrosini GL, Eccles JL, Hansen J, Olsen NJ, et al. Vitamin A
and cancer prevention I: observations in workers previously exposed to asbestos at
Wittenoom, Western Australia. Int J Cancer. 1998;75:335-61.
5. Goodsell C. Diet/1 Diet Analysis Software. 3.10 ed. Brisbane: Xyris Software; 1991.
6. Food Standards Australia and New Zealand (FSANZ). NUTTAB91-92. [Database] 1992.
Canberra: Commonwealth Government of Australia.
7. Ireland P, Jolley D, Giles GG. Development of the Melbourne FFQ: a food frequency
questionnaire for use in an Australian prospective study involving an ethnically diverse
cohort. Asia Pac J Clin Nutr. 1994;3:19-31.
8. Food Standards Australia and New Zealand (FSANZ). NUTTAB95. [Database] 1995.
Canberra: Commonwealth Government of Australia.
9. Kristal AR, Cohen JH, Qu P, Stanford JL. Associations of energy, fat, calcium, and
vitamin D with prostate cancer risk. Cancer Epidemiol Biomarkers Prev. 2002 August 1,
2002;11:719-25.
10. Bland J, Altman D. A note on the use of the intraclass correlation coefficient in the
evaluation of agreement between two methods of measurement. Comp Biol Med.
1990;20:337-40.

129
11. Chinn S. The assessment of methods of measurement. Stat Med. 1990;9:351-62.
12. Bland JM, Altman DG. Measuring agreement in method comparison studies. Stat
Methods Med Res. 1999;8:135-60.
13. Ambrosini GL, de Klerk NH, Musk AW, Mackerras D. Agreement between a brief food
frequency questionnaire and diet records using two statistical methods. Public Health
Nutr. 2001;4:255-64.
14. Bland MJ, Altman DG. Statistical methods for assessing agreement between two
methods of clinical assessment. Lancet. 1986; 1(8476):307-10.
15. Harlan L, Block G. Use of adjustment factors with a brief food frequency questionnaire to
obtain nutrient values. Epidemiology. 1990;1:224-31.
16. Thompson RL, Margetts BM. Comparison of a food frequency questionnaire with a 10-
day weighed record in cigarette smokers. Int J Epidemiol. 1993;22:824-33.
17. Tjonneland A, Overvad K, Haraldsdoltir J, Bang S, Ewertz M, Jensen O. Validation of a
semi quantitative food frequency questionnaire developed in Denmark. Int J Epidemiol.
1991;20:906-12.
18. Leigh B. Using daily reports to measure drinking and drinking patterns. J Subst Abuse.
2000;12:51-65.
19. Amanatidis S, Mackerras D, Simpson JM. Comparison of two frequency questionnaires
for quantifying fruit and vegetable intake. Public Health Nutr. 2001;4:233-9.
20. Friedenreich CM, Slimani N, Riboli E. Measurement of past diet: review of previous and
proposed methods. Epidemiol Rev. 1992;14:177-96.
21. Bakkum A, Bloemberg B, Van Staveren W, Verschuren M, West C. The relative validity of
a retrospective estimate of food consumption based on a current dietary history and a
food frequency list. Nutr Cancer. 1988;11:41-53.
22. Byers T, Rosenthal R, Marshall J, Rzepka T, Cummings K, Graham S. Dietary history
from the distant past: a methodological study. Nutr Cancer. 1983;5:69-77.
23. Thompson F, Metzner H, Lamphiear D, Hawthorne V. Characteristics of individuals and
long term reproducibility of dietary reports: The Tecumseh diet methodology study. J Clin
Epidemiol. 1990;43:1169-78.
24. Wilkens L, Hankin J, Yoshizawa C, Kolonel L, Lee J. Comparison of long-term dietary
recall between cancer cases and non-cases. Am J Epidemiol. 1992;136:825-35.

130
25. Byers T, Marshall J, Anthony E, Fiedler R, Zielezny M. The reliability of dietary history
from the distant past. Am J Epidemiol. 1987;125:999-1011.
26. Sobell J, Block G, Koslowe P, Tobin J, Andres R. Validation of a retrospective
questionnaire assessing diet 10-15 years ago. Am J Epidemiol. 1989;130:173-87.
27. Willett W, Reynolds R, Cottrell-Hoehner S, Sampson L, Browne M. Validation of a semi-
quantitative food frequency questionnaire: Comparison with a 1-year diet record. Am Diet
Assoc J. 1987;87:43-7.
28. Goldbohm R, van den Brandt P, Brants H, van't Veer P, Sturmans M, Hermus R.
Validation of a dietary questionnaire used in a large-scale prospective cohort study on
diet and cancer. Eur J Clin Nutr. 1994 1;48:253-65.
29. Kim J, Chan MM, Shore RE. Development and validation of a food frequency
questionnaire for Korean Americans. Int J Food Sci Nutr. 2002;53:129-42.
30. Brunner E, Stallone D, Juneja M, Bingham S, Marmot M. Dietary assessment in Whitehall
II: comparison of 7 day diet diary and food-frequency questionnaire and validity against
biomarkers. Br J Nutr. 2001;86:405-14.
31. Ambrosini G, Mackerras D, de Klerk N, Musk A. Comparison of an Australian food
frequency questionnaire to diet records: implications for nutrition surveillance. Public
Health Nutr. 2003;6:415-22.
131
Paper 3
Dietary patterns and surgically-treated benign pros tatic
hyperplasia: a case-control study in Western Austra lia.
Gina L Ambrosini 1, Nicholas H de Klerk 2, Dorothy Mackerras 3,4, Justine Leavy 1, Lin Fritschi 5.
1 School of Population Health, University of Western Australia;
2 Telethon Institute for Child Health Research, Western Australia;
3 Menzies School of Health Research, Northern Territory, Australia;
4 Institute of Advanced Studies, Charles Darwin University, Northern Territory, Australia;
5 Western Australian Institute for Medical Research, Western Australia;
The identical published version of this manuscript can be found in Appendix 3:
Ambrosini GL, de Klerk NH, Mackerras D, Leavy J and Fritschi L. Dietary patterns and benign
prostatic hyperplasia: a case-control study in Western Australia. BJU International 2008; 101:
853-860.

132
Abstract
Objectives: Few risk factors have been established for benign prostatic hyperplasia (BPH), a
common condition affecting older men. Recently there has been some interest in a role for diet
in the development of BPH, however few studies have examined this. We investigated dietary
patterns and food intakes as risk factors for surgically-treated BPH.
Materials and methods: A case-control study was conducted in Western Australia (WA) during
2001 and 2002. BPH cases were men hospitalised for their first prostatectomy with a diagnosis
of BPH. Controls were frequency matched for age and sex from the WA electoral roll. A
previously evaluated food frequency questionnaire (FFQ) collected information on usual dietary
intake 10 years earlier. Factor analysis identified dietary patterns in FFQ data. Effects of dietary
patterns and food intakes on BPH risk were examined using unconditional logistic regression,
adjusting for various confounders.
Results: 406 cases and 462 controls aged 40-75 years provided data. Three dietary patterns
were identified; ‘Vegetable’, ‘Western’ and ‘Health-conscious’. BPH risk was not associated with
the ‘Health-conscious’ or ‘Western’ patterns, but a decreased risk was observed with increasing
score for ‘Vegetable’ pattern (OR=0.78, 95% CI, 0.63-0.98). BPH risk was significantly and
inversely related to total vegetable, dark yellow vegetable, other vegetable, tofu and red meat
intakes. There was a higher BPH risk with increasing intake of high fat dairy products.
Conclusions: These results indicate that vegetables, soy products, red meat and high fat dairy
foods may be important in the development of BPH.

133
Introduction
Benign prostatic hyperplasia (BPH) is an age-related condition characterised by enlargement of
the prostate gland and restricted urinary flow that results in urinary symptoms. BPH imposes a
considerable health burden in terms of its effects on quality of life and related health care costs.
The prevalence of at least one problematic urinary symptom among men aged 50 years or more
is common in industrialized countries, ranging from 30 to 80% (1-4). Open prostatectomy to
treat BPH has been reported as one of the most common surgical operations on an internal
organ in men, and carries some risk for bladder perforation, haemorrhage, incontinence, and
impotence (5).
Little is certain about risk factors for BPH, except that risk increases with age and androgen
levels (6) however, there is now evidence to support a role for diet in BPH development (6, 7).
In the few epidemiological studies to examine diet and BPH, fruit (8), vegetables (7, 9-11) and
pulses (7) have been reported as protective, while higher intakes of meat (8), cereals (7), milk
and dairy products (8, 10) have been associated with an increased risk of BPH. The estrogenic
effects from regular consumption of soy bean products has been suggested as an explanation
for lower BPH rates among Asian men consuming traditional Asian diets (11, 12). In this study
we examine risk of surgery for BPH according to dietary patterns and food group intakes ten
years prior.
Subjects and Methods
This study was conducted in Western Australia (WA) during 2001 and 2002 and was approved
by the University of Western Australia’s Human Research Ethics Committee and the
Confidentiality of Health Information Committee, Department of Health, Western Australia.
Cases
Hospital morbidity data from the WA Data Linkage System (13) was used to identify
surgically-treated BPH cases. Cases were men aged 40 to 75 years who were hospitalised for
their first prostatectomy with a diagnosis of BPH, in either a public or private hospital in WA,
between 1st January 2001 and 31st December 2002. Cases were not eligible if they had a
prostatectomy or history of prostate cancer (according to the WA Cancer Registry) before

134
January 2001, or if they were not listed on the WA electoral roll. The eligible case’s urologist
was contacted first for permission to invite their patient into the study. Of the 961 eligible cases
identified, we obtained consent to participate from both urologist and case for 451 men (47%).
Due to the requirements of the Confidentiality of Health Information Committee, only the age
and postal code of non-consenters and non-responders was available for comparison. Eligible
cases who refused consent (14%) or did not respond (28%) were similar in age but were slightly
more likely to live in metropolitan areas rather than non-metropolitan areas, compared to those
who consented to the study. Permission was not given by the urologist for the remaining 11%
of eligible cases.
Controls
Controls were men aged 40 to 75 years randomly selected from the WA Electoral Roll between
1st August 2001 and 1st October 2002, who did not have a history of prostate cancer or surgery
for BPH. Subjects who reported having a BPH diagnosis without a prostatectomy were not
excluded from being controls. Controls were frequency matched to cases within 5 year age
groups. Of the 1289 controls invited to participate in the study, 556 agreed (43%).
Of the eligible controls who did not provide consent, 21% refused and 36% did not respond.
Those who consented were similar in age and area of residence to those who did not.
Non-responders were slightly younger (average difference of 2 years) than those who
consented, but did not differ by area of residence.
Dietary Intakes
BPH is likely to have a long latency period, as there is accumulating evidence that BPH results
from chronic inflammation in the prostate (14). Signs of immune inflammation have been
detected in prostate tissue before the manifestation of clinical or histological effects from BPH
(14). Therefore, dietary intake from the distant past i.e. remote dietary intake, may be more
important than recent diet, if dietary intake is indeed related to the development of BPH. We
estimated remote dietary intake using a semi-quantitative food frequency questionnaire (FFQ)
originally developed by the Cancer Council of Victoria (CCV), Australia (15, 16). This
questionnaire was modified to ask about usual dietary intake ten years earlier rather than in the
previous year. It listed 74 foods or food groups (hereafter referred to as FFQ items), each with

135
10 intake frequency options, ranging from ‘never’ to ‘3 or more times per day’. Questions are
asked about types of bread, milk, spreads and cheese usually consumed, how many pieces of
fruit are consumed daily, and how many different vegetables are consumed daily. When
compared with a 28-day diet record completed 10 years earlier in a similar-aged sample, the
modified FFQ was found to be no less reliable than a FFQ used to estimate recent recall, based
on limits of agreement analyses (Paper 2). Completed FFQs were scanned and analysed by
the CCV (15) to provide intakes in grams per day for each FFQ item (a total of 101 items) .
Other Covariates
Another self-administered questionnaire was used to collect information on family history of
prostate cancer (fathers, brothers, uncles), history of vasectomy, height and weight (current and
10 years earlier), hair loss patterns at age 30 and 40 years (as an indicator of circulating
androgen level), lifetime occupational and recreational physical activity, and smoking,
occupational, residential, and military histories. Urinary symptoms one year before the study
were assessed using the International Prostate Symptom Score (IPSS) or American Urological
Association (AUA) Symptom Index (17). Using the total IPSS score, urinary symptoms were
coded as mild (IPSS ≤ 7), moderate (IPSS >7 and ≤19) or severe (IPSS >20) (17). Details of all
of these measurements and their associations with BPH risk have been reported elsewhere (18,
19). A reminder was sent to all consenting participants if both completed questionnaires were
not received within 21 days. Missing or erroneous questionnaire responses were followed up by
telephone. Both questionnaires were piloted simultaneously in a sample of the target population
to maximize accuracy and completion, before the study commenced.
Statistical Analyses
To identify dietary patterns, factor analysis was applied to intakes of all FFQ items in controls
only using PROC FACTOR in SAS (20). Based on other studies of dietary patterns, varimax
rotation and eigen values >1 were used (21-23). The number of factors to retain was based on
the scree plot and interpretability of components (FFQ items). Three dietary patterns (or
factors) were identified; ‘Vegetable’, ‘Western’ and ‘Health-conscious’. FFQ items with a factor
loading of ± 0.30 or more were considered important components of each dietary pattern. The
components, factor loadings and percent of variance explained for each pattern can be seen in

136
Table 13. The ‘Vegetable’ pattern correlated strongly (Pearson’s r ≥ 0.50) with beta-carotene,
folate, fibre, carbohydrate and vitamin C intake. The ‘Western’ pattern correlated strongly with
intake of energy, protein, total fat, saturated fat, monounsaturated fat, cholesterol and zinc. The
‘Health-conscious’ pattern exhibited low correlations (≤ 0.37) with all macronutrients, including a
very low correlation (0.07) for saturated fat. A score for each dietary pattern was assigned to
every subject based on their FFQ intakes, using PROC SCORE in SAS. Personal
characteristics and dietary intakes according to quartiles of each dietary pattern are shown in
Appendix 6. A higher score for the ‘Western’ pattern was associated with a greater proportion
of smokers and men with severe urinary symptoms, and less participation in physical activity.
Higher scores for the ‘Vegetable’ and ‘Health-conscious’ patterns were associated with smaller
proportions of smokers and those who participated in physical activity.
Unconditional logistic regression was used to analyse the risk of BPH according to dietary
patterns, using PROC LOGISTIC in SAS (20). We also investigated BPH risk according to
intake of food groups (see Table 14) associated with the dietary patterns and those previously
suggested to have a plausible role in BPH development, e.g. tofu (7, 8, 12, 24). All dietary
variables were analysed as quartiles (see Table 15) and continuous variables. Subjects with
extreme energy intakes (<3000 kJ or >21000 kJ) were excluded, as advised by the CCV
(personal communication, Alison Hodge, 2002). Potential confounding variables added to the
models included age, BMI (current and 10 years ago), energy intake, family history of prostate
cancer (brother or father), balding pattern at age 30 and 40 years, smoking history, history of
vasectomy, and occupational and recreational physical activity. The level for significance was
set to 5% for all statistical tests.
The stage at which BPH is surgically-treated may vary according to patient and doctor
preferences. Therefore as previously (19), we repeated these analyses after excluding controls
who reported severe or moderate urinary symptoms (28%) according to their IPSS, to reduce
the likelihood of controls having non-surgically-treated BPH. We also excluded cases who
reported mild urinary symptoms (6.4%). This resulted in a comparison of men undergoing
prostatectomy who had moderate to severe urinary symptoms with men who did not have a
prostatectomy and had few or no urinary symptoms.

137
Table 13. Dietary patterns and factor loadings
FFQ Item1 Vegetable Pattern
Western Pattern
Health-conscious Pattern
Jam/honey or syrup 0.35 Vegemite (yeast spread) 0.36 Apples 0.45 Beetroot 0.54 Cabbage 0.45 Carrots 0.70 Cauliflower 0.46 Celery 0.36
Cucumber 0.32 Green beans 0.34 Lettuce 0.43 Onion 0.40 Potatoes, cooked without fat 0.45 Pumpkin 0.60 Spinach 0.31 Tomato, fresh or tinned 0.33 Peas 0.46 0.30 Cakes 0.33 White bread 0.45 Eggs 0.38 Potato crisps 0.36 Potato chips (french fries) 0.31 Meat pie 0.46 Hamburger 0.40 Beef 0.42 Lamb 0.32 Pork 0.37 Bacon 0.37 Sausages 0.48 Full cream milk 0.31 Beer (full alcohol) 0.30 Fish, fried or takeaway 0.41 Fish, steamed or grilled 0.40 Fish, tinned 0.41 Chicken 0.37 Pizza 0.40 Rice 0.33 Pasta 0.49 Crackers/crispbread/dry biscuits 0.30 Tofu 0.30 Legumes 0.33 Mango 0.32 Avocado 0.42 Capsicum 0.41 Garlic 0.47 Mushrooms 0.48 Zucchini 0.39 % Variance explained 11.2 9.2 8.8
1 Only those items with a loading >|0.30| are shown.

138
Table 14. Composition of food groups
Food Groups FFQ items
Processed Meats Bacon, ham, salami, sausages
Red meats Beef, lamb, pork, veal, hamburgers
High fat dairy Full cream milk, firm cheese, soft cheese, cream cheese, ice cream, yoghurt
Low fat dairy Reduced fat milk, skim milk, ricotta, low fat cheese, flavoured milk
All dairy Milk (skim, reduced and full fat), ricotta, low fat cheese, flavoured milk, hard cheese, soft cheese, cream cheese, ice-cream, yoghurt
Fresh and cooked tomatoes Fresh or tinned tomatoes, tomato sauce, tomato paste, dried tomatoes
Dark yellow vegetables Pumpkin, carrots
Cruciferous vegetables Cabbage, cauliflower, broccoli
Green leafy vegetables Lettuce, spinach
Other vegetables Peppers, cucumber, celery, mushroom, zucchini, onion, beetroot
Total vegetables Dark yellow vegetables, cruciferous vegetables, green leafy vegetables, other vegetables, tomatoes
Potatoes Potatoes, cooked without fat
Fresh fruit Oranges, apples, pears, bananas, melon, pineapple, strawberries, apricots, peaches, mango, avocado
Legumes Peas, green beans, bean sprouts, baked beans, tofu, chick peas, lentils, soy milk
All soy products Soya milk, soy beans, soy bean curd, tofu
Tofu Soy beans, soy bean curd, tofu

139
Table 15. Quartile cut points for energy and food group intakes.
Food Group Quartiles of Intake
1 Min – Max
2 Min – Max
3 Min – Max
4 Min – Max
Energy (kJ/d) 3 291 – 7 456 7 472 – 9 305 9 310 - 11 532 11 543 – 19 670
Processed meats (g/d) 0 – 16 16 – 28.8 28.9 – 48.6 48.7 – 275.8
Red meats (g/d) 0 – 63 63.3 – 98.9 99.0 – 147.4 147.6 – 746.5
All dairy foods (g/d) 0 – 234 234.1 – 391.2 391.5 – 475.9 476.0 – 1088.10
High fat dairy (g/d) 0 – 46.8 47.1 – 214.4 215.0 – 403.2 404.0 – 1050.5
Low fat dairy (g/d) 0 0.2 – 2.2 2.5 – 203.5 204.0 – 940.0
Total vegetables (g/d) 0 – 72.6 72.8 – 101.5 101.9 – 136.1 136.2 – 378.4
Dark yellow vegetables (g/d) 0 – 14.2 14.3 – 23.5 23.6 – 37.8 38.0 -128.0
Cruciferous vegetables (g/d) 0 – 14.1 14.1 – 24.6 24.6 – 38.2 38.3 – 216.4
Green leafy vegetables (g/d) 0 – 5.3 5.4 – 9.4 9.5 -15.1 15.2 – 96.3
Fresh or cooked tomatoes (g/d) 0 – 4.2 4.3 – 11.1 11.1 – 18.3 18.3 – 56.6
Other vegetables (g/d) 0 – 16.0 16.2 – 24.3 24.4 – 35.4 35.6 – 149.9
Fresh fruit (g/d) 0 – 109.6 109.7 – 172.3 172.5 – 298.5 299.4 – 908.3
Legumes (g/d) 0 - 18.3 18.4 - 29.4 29.4 - 46.2 46.3 - 950.1
No Yes
Any soy products eaten1 0 0.2 - 884.3
Tofu eaten1 0 0.2 - 39.6 1 Only 148 men reported eating any soy products; ‘tofu’ and ‘any soy products’ were analysed according to consumers and non-consumers

140
Results
After consenting to the study, 95 controls and 68 cases either failed to return any questionnaires
or had information missing from their questionnaires after several attempts at follow up. These
men did not differ in mean age or area of residence, compared to those men who returned fully
completed questionnaires. Ten cases with extreme energy intakes were excluded. A total of
462 controls and 386 cases completed both questionnaires and had data available for analyses,
giving a response fraction of 36% and 40%, respectively.
We have previously shown that cases were slightly older than controls, but were similar
according to mean BMI, family history of prostate cancer, history of vasectomy, smoking history
and balding patterns (19). There was no difference in mean energy intake (p=0.61) between
cases (mean=9796 kJ/d, SD=3304) and controls (mean=9683 kJ/d, SD=3059).
The risk of BPH was slightly elevated in men who had undergone a vasectomy (OR=1.29, 95%
CI 0.94-1.77). Energy intake (MJ/day) was not associated with BPH risk (OR= 1.02, 95% CI,
0.98-1.06). None of the other potential confounders examined influenced risk of BPH.
Reductions in BPH risk were observed across quartiles of ‘Vegetable’ pattern score (Table 16).
There was a statistically significant reduction in risk with increasing continuous ‘Vegetable’
pattern score, indicating a 22% reduction with each unit increase in score. BPH risk was not
clearly associated with ‘Health-conscious’ or ‘Western’ dietary patterns. Although there were
small decreases in risk with increasing scores for both of these patterns, the odds ratios were
close to or included one, and exposure-response relationships were not evident.
High intakes of total vegetables, dark yellow vegetables and other vegetables were associated
with statistically significant decreases in BPH risk (Table 17). Exposure-response relationships
were evident for total vegetables and dark yellow vegetables (Table 17). Amongst those men
consuming tofu (n=138), the risk of BPH was significantly lower (OR=0.64, 95% CI, 0.44-0.94)
and men who consumed any soy products (n=146) had a decreased risk (OR=0.70, 95% CI
.049-1.01). Total legume consumption did not appear to be related to BPH risk. Men in the
highest quartile of red meat consumption (>148 grams per day) had a reduced risk of BPH, and

141
the risk decreased across quartiles of intake. An increasing trend in BPH risk was associated
with intake of high fat dairy foods and to a lesser extent, with all dairy foods. A relationship with
low fat dairy foods was not evident.
When we repeated all analyses excluding controls with moderate or severe urinary symptoms
and cases with mild urinary symptoms, the results were essentially unchanged. However, the
reduction in risk associated with tofu consumption became statistically non-significant, most
likely due to a loss of statistical power, as the number of tofu consumers decreased from 136 to
99.

142
Table 16. Dietary pattern score and risk of surgically-treated BPH.
Dietary Pattern Quartiles of Dietary Pattern Score p for Continuous OR 3
11 2 3 4 trend 2
Vegetable
cases (controls) 96 (115) 103 (112) 96 (116) 91 (119) 386 (462)
OR (95% CI) 4 1 1.00 (0.68 - 1.48) 0.84 (0.55 - 1.29) 0.68 (0.42 - 1.10) 0.09 0.78 (0.63 - 0.97)
Western
cases (controls) 91 (123) 105 (108) 96 (117) 94 (114) 386 (462)
OR (95% CI) 4 1 1.25 (0.84 - 1.87) 0.99 (0.65 - 1.52) 0.89 (0.54 - 1.48) 0.56 0.86 (0.69 - 1.08)
Health-conscious
cases (controls) 101 (112) 99 (115) 95 (120) 91 (115) 386 (462)
OR (95% CI) 4 1 0.99 (0.68 - 1.47) 0.95 (0.63 - 1.41) 0.90 (0.59 - 1.38) 0.55 0.89 (0.75 - 1.06)
1 Reference category;
2 Obtained by analysing quartile of dietary pattern score as a continuous variable;
3 Obtained by analysing dietary pattern score as a continuous variable;
4 Obtained from a multivariate unconditional logistic regression model adjusted for age, energy intake and vasectomy.

143
Table 17. Food groups and risk of surgically-treated BPH
Food Group Quartiles of Intake p for Continuous OR3
11 2 3 4 trend 2
Processed meats
cases (controls) 90 (122) 97 (116) 107 (107) 92 (117) 386 (462)
OR (95% CI) 4 1 1.14 (0.77 - 1.68) 1.37 (0.92 - 2.03) 1.03 (0.67 - 1.59) 0.63 1.01 (0.80-1.28)
Red meats
cases (controls) 99 (113) 112 (104) 91 (121) 84 (124) 386 (462)
OR (95% CI) 4 1 1.20 (0.81 - 1.75) 0.80 (0.53 - 1.21) 0.61 (0.38 - 0.97) 0.02 0.90 (0.80-1.00)
All dairy foods
cases (controls) 88 (125) 94 (118) 100 (116) 104 (103) 386 (462)
OR (95% CI) 4 1 1.13 (0.76 - 1.68) 1.24 (0.83 - 1.84) 1.48 (0.98 - 2.26) 0.06 1.04 (1.00-1.08)
High fat dairy
cases (controls) 88 (127) 94 (119) 96 (116) 108 (100) 386 (462)
OR (95% CI) 4 1 1.12 (0.76 - 1.65) 1.19 (0.81 - 1.76) 1.59 (1.05 - 2.39) 0.03 1.04 (1.00-1.07)
Low fat dairy
cases (controls) 97 (122) 104 (103) 90 (118) 95 (119) 386 (462)
OR (95% CI) 4 1 1.14 (0.95 – 2.1) 1.02 (0.69 – 1.50) 1.07 (0.73 – 1.57) 0.85 0.99 (0.96-1.03)
Total vegetables
cases (controls) 105 (107) 102 (110) 86 (129) 93 (116) 386 (462)
OR (95% CI) 4 1 0.89 (0.60 – 1.30) 0.60 (0.40 – 0.89) 0.70 (0.46 – 1.05) 0.03 0.84 (0.73-0.96)
Dark yellow vegetables
cases (controls) 99 (114) 114 (98) 87 (124) 86 (126) 386 (462)
OR (95% CI) 4 1 1.34 (0.91 – 1.96) 0.74 (0.50 – 1.10) 0.67 (0.44 – 1.02) 0.01 0.56 (0.39-0.80)

144
Table 17. Food groups and risk of surgically-treated BPH, cont’d
Food Group Quartiles of Intake p for Continuous OR3
11 2 3 4 trend 2
Cruciferous vegetables
cases (controls) 100 (113) 98 (115) 99 (111) 89 (123) 386 (462)
OR (95% CI) 4 1 0.94 (0.64 – 1.38) 0.94 (0.64 – 1.38) 0.76 (0.52 – 1.13) 0.20 0.84 (0.61-1.14)
Green leafy vegetables
cases (controls) 105 (111) 94 (110) 87 (130) 100 (111) 386 (462)
OR (95% CI) 4 1 0.93 (0.63 - 1.36) 0.70 (0.48 - 1.03) 0.92 (0.62 - 1.35) 0.39 0.70 (0.32-1.49)
Fresh and cooked tomatoes
cases (controls) 93 (118) 97 (114) 96 (120) 100 (110) 386 (462)
OR (95% CI) 4 1 1.11 (0.75 - 1.63) 1.00 (0.68 - 1.47) 1.13 (0.76 - 1.67) 0.68 1.04 (0.52-2.06) 6
Other vegetables
cases (controls) 108 (106) 90 (122) 102 (111) 86 (123) 386 (462)
OR (95% CI) 4 1 0.73 (0.50 - 1.08) 0.86 (0.58 - 1.27) 0.65 (0.44 - 0.97) 0.08 0.68 (0.44-1.03)
Fresh fruit
cases (controls) 102 (109) 83 (131) 108 (107) 93 (115) 386 (462)
OR (95% CI) 4 1 0.66 (0.44 - 0.98) 1.02 (0.69 - 1.50) 0.80 (0.53 - 1.18) 0.70 1.00 (0.95-1.05)
Legumes
cases (controls) 95 (120) 97 (114) 87 (124) 107 (104) 386 (462)
OR (95% CI) 4 1 1.06 (0.72 - 1.57) 0.87 (0.59 - 1.29) 1.22 (0.82 - 1.83) 0.54 1.08 (0.94-1.24)

145
Table 17. Food groups and risk of surgically-treated BPH, cont’d
Food Group Quartiles of Intake p for Continuous OR3
11 2 3 4 trend 2
Any soy products eaten 5 No Yes
cases (controls) 330 (372) 56 (90) 386 (462)
OR (95% CI) 4 1 0.70 (0.49 - 1.01) 0.06 1.04 (0.91-1.20)
Tofu eaten 5 No Yes
cases (controls) 337 (375) 49 (87) 386 (462)
OR (95% CI) 4 1 0.64 (0.44 - 0.94) 0.02 0.88 (0.55-1.42) 6
1 Reference category;
2 Obtained by analysing quartile of food group intake as a continuous variable;
3 Obtained by analysing food group intake as a continuous variable (OR associated with 50g change in intake);
4 Obtained from a multivariate unconditional logistic regression model adjusted for age, energy intake and vasectomy;
5 As only 148 men reported eating any soy products, ‘tofu’ and ‘any soy products’ were analysed according to consumers and non-consumers.
6 OR associated with 10g change in intake.

146
Discussion
This study is the first we are aware of to examine empirically determined dietary patterns and
BPH risk. The results suggest that a dietary pattern characterised by high intakes of vegetables
confers a lower risk for surgically-treated BPH. In addition, increased intakes of dark yellow and
other vegetables are inversely associated with BPH risk along with tofu and red meat, while high
fat dairy foods are associated with increased risk.
The risk of surgically-treated BPH and intake of a range of food groups has been examined in
two case-control studies of Southern European populations (7, 8). One conducted in Greece (8)
included 184 cases, and reported a higher risk with increasing intake of added fats (OR=1.30,
95% CI, 1.12-1.52), while fruit intake was reported to be protective (OR=0.79, 95% CI
0.67-0.93). Milk and dairy products, meats, fish and eggs were positively associated with BPH
risk, but were statistically non-significant. An Italian study (7) included 1,369 BPH cases and
reported significantly increased risks with more frequent consumption of cereals (OR=1.55, 95%
CI, 1.14-2.11), bread (OR=1.69, 95% CI, 1.26-2.27) and poultry (OR=1.39, 95% CI, 1.0-1.91).
Reduced risks were associated with intake of cooked vegetables (OR=0.66, 95% CI, 0.50-0.86),
soups including minestrone (OR=0.74, 95% CI, 0.57-0.95) and pulses (OR=0.74, 95% CI,
0.61-0.91).
Two studies have investigated diet and BPH risk in men of Asian ancestry. An early Japanese
case-control study of 100 BPH cases reported increased risk ratios (p<0.05) for milk
consumption (RR=2.25) and irregular intakes of green and yellow vegetables (RR=3.91) (10).
However, the cases and controls were sourced from a mass screening program for prostate
disease, and it is unclear if BPH cases were surgically-treated. Details of the statistical analysis
were also lacking. In a cohort study of American men with Japanese ancestry living in Hawaii,
846 cases of surgically-treated BPH were identified during 19 years of follow up (24). A large
number of foods was investigated, but only beef intake appeared important. The elevated RR’s
for beef were statistically non-significant, although a trend was observed across tertiles of intake
(p<0.05) (24).

147
The Health Professionals Follow Up Study recently examined BPH risk according to fruit and
vegetable intakes in a cohort of 32,265 men in the United States (9). After 14 years of follow up
6,092 men had surgery for BPH and 3,145 men reported a high-moderate to severe urological
symptom score. The risk of total BPH (surgical and symptomatic) decreased with higher total
vegetable intakes measured by an extensive FFQ. The OR for men in the highest quintile was
0.89 (95% CI, 0.80-0.99; p for trend=0.03). Statistically significant reductions in risk were also
associated with higher intakes of fruit and vegetables rich in vitamin C, beta-carotene, and
lutein.
The results of our dietary pattern and food group analyses also point to vegetables as important
dietary factors in BPH development. The largest reduction in risk was seen for dark yellow
vegetables, suggesting that carotenoids might play a role in preventing prostate enlargement.
However, total vegetables and other vegetables (see Table 14) also had significant effects,
indicating that other factors present in vegetables, or their combinations, may be protective.
Although soy products have been suggested as a protective dietary factor against BPH and an
explanation for lower BPH rates among Asian men (11, 12), we are aware of only one other
epidemiological study (24) that has measured soy product intake and BPH risk. The Hawaiian
cohort study described earlier reported no significant association between tofu intake and BPH
risk (24). Foods made primarily of soy beans are a rich source of phytoestrogens which are
thought to affect prostate health through their ability to inhibit the conversion of testosterone to
dihydroxytestosterone and to stimulate sex hormone binding globulin to bind testosterone (25).
In-vitro studies suggest that genistein, a soy phytoestrogen, is capable of inhibiting the growth
of human BPH tissue (26) and that levels of genistein may be lower in surgically-treated BPH
tissue compared to normal prostate tissue (27).
We observed a decreased BPH risk for men consuming more red meat, but not processed
meats. The Italian case-control study (7) also reported a lower risk for men in the highest
quartile (>6.2 servings/week) for red meat consumption (OR=0.75, 95% CI 0.57-0.99, p for
trend=0.11). Although a positive relationship with BPH risk was suggested in the Greek study
(8), meat intake was not separated from fish and egg intakes. The inverse relationship between

148
red meat and BPH now seen in two studies is intriguing, since animal protein (28), animal fat
(11) and zinc (8) intakes have been positively associated with BPH risk.
A role for dairy products in the development of BPH appears feasible, given our results and
those of others (8, 10). Increased dairy product intake has been consistently reported as a risk
factor for prostate cancer, possibly through increased serum calcium suppressing vitamin D
production (29), or an adverse effect from the fat content of dairy products.
The major limitation of this study is the response fraction, which was low for both cases and
controls, and may have introduced selection bias. Although we attempted to compare
participants and non-participants (including those who refused consent, did not respond,
withdrew, or did not complete questionnaires) we were restricted to comparing age and area of
residence due to data privacy laws, yet other important differences may exist. The topic of
prostate disease, which men have been shown to associate with sexual dysfunction (30, 31), or
a reluctance by those who are disease or symptom-free (including those treated for BPH), may
have contributed to the low response fraction. Another Australian case-control study of prostate
disease using similar recruitment methods has reported a response fraction of 46% for controls
(32).
This study is strengthened by the use of population-based rather than hospital-based data and
the use of a clear definition for BPH. However, it should be highlighted that the findings are
applicable only to surgically-treated BPH and not necessarily to BPH that is untreated, or
treated by other means. There is no universally accepted criteria for BPH, however surgical
treatment for BPH has been regarded by some as the best outcome measurement for
epidemiology (8). Surgery for BPH usually occurs after unsuccessful drug therapy and/or
minimally invasive therapies for BPH. The sole use of surgically-treated BPH cases may lead to
the inclusion of more severe cases of BPH, however this increases the likelihood of detecting an
association between diet and BPH if it exists (8). To reduce the likelihood of controls having
non-surgically-treated BPH, we repeated our analyses after removing controls with moderate or
severe urinary symptoms and also excluded cases with mild urinary symptoms. This had little
bearing on the findings. Attempts to control for many likely confounders including lifetime
physical activity, BMI and energy intake also benefit this study.

149
This study is novel in its use of dietary patterns and food intakes estimated from ten years prior,
to study relationships between diet and BPH. Ten year dietary recall fits with the hypothesis
that BPH is a chronic disease, that may take many years to develop (14). Recall bias is a
potential problem in case-control studies. However, remote dietary recall is less likely to be
affected by recall bias than recent dietary recall, especially for cases, given the temporal
proximity between recent surgery for BPH and recent diet. The difficulties of estimating dietary
intake and the limitations of FFQs are well known, and for these reasons, we utilized a FFQ that
was shown to be reliable when compared to a 28 day diet record (Paper 2). Although the
application of multiple statistical tests in the food group analyses means that some p values may
be < 0.05 due to chance, the food groupings were defined a priori to investigate previously
described associations, and are not the result of data dredging.
Further studies would be useful to confirm our findings that increased consumption of
vegetables, tofu and red meat may protect against surgically-treated BPH, and the increased
consumption of high fat dairy products may increase risk.
Acknowledgements
This study was funded by Healthway, The Health Promotion Foundation of Western Australia.
The authors wish to thank Dr Anna Timperio at the Centre for Physical Activity and Nutrition
Research, School of Exercise and Nutrition Sciences, Deakin University, Australia, for her work
on the physical activity data.

150
References
1. Pinnock C, Marshall V. Troublesome lower urinary tract symptoms in the community: a
prevalence study. Med J Aust. 1997;167:72-5.
2. Andersson S-O, Rashidkhani B, Karlberg L, Wolk A, Johansson J-E. Prevalence of lower
urinary tract symptoms in men aged 45-79 years: a population-based study of 40,000
Swedish men. BJU International. 2004;94(3):327-31.
3. Platz EA, Smit E, Curhan GC, Nyberg JLM, Giovannucci E. Prevalence of and
racial/ethnic variation in lower urinary tract symptoms and noncancer prostate surgery in
U.S. men. Urology. 2002;59(6):877-83.
4. Trueman P, Hood SC, Nayak USL, Mrazek MF. Prevalence of lower urinary tract
symptoms and self-reported diagnosed 'benign prostatic hyperplasia', and their effect on
quality of life in a community-based survey of men in the UK. BJU International.
1999;83(4):410-5.
5. Untergasser G, Madersbacher S, Berger P. Benign prostatic hyperplasia: age-related
tissue remodelling. Experiment Gerontology. 2005;40:121-8.
6. Neuhouser ML, Kristal AR, Penson DF. Steroid hormones and hormone-related genetic
and lifestyle characteristics as risk factors for benign prostatic hyperplasia: Review of
epidemiologic literature. J Urol. 2004;64(2):201-11.
7. Bravi F, Bosetti C, Dal Maso L, Talamini R, Montella M, Negri E, et al. Food groups and
risk of benign prostatic hyperplasia. Urology. 2006;67(1):73-9.
8. Lagiou P, Wuu J, Trichopoulou A, Hsieh C, Adami H, Trichopoulos D. Diet and benign
prostatic hyperplasia: A study in Greece. Urology. 1999;54:284-90.
9. Rohrmann S, Giovannucci E, Willett WC, Platz EA. Fruit and vegetable consumption,
intake of micronutrients, and benign prostatic hyperplasia in US men. Am J Clin Nutr.
2007;85:523-9.
10. Araki H, Watanabe H, Mishina T, Nakao M. High-risk group for benign prostatic
hypertrophy. Prostate. 1983;4:253-64.
11. Gu FL. Changes in the prevalence of benign prostatic hyperplasia in China. Chinese Med
J. 1997;110(3):163-6.
12. Denis L, Morton MS, Griffiths K. Diet and its preventive role in prostatic disease. Eur
Urology. 1999;35:377-87.

151
13. Data Linkage Unit, Department of Health, Western Australia and University of Western
Australia. The West Australian Data Linkage System. [Website] 2006 [cited 12 December
2006]; Available from:
http://www.publichealth.uwa.edu.au/welcome/research/dlu/linkage/system
14. Kramer G, Mitteregger D, Marberger M. Is Benign Prostatic Hyperplasia (BPH) an
immune inflammatory disease? Euro Urol. 2007;55:1202-16
15. Cancer Epidemiology Centre, Cancer Council of Victoria (Australia). Nutritional
Assessment Service - Food Frequency Questionnaire. [Website] 2007 [cited 17 July
2007]; Available from: http://www.cancervic.org.au/about-our-research/our-research-
centres/cancer_epidemiology_centre/nutritional_assessment_services
16. Ireland P, Jolley D, Giles GG. Development of the Melbourne FFQ: a food frequency
questionnaire for use in an Australian prospective study involving an ethnically diverse
cohort. Asia Pac J Clin Nutr. 1994;3:19-31.
17. American Urological Association (AUA). AUA Guideline on the Management of Benign
Prostatic Hyperplasia. Chapter 1: Diagnosis and Treatment Recommendations.
[Website] 2003 [cited 29 March 2007]; Available from:
http://www.auanet.org/guidelines/main_reports/bph_management/chapt_1_appendix.pdf
18. Fritschi L, Glass D, Tabrizi J, Leavy JE, Ambrosini GL. Occupational risk factors for
prostate cancer and benign prostatic hyperplasia: A case-control study in Western
Australia. Occup Environ Med. 2006;64:60-5.
19. Fritschi L, Tabrizi J, Leavy J, Ambrosini GL, Timperio A. Risk factors for surgically treated
benign prostatic hyperplasia in Western Australia. Public Health. 2007;121:781-789
20. SAS for Windows. 9.1.3 ed. Cary, NC, USA: SAS Institute Incorporated; 2002-2003.
21. Hu FB, Rimm EB, Stampfer MJ, Ascherio A, Spiegelman D, Willett WC. Prospective
study of major dietary patterns and risk of coronary heart disease in men. Am J Clin Nutr.
2000;72(4):912-21.
22. Tseng M, Breslow RA, De Vellis RF, Ziegler RG. Dietary patterns and prostate cancer
risk in the National Health and Nutrition Examination Survey Epidemiological Follow Up
Study Cohort. Cancer Epidemiol Biomarkers Prev. 2004;13:71-7.
23. Walker M, Aronson KJ, King W, Wilson JWL, Fan W, Heaton JPW, et al. Dietary patterns
and risk of prostate cancer in Ontario, Canada. Int J Cancer. 2005;116:592-8.
152
24. Chyou P-H, Nomura AMY, Stemmermann GN, Hankin JH. A prospective study of
alcohol, diet, and other lifestyle factors in relation to obstructive uropathy. The Prostate.
1993;22:253-64.
25. Ranjan P, Dalela D, Sankhwar SN. Diet and benign prostatic hyperplasia: Implications for
prevention. Urology. 2006;68(3):470-6.
26. Geller J, Sionit L, Partido C, Li L, Tan X, Youngkin T, et al. Genistein inhibits the growth
of human-patient BPH and prostate cancer in histoculture. The Prostate. 1998;34(2):75-
9.
27. Hong SJ, Kim SI, Kwon SM, Lee JR, Chung BC. Comparative study of concentration of
isoflavones and lignans in plasma and prostatic tissues of normal control and benign
prostatic hyperplasia. Yonsei Med J. 2002;43(2):236-41.
28. Suzuki S, Platz E, Kawachi I, Willett W, Giovannucci E. Intakes of energy and
macronutrients and the risk of benign prostatic hyperplasia. Am J Clin Nutr. 2002;75:689-
97.
29. Wolk A. Diet, lifestyle and risk of prostate cancer. Acta Oncologica. 2005;44:277-81.
30. Dolan A, Staples V, Summer S, Hundt GL. 'You ain't going to say...I've got a problem
down there': workplace-based prostate health promotion with men. Health Educ Res.
2005 December 1, 2005;20:730-8.
31. Gannon K, Glover L, O'Neill M, Emberton M. Men and Chronic Illness: A Qualitative
Study of LUTS. J Health Psychol. 2004 May 1, 2004;9:411-20.
32. Giles GG, Severi G, Sinclair R, English ER, McCredie MRE, Johnson W, et al.
Androgenic alopecia and prostate cancer: findings from an Australian case-control study.
Cancer Epidemiol Biomarkers Prev. 2002;11:549-53.

153
Paper 4
Nutrient intakes and risk of surgery for benign pro static
hyperplasia.
Gina L Ambrosini 1, Lin Fritschi 2, Nicholas H de Klerk 3, Justine Leavy 1 and Dorothy
Mackerras4.
1 School of Population Health, University of Western Australia
2 Western Australian Institute for Medical Research
3 Telethon Institute for Child Health Research, Western Australia
4 Menzies School of Health Research and Institute of Advanced Studies, Charles Darwin
University, Northern Territory, Australia
Unsubmitted manuscript.

154
Abstract
Background: Accumulating evidence indicates that the risk of benign prostatic hyperplasia
(BPH), a common condition affecting older men, may be influenced by dietary intake. We
investigated nutrient intakes as risk factors for surgically-treated BPH in a case-control study
conducted in Western Australia (WA).
Methods: BPH cases were men hospitalised for their first prostatectomy with a diagnosis of
BPH during 2001 and 2002. Controls were frequency matched for age and sex from the WA
electoral roll. An evaluated food frequency questionnaire collected information on usual dietary
intake from 10 years earlier. Effects of nutrient intakes on BPH risk were examined using
unconditional logistic regression, adjusting for energy intake and other potential confounders.
Results: 386 cases and 462 controls aged 40-75 years provided data. Statistically significant
reductions in risk and trends across quartiles were seen with increasing intakes of
beta-carotene, protein, zinc, niacin, riboflavin and thiamin. The risk of BPH was increased for
men in the highest quartiles for sugar and retinol intake, with increased risks suggested for
calcium.
Conclusions: These findings suggest that several nutrients may be involved in the
development of surgically-treated BPH.

155
Introduction
Benign prostatic hyperplasia (BPH) refers to a non-malignant enlargement of the prostate gland
that gives rise to urethral obstruction and various lower urinary tract symptoms (LUTS) that
diminish quality of life. BPH is a significant health problem for older men, and is thought to
affect at least one third of men aged in their sixties, increasing to one half of men aged 80 years
or more (1). Surgical treatment of BPH (transurethral resection of the prostate or
prostatectomy) is one of the most common surgical procedures performed on men, with 25-30%
of all men expected to undergo this operation in their lifetime (2).
The exact mechanisms behind BPH development remain unclear, but a range of metabolic
activities that alter in the aging prostate have been implicated (2). Increased androgen and
estrogen levels (2) and chronic inflammation in the aging prostate (1) are thought to be major
factors in BPH pathogenesis. It has also been suggested that BPH is a product of metabolic
syndrome (3), a cluster of risk factors for cardiovascular disease that includes obesity, Type 2
diabetes, dyslipidaemia and abnormal glucose metabolism (amongst others), all of which are
closely associated with chronic inflammation (4). The relationships between diet, obesity and
Type 2 diabetes (5) are well known, and various dietary intakes have been shown to activate
pro-inflammatory states (6). Therefore dietary intake may play a role in BPH development at
the very least, indirectly.
Few published studies have examined diet and BPH risk, but their findings have suggested
vegetables (7), red meat (7) dairy products (8), energy (9), protein (9), starch (7),
polyunsaturated fatty acids (7, 9), vitamin C (10, 11), carotenoids (10, 11), zinc (8, 10) and iron
(10) intakes as possible dietary risk factors.
In a population-based case-control study using estimates of dietary intake 10 years before
interview, we have reported that a dietary pattern rich in vegetables and higher intakes of dark
yellow vegetables may decrease the risk of surgically-treated BPH, whereas increased intakes
of high fat dairy products may increase risk (Paper 3). To further explore these relationships,
this paper reports on associations between nutrient intakes and the risk of surgically-treated
BPH.

156
Materials and methods
This study was conducted in Western Australia (WA) during 2001 and 2002 and was approved
by the University of Western Australia’s Human Research Ethics Committee and the
Confidentiality of Health Information Committee, Department of Health, Western Australia.
Subjects
The recruitment methods and response fraction for cases and controls is the same as that
detailed in Paper 3. 961 eligible cases and 1289 eligible controls were invited to participate in
the study.
Food frequency questionnaire
Details of the FFQ were provided in Paper 3. Completed FFQs were scanned and analysed by
the CCV using Australian food composition tables (12) to provide average daily intakes of
energy, total fat, saturated fat, polyunsaturated fat, monounsaturated fat, protein, carbohydrate,
sugars, starch, fibre, beta-carotene equivalents (β-carotene + ½(α-carotene) +
½(α-cryptoxanthin) + ½(β-cryptoxanthin)), calcium, cholesterol, iron, magnesium, niacin,
phosphorus, retinol, riboflavin, thiamin, vitamin C and zinc. Intakes of folate and vitamin E were
calculated using British food composition tables (13).
Other variables
Information on family history of prostate cancer (fathers, brothers, uncles), history of vasectomy,
height and weight (current and 10 years earlier), hair loss patterns at age 30 and 40 years
(indicating androgen levels), lifetime physical activity and smoking, occupational, and military
histories was collected using a self-administered questionnaire. Details of these measurements
and their associations with BPH risk have been reported previously (14, 15).

157
Statistical analysis
Cases and controls were compared according to age, BMI (current and 10 years ago), energy
and nutrient intakes using the t-test. We have previously reported no differences between
cases and controls in family history of prostate cancer, history of vasectomy, balding pattern at
age 30 and 40 years, lifetime physical activity, military history or smoking history (15).
Unconditional logistic regression was used to analyse the risk of BPH according to nutrient
intakes using PROC LOGISTIC in SAS (16). Because little research has been conducted on
dietary intake and BPH risk, we separately modelled most of the nutrient intakes provided by the
CCV (all nutrients listed in the Methods section). Nutrient intakes were adjusted for energy
intake using the residual method (17), and then analysed in regression models as quartiles
(Table 18). Potential confounding variables examined in the models included age, BMI (current
and 10 years ago), family history of prostate cancer (brother or father), balding pattern at age 30
and 40 years, smoking history, history of vasectomy, and lifetime physical activity. All models
included energy intake (quartiles). The level for significance was set to 5% for all statistical
tests.
We repeated these analyses after excluding controls who reported severe or moderate urinary
symptoms (28%) according to their IPSS, to reduce the likelihood of controls having
non-surgically-treated BPH. We also excluded cases who reported mild urinary symptoms
(6.4%). This resulted in a comparison of men undergoing prostatectomy who had moderate to
severe urinary symptoms with men who did not have a prostatectomy and had few or no urinary
symptoms.

158
Table 18. Quartile cut points for energy-adjusted nutrient intakes
Quartiles *
Nutrient intake/day 1 2 3 4
Energy (kJ) 7464 9284 11502 19670
Total fat (g) 92.8 99.9 106.2 144.6
Saturated fat (g) 35.9 40.5 46.4 65.9
Polyunsaturated fat (g) 11.3 15.2 19 31.9
Monounsaturated fat (g) 31.6 34.3 37.5 59.4
Protein (g) 98.2 107.6 117.2 201.5
Carbohydrates (g) 231.9 250.6 268.9 389.1
Sugars (g) 90.2 108.4 127.2 233.6
Starch (g) 125.8 139.3 152 254.1
Fibre (g) 21.4 25.3 30 84.2
Beta-carotene (ug) ** 2062.7 2638.2 3411.5 8722.6
Calcium (mg) 775.4 910.6 1093.6 2402.2
Cholesterol (mg) 305.1 356.7 423.6 744.7
Folate (ug) 270.1 317.2 364.3 791.8
Iron (mg) 14.1 15.7 17.7 36.2
Magnesium (mg) 293.8 332.5 375.2 840.5
Niacin (mg) 23 26.2 29.9 68.8
Phosphorus (mg) 1575.6 1730.8 1902.1 3253.5
Retinol (ug) 412.6 500.8 583 1075.9
Riboflavin (mg) 2.3 2.7 3.3 9.5
Thiamin (mg) 1.7 1.9 2.3 6.4
Vitamin C (mg) 87.8 120.1 164.1 767.2
Vitamin E (mg) 6.8 7.7 8.7 14.6
Zinc (mg) 12.7 14.2 15.7 35.4
* Maximum values for each quartile are shown.
** Beta-carotene equivalents = (beta-carotene + ½(alpha-carotene)+ ½(alpha-cryptoxanthin) +
½(beta-cryptoxanthin))

159
Results
As reported in Paper 3, a total of 462 controls and 386 cases had data available for this
analyses. Cases were slightly older than controls, but had similar mean BMI at the time of the
study and ten years prior (Table 19). Cases had significantly lower mean intakes of
beta-carotene (p=0.04) and higher mean sugar (p=0.02) intakes (Table 19). Mean folate
intakes appeared lower and mean calcium intakes higher in cases, but these were not
statistically significant (Table 19).
Table 19. Mean age, BMI and nutrient intakes for cases and controls.
Cases (n=386) Controls (n=462) ttest
Mean Std Dev
Min Max Mean Std Dev
Min Max p value
Age (years) 67 6 48.7 76.7 66 6.4 41.5 76.3 <0.01
BMI (current) 27.7 11 17.2 67.7 27.3 4.4 17.7 61.6 0.49
BMI (10 yr ago) 26.7 9.1 17 59.2 26.2 4.5 17.4 59.5 0.36
Energy (kJ/d) 9796 3304 3515 19671 9683 3059 3291 19529 0.61
Total fat (g/d) 100 37 29 233 99 35 27 227 0.72
Sat. fat (g/d) 42 18 11 108 41 16 9 93 0.36
Poly. fat (g/d) 15 7 3 36 16 7 3 40 0.77
Mono. fat (g/d) 35 14 10 85 35 13 8 88 0.99
Protein (g/d) 108 39 26 282 110 37 31 284 0.61
Carbohyd. (g/d) 255 90 93 565 248 85 60 593 0.27
Sugars (g/d) 114 46 27 269 107 43 27 311 0.02
Starch (g/d) 140 53 36 389 140 52 33 320 0.86
Fibre (g/d) 26 11 6 89 26 10 6 73 0.92
Beta-car. (ug/d) * 2742 1387 256 9222 2944 1514 307 9093 0.04
Calcium (mg/d) 969 333 204 2346 941 329 207 2526 0.22
Cholest. (mg/d) 369 153 69 1053 370 146 59 847 0.92
Folate (ug/d) 323 128 106 925 330 132 83 969 0.39
Iron (mg/d) 16.3 6.7 3.7 43.9 16.3 6.2 4.8 40.4 0.99
Mg (mg/d) 343 128 100 1024 341 121 127 854 0.76
Niacin (mg/d) 26 11 5 75 27 11 8 86 0.15
Phosph. (mg/d) 1782 632 447 4582 1755 563 475 3957 0.52
Retinol (ug/d) 512 201 36 1168 495 194 56 1281 0.21
Riboflavin (mg/d) 2.8 1.2 0.6 9.2 2.9 1.2 0.8 11.1 0.35
Thiamin (mg/d) 2.0 0.9 0.6 6.6 2.1 0.8 0.5 7.5 0.21
Vitamin C (mg/d) 131 74 18 752 137 80 27 845 0.31
Vitamin E (mg/d) 7.9 2.8 1.6 16.4 7.9 2.9 2.2 18.8 0.96
Zinc (mg/d) 14.4 5.8 2.8 43.7 14.5 5.2 4.3 46.9 0.62
* Beta-carotene equivalents

160
None of the potential confounders examined including energy intake, were associated with BPH
risk. There was a reduction in BPH risk associated with increasing protein and zinc intakes (p
for trend <0.01) (Table 20). For both of these nutrients, men in the highest intake quartile had a
42 per cent reduction in risk, compared to men in the lowest quartile. A lower risk for BPH was
observed across quartiles of beta-carotene intake (p for trend <0.01). The OR was 0.58 (95%
CI, 0.39-0.86) in the highest quartile of beta-carotene intake compared to the lowest. The risk of
BPH was also reduced in the highest intake quartiles of niacin (OR=0.65, 95% CI, 0.44-0.95),
riboflavin (OR=0.69, 95% CI, 0.47-1.01) and thiamin (OR=0.64, 95% CI, 0.44-0.95), and a
decreasing trend in risk was evident across quartiles for each of these nutrients (p for trend
<0.05). Non-statistically significant reductions in risk were shown in the highest intake quartiles
of folate, iron, vitamin E and vitamin C.
Sugar intake was positively associated with BPH risk (p for trend <0.05). Men in the highest
quartile of sugar intake had an OR of 1.53 (95% CI, 1.04-2.27) compared to the lowest (p for
trend=0.04). Elevated BPH risks were suggested in the highest intake quartiles for retinol,
calcium, carbohydrate and saturated fat, however there were no significant exposure-response
relationships for these nutrients.
In the repeated analysis where symptomatic controls and non-symptomatic cases were
excluded, the same results were seen for all nutrients except sugar. The increase in risk
originally associated with high sugar intake became statistically non-significant (OR=1.37, 95%
CI, 0.89-2.10, p for trend=0.10). This is possibly due to a loss of statistical power from the
decrease in subject numbers (361 cases and 333 controls), as the original association that
utilised all subjects was weak.
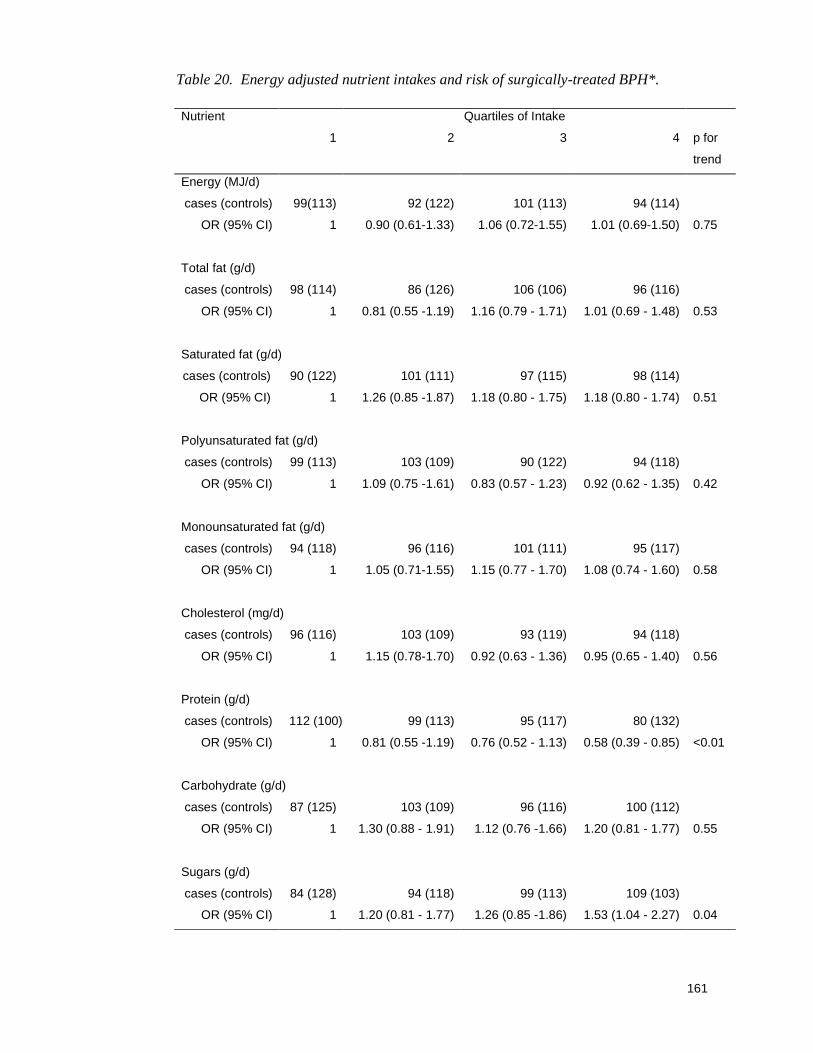
161
Table 20. Energy adjusted nutrient intakes and risk of surgically-treated BPH*.
Nutrient Quartiles of Intake
1 2 3 4 p for
trend
Energy (MJ/d)
cases (controls) 99(113) 92 (122) 101 (113) 94 (114)
OR (95% CI) 1 0.90 (0.61-1.33) 1.06 (0.72-1.55) 1.01 (0.69-1.50) 0.75
Total fat (g/d)
cases (controls) 98 (114) 86 (126) 106 (106) 96 (116)
OR (95% CI) 1 0.81 (0.55 -1.19) 1.16 (0.79 - 1.71) 1.01 (0.69 - 1.48) 0.53
Saturated fat (g/d)
cases (controls) 90 (122) 101 (111) 97 (115) 98 (114)
OR (95% CI) 1 1.26 (0.85 -1.87) 1.18 (0.80 - 1.75) 1.18 (0.80 - 1.74) 0.51
Polyunsaturated fat (g/d)
cases (controls) 99 (113) 103 (109) 90 (122) 94 (118)
OR (95% CI) 1 1.09 (0.75 -1.61) 0.83 (0.57 - 1.23) 0.92 (0.62 - 1.35) 0.42
Monounsaturated fat (g/d)
cases (controls) 94 (118) 96 (116) 101 (111) 95 (117)
OR (95% CI) 1 1.05 (0.71-1.55) 1.15 (0.77 - 1.70) 1.08 (0.74 - 1.60) 0.58
Cholesterol (mg/d)
cases (controls) 96 (116) 103 (109) 93 (119) 94 (118)
OR (95% CI) 1 1.15 (0.78-1.70) 0.92 (0.63 - 1.36) 0.95 (0.65 - 1.40) 0.56
Protein (g/d)
cases (controls) 112 (100) 99 (113) 95 (117) 80 (132)
OR (95% CI) 1 0.81 (0.55 -1.19) 0.76 (0.52 - 1.13) 0.58 (0.39 - 0.85) <0.01
Carbohydrate (g/d)
cases (controls) 87 (125) 103 (109) 96 (116) 100 (112)
OR (95% CI) 1 1.30 (0.88 - 1.91) 1.12 (0.76 -1.66) 1.20 (0.81 - 1.77) 0.55
Sugars (g/d)
cases (controls) 84 (128) 94 (118) 99 (113) 109 (103)
OR (95% CI) 1 1.20 (0.81 - 1.77) 1.26 (0.85 -1.86) 1.53 (1.04 - 2.27) 0.04

162
Table 20. Energy adjusted nutrient intakes and risk of surgically-treated BPH* (cont’d).
Nutrient Quartiles of Intake 1 2 3 4 p for
trend Starch (g/d)
cases (controls) 88 (124) 120 (92) 93 (119) 85 (127)
OR (95% CI) 1 1.90 (1.28 - 2.81) 1.10 (0.74 - 1.64) 0.94 (0.64 - 1.40) 0.27
Fibre (g/d)
cases (controls) 99 (113) 97 (115) 91 (121) 99 (113)
OR (95% CI) 1 0.94 (0.64 - 1.39) 0.83 (0.56 - 1.24) 1.00 (0.68 - 1.48) 0.84
Beta-carotene (ug/d) **
cases (controls) 106 (106) 102 (110) 98 (114) 80 (132)
OR (95% CI) 1 0.90 (0.61 - 1.33) 0.82 (0.56 - 1.22) 0.58 (0.39 - 0.86) <0.01
Retinol (ug/d)
cases (controls) 87 (125) 101 (111) 88 (124) 110 (102)
OR (95% CI) 1 1.25 (0.84 - 1.84) 1.00 (0.68 - 1.48) 1.53 (1.04 - 2.25) 0.10
Vitamin E (mg/d)
cases (controls) 98 (114) 100 (112) 100 (112) 88 (124)
OR (95% CI) 1 1.06 (0.72 - 1.56) 1.04 (0.70 - 1.53) 0.84 (0.57 - 1.24) 0.38
Folate (g/d)
cases (controls) 105 (107) 93 (119) 96 (116) 92 (120)
OR (95% CI) 1 0.79 (0.53 - 1.17) 0.84 (0.57 - 1.24) 0.77 (0.52 - 1.14) 0.25
Niacin (mg/d)
cases (controls) 109 (103) 99 (113) 94 (118) 84 (128)
OR (95% CI) 1 0.84 (0.57 - 1.24) 0.78 (0.52 - 1.15) 0.65 (0.44 - 0.95) 0.03
Riboflavin (mg/d)
cases (controls) 111 (101) 99 (113) 86 (126) 90 (122)
OR (95% CI) 1 0.80 (0.55 - 1.19) 0.62 (0.42 - 0.92) 0.69 (0.47 - 1.01) 0.03
Thiamin (mg/d)
cases (controls) 106 (106) 104 (108) 92 (120) 84 (128)
OR (95% CI) 1 0.93 (0.63 - 1.39) 0.75 (0.50 - 1.12) 0.64 (0.44 - 0.95) 0.01

163
Table 20. Energy adjusted nutrient intakes and risk of surgically-treated BPH* (cont’d).
Nutrient Quartiles of Intake 1 2 3 4 p for
trend Vitamin C (mg/d)
cases (controls) 104 (108) 98 (114) 86 (126) 98 (114)
OR (95% CI) 1 0.88 (0.59 - 1.31) 0.70 (0.47 - 1.04) 0.88 (0.60 - 1.31) 0.36
Calcium (mg/d)
cases (controls) 88 (124) 100 (112) 95 (117) 103 (109)
OR (95% CI) 1 1.29 (0.88 - 1.90) 1.15 (0.78 - 1.70) 1.39 (0.95 - 2.05) 0.18
Iron (mg/d)
cases (controls) 103 (109) 92 (120) 100 (112) 91 (121)
OR (95% CI) 1 0.82 (0.55 - 1.21) 0.95 (0.64 - 1.42) 0.83 (0.56 - 1.23) 0.49
Magnesium (mg/d)
cases (controls) 97 (115) 101 (111) 91 (121) 97 (115)
OR (95% CI) 1 1.12 (0.75 - 1.65) 0.89 (0.60 - 1.32) 1.04 (0.70 - 1.52) 0.81
Phosphorus (mg/d)
cases (controls) 95 (117) 101 (111) 86 (126) 104 (108)
OR (95% CI) 1 1.14 (0.77 - 1.67) 0.86 (0.58 - 1.28) 1.22 (0.59 - 1.29) 0.62
Zinc (mg/d)
cases (controls) 113 (99) 98 (114) 93 (119) 82 (13)
OR (95% CI) 1 0.76 (0.52 - 1.12) 0.71 (0.48 - 1.06) 0.58 (0.39 - 0.86) <0.01
* Adjusted for age, total energy intake
** Beta-carotene equivalents

164
Discussion
Few studies have examined both macro- and micronutrient intakes and risk of surgically-treated
BPH. This case-control study proposes that higher intakes of protein, zinc, beta-carotene,
niacin, riboflavin and thiamin are associated with a lower risk for surgically-treated BPH. An
increased BPH risk was associated with higher intakes of sugars and suggested for high intakes
of calcium and retinol. Three other published studies have examined nutrient intakes and risk of
surgically-treated BPH, to date. A Greek hospital-based case-control study analysed a range of
nutrient intakes and the risk of surgically-treated BPH in 184 cases and 246 controls (8). An
Italian hospital-based, multi-centred case-control study used 1369 surgically-treated BPH cases
and 1451 controls (10). In the Health Professionals Follow Up Study (HPFS) of 51,529 men,
macronutrient (9) and micronutrient (11) intakes have been examined in relation to four different
definitions of BPH risk, including surgically-treated and non-surgically-treated cases.
We found an inverse relationship between zinc intake and risk of surgically-treated BPH. The
Greek study reported that after controlling for BMI, education level and energy intake, BPH risk
appeared to increase with increments of zinc intake equivalent to one standard deviation
(OR=1.89, 95% CI, 1.03–3.46) (8). The Italian study reported an increased OR of 1.47 for men
in the highest quartile of zinc intake (10). However, the confidence interval was not reported,
there was no trend in risk with increasing intakes (p=0.28), and when analysed as a continuous
variable, zinc intake was not convincingly related to BPH risk. In an analysis of food groups, the
same Italian study showed a lower BPH risk associated with high intake of red meat (18), a
typical source of dietary zinc. Zinc concentrations in the peripheral zone of the healthy prostate
are as much as 3 to 10 times greater than other tissues in the body (19). While it is fairly well
established that zinc levels are decreased in prostate cancer tissue compared to normal
prostate tissue, the level has been reported to increase in BPH, although not consistently (19).
An inverse association between protein intakes and BPH was also observed. In contrast, higher
risks of BPH were reported with increasing protein intake in the Health Professionals Follow Up
Study (9). This was based on 1,589 cases of surgically-treated BPH (OR=1.26, 95% CI,
1.06-1.49; highest vs. lowest quintile) and 3,523 cases of total BPH including surgically and
non-surgically-treated cases (OR=1.23, 95% CI, 1.04–1.46). Adjustments were made for

165
ethnicity, physical activity, BMI, smoking, alcohol consumption and total energy intake. A role
for increased protein intakes in BPH was suggested as due to its potential to increase kidney
excretory load and urinary symptoms and possibly, a stimulatory effect on sympathetic nervous
activity and prostate smooth muscle (9). No associations were observed between protein intake
and risk of BPH in the other two case-control studies (7, 8).
Our observations that protein and zinc intakes appear inversely associated with BPH risk
support our earlier finding (Paper 3) and that from the Italian case-control study (18) whereby
intake of red meat was inversely associated with risk of BPH. In addition, an inverse
relationship was suggested between BPH risk and iron intake in our study, and a statistically
significant relationship was reported in the Italian study (10).
There is increasing evidence that BPH arises from chronic inflammation in the prostate gland
(1), which leads to increased reactive oxygen species production and oxidative stress in the
prostate (2). A role for antioxidants such as beta-carotene in the prevention of BPH or its
progression is therefore plausible (2). An inverse relationship between BPH risk and
beta-carotene intake (OR=0.80, 95% CI, 0.71-0.91; p for trend<0.001) and other carotenoids
with vitamin A activity was reported in the Italian case-control study (10).
In contrast, we observed elevated risks with high retinol intakes (>583ug/d), but no relationship
was reported in the only other study to examine retinol intake and BPH (10). The level of retinol
in BPH tissue has been reported to be 2.5 times higher than that in normal and cancerous
prostate tissue (20), and retinol is known to antagonise vitamin D (21), which is important for
controlling cell differentiation in the prostate (22). Excess calcium may also inhibit vitamin D
activity, and calcium intake has been implicated in the development and progression of prostate
tumours (23). The elevated risks associated with calcium intake in this study are consistent with
our earlier finding whereby increased dairy product intake was positively associated with BPH
risk (Paper 3). Elevated risks were reported for higher milk and dairy food intakes but not
calcium intakes, in the Greek study (8).

166
We are the first to report a positive association between BPH risk and intake of total sugars (i.e.
monosaccharides and disaccharides) and an increasing trend in risk with increased intake of
sugars. A positive association between starch, but not sugars was reported in the Italian
case-control study (7), however this may be explained by the fact that average sugars intake
was around 3 times lower than those in our study (Table 20). The positive relationship between
sugars and BPH supports the hypothesis that BPH may be associated with metabolic
syndrome. The consumption of high glycaemic index foods causes insulin secretion to increase
which in turn, may enhance the bioactivity of insulin-growth like factor (IGF)-I (24). IGFs have
been shown to stimulate prostate gland growth in vitro (3). Higher levels of fasting serum insulin
and plasma IGF-1 have been positively linked with surgery for BPH (25, 26) and prostate
enlargement measured by ultrasonography (27). Elevated fasting glucose (>110mg/dl) and
diabetes mellitus have been positively associated with increased prostate volume measured by
magnetic resonance imaging and with high-moderate to severe LUTS (3).
Higher intakes of the B-vitamins niacin, riboflavin and thiamin appeared protective against BPH
in this study. No such associations have been reported in other studies (8, 10). All of these
vitamins are involved in production of energy from macronutrients and in the metabolism of
testosterone in the prostate (28).
Very few studies have reported on nutrient intakes and BPH risk. However, a major limitation of
this case-control study is the low response fraction (Paper 3). It is also acknowledged that the
multiple statistical tests conducted in this paper increases the likelihood that some p values
<0.05 are due to chance, rather than a true association.
This study is strengthened by the use of a surgical definition for BPH and is novel due to its use
of estimated dietary intake from ten years before the study to account for latency of BPH.
Assessments of nutrient intake are prone to error, particularly FFQs. However, on comparison
with a 28-day diet record, the FFQ used in this study provided estimates within limits of
agreement similar to a FFQ designed to estimate recent intake (Paper 2). Recall of recent or
current diet is more likely to be influenced by bias than remote dietary recall in case-control
studies, given its temporal proximity to current disease or a recent diagnosis. In addition,
changes in diet may occur with the diagnosis of disease, so that recent diet may not reflect the
167
diet consumed during the course of disease development. Finally, we were able to control for
the possible confounding effects of BMI, energy intake, lifetime physical activity levels, balding
patterns and vasectomy in our analyses.
We observed exposure-response relationships between intakes of protein, zinc, beta-carotene,
sugar, some B-vitamins, and risk of surgery for BPH. However, this is one of few studies to
examine nutrient intakes and BPH risk, and further research is needed to confirm these
associations.

168
References
1. Kramer G, Mitteregger D, Marberger M. Is Benign Prostatic Hyperplasia (BPH) an
immune inflammatory disease? Euro Urol. 2007;51:1202-16.
2. Untergasser G, Madersbacher S, Berger P. Benign prostatic hyperplasia: age-related
tissue remodelling. Exper Gerontology. 2005;40:121-8.
3. Parsons JK, Carter HB, Partin AW, Windham BG, Metter EJ, Ferrucci L, et al. Metabolic
factors associated with Benign Prostatic Hyperplasia. J Clin Endocrinol Metab. 2006 July
1, 2006;91:2562-8.
4. Hotamisligil GS. Inflammation and metabolic disorders. Nature. 2006;444:860-7.
5. World Health Organisation (WHO) and the Food and Agriculture Organisation of the
United Nations (FAO). Diet, nutrition and the prevention of chronic diseases. Report of a
joint WHO/FAO expert consultation. Geneva: World Health Organisation; 2003.
6. Giugliano D, Ceriello A, Esposito K. The Effects of Diet on Inflammation: Emphasis on
the metabolic syndrome. J Am Coll Cardiol. 2006;48:677-85.
7. Bravi F, Bosetti C, Dal Maso L, Talamini R, Montella M, Negri E, et al. Macronutrients,
fatty acids, cholesterol, and risk of benign prostatic hyperplasia. Urology. 2006;67:1205-
11.
8. Lagiou P, Wuu J, Trichopoulou A, Hsieh C, Adami H, Trichopoulos D. Diet and benign
prostatic hyperplasia: A study in Greece. Urology. 1999;54:284-90.
9. Suzuki S, Platz E, Kawachi I, Willett W, Giovannucci E. Intakes of energy and
macronutrients and the risk of benign prostatic hyperplasia. Am J Clin Nutr. 2002;75:689-
97.
10. Tavani A, Longoni E, Bosetti C, Maso LD, Polesel J, Montella M, et al. Intake of selected
micronutrients and the risk of surgically treated benign prostatic hyperplasia: a case-
control study from Italy. Euro Urol. 2006;50:549-54.
11. Rohrmann S, Giovannucci E, Willett WC, Platz EA. Fruit and vegetable consumption,
intake of micronutrients, and benign prostatic hyperplasia in US men. Am J Clin Nutr.
2007;85:523-9.
12. Food Standards Australia and New Zealand (FSANZ). NUTTAB95. [Database]
Canberra: Commonwealth Government of Australia, 1995

169
13. Holland B, Welch AA, Unwin ID, Buss DH, Paul AA, Southgate DAT. McCance and
Widdowson's The Composition of Foods. 5 ed. Cambridge: Royal Society of Chemistry;
1993.
14. Fritschi L, Glass D, Tabrizi J, Leavy JE, Ambrosini GL. Occupational risk factors for
prostate cancer and benign prostatic hyperplasia: A case-control study in Western
Australia. Occup Environ Med. 2006;64:60-5.
15. Fritschi L, Tabrizi J, Leavy J, Ambrosini GL, Timperio A. Risk factors for surgically treated
benign prostatic hyperplasia in Western Australia. Public Health 2007;121:781-9.
16. SAS. SAS for Windows. 9.1.3 ed. Cary, NC, USA: SAS Institute Incorporated; 2002-
2003.
17. Willett W, Stampfer M. Total energy intake: Implications for epidemiologic analyses. Am
J Epidemiol. 1986;124:17-27.
18. Bravi F, Bosetti C, Dal Maso L, Talamini R, Montella M, Negri E, et al. Food groups and
risk of benign prostatic hyperplasia. Urology. 2006;67:73-9.
19. Costello LC, Franklin RB, Feng P, Tan M, Bagasra O. Zinc and prostate cancer: a critical
scientific, medical, and public interest issue (United States). Cancer Causes Control.
2005;16:901-15.
20. Pasquali D, Thaller C, Eichele G. Abnormal level of retinoic acid in prostate cancer
tissues. J Clin Endocrinol Metab. 1996;81:2186-91.
21. Johansson S, Melhus H. Vitamin A antagonizes calcium response to Vitamin D in man. J
Bone Min Res. 2001;16:1899-905.
22. Neuhouser ML, Kristal AR, Penson DF. Steroid hormones and hormone-related genetic
and lifestyle characteristics as risk factors for benign prostatic hyperplasia: review of
epidemiologic literature. J Urol. 2004;64:201-11.
23. Wolk A. Diet, lifestyle and risk of prostate cancer. Acta Oncologica. 2005;44:277-81.
24. Kaaks R, Lukanova A. Energy balance and cancer: the role of insulin and insulin-like
growth factor-I. Proc Nutr Soc. 2001;60:91-106.
25. Dahle SE, Chokkalingam AP, Gao Y-T, Deng JT, Stanczyk FZ, Hsing AW. Body size and
serum levels of insulin and leptin in relation to the risk of benign prostatic hyperplasia. J
Urology. 2002;168:599-604.

170
26. Chokkalingam AP, Gao Y-T, Deng JT, Stanczyk FZ, Sesterhenn IA, Mostofi FK, et al.
Insulin-like growth factors and risk of benign prostatic hyperplasia. The Prostate.
2002;52:98-105.
27. Nandeesha H, Koner BC, Dorairajan LN, Sen SK. Hyperinsulinemia and dyslipidemia in
non-diabetic benign prostatic hyperplasia. Clin Chim Acta. 2006;370:89-93.
28. Rizner TL, Lin HK, Peehl DM, Steckelbroeck S, Bauman DR, Penning TM. Human type 3
3α-hydroxysteroid dehydrogenase (Aldo-Keto Reductase 1C2) and androgen metabolism
in prostate cells. Endocrinology. 2003; 144:2922-32.

171
Paper 5
Dietary patterns identified using factor analysis a nd
prostate cancer risk: a case control study in Wester n
Australia.
Gina L Ambrosini 1, Lin Fritschi 2, Nicholas de Klerk 3, Dorothy Mackerras 4 and Justine Leavy 1.
1 School of Population Health, University of Western Australia
2 Western Australian Institute for Medical Research
3 Telethon Institute for Child Health Research, Western Australia
4 Menzies School of Health Research and Institute of Advanced Studies, Charles Darwin
University, Northern Territory, Australia
The published version of this manuscript can be fou nd in Appendix 3:
Ambrosini GL, Fritschi L, de Klerk NH, Mackerras D and Leavy J. Dietary patterns and prostate
cancer: a case-control study in Western Australia. Annals of Epidemiology in press : DOI:
10.1016/j.annepidem.2007.11.010 2008

172
Abstract
Purpose: Dietary patterns offer an alternative method for analysing dietary intakes, that takes
into account the whole diet. We investigated empirical dietary patterns and prostate cancer risk
in Western Australia (WA) using a population-based case-control study.
Methods: Incident prostate cancer cases were identified via the WA Cancer Registry. Controls
were sourced from the WA electoral roll, frequency matched on age. A food frequency
questionnaire (FFQ) estimated usual dietary intake from 10 years earlier. Factor analysis
identified dietary patterns in FFQ data. Effects of independent dietary patterns on prostate
cancer risk were examined using unconditional logistic regression, adjusting for potential
confounders.
Results: 546 cases and 447 controls provided data. Three distinct dietary patterns were
identified: ‘Vegetable’, ‘Western’ and ‘Health-conscious’. An increased risk for prostate cancer
was observed with the ‘Western’ pattern, consisting of high intakes of red and processed meats,
fried fish, hamburgers, chips, high fat milk and white bread. Men in the highest quartile for
‘Western’ pattern score had an OR of 1.82 (95% CI, 1.15-2.87, trend p=0.02). Results were
similar for aggressive cases and attenuated for non-aggressive cancers.
Conclusions: A western style diet may lead to increased risks for prostate cancer, especially
aggressive prostate cancer.

173
Introduction
Prostate cancer is the second most commonly diagnosed cancer among men globally (1).
Among Australian men, prostate cancer is the most common cancer diagnosed (excluding
non-melanoma skin cancer) and is the second most common cause of cancer death (2).
Geographical differences in prostate cancer rates have stimulated research into possible
lifestyle and environmental factors involved in the development of prostate cancer, including diet
(3). There is growing evidence of a role for diet in prostate cancer development. Dietary factors
consistently associated with prostate cancer include tomatoes and tomato products, selenium
and soy products as protective factors (4) and meat and dairy products as risk factors (3).
Almost all of the research on diet and prostate cancer to date has focussed on individual
nutrients or foods. Examining dietary patterns rather than isolated nutrients or foods offers the
advantage of studying the effect of the whole diet (5). To date, only three published studies
have examined dietary patterns (identified using cluster or factor-analytic methods) and prostate
cancer risk (6-8). Two of these studies have indicated that diets characterised by high intakes
of red meat, processed meat and refined grains may be important in prostate cancer
development (7) and advanced prostate cancer in older men(8). Most studies of dietary intake
and prostate cancer have relied upon estimates of recent diet, whereas prostate cancer takes
many years to develop, so that remote dietary intake may be more important when predicting
risk. This study aims to examine the risk of prostate cancer according to dietary patterns from
10 years before disease diagnosis.
Materials and methods
This study was conducted in Western Australia during 2001 and 2002, and was approved by the
University of Western Australia’s Human Research Ethics Committee and the Confidentiality of
Health Information Committee, Department of Health, Western Australia.
Cases
Details of incident prostate cancer cases were obtained from the West Australian Cancer
Registry. Registration of all cancers except non melanoma skin cancer is mandatory in
Australia. Histologically confirmed prostate cancer cases diagnosed between January 1, 2001

174
and August 30, 2002 and aged 40 to 75 years were eligible to participate in the study. Eligible
cases were also required to be listed on the West Australian Electoral Roll. Electoral roll
registration is compulsory for Australian citizens. Each eligible case’s urologist was first
contacted to obtain permission to approach their patient. A total of 1226 eligible prostate cancer
cases were identified during the study period. One hundred and sixty six (166) cases were
excluded because their urologist could not be identified or did not reply, or the case’s address
was not in Western Australia. Of the remaining 1066 eligible subjects who were invited to
participate in this study, 685 (64%) agreed. Of those 381 men for whom consent was not
obtained, 117 refused and 264 did not respond. Due to the requirements of the Confidentiality
of Health Information Committee, only the age and postal code of non-consenters and
non-responders was available for comparison. There were no differences in age or area of
residence (metropolitan or non-metropolitan) between men who consented, those who did not
consent, and non-responders.
The total Gleason score for each case was obtained from pathology records held at the West
Australian Cancer Registry. The Gleason score grades the severity of prostate tumours
according to tumour histology (9). Prostate cancers with a total Gleason score ≥ 7 were
considered histologically aggressive prostate cancers, while those graded < 7 were regarded
non-aggressive.
Controls
Controls consisted of men randomly selected from the West Australian Electoral Roll who were
aged 40 to 75 years and did not have a history of prostate cancer according to the West
Australian Cancer Registry. Controls were frequency matched to cases within 5 year age
groups. A total of 1289 eligible controls were invited to participate in the study and 556 (43%)
agreed. Of those 733 eligible controls for whom consent was not obtained, 269 refused and
464 did not respond. There were no differences in mean age or area of residence between
those who consented and those who did not. Non-responders were younger on average, by 2
years (p<0.01), but did not differ according to area of residence, compared to those who
consented to the study.

175
Self-administered Questionnaires
After written consent was received, two self-administered questionnaires were sent to subjects
for completion. A modified version of the semi-quantitative food frequency questionnaire (FFQ)
developed by the Cancer Council of Victoria (CCV) for use in the ethnically diverse Australian
adult population (10, 11) was sent to all study participants. The original questionnaire asks
about dietary intake over the past year, including 74 foods or food groups (hereafter referred to
as FFQ items) and 3 questions on alcohol intake, each with 10 intake frequency options,
ranging from ‘never’ to ‘3 or more times per day’. Portion sizes are presented as photographs.
Questions are also asked about types of bread, milk, spreads and cheese usually consumed,
how many pieces of fruit and how many different vegetables are consumed daily. Completed
FFQs were scanned and analysed by the CCV to provide intakes for each FFQ item (a total of
101 items) in grams per day.
It is well established that clinical prostate cancer has a long latency phase (12), which suggests
that dietary and other lifestyle factors throughout life may influence the onset and progression of
prostate cancer. Therefore, remote dietary intake may be more important than recent dietary
intake when attempting to predict prostate cancer risk. We modified the FFQ to ask
respondents about their usual dietary intake 10 years earlier. To assist recall, prompts were
added to the FFQ instructions suggesting that respondents think about where they were living or
where they worked 10 years ago. The recall period of 10 years was chosen to coincide with a
period that: (i) could be influential in the development of clinical prostate cancer and (ii) was a
realistic period for recall (Paper 2). We have previously compared this modified FFQ to 28-day
diet records completed 10 years earlier in a similar-aged sample and found that 10 year dietary
recall was found to be as reliable as recent dietary recall (Paper 2).
The other self-administered questionnaire collected information on country of birth, family
history of prostate cancer (fathers, brothers), height and weight (current and 10 years earlier),
history of vasectomy, smoking, lifetime occupational and physical activity, and urinary
symptoms one year before the study (using the International Prostate Symptom Score (IPSS)
(13, 14)). History of screening for prostate cancer (prostate-specific antigen (PSA) test or digital-
rectal examination) was collected. No national prostate cancer screening program exists in

176
Australia, but about one-quarter of men aged 50 to 79 years have a PSA test annually (15).
Self reported hair loss using the Hamilton-Norwood Classification Scale (16) was used as an
indicator of circulating androgen levels. More detail on the measurement of these variables can
be found elsewhere (17, 18). Information on race was not collected. A reminder letter was sent
to all consenting participants if they did not return both completed questionnaires within 21 days.
Attempts were also made to rectify incomplete questionnaire responses with participants by
telephone.
Dietary Patterns
To identify dietary patterns, we conducted principal components analyses on intakes of all FFQ
items (grams/day) using PROC FACTOR in SAS (19). Similar to other studies, varimax rotation
(6, 7, 20), an eigen value >1 (20), and scree plots (6, 20) were used to identify plausible dietary
patterns, using controls only. The number of factors to retain was based on the interpretability
of components (FFQ items) and scree plots. FFQ items with a factor loading of ± 0.30 or more
were considered important components of each dietary pattern and were used to name each
pattern.
Standardised scores were computed using PROC SCORE in SAS, so that all subjects were
assigned a score for each dietary pattern, based on their FFQ intakes. Applying limits used by
the CCV (personal communication, Alison Hodge, CCV), we excluded subjects from all
analyses if their energy intakes were implausible, i.e. less than 3000 kJ or greater than 21000
kJ/day.
Statistical Analyses
Unconditional logistic regression models were used to estimate prostate cancer risk according
to dietary patterns using PROC LOGISTIC in SAS. Scores for each dietary pattern were
analysed in quartiles and all dietary patterns were included in the same model. BMI (current
and 10 years ago), family history of prostate cancer (brother or father), smoking, and lifetime
physical activity were examined as potential confounding variables. Analyses were also
conducted separately using aggressive and non-aggressive cases classified according to total
Gleason score.

177
Although we collected information on prostate cancer screening, this data was found to be
unreliable for identifying screen-detected and symptomatic cases. Therefore, we repeated the
analyses including only ‘symptomatic’ cases i.e., those reporting moderate (IPSS >7 and ≤19)
or severe (IPSS >20) urinary symptoms one year prior to the study (n=247 cases).
Results
After consenting to the study, 79 cases and 85 controls did not return questionnaires even after
multiple attempts at follow up. An additional 9 cases and 9 controls did not complete a FFQ and
43 cases and 15 controls had missing covariate data in the questionnaires. Eight cases were
excluded due to implausible energy intakes. This left 546 eligible cases and 447 eligible
controls who had data available for this analysis. There were no differences in age or area of
residence between men who did and did not return fully completed questionnaires. The
characteristics of cases and controls are shown in Table 21.
Three distinct dietary patterns were identified from the factor analysis. A ‘Vegetable’ pattern was
positively loaded for nearly all vegetables listed in the FFQ (including fresh and tinned
tomatoes) plus jam, honey and apples. A ‘Western’ pattern consisted of high positive loadings
for full cream milk, white bread, cakes, potato crisps, French fries (chips), eggs, red and
processed meats, hamburgers, fried or takeaway fish, and full alcohol beer. The third dietary
pattern was labelled ‘Health-conscious’ as it was strongly positively loaded for steamed and
grilled fish, tinned fish, chicken, rice, pasta, legumes and tofu. It also had moderate positive
loadings (>0.20 and <0.30) for bean sprouts, nuts, yoghurt, ricotta cheese, red wine and white
wine. Factor loadings and the variance explained by each dietary pattern are shown in Table
22. The ‘Vegetable’ pattern correlated strongly with intakes of folate, fibre, beta carotene and
carbohydrates (Table 23). Energy, total fat, saturated fat, monounsaturated fat, cholesterol and
protein intakes were strongly correlated with the ‘Western’ pattern. The ‘Health-conscious’
pattern had the weakest correlations for all macronutrients (especially fats), cholesterol, folate
and zinc. An increasing score for the ‘Western’ pattern was associated with a higher proportion
of smokers and a lower proportion of men undertaking physical activity, while the reverse was
true for the ‘Vegetable’ and ‘Health-conscious’ patterns (see Appendix 5, Table 29).

178
Table 21. Characteristics of cases and controls
Characteristics Cases (n = 546) Controls (n = 447) Age (years), n (%)
55 and under 64 (11.7) 26 (5.8) 56 – 60 98 (18.0) 54 (12.1) 61 – 65 111 (20.3) 103 (23.1) 66 – 70 141 (25.8) 127 (28.4) Over 70 132 (24.2) 137 (30.6)
BMI 10 y ago mean (95% CI) 26.0 (25.7-26.3) 26.2 (25.8-26.6)
BMI now mean (95% CI) 26.6 (26.3-27.0) 27.2 (26.8-27.6)
Energy Intake (kilojoules/day) mean (95% CI) 9785 (9532-10037) 9683 (9403-9963)
Father with Prostate Cancer, n (%) Yes 71 (12.8) 28 (6.2) No 486 (87.2) 42 (93.9) Brother with Prostate Cancer, n (%) Yes 48 (11.5) 22 (6.4) No 359 (85.9) 314 (91.3) Don't Know 11 (2.6) 8 (2.3) Lifetime physical activity*, n (%)
Regular vigorous or moderate intensity
230 (39) 184 (40)
Smoking history, n (%)
Never smoked 193 (35) 148 (33) Former smoker 308 (57) 258 (58) Current smoker 45 (8) 41 (9)
Country of Birth, n (%) Australia or New Zealand 359 (65.8) 290(64.9) United Kingdom 117 (21.4) 91 (20.4) Europe 34 (6.2) 35 (7.8) Asia, Central and South East 9 (1.7) 14 (3.1) Africa 11 (2.0) 7 (1.6) Other 10 (1.8) 9 (2.0)
* Participated in moderate or vigorous physical activity throughout lifetime
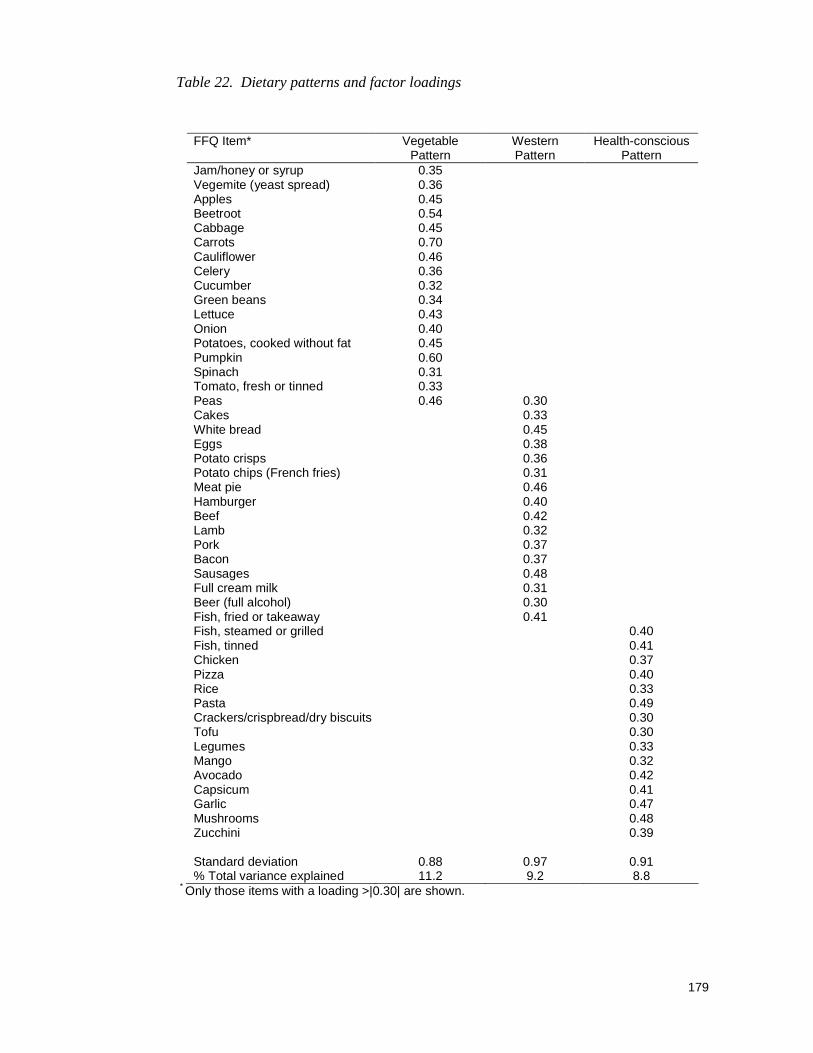
179
Table 22. Dietary patterns and factor loadings
* Only those items with a loading >|0.30| are shown.
FFQ Item* Vegetable Pattern
Western Pattern
Health-conscious Pattern
Jam/honey or syrup 0.35 Vegemite (yeast spread) 0.36 Apples 0.45 Beetroot 0.54 Cabbage 0.45 Carrots 0.70 Cauliflower 0.46 Celery 0.36 Cucumber 0.32 Green beans 0.34 Lettuce 0.43 Onion 0.40 Potatoes, cooked without fat 0.45 Pumpkin 0.60 Spinach 0.31 Tomato, fresh or tinned 0.33 Peas 0.46 0.30 Cakes 0.33 White bread 0.45 Eggs 0.38 Potato crisps 0.36 Potato chips (French fries) 0.31 Meat pie 0.46 Hamburger 0.40 Beef 0.42 Lamb 0.32 Pork 0.37 Bacon 0.37 Sausages 0.48 Full cream milk 0.31 Beer (full alcohol) 0.30 Fish, fried or takeaway 0.41 Fish, steamed or grilled 0.40 Fish, tinned 0.41 Chicken 0.37 Pizza 0.40 Rice 0.33 Pasta 0.49 Crackers/crispbread/dry biscuits 0.30 Tofu 0.30 Legumes 0.33 Mango 0.32 Avocado 0.42 Capsicum 0.41 Garlic 0.47 Mushrooms 0.48 Zucchini 0.39 Standard deviation 0.88 0.97 0.91 % Total variance explained 11.2 9.2 8.8

180
Table 23. Pearson correlations between dietary pattern scores and key nutrients*
Nutrient Vegetable pattern Western pattern Health-conscious pattern
Energy 0.50 0.66 0.26
Carbohydrates 0.61 0.45 0.18
Protein 0.45 0.60 0.37
Total fat 0.43 0.71 0.19
Saturated fat 0.34 0.75 0.07
Polyunsaturated fat 0.43 0.27 0.23
Monounsaturated fat 0.41 0.70 0.24
Cholesterol 0.25 0.72 0.22
Folate 0.64 0.29 0.24
Vitamin C 0.50 0.11 0.27
Fibre 0.72 0.08 0.34
Beta-carotene 0.84 0.16 0.17
Calcium 0.40 0.15 0.25
Zinc 0.47 0.56 0.27
* All correlations are statistically significant (p<0.05)
To test the robustness of our dietary pattern analysis we conducted another factor analysis that
included both cases and controls, and arrived at the same dietary patterns. We also tested a
reduced version of the FFQ. The 101 FFQ items were collapsed into 33 food groups similar to
those used by Hu and colleagues (20). Factor analyses on these 33 items yielded almost
identical dietary patterns and similar odds ratios for prostate cancer. We chose to use the full
version of the FFQ however, so as to reduce possible errors arising from the arbitrary
assignment of foods to groups.
The risk of prostate cancer slightly decreased with increasing BMI (OR=0.96, 95% CI
0.93-0.99). The risk was doubled in men whose fathers had been diagnosed with prostate
cancer (OR=2.1, 95% CI 1.32-3.36). None of the other potential confounders investigated
including energy intake, appeared to influence prostate cancer risk.

181
The ‘Vegetable’ and ‘Health-conscious’ dietary patterns were not significantly associated with
prostate cancer risk, with most odds ratios close to one (Table 24). However, men in the
highest quartile for the ‘Western’ pattern had an OR of 1.82 (95% CI 1.15-2.87) and a trend was
evident across quartiles of ‘Western’ pattern score (p=0.02). The effect of the ‘Western’ pattern
increased slightly when only ‘symptomatic’ cases were included in the analysis (data not
shown).
Of the 546 cases for which dietary data were available, the Gleason score was obtained for 535
(98%), identifying 302 (56%) aggressive and 233 (44%) non-aggressive cases. Total Gleason
scores were normally distributed and 42% of cases had a total Gleason score of 7. The results
did not differ considerably when only aggressive cases were analysed, except that odds ratios
for the Vegetable pattern were slightly increased in all quartiles although they remained
non-statistically significant (Table 24). The association with ‘Western’ pattern was strengthened.
When only non-aggressive cases were analysed, all dietary patterns were non-statistically
significant, except for the second lowest quartile of the ‘Health-conscious’ pattern, where the OR
was significantly elevated, but no trend was detected. BMI was not a significant predictor of
aggressive prostate cancer, but remained significant (OR=0.95, 95% CI 0.91 – 0.99) in the
analysis of non-aggressive cases. Because of the large proportion of high grade or ‘aggressive’
prostate cancers, we repeated these analyses redefining aggressive prostate cancers as those
with a total Gleason score >7 rather than ≥ 7. This resulted in 82 (15%) aggressive and 453
(85%) non-aggressive cases. Statistically significant increases in risk were associated with the
‘Western’ pattern in both the aggressive and non-aggressive tumour groups (data not shown),
similar to when all cases were analysed together.

182
Table 24. Dietary pattern score (quartiles) and prostate cancer risk
Quartile of Dietary Controls All p for Aggressive p for Non-Aggressive p for Pattern Score Cases OR (95% CI) trend1 Cases 2 OR (95% CI) trend1 Cases 3 OR (95% CI) trend1 Vegetable
1 110 137 1 0.46 76 1 0.31 58 1 0.77 2 112 136 1.03 (0.71 - 1.50) 81 1.13 (0.73-1.73) 52 0.95 (0.58-1.55) 3 111 143 1.26 (0.85 - 1.89) 74 1.28 (0.80-2.04) 68 1.33 (0.80-2.21) 4 114 130 1.13 (0.72 - 1.78) 71 1.31 (0.77-1.24) 55 1.02 (0.57-1.83)
Western
1 125 121 1 0.02 66 1 <0.01 54 1 0.37 2 107 141 1.42 (0.98 - 2.06) 76 1.41 (0.91-2.20) 62 1.38 (0.86-2.22) 3 116 139 1.32 (0.89 - 1.97) 81 1.46 (0.92-2.32) 56 1.17 (0.70-1.96) 4 99 145 1.82 (1.15 - 2.87) 79 2.11 (1.25-3.60) 61 1.41 (0.79-2.53)
Health-conscious
1 115 133 1 0.97 81 1 0.89 49 1 0.90 2 105 147 1.24 (0.86 - 1.80) 69 0.97 (0.63-1.50) 75 1.74 (1.09-2.77) 3 117 132 1.02 (0.70 - 1.48) 80 1.06 (0.69-1.62) 47 0.97 (0.59-1.60) 4 110 134 1.06 (0.72 - 1.58) 72 1.00 (0.63-1.59) 62 1.28 (0.77-2.12)
All ORs are adjusted for age, BMI at time of study, energy intake and paternal history of prostate cancer. All controls were used for the subgroup analyses.
1 Obtained by analysing dietary pattern score quartile as a continuous variable.
2 Tumours with a total Gleason score of 7 or more 3 Tumours with a total Gleason score < 7

183
Discussion
We identified three distinct dietary patterns in men participating in this study that were
subjectively labelled ‘Vegetable’, ‘Western’, and ‘Health-conscious’, although different labels
could be applied. Neither the ‘Vegetable’ nor the ‘Health-conscious’ pattern was associated
with prostate cancer risk. The ‘Western’ pattern conferred an elevated risk for prostate cancer,
which rose significantly with increasing ‘Western’ pattern score (p=0.02). The ‘Western’ dietary
pattern identified in this study includes foods that have been positively associated with prostate
cancer risk; meat (3, 21, 22), milk (23) and refined grains (7, 24).
A major limitation in this study is the low response fraction, particularly for controls, which may
be a source of selection bias. Although we attempted to test for differences between
participants and non-participants we were limited to comparing age and area of residence only,
yet other differences related to prostate cancer risk may exist. The low response rate may also
reflect a reluctance by men to provide personal information on a topic related to men’s sexual
health. It has been shown that men are poorly informed about prostate diseases, and that
many men associate prostate problems with sexual dysfunction and are reluctant to talk about
their health concerns (25, 26). A low response fraction (46%) has been reported in another
Australian case-control study of prostate cancer that used similar recruitment methods (27).
The questionnaires used in this study were fairly detailed and lengthy but were deemed
acceptable when piloted in a similarly aged group of men. However, the number of men who
withdrew from the study or did not return questionnaires after consenting to the study may
reflect a significant level of respondent burden.
The use of dietary intakes recalled from ten years prior benefits this study, as prostate cancer
has a long latent period. Remote dietary recall is also less likely to be influenced by recall bias
than recent dietary recall, especially in case-control studies, where disease status is likely to
affect recent recall. In addition, changes in diet may occur with the diagnosis of disease, so that
recent diet may not reflect the typical diet consumed during the course of disease onset or
progression. FFQs may be prone to error, however when compared to a 28-day diet record, the
FFQ used in this study was shown to be as reliable as a FFQ designed to estimate recent intake
(Paper 2). The variances explained by each dietary pattern are similar to those reported in

184
other studies of dietary patterns and prostate cancer which range from 1.72% to 10% (6, 7).
Furthermore, we were able to control for the potentially confounding effects of BMI, energy
intake and lifetime physical activity levels. We were also able to examine the robustness of our
definition of prostate cancer by repeating our analyses confining them to those with higher
Gleason score, and those with urinary symptoms before diagnosis.
We have seen only three other published studies that have examined dietary patterns and
prostate cancer risk (6-8). A small, clinic based case-control study conducted in Canada (7)
identified four dietary patterns using principal components analysis; Healthy Living, Traditional
Western, Beverages and Processed. Men in the highest tertile for the Processed pattern had
an OR of 2.75 (95% CI, 1.40-5.39, trend p=0.0035). The Processed pattern was positively
loaded for red meats, organ meats, processed meats, refined grains, vegetable oil, soft drinks,
tomatoes and onions, similar to our ‘Western’ pattern. Prostate cancer risk was not associated
with any of the other dietary patterns.
Prostate cancer and dietary patterns have been analysed in the National Health and Nutrition
Examination Survey (NHANES II) Epidemiological Follow-up Study (6). A FFQ was
administered during 1982-84, and follow up took place until 1992. Three dietary patterns
emerged from the FFQ data; a Vegetable-fruit pattern, Red meat-starch pattern and Southern
pattern. Only the Southern pattern, characterised by cornbread, grits, sweet potatoes, okra,
beans and rice, appeared to be associated with prostate cancer risk. Both black and non-black
men in the highest tertile for the Southern pattern had a reduced risk of prostate cancer
(OR=0.6, 95% CI, 0.4-1.10, trend p=0.08). The authors suggested that a Southern style diet
may be a marker for sunlight exposure and increased vitamin D status, which is thought to be
protective against prostate cancer (6). The number of prostate cancer cases was relatively
small in this study; 89 confirmed and 47 probable cases.
The largest study published to date on dietary patterns and prostate cancer comes from the
Health Professionals Follow Up Study of over 47,000 men aged 40 to 75 years, who were
followed up for fourteen years (8). Diet was assessed every four years using a FFQ. Two
dietary patterns were identified; a Prudent and Western pattern. No significant relationships
were found between total prostate cancer risk (3,002 incident cases) and either of these dietary

185
patterns. However, among men aged ≥65 years, higher intakes of the Western pattern
suggested an increased risk for advanced prostate cancer (OR=1.34, 95% CI, 0.96-1.88; p for
trend=0.07). Our results suggest that the ‘Western’ dietary pattern may be a stronger risk factor
for developing aggressive prostate cancer based on total Gleason score ≥ 7, however a high
Gleason score does not always indicate advanced prostate cancer.
By analysing empirically derived dietary patterns, the total diet is taken into consideration. We
have found that the risk of prostate cancer in particular, aggressive prostate cancer, increases
significantly and by about 80% in men who consume a diet strongly characterised by a western
style of eating. Further investigation of these data according to food and nutrient intakes may
help to clarify the basis of this relationship.
Acknowledgements
The work for this study was carried out at the School of Population Health, University of
Western Australia, Perth, Western Australia. Funding was obtained from Healthway, The
Health Promotion Foundation of Western Australia. Dr Lin Fritschi was the recipient of a Career
Development Award from the National Health and Medical Research Council of Australia. The
authors wish to thank Dr Anna Timperio from the Centre for Physical Activity and Nutrition
Research, School of Exercise and Nutrition Sciences, Deakin University, for her work on the
physical activity data.
References
1. Ferlay J, Bray F, Pisani P, Parkin DM. GLOBOCAN 2002: Cancer incidence, mortality
and prevalence worldwide. [Electronic database] 2004 [cited 17 July 2007]; Available
from: http://www-dep.iarc.fr/
2. Australian Institute of Health and Welfare (AIHW) and Australasian Association of Cancer
Registries (AACR). Cancer in Australia 2001. Canberra: AIHW; 2004.
3. Wolk A. Diet, lifestyle and risk of prostate cancer. Acta Oncologica. 2005;44:277-81.
4. Chan JM, Gann PH, Giovannucci EL. Role of diet in prostate cancer development and
progression. J Clin Oncol. 2005 Nov 10;23:8152-60.

186
5. Jacques PF, Tucker KL. Are dietary patterns useful for understanding the role of diet in
chronic disease? Am J Clin Nutr. 2001;73:1-2.
6. Tseng M, Breslow RA, De Vellis RF, Ziegler RG. Dietary patterns and prostate cancer
risk in the National Health and Nutrition Examination Survey Epidemiological Follow Up
Study Cohort. Cancer Epidemiol Biomarkers Prev. 2004;13:71-7.
7. Walker M, Aronson KJ, King W, Wilson JWL, Fan W, Heaton JPW, et al. Dietary patterns
and risk of prostate cancer in Ontario, Canada. Int J Cancer. 2005;116:592-8.
8. Wu K, Hu FB, Willett WC, Giovannucci E. Dietary patterns and risk of prostate cancer in
US men. Cancer Epidemiol Biomarkers Prev. 2006;15:167-71.
9. Fujikawa K, Sasaki M, Arai Y, Yamabe H, Ogawa O, Yishida O. Prognostic criteria in
patients with prostate cancer: Gleason score versus volume-weighted mean nuclear
volume. Clinical Cancer Research. 1997;3:613-8.
10. Ireland P, Jolley D, Giles GG. Development of the Melbourne FFQ: a food frequency
questionnaire for use in an Australian prospective study involving an ethnically diverse
cohort. Asia Pac J Clin Nutr. 1994;3:19-31.
11. Cancer Epidemiology Centre, Cancer Council of Victoria (Australia). Nutritional
Assessment Service - Food Frequency Questionnaire. [Website] 2007 [cited 17 July
2007]; Available from: http://www.cancervic.org.au/about-our-research/our-research-
centres/cancer_epidemiology_centre/nutritional_assessment_services
12. Norwood OT. Male pattern baldness: classification and incidence. South Med J.
1975;68:1359-65.
13. Fritschi L, Glass D, Tabrizi J, Leavy JE, Ambrosini GL. Occupational risk factors for
prostate cancer and benign prostatic hyperplasia: A case-control study in Western
Australia. Occup Environ Med. 2006;64:60-5.
14. Leavy J, Ambrosini GL, Fritschi L. Vietnam military service history and prostate cancer.
BMC Public Health; 2006; 6:75
15. SAS. SAS for Windows. 9.1.3 ed. Cary, NC, USA: SAS Institute Incorporated; 2002-
2003.
16. Hu FB, Rimm EB, Stampfer MJ, Ascherio A, Spiegelman D, Willett WC. Prospective
study of major dietary patterns and risk of coronary heart disease in men. Am J Clin Nutr.
2000;72:912-21.
187
17. Dolan A, Staples V, Summer S, Hundt GL. 'You ain't going to say...I've got a problem
down there': workplace-based prostate health promotion with men. Health Educ Res.
2005 December 1, 2005;20:730-8.
18. Gannon K, Glover L, O'Neill M, Emberton M. Men and Chronic Illness: A Qualitative
Study of LUTS. J Health Psychol. 2004;9:411-20.
19. Giles GG, Severi G, Sinclair R, English ER, McCredie MRE, Johnson W, et al.
Androgenic alopecia and prostate cancer: findings from an Australian case-control study.
Cancer Epidemiol Biomarkers Prev. 2002;11:549-53.
20. Cross AJ, Peters U, Kirsh VA, Andriole GL, Reding D, Hayes RB, et al. A prospective
study of meat and meat mutagens and prostate cancer risk. Cancer Res. 2005 Dec
15;65:11779-84.
21. Rohrmann S, Platz EA, Kavanaugh CJ, Thuita L, Hoffman SC, Helzlsouer KJ. Meat and
dairy consumption and subsequent risk of prostate cancer in a US cohort study. Cancer
Causes Control. 2007;18:41-50.
22. King IB, Kristal AR, Schaffer S, Thornquist M, Goodman GE. Serum trans-fatty acids are
associated with risk of prostate cancer in Beta-Carotene and Retinol efficacy trial. Cancer
Epidemiol Biomarkers Prev. 2005 April 1, 2005;14:988-92.
23. Bidoli E, Talamini R, Bosetti C, Negri E, Maruzzi D, Montella M, et al. Macronutrients,
fatty acids, cholesterol and prostate cancer risk. Annals of Oncology. 2005;16:152-7.
24. Renehan AG, Zwahlen M, Minder C, O'Dwyer ST, Shalet SM, Egger M. Insulin-like
growth factor (IGF)-I, IGF binding protein-3, and cancer risk: systematic review and meta-
regression analysis. The Lancet. 2004;363:1346-53.

188
Paper 6
A comparative analysis of nutrient intakes, nutrien t
patterns and prostate cancer risk.
Gina L Ambrosini 1, Lin Fritschi 2, Nicholas de Klerk 3, Dorothy Mackerras 4 and Justine Leavy 1.
1 School of Population Health, University of Western Australia
2 Western Australian Institute for Medical Research
3 Telethon Institute for Child Health Research, Western Australia
4 Menzies School of Health Research and Institute of Advanced Studies, Charles Darwin
University, Northern Territory, Australia
Unsubmitted manuscript

189
Abstract
Background: This paper examines prostate cancer risk according to individual nutrient intakes
and patterns in nutrient intakes. Methods and Results: A previously evaluated food frequency
questionnaire (Paper 2) was used to collect information on usual nutrient intakes in a
population-based case-control study of 546 prostate cancer cases and 447 controls. Increasing
individual intakes of zinc and protein were inversely associated with prostate cancer risk. This
was in contrast to our earlier finding in the same study, where zinc and protein intakes were
positively correlated with a ‘Western’ food pattern, which was positively associated with prostate
cancer risk (Paper 5). Because of this inconsistency, we examined patterns in nutrient intakes
using factor analysis. Two nutrient intake patterns emerged that included both zinc and protein
intakes as major contributors. Nutrient pattern 1, characterised by high protein, zinc, fibre and
micronutrient intakes, but low intakes of total and saturated fat, was significantly and inversely
associated with prostate cancer risk (OR=0.62, 95% CI, 0.43-0.90; p for trend=0.008). Nutrient
pattern 2, which was loaded with high protein and zinc intakes as well as high intakes of total
and saturated fat and low intakes of micronutrients, was not associated with prostate cancer
risk. Conclusions: This suggests that if zinc and protein intakes confer a protective effect,
they might only do so when consumed in a diet that is also low in total and saturated fat and rich
in fibre and micronutrients, as characterised by nutrient pattern 1. This study demonstrates the
relevance of examining the whole diet rather than individual nutrients.

190
Introduction
Nutritional epidemiology has tended to rely on the reductionist approach of analysing individual
nutrients or foods. However, several researchers have argued for the use of empirically derived
dietary patterns rather than individual food and nutrient intakes, as dietary patterns take
account of the overall effect of diet and the potentially synergistic effects of nutrients (1-3).
There are several limitations in analysing individual nutrients separately (1), and these may be
overcome by analysing dietary patterns. Many nutrients and foods are intercorrelated or
colinear, making the separation of their effects difficult. The colinearity of nutrients also
suggests that their individual effects may be too small to detect. Hu (4) has suggested that
conclusions on diet-disease risks based on a single nutrient may be seriously flawed due to the
multi-colinearity of nutrients. Because many nutrient intakes are not independent of each other,
modelling multiple nutrients simultaneously is inappropriate for standard statistical models,
which assume independent effects. Whereas, examining individual nutrients in separate
models does not account for their potentially synergistic or confounding effects. The whole
effect of the diet, whereby ‘protective factors’ may be outweighed by ‘non-protective factors’
(and vice versa) may be taken account of with pattern analyses. Finally, the number of
statistical tests carried out when analysing many different nutrient intakes and disease risk
increases the likelihood that some statistically significant findings will be due to chance. Many
of the weak findings between outcomes and dietary intakes might be explained by at least some
of these limitations.
We have previously examined dietary patterns according to food intakes in a population-based
case-control study of prostate cancer, finding almost a doubling of prostate cancer risk
associated with a high score for a ‘Western’ dietary pattern (Paper 5). Using data from the
same case-control study, this paper examines prostate cancer risk according to individual
nutrient intakes and compares the findings to an analysis of nutrient intake patterns and
prostate cancer risk.

191
Materials and Methods
Full details of this study have been provided earlier (Paper 5). The study was conducted in
Western Australia (WA) during 2001 and 2002. Histologically confirmed, incident prostate
cancer cases were identified using WA Cancer Registry data. Registration of all cancers except
non melanoma skin cancer is mandatory in Australia. Controls were randomly selected from
the WA electoral roll (registration mandatory) and age-matched within 5 years of cases. A total
of 546 cases and 447 controls provided data. The study protocol was approved by the
University of Western Australia’s Human Research Ethics Committee and the Confidentiality of
Health Information Committee, Department of Health, Western Australia.
We collected information on usual dietary intake ten years prior to the study using a
semi-quantitative food frequency questionnaire (FFQ) developed by the Cancer Council of
Victoria (CCV) for use in the ethnically diverse Australian adult population (5, 6 and Paper 5).
The FFQ was compared against a 28-day diet record completed ten years earlier in a similar
study population, and was found to be no less reliable than another FFQ completed ten years
earlier, to estimate recent dietary intake (Paper 2).
Australian food composition tables (7) were used to estimate average daily intakes of energy,
total fat, saturated fat, polyunsaturated fat, monounsaturated fat, cholesterol, protein,
carbohydrate, sugars, starch, fibre, beta-carotene equivalents (β-carotene + ½(α-carotene) +
½(α-cryptoxanthin) + ½(β-cryptoxanthin)), retinol, calcium, iron, magnesium, niacin, potassium,
phosphorus, riboflavin, sodium, thiamin, vitamin C and zinc. Intakes of folate and vitamin E
were calculated using British food composition tables (8).
A self administered questionnaire collected information on potential confounders, including
family history of prostate cancer (fathers, brothers), height and weight (current and 10 years
earlier), history of vasectomy, smoking habits, lifetime occupational and residential physical
activity, military history and self reported hair loss (as an indicator of circulating androgen
levels). Details on the measurement of these variables can be found elsewhere (9, 10). We
have previously reported no differences between cases and controls in history of vasectomy,

192
balding pattern at age 30 and 40 years, lifetime physical activity, smoking history (Paper 5) and
military history (10).
Statistical analyses
Individual nutrient intakes and prostate cancer risk.
Unconditional logistic regression was used to analyse the risk of prostate cancer according to
nutrient intakes using PROC LOGISTIC in SAS (11). Subjects with extreme energy intakes
(<3000 kJ or >21000 kJ) were excluded from all analyses (0.7%) as errors were assumed in
their FFQ. Nutrient intakes were adjusted for energy intake using the residual method (12).
Each nutrient was modelled in separate regression models as quartiles and as continuous
variables. Potential confounding variables examined in the models include those listed
previously. All models included age and energy intake (quartiles). The level for significance
was set to 5% for all statistical tests.
Patterns in nutrient intake and prostate cancer risk
To evaluate patterns in nutrient intakes we repeated the methods used previously to identify
patterns in food intakes (Paper 5). We conducted principal components analyses among
controls only, on all energy-adjusted nutrient intakes using PROC FACTOR in SAS (11).
Varimax rotation, eigen values >1(4), and scree plots were used to identify plausible nutrient
patterns (4, 13, 14). The number of factors to retain was based on the scree plot and the
interpretability of patterns. Nutrients with a factor loading of ± 0.30 or more were considered
important components of each nutrient pattern. All subjects received a score for each nutrient
pattern based on their energy-adjusted average daily nutrient intakes estimated by the FFQ.
The risk of prostate cancer according to nutrient patterns was then modelled using unconditional
logistic regression (PROC LOGISTIC) in SAS (11). All dietary patterns were modelled
simultaneously as they were rendered independent by orthogonal rotation (1, 15). The same
potential confounding variables and levels of significance for statistical tests as those used in
the analysis of individual nutrients were applied.

193
Results
Individual nutrient intakes and prostate cancer risk
The distributions of energy adjusted average daily nutrient intakes are shown in Table 25. As
reported previously, there was a weak inverse association between BMI and risk of prostate
cancer and the risk doubled for men whose fathers had been diagnosed with prostate cancer
(Paper 5). None of the other potential confounders investigated including energy intake,
appeared to influence prostate cancer risk.
Statistically significant reductions in prostate cancer risk were observed in the highest intake
quartile for zinc (OR=0.57, 95% CI, 0.40-0.82; p for trend=0.0009) and protein (OR=0.55, 95%
CI, 0.38-0.79; p for trend=0.0009) (Table 26). This is in contrast to our earlier finding that a
‘Western’ dietary pattern, which correlated moderately with zinc and protein intakes (r=0.56 for
zinc, r=0.60 for protein) was positively associated with prostate cancer risk, with men in the
highest quartile for ‘Western’ pattern score having an OR of 1.82 (95% CI 1.15-2.87; p for
trend=0.02) (Paper 5). The analysis of continuous nutrient intakes supported an inverse
association between prostate cancer, zinc and protein intakes.
An increased risk of prostate cancer was observed in the highest quartile of carbohydrate intake
(OR=1.44, 95% CI, 1.00-2.07; p for trend = 0.10). Some additional relationships were
suggested, including an increased risk with higher intakes of sugars and starch and a
decreased risk with increased fibre, folate and cholesterol intakes (all when analysed as
continuous variables). However, given the number of statistical test conducted, these findings
may be due to chance.

194
Table 25. Quartile cut points for energy adjusted nutrient intakes, cases and controls
Daily nutrient intake Quartiles *
1 2 3 4
Energy (kJ) 7456 9298 11550 20337
Total fat (g) 93 100 107 145
Saturated fat (g) 35 41 46 71
Polyunsaturated fat (g) 11 15 19 33
Monounsaturated fat (g) 32 35 38 59
Protein (g) 98 107 117 268
Carbohydrates (g) 229 251 270 387
Sugars (g) 89 107 125 235
Starch (g) 125 140 154 264
Fibre (g) 21 25 30 66
Beta-carotene (mg) ** 2104 2719 3471 8226
Calcium (mg) 764 898 1062 2406
Cholesterol (mg) 301 355 422 905
Folate (ug) 271 315 361 804
Iron (mg) 14.0 15.6 17.7 34.8
Magnesium (mg) 291 328 372 704
Niacin (mg) 23 26 30 69
Phosphorus (mg) 1559 1723 1876 3271
Potassium (mg) 2907 3219 3543 5940
Retinol (ug) 408 498 580 1076
Riboflavin (mg) 2.3 2.7 3.2 9.6
Sodium (mg) 2828 3087 3361 4712
Thiamin (mg) 1.7 1.9 2.3 6.4
Vitamin C (mg) 88 122 166 771
Vitamin E (mg) 6.9 7.8 8.7 14.4
Zinc (mg) 12.6 14.2 15.7 38.4
* maximum values for each quartile are shown (adjusted for energy intake).
** Beta-carotene equivalents = (beta-carotene + ½(alpha-carotene)+ ½(alpha-cryptoxanthin) +
½(beta-cryptoxanthin))
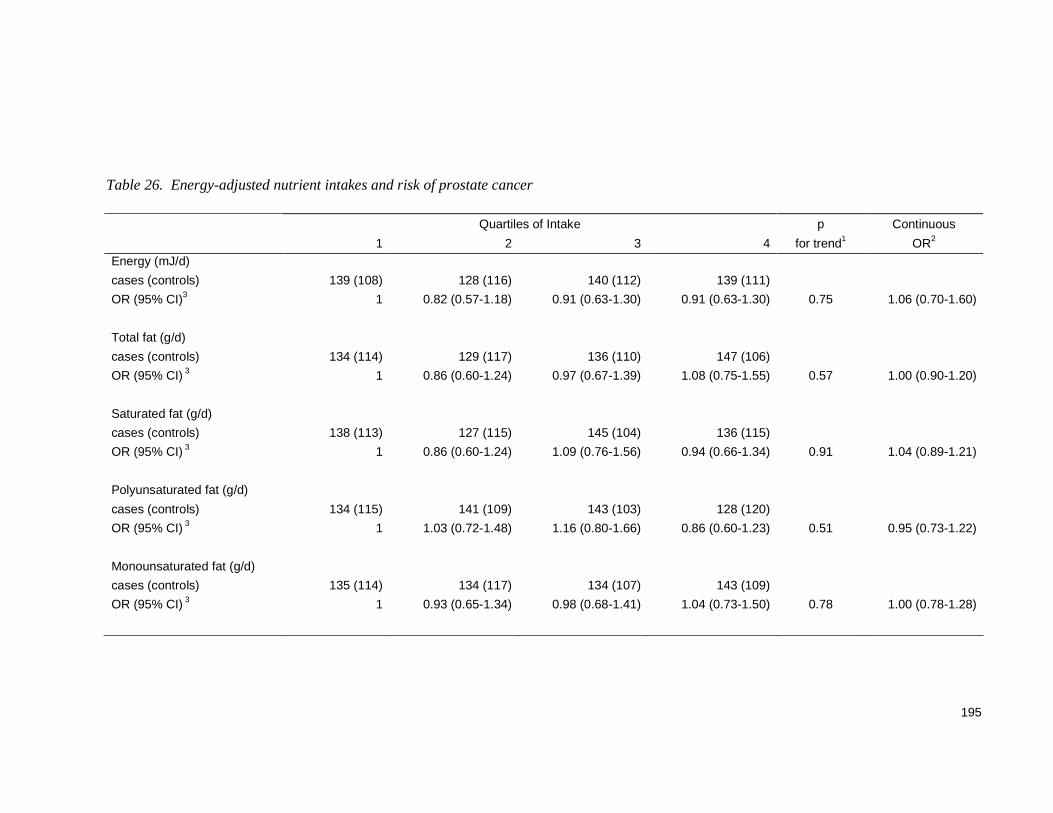
195
Table 26. Energy-adjusted nutrient intakes and risk of prostate cancer
Quartiles of Intake p Continuous
1 2 3 4 for trend1 OR2 Energy (mJ/d)
cases (controls) 139 (108) 128 (116) 140 (112) 139 (111)
OR (95% CI)3 1 0.82 (0.57-1.18) 0.91 (0.63-1.30) 0.91 (0.63-1.30) 0.75 1.06 (0.70-1.60)
Total fat (g/d)
cases (controls) 134 (114) 129 (117) 136 (110) 147 (106)
OR (95% CI) 3 1 0.86 (0.60-1.24) 0.97 (0.67-1.39) 1.08 (0.75-1.55) 0.57 1.00 (0.90-1.20)
Saturated fat (g/d)
cases (controls) 138 (113) 127 (115) 145 (104) 136 (115)
OR (95% CI) 3 1 0.86 (0.60-1.24) 1.09 (0.76-1.56) 0.94 (0.66-1.34) 0.91 1.04 (0.89-1.21)
Polyunsaturated fat (g/d)
cases (controls) 134 (115) 141 (109) 143 (103) 128 (120)
OR (95% CI) 3 1 1.03 (0.72-1.48) 1.16 (0.80-1.66) 0.86 (0.60-1.23) 0.51 0.95 (0.73-1.22)
Monounsaturated fat (g/d)
cases (controls) 135 (114) 134 (117) 134 (107) 143 (109)
OR (95% CI) 3 1 0.93 (0.65-1.34) 0.98 (0.68-1.41) 1.04 (0.73-1.50) 0.78 1.00 (0.78-1.28)

196
Table 26. Energy-adjusted nutrient intakes and risk of prostate cancer (cont'd)
Quartiles of Intake p Continuous
1 2 3 4 for trend1 OR2 Cholesterol (mg/d)
cases (controls) 144 (101) 138 (107) 134 (119) 130 (120)
OR (95% CI) 3 1 0.89 (0.62-1.30) 0.79 (0.55-1.13) 0.74 (0.52-1.07) 0.08 0.91 (0.80-1.03)4
Protein (g/d)
cases (controls) 156 (97) 133 (104) 134 (119) 123 (127)
OR (95% CI)3 1 0.76 (0.52-1.10) 0.64 (0.44-0.93) 0.55 (0.38-0.79) <0.001 0.92 (0.86-0.99)
Carbohydrate (g/d)
cases (controls) 137 (117) 131 (109) 129 (120) 149 (101)
OR (95% CI) 3 1 1.08 (0.75-1.55) 0.98 (0.68-1.40) 1.44 (1.00-2.07) 0.10 1.02 (0.98-1.06)
Sugars (g/d)
cases (controls) 132 (117) 132 (115) 144 (107) 139 (108)
OR (95% CI) 3 1 1.05 (0.73-1.51) 1.24 (0.86-1.78) 1.23 (0.85-1.77) 0.18 1.02 (0.97-1.07)
Starch (g/d)
cases (controls) 131 (120) 151 (94) 129 (119) 135 (114)
OR (95% CI) 3 1 1.49 (1.03-2.14) 1.00 (0.69-1.44) 1.14 (0.80-1.63) 0.99 1.02 (0.99-1.07)

197
Table 26. Energy-adjusted nutrient intakes and risk of prostate cancer (cont'd)
Quartiles of Intake p Continuous
1 2 3 4 for trend1 OR2 Fibre (g/d)
cases (controls)
OR (95% CI) 3 1 1.19 (0.83-1.71) 0.89 (0.62-1.28) 0.99 (0.69-1.42) 0.56 0.85 (0.71-1.02)
Beta-carotene Equiv. (mg/d)
cases (controls) 133 (112) 139 (110) 147 (101) 127 (124)
OR (95% CI) 3 1 1.10 (0.77-1.58) 1.25 (0.87-1.80) 0.86 (0.60-1.24) 0.56 0.99 (0.98-1.00)4
Retinol (ug/d)
cases (controls) 134 (112) 136 (114) 126 (120) 150 (101)
OR (95% CI) 3 1 1.01 (0.70-1.45) 0.86 (0.60-1.23) 1.23 (0.85-1.76) 0.47 1.00 (0.92-1.09)4
Folate (ug/d)
cases (controls) 146 (105) 140 (110) 130 (120) 130 (112)
OR (95% CI) 3 1 0.91 (0.63-1.32) 0.75 (0.52-1.08) 0.86 (0.60-1.24) 0.26 0.88 (0.76-1.02)4
Vitamin C (mg/d)
cases (controls) 141 (106) 131 (119) 133 (115) 141 (107)
OR (95% CI) 3 1 0.83 (0.57-1.21) 0.90 (0.62-1.30) 1.01 (0.70-1.46) 0.83 0.94 (0.78-1.13) 4

198
Table 26. Energy-adjusted nutrient intakes and risk of prostate cancer (cont'd)
Quartiles of Intake p Continuous
1 2 3 4 for trend 1 OR 2 Vitamin E (mg/d)
cases (controls) 129 (124) 146 (106) 143 (98) 128 (119)
OR (95% CI) 3 1 1.29 (0.90-1.85) 1.41 (0.98-2.02) 1.00 (0.70-1.44) 0.91 0.85 (0.32-1.92)
Calcium (mg/d)
cases (controls) 138 (108) 138 (109) 140 (113) 130 (117)
OR (95% CI) 3 1 0.96 (0.70-1.38) 0.96 (0.67-1.38) 0.83 (0.58-1.19) 0.32 0.96 (0.91-1.01)4
Zinc (mg/d)
cases (controls)
OR (95% CI) 3 1 0.83 (0.57-1.20) 0.66 (0.46-0.94) 0.57 (0.40-0.82) <0.001 0.59 (0.37-0.92)
1Obtained by analysing quartile of nutrient intake as a continuous variable;
2 Obtained by analysing nutrient intake as a continuous variable (OR associated with 10 unit/day change in intake);
3 Obtained from a multivariate unconditional logistic regression model adjusted for age, energy intake, family history and BMI at time of study;
4 OR associated with 100 unit/day change in intake;

199
Nutrient patterns and prostate cancer risk
Three independent nutrient patterns were identified in the factor analysis (Table 27). Nutrient
pattern 1 was positively loaded for protein, zinc, fibre, folate and other B vitamins, iron and
magnesium, and negatively loaded for total fat, saturated fat, and retinol. Nutrient pattern 2 was
characterised by high intakes of protein, zinc, total fat, saturated fat, cholesterol,
monounsaturated fat and low intakes of fibre, folate, vitamin C, starch, carbohydrates and
sugars. Nutrient pattern 3 consisted of high fibre, folate, magnesium, vitamin C, calcium,
polyunsaturated fat, vitamin E and beta-carotene intakes and low intakes of cholesterol. Table
27 shows how these nutrient intake patterns correlate modestly with food intake patterns
previously identified in this study (Paper 5). Nutrient pattern 1 correlated with the
‘Health-conscious’ pattern, nutrient pattern 2 with the ‘Western’ and nutrient pattern 3 with
‘Vegetable’ pattern. Mean nutrient intakes and personal characteristics of participants
according to each quartile of the nutrient patterns is presented in Appendix 7. An increasing
score for nutrient pattern 1 was associated with fewer smokers and a greater proportion of men
who undertook physical activity. The reverse was true for nutrient pattern 2.
A higher score for nutrient pattern 1 was statistically significant and inversely associated with
prostate cancer risk when analysed according to quartiles (OR=0.62, 95% CI, 0.43-0.90); p for
trend=0.008) and as a continuous variable (OR=0.85, 95% CI, 0.74-0.97) (Table 28). Nutrient
patterns 2 and 3 did not appear to be associated with prostate cancer risk.

200
Table 27. Nutrient patterns and factor loadings
Nutrient Pattern 1 Nutrient Pattern 2 Nutrient Pattern 3
Factor loadings 1,2 Energy 0.03 -0.02 0.10 Total fat -0.37 0.88 0.01 Saturated fat -0.37 0.62 -0.22 Monounsaturated fat -0.21 0.85 -0.03 Cholesterol 0.06 0.66 -0.29 Polyunsaturated fat -0.06 0.06 0.44 Protein 0.66 0.57 -0.21 Carbohydrates -0.06 -0.98 0.10 Sugars -0.12 -0.63 0.25 Starch 0.05 -0.61 -0.15 Fibre 0.61 -0.42 0.43 Folate 0.67 -0.37 0.44 Thiamin 0.67 -0.25 0.22 Riboflavin 0.75 -0.12 0.21 Niacin 0.91 -0.03 0.06 Retinol -0.48 0.34 0.36 Beta-carotene 3 0.20 -0.12 0.71 Vitamin C 0.20 -0.30 0.39 Vitamin E 0.09 -0.20 0.66 Calcium 0.19 -0.12 0.34 Iron 0.77 -0.14 0.10 Magnesium 0.77 -0.28 0.37 Phosphorus 0.76 0.06 0.10 Potassium 0.62 -0.15 0.52 Sodium 0.41 0.28 -0.15 Zinc 0.58 0.58 -0.15
Standard deviation 0.97 1.00 0.92 % Total variance 28.9 22.0 13.6 Pearson’s r 4 Vegetable pattern 0.19 -0.22 0.53 Western pattern -0.23 0.38 -0.30 Health-conscious pattern 0.36 * 0.04 * -0.03
1 Nutrients with loadings >|0.30| are shown in bold. 2 All nutrient intakes are adjusted for energy using the residual method (12)
3 Beta-carotene equivalents
4 All p<0.0001 except for *

201
Table 28. Nutrient patterns and prostate cancer risk
Quartiles of Nutrient Pattern Score p for trend 1 Continuous OR 2
1 2 3 4
Nutrient Pattern 1
OR (95% CI) 3 1 0.66 (0.45-0.96) 0.54 (0.37-0.79) 0.62 (0.43-0.90) < 0.01 0.85 (0.74-0.97)
Nutrient Pattern 2
OR (95% CI) 3 1 0.86 (0.59-1.24) 0.85 (0.59-1.24) 0.84 (0.58-1.21) 0.30 0.92 (0.81-1.05)
Nutrient Pattern 3
OR (95% CI) 3 1 1.11 (0.77-1.60) 1.42 (0.98-2.04) 0.88 (0.61-1.27) 0.76 0.89 (0.78-1.03)
1 Obtained by analysing quartile of nutrient pattern score as a continuous variable; 2 Obtained by analysing nutrient pattern score as a continuous variable (OR associated with unit change in score for nutrient factor); 3 Obtained from a multivariate unconditional logistic regression model adjusted for age, energy intake, family history and BMI at time of study.

202
Discussion
In this study we have found that when individual nutrient intakes are analysed separately,
increasing zinc and protein intakes appear to be inversely associated with prostate cancer risk.
However, using the same data in a previous analysis, we have shown zinc and protein intakes
to be positively correlated with a ‘Western’ dietary pattern, which significantly increased prostate
cancer risk (Paper 5). To investigate this inconsistency, we analysed patterns in nutrient
intakes using principal components analysis.
Two nutrient intake patterns emerged in this study that included both zinc and protein intakes as
major contributors. Nutrient pattern 1, characterised by high protein and zinc intakes plus other
micronutrients, but low intakes of total and saturated fat, was significantly and inversely
associated with prostate cancer risk. Whereas nutrient pattern 2, loaded with high protein and
zinc intakes as well as high intakes of total and saturated fat and low intakes of fibre, folate and
vitamin C, was not associated with prostate cancer risk. This suggests that if zinc and protein
intakes are to confer a protective effect, they might only do so when consumed in a diet that is
also low in total and saturated fat and rich in fibre, folate, B vitamins, iron and magnesium, as
characterised by nutrient pattern 1. In this pattern, the major sources of zinc and protein might
include legumes, nuts and cereals with less emphasis on meats, as in a Mediterranean-style
diet (16, 17). Nutrient pattern 1 correlated moderately with the ‘Health-conscious’ food pattern,
which included many elements of a Mediterranean diet (Paper 5). Alternatively, nutrient pattern
1 may be a marker for other lifestyle factors that affect prostate cancer risk however, this is less
likely as we were able to control for many potential confounders in our modelling. Therefore,
these findings suggest that, without considering the total diet, recommendations to increase zinc
and protein intakes to decrease prostate cancer risk could be misleading.
A similar inconsistency was reported in a case-control study of lung cancer risk that examined
food patterns (18). A ‘sweet’ pattern (consisting of tea, sweet sandwich spread, sweets, cakes,
cookies and strawberries) was inversely associated with risk. However, intakes of
disaccharides and monosaccharides were not associated with lung cancer, indicating that other
components or the combination of foods in the sweet pattern, or residual confounding may be
influencing lung cancer risk, rather than sugars per se (18).

203
Having examined nutrient patterns and food patterns in the same sample, we have seen an
equal number of important patterns emerge, but the nutrient patterns explained a greater
amount of variation in intakes. The food and nutrient intake patterns correlate moderately but
not fully, with each other. Differences in composition and relationships with outcomes are likely
to exist between nutrient patterns and food patterns, as they are different entities. Foods
contribute a vast array of nutrients to make up total nutrient intakes. Therefore, nutrient pattern
analyses examine the cumulative dietary ‘endpoints’ (total nutrient intakes) whereas food
patterns examine the ‘building blocks’ of total nutrient intake/diet. The differences might also be
explained by errors in food composition data or calculations used to estimate nutrient intakes
from food frequency questionnaires.
Although the use of food patterns is increasing in nutritional epidemiology, very few studies
have examined patterns in nutrient intakes. Palli and colleagues (19) reported that two nutrient
intake patterns, ‘traditional’ and ‘vitamin rich’, were strongly associated with gastric cancer risk
in a case-control study conducted in Italy. Both food and nutrient pattern analyses serve a
purpose. Dietary patterns based on foods are easier to convert into public health messages (4),
whereas the wide scale promotion of selected nutrients is limited by the target audience’s
knowledge of appropriate sources. Food patterns may also involve less measurement error
than nutrient patterns, as assumptions used in the calculation of nutrient intakes are not
required. However, analyses of nutrient patterns are advantageous for the direct identification
of nutrients that may be important in the disease process, which can lead to mechanistic
studies. It is likely that a number of different approaches are needed for a thorough assessment
of any diet-disease relationship.
Many studies have demonstrated that dietary patterns identified using factor analysis can
differentially predict disease risk (15) including prostate cancer (14). However, factor analysis
has limitations, as it requires some subjectivity in decisions regarding the number of factors to
retain (15) and dose-response effects may be difficult to interpret. The naming of dietary
patterns is also subject to different interpretations (15). The largest advantage is that dietary
patterns take account of total diet. Nevertheless, sensitivity analysis have shown this method to
be robust (13, 20) (Paper 5). Dietary patterns based on factor analysis have been deemed valid

204
in comparison to diet records (3, 21) and blood biomarkers (21) and repeatable over short (3)
and long time periods (22).
The epidemiological evidence relating to dietary zinc intake and prostate cancer is limited and
controversial. While some studies suggest a decreased risk with higher zinc intake (23-25),
others report increased risks (16, 26-28). Total zinc intake including supplements (but not
dietary zinc) has been statistically and significantly associated with prostate cancer in older men
(26) and similarly, dose and duration of zinc supplementation with advanced prostate cancer in
the Health Professionals Follow Up Study (29). Yet, zinc is an important trace element actively
taken up by the healthy prostate gland and prostate zinc levels are known to decrease with
prostate carcinogenesis (30). In-vitro, zinc has been shown to have anti-tumor effects in the
prostate (30).
Protein intake has not been clearly linked with prostate cancer (28, 31-34), although an
increased risk was reported for high protein intake among black men in one study (35).
However, it may be that protein acts as a marker for zinc intake. In Australian adult males, meat
and poultry form the largest source of dietary zinc (39%) and protein (37%) (36), and zinc intake
was strongly correlated with protein intake in this study (r=0.86).
This study supports a nutrient intake pattern that is characterised by increased intakes of zinc,
protein, fibre, folate, magnesium, iron and B vitamins and low intakes of fat and saturated fat,
which correlates moderately with a previously identified ‘Health-conscious’ food pattern, to
reduce prostate cancer risk. This study also illustrates how the analysis of individual nutrients
may not provide the best information regarding diet-disease relationships, owing to the total
effect of diet not being taken into account. Public health messages about reducing prostate
cancer risk may need to include the whole dietary context, not just information about a small
number of nutrients.

205
References
1. Hu FB. Dietary pattern analysis: a new direction in nutritional epidemiology. Curr Opinion
Lipidol. 2002;13:3-9.
2. Jacques PF, Tucker KL. Are dietary patterns useful for understanding the role of diet in
chronic disease? Am J Clin Nutr. 2001;73:1-2.
3. Khani BR, Ye W, Terry P, Wolk A. Reproducibility and validity of major dietary patterns
among Swedish women assessed with a food-frequency questionnaire. J Nutr.
2004;134:1541-5.
4. Hu FB, Rimm EB, Stampfer MJ, Ascherio A, Spiegelman D, Willett WC. Prospective
study of major dietary patterns and risk of coronary heart disease in men. Am J Clin Nutr.
2000;72:912-21.
5. Ireland P, Jolley D, Giles GG. Development of the Melbourne FFQ: a food frequency
questionnaire for use in an Australian prospective study involving an ethnically diverse
cohort. Asia Pac J Clin Nutr. 1994;3:19-31.
6. Cancer Epidemiology Centre, Cancer Council of Victoria (Australia). Nutritional
Assessment Service - Food Frequency Questionnaire. [Website] 2007 [cited 17 July
2007]; Available from: http://www.cancervic.org.au/about-our-research/our-research-
centres/cancer_epidemiology_centre/nutritional_assessment_services
7. Food Standards Australia and New Zealand (FSANZ). NUTTAB95. [Database] 1995
Canberra: Commonwealth Government of Australia.
8. Holland B, Welch AA, Unwin ID, Buss DH, Paul AA, Southgate DAT. McCance and
Widdowson's The Composition of Foods. 5 ed. Cambridge: Royal Society of Chemistry;
1993.
9. Fritschi L, Glass D, Tabrizi J, Leavy JE, Ambrosini GL. Occupational risk factors for
prostate cancer and benign prostatic hyperplasia: A case-control study in Western
Australia. Occup Environ Med. 2006;64:60-5.
10. Leavy J, Ambrosini GL, Fritschi L. Vietnam military service history and prostate cancer.
BMC Public Health; 2006;6:75.
11. SAS. SAS for Windows. 9.1.3 ed. Cary, NC, USA: SAS Institute Incorporated; 2002-
2003.

206
12. Willett W, Stampfer M. Total energy intake: Implications for epidemiologic analyses. Am
J Epidemiol. 1986;124:17-27.
13. Tseng M, Breslow RA, De Vellis RF, Ziegler RG. Dietary patterns and prostate cancer
risk in the National Health and Nutrition Examination Survey Epidemiological Follow Up
Study cohort. Cancer Epidemiol Biomarkers Prev. 2004;13:71-7.
14. Walker M, Aronson KJ, King W, Wilson JWL, Fan W, Heaton JPW, et al. Dietary patterns
and risk of prostate cancer in Ontario, Canada. Int J Cancer. 2005;116:592-8.
15. Newby PK, Tucker KL. Empirically derived eating patterns using factor or cluster
analysis: a review. Nutr Rev. 2004;62:177-203.
16. Gallus S, Foschi R, Negri E, Talamini R, Franceschi S, Montella M, et al. Dietary zinc and
prostate cancer risk: a case-control study from Italy. Euro Urol. in press
DOI:10.1016/j.eururo.2007.01.094
17. Willett WC, Sacks F, Trichopoulou A, Drescher G, Ferro-Luzzi A, Helsing E, et al.
Mediterranean diet pyramid: a cultural model for healthy eating. Am J Clin Nutr. 1995
June 1, 1995;61:1402S-6.
18. Balder HF, Goldbohm RA, van den Brandt PA. Dietary patterns associated with male
lung cancer risk in the Netherlands Cohort Study. Cancer Epidemiol Biomarkers Prev.
2005 February 1, 2005;14:483-90.
19. Palli D, Russo A, Decarli A. Dietary patterns, nutrient intake and gastric cancer in a high-
risk area of Italy. Cancer Causes Control. 2001;12:163-72.
20. Balder HF, Virtanen M, Brants HAM, Krogh V, Dixon LB, Tan F, et al. Common and
country-specific dietary patterns in four European cohort studies. J Nutr.
2003;133:4246-51.
21. Hu FB, Rimm E, Smith-Warner SA, Feskaknich D, Stampfer MJ, Ascherio A, et al.
Reproducibility and validity of dietary patterns assessed with a food-frequency
questionnaire. Am J Clin Nutr. 1999;69:243-9.
22. Newby PK, Weismayer C, Akesson A, Tucker KL, Wolk A. Long-term stability of food
patterns identified by use of factor analysis among Swedish women. J Nutr.
2006;136:626-33.
23. Key TJ, Silcocks PB, Davey GK. A case control study of diet and prostate cancer. Br J
Cancer. 1997;76:678-87.

207
24. Platz EA, Helzlsouer KJ, S.C. H, Morris JS, Baskett CK, Comstock GW. Prediagnostic
toenail cadmium and zinc and subsequent prostate cancer risk. The Prostate.
2002;52:288-96.
25. Vlajinac HD, Marinkovic JM, Ilic MD, Kocev NI. Diet and prostate cancer: a case-control
study. Eur J Cancer. 1997;33:101-7.
26. Kolonel LN, Yoshizawa CN, Hankin JH. Diet and prostatic cancer: a case-control study in
Hawaii. Am J Epidemiol. 1988 May 1, 1988;127:999-1012.
27. West DW, Slattery ML, Robison LM, French TK, Mahoney AW. Adult dietary intake and
prostate cancer risk in Utah: a case-control study with special emphasis on aggressive
tumors. Cancer Causes Control. 1991;2:85-94.
28. Andersson SO, Wolk A, Bergstrom R, Giovannucci E, Lindgren C, Baron J, et al. Energy,
nutrient intake and prostate cancer risk: a population-based case-control study in
Sweden. Int J Cancer. 1996;68:716-22.
29. Leitzmann MF, Stampfer MJ, Wu K, Colditz GA, Willett WC, Giovannucci EL. Zinc
supplement use and risk of prostate cancer. J Natl Cancer Inst. 2003;95:1004-7.
30. Costello L, Franklin R. The clinical relevance of the metabolism of prostate cancer; zinc
and tumor suppression: connecting the dots. Molecular Cancer. 2006;5:17.
31. Deneo-Pellegrini H, De Stefani E, Ronco A, Mendilaharsu M. Foods, nutrients and
prostate cancer: a case-control study in Uruguay. Br J Cancer. 1999;80:591-7.
32. Chan J, Pietinen P, Virtanen M, Malila N, Tangrea J, Albanes D, et al. Diet and prostate
cancer risk in a cohort of smokers, with a specific focus on calcium and phosphorus
(Finland). Cancer Causes Control. 2000;11:859-67.
33. McCann SE, Ambrosone CB, Moysich KB, Brasure J, Marshall JR, Freudenheim JL, et
al. Intakes of selected nutrients, foods, and phytochemicals and prostate cancer risk in
Western New York. Nutr Cancer. 2005;53:33-41.
34. Bidoli E, Talamini R, Bosetti C, Negri E, Maruzzi D, Montella M, et al. Macronutrients,
fatty acids, cholesterol and prostate cancer risk. Ann Oncol. 2005;16:152-7.
35. Hayes RB, Ziegler RG, Gridley G, Swanson C, Greenberg RS, Swanson GM, et al.
Dietary factors and risks for prostate cancer among blacks and whites in the United
States. Cancer Epidemiol Biomarkers Prev. 1999;8:25-34.
36. Australian Bureau of Statistics (ABS). National Nutrition Survey. Nutrient intakes and
physical measurements, Australia 1995. Canberra: Australian Bureau of Statistics; 1998.

208
CHAPTER FOUR: DISCUSSION

209
Summary
Appendix 8 provides a summary of diet-disease relationships observed in the original work for
this thesis. The findings suggest that increased intakes of vitamin C-rich vegetables, peppers,
broccoli, and zinc may decrease prostate cancer risk (Papers 1 and 6). In addition, a nutrient
intake pattern high in zinc, protein, fibre, folate and other B vitamins, iron and magnesium, and
low in total fat and saturated fat is associated with a reduced risk of prostate cancer (Paper 6).
On the other hand, a higher score for a ‘Western’ dietary pattern, characterised by high intakes
of red meat, processed meat, full cream milk, fried fish, chips, crisps, white bread, cakes and full
alcohol beer, may increase prostate cancer risk (Paper 5). These findings generally support the
literature reviewed earlier (Chapter 2).
Some similarities were seen with surgically-treated benign prostatic hyperplasia (BPH).
A decreased risk was associated with higher intakes of total, dark yellow and other vegetables
excluding cruciferous vegetables and tomatoes (Paper 4), and a higher score for a ‘Vegetable’
dietary pattern (Paper 3). In addition, the risk of BPH decreased with higher intakes of zinc and
beta carotene, and with tofu consumption (Paper 4). High intakes of sugars, high fat dairy
products and retinol were associated with an increase in BPH risk (Paper 4). An increased risk
was suggested with higher calcium intake (Paper 4).
Papers 3 and 5 show statistically robust associations between empirically derived food-based
dietary patterns, prostate cancer risk and BPH risk. These associations outweighed those
observed for individual nutrients and foods in the case of prostate cancer. Whereas for BPH,
the ORs were slightly stronger for some individual foods and nutrients e.g. dark yellow
vegetables and zinc. Therefore, the reduction in risk for BPH associated with the vegetable
dietary pattern may be explained in part, by dark yellow vegetable intake. However, the
analysis of nutrient patterns in Paper 6 demonstrates the value in analysing the whole diet
rather than individual nutrients separately. In Paper 6, both zinc and protein intakes appeared
protective for prostate cancer when analysed as individual nutrients. Yet, the two nutrient
patterns identified that were high in zinc and protein but varying in other nutrients, had different
associations with prostate cancer risk (Paper 6).

210
Papers 3 to 6 utilise dietary intakes recalled from ten years earlier using a modified food
frequency questionnaire (FFQ). The use of remote dietary recall is justified in Paper 2, where
the modified FFQ was compared to a 28-day dietary record. Using limits-of-agreement
analysis, the modified FFQ was found to be as reliable as another frequently used Australian
FFQ designed to estimate recent diet.
In summary, the following hypotheses were supported by this work:
Hypothesis 1 for prostate cancer, but not BPH.
Hypothesis 2 for BPH, but not prostate cancer.
Hypothesis 3 for BPH and partially for prostate cancer, excluding fruit.
Hypothesis 4 was not supported for BPH, but indirectly supported for prostate cancer
(Nutrient Pattern 1 was low in fat and calcium in Paper 6).
Hypothesis 5 for prostate cancer, but not BPH
Hypothesis 6.
Western Diets, Prostate Cancer and BPH
From the above, it can be surmised that a western dietary pattern increases prostate cancer
risk. Similarly, the risk of BPH may be increased by components of a western diet, i.e.
increased sugars and high fat dairy products. Foods and nutrients that tend to be lacking in
western diets i.e. vegetables, folate and fibre, may provide protection against these conditions.
Although western diets are rich in energy and meat products, inadequate zinc intakes are of
concern among men living in countries such as Australia (1) and the US (2) where western diets
are commonplace. This is possibly due to the over consumption of refined foods or poor zinc
bioavailability. The Australian recommended dietary intake (RDI) for zinc was recently
increased from 12 mg to 14mg for adult men, partly in recognition that men lose significant
amounts of zinc in semen (3).

211
Diet and Inflammation in Prostate Carcinogenesis and BPH
The dietary risk factors highlighted above indirectly support the recently hypothesised role for
chronic inflammation in the development of both prostate cancer (4) and BPH (5). Western
dietary patterns have been positively associated with biomarkers for inflammation and metabolic
syndrome in several large studies (6-8). It has also been suggested that heterocyclic amines
consumed in charred or well cooked meat may contribute to chronic inflammation in the prostate
gland (4).
‘Prudent’, ‘healthy’ and ‘vegetable-based’ dietary patterns as well as intakes of fruits and
vegetables have been associated with lower levels of biomarkers for inflammation (6, 8-11).
Fruit and vegetables may provide anti-inflammatory agents via their antioxidant content e.g.
beta carotene, lycopene and vitamin C, which are capable of sequestering free radicals
produced by inflammatory processes (12).
Although there is evidence of direct effects from diet on chronic inflammation, relatively few
studies have examined prostate cancer or BPH risk according to biomarkers of inflammation.
Of these, the majority have studied a single biomarker (CRP) with mostly null results (13-16).
A Special Role for Zinc
Zinc has various roles in the body including an indirect antioxidant effect via its key contribution
to superoxide dismutase and various metallothionein proteins (17). However, zinc has been
shown to act specifically in the prostate gland as a ‘tumor suppressor’ via its apoptotic and
anti-tumor migration effects (18). Furthermore, expression of ZIP1, which transports zinc into
the prostate, is down-regulated in prostate carcinogenesis, and has therefore been suggested
as a ‘tumor suppressor gene’ (18). It may be that insufficient zinc intake and/or genetic
alterations in ZIP1, act as contributors to prostate carcinogenesis in addition to or in concert
with, chronic inflammation. However, although there is considerable in-vitro evidence of a role
for zinc in the prevention of prostate cancer, the epidemiological data is conflicting and includes
reports of pro-carcinogenic effects associated with high zinc intakes. The reported increases in
prostate zinc levels in BPH, coupled with a purported protective effect from dietary zinc reported
212
here, is also intriguing. However, few studies have examined dietary zinc intake in relation to
BPH.
Limitations of the Thesis
Human nutrition and its effects on health is a vast and complex area in science. It is beyond the
scope of this thesis to examine every potential dietary risk factor for prostate cancer and BPH.
Specific hypotheses have been stated (Chapter 2) so as to take a focussed approach. In doing
so however, it is possible that other important dietary risk factors not examined in this thesis
may exist.
This investigation into diet, prostate cancer and BPH is based on the existing literature and
original work. The limitations of the existing epidemiological research have been considered in
Chapter 2. The original work for this thesis is based on two studies. The first (Vitamin A
Program) was a nested case-control study of prostate cancer from a chemoprevention program
using vitamin A supplements (Paper 1). Although relatively small, this study benefited from
prospective follow up of more than 12 years. Dietary intakes were estimated before the onset of
disease and the main outcome of interest was not prostate cancer, reducing the likelihood of
recall bias.
The second study (Prostate Health Study) was a population-based case-control study of
prostate cancer and BPH that utilised eligible cases occurring in Western Australia over a two
year period (Papers 3 to 6). Various potential confounders were considered, including family
history of prostate cancer, physical activity, male pattern baldness, body mass index, vasectomy
status, and considered urinary symptoms and tumour grade. Case-control studies are more
susceptible to the effects of recall bias, whereby the subject’s disease status influences
responses to questions about exposures. However, in using estimates of dietary intake and
other covariates 10 years prior, recall bias may have been reduced in this study.
In any epidemiological study, those who agree to participate may be different from those who do
not, in ways that are related to factors influencing the outcome of interest e.g. age, smoking
status, education or socioeconomic level (19). A poor response rate suggests selection bias,
213
which can reduce the internal and external validity of a study (20, 21), but does not make
selection bias inevitable. A low response fraction will bias a case-control study’s OR only when
participation is dependent on both the exposure and outcome of interest (19) however these
may in effect, cancel each other out (20). Although some response fractions in the Prostate
Health Study were less than desirable, attempts to investigate selection bias (although limited
due to the nature of population-based registry data) did not suggest this. It is very likely that the
topic of the study, namely prostate health and its inferences with sexual health, contributed to
the decreased response fractions. Inconsistencies in the reporting of response fractions,
including a complete lack of information in a significant proportion of papers, is a problem in
epidemiology (21) and makes proper comparisons between studies difficult. Notwithstanding
this, a sharp decline in participation in population-based case-control studies, particularly among
controls, has been identified over the past three decades especially since 1990 (21). Therefore,
strategies that facilitate participation are needed as an integral part of health research design
(22).
Clinicians are not always in agreement over the different definitions of BPH, and the use of
surgically-treated BPH as a case definition in the Prostate Health Study has been justified
(Paper 3). However, it should be emphasised that the results relating to BPH in the Prostate
Health Study may only be applied to surgically-treated BPH and not all BPH.
Food frequency questionnaires (FFQs) were used in both studies contributing to the original
work for this thesis. The difficulties in measuring dietary intake are well known in epidemiology,
and although FFQs are widely used, they have been criticised for their measurement error (23,
24). However, FFQs currently remain as one of the best available dietary tools for large
epidemiological studies. Both FFQs used in this thesis were tested for their reliability compared
to a 28-day diet record (25) (Paper 2), however it must be acknowledged that these reliability
analyses pertain to nutrient intakes and the reliability of food intakes may differ.
The arbitrary naming of dietary patterns is subject to interpretation. The names of the dietary
patterns studied here were based on the most important factor loadings (i.e. loadings ± 0.30 or
more). For example, the ‘Health-conscious’ pattern includes components common to a
Mediterranean-style diet such as rice, pasta, chicken, fish, legumes, ricotta cheese and wine.

214
However, it was not labelled ‘Mediterranean’ as it included tofu, and was not positively loaded
for white bread, nor did it correlate with monounsaturated fat intake (the latter two being key
components of a Mediterranean-type diet (26)). Differences in the naming of dietary patterns
may hinder direct comparisons between studies.
Original Contributions of the Thesis
In considering nutrient intakes, food intakes, and dietary patterns, this original work adds
several complementary aspects to the total evidence relating to dietary intakes as risk factors
for prostate cancer and BPH. Few studies have examined dietary risk factors for BPH, and this
thesis provides one of the first studies on empirically derived dietary patterns and BPH.
Two important methodological issues in nutritional epidemiology have been examined in this
thesis. Empirically derived dietary patterns offer an holistic and statistically sound alternative to
the traditional reductionist approach of examining individual nutrients. A unique comparison of
prostate cancer risk according to individual nutrient intakes versus patterns in nutrient intakes is
presented, highlighting some disparities between these two methods of analysis (Paper 6).
Paper 6 is one of few studies to consider patterns in nutrient intakes to date.
The reliability of remote dietary intake has not been studied widely, and its inclusion in this
thesis adds a novel aspect. This research shows that 10 year recall may be as reliable as
recent dietary recall. Remote dietary intake is wholly relevant to the study of chronic disease
and is more likely to be related to the initiation or progression of a recently diagnosed chronic
disease than recent diet, which is commonly used in epidemiology.

215
Conclusions and Further Research
Although they differ in terms of their pathology, there appear to be similarities in the dietary risk
factors for prostate cancer and BPH. Aspects of a western dietary pattern appear to influence
both prostate cancer and BPH risk, independent of western lifestyle factors such as physical
activity, smoking, and body mass index. Based on the original work presented in this thesis and
the existing literature, the following are suggested to further develop understanding in this area:
The role of inflammation in prostate cancer and BPH. Identifying markers for inflammation in
the prostate or alternative markers for systemic inflammation (besides CRP) would be extremely
useful. Prospective epidemiological studies on adequate numbers of men are needed to
examine various biomarkers for inflammation and the risk of prostate cancer and BPH.
Complementing this would be experimental studies investigating how dietary intakes affect
biomarkers for systemic inflammation or more particularly, inflammation in the prostate.
The role of zinc in prostate health. Zinc appears critical to the prostate gland, yet there remain
unresolved differences between clinical and epidemiological studies of zinc, prostate cancer and
BPH. The amount of dietary zinc necessary for optimum prostate health, particularly with aging,
is unclear. Controlled clinical trials of zinc supplements and prostate cancer are needed, as
very few have been conducted to date (27, 28) . The role of zinc in BPH has not been explored
as extensively, and deserves further consideration.
Dietary patterns in nutritional epidemiology. This is still a relatively new area in nutritional
epidemiology that offers an exciting alternative to traditional approaches. There is scope for
further exploration into the methods used to derive empirical dietary patterns and a need for
more studies on the reliability and reproducibility of dietary patterns. The study of patterns in
nutrient intakes in particular, deserves further exploration.
Remote dietary intake and chronic disease. Where prospective studies are not possible, the
estimation of remote dietary intake rather than recent dietary intake ought to be considered
when studying diet and chronic disease relationships. More studies examining the reliability of
remote dietary intake might support this.

216
References
1. Australian Bureau of Statistics (ABS). National Nutrition Survey. Nutrient intakes and
physical measurements, Australia 1995. Canberra: ABS; 1998.
2. Briefel RR, Bialostosky K, Kennedy-Stephenson J, McDowell MA, Ervin RB, Wright JD.
Zinc intake of the U.S. population: findings from the Third National Health and Nutrition
Examination Survey, 1988-1994. J Nutr. 2000;130:1367S-73.
3. Commonwealth Department of Health and Ageing (Australia), the National Health and
Medical Research Council (Australia) and the Ministry of Health (New Zealand).
Nutrient reference values for Australia and New Zealand including recommended
dietary intakes. Canberra: Commonwealth of Australia; 2006.
4. De Marzo AM, Platz EA, Sutcliffe S, Xu J, Gronberg H, Drake CG, et al. Inflammation in
prostate carcinogenesis. Nat Rev Cancer. 2007;7:256-69.
5. Kramer G, Mitteregger D, Marberger M. Is Benign Prostatic Hyperplasia (BPH) an
immune inflammatory disease? Europ Urol. 2007;51:1202-16.
6. Fung T, Rimm E, Spiegelman D, Rifai N, Tofler G, Willett W, et al. Association between
dietary patterns and plasma biomarkers of obesity and cardiovascular disease risk. Am
J Clin Nutr. 2001;73:61-7.
7. Lopez-Garcia E, Schulze MB, Fung TT, Meigs JB, Rifai N, Manson JE, et al. Major
dietary patterns are related to plasma concentrations of markers of inflammation and
endothelial dysfunction. Am J Clin Nutr. 2004;80:1029-35.
8. Nettleton JA, Steffen LM, Mayer-Davis EJ, Jenny NS, Jiang R, Herrington DM, et al.
Dietary patterns are associated with biochemical markers of inflammation and
endothelial activation in the Multi-Ethnic Study of Atherosclerosis (MESA). Am J Clin
Nutr. 2006;83:1369-79.
9. Ford ES, Mokdad AH, Liu S. Healthy Eating Index and C-reactive protein concentration:
findings from the National Health and Nutrition Examination Survey III, 1988-1994. Eur
J Clin Nutr. 2004;59:278-83.
10. Giugliano D, Ceriello A, Esposito K. The effects of diet on inflammation: emphasis on
the metabolic syndrome. J Am Coll Cardiol. 2006;48:677-85.

217
11. Gao X, Bermudez OI, Tucker KL. Plasma C-reactive protein and homocysteine
concentrations are related to frequent fruit and vegetable intake in Hispanic and Non-
Hispanic white elders. J Nutr. 2004;134:913-8.
12. Kontogianni MD, Zampelas A, Tsigos C. Nutrition and inflammatory load. Ann N Y Acad
Sci. 2006;1083:214-38.
13. Helzlsouer KJ, Erlinger TP, Platz EA. C-reactive protein levels and subsequent cancer
outcomes: results from a prospective cohort study. Eur J Cancer. 2006;42:704-7.
14. Siemes C, Visser LE, Coebergh J-WW, Splinter TAW, Witteman JCM, Uitterlinden AG,
et al. C-reactive protein levels, variation in the C-reactive protein gene, and cancer risk:
The Rotterdam Study. J Clin Oncol. 2006;24:5216-22.
15. Il'yasova D, Colbert LH, Harris TB, Newman AB, Bauer DC, Satterfield S, et al.
Circulating levels of inflammatory markers and cancer risk in the Health, Aging and
Body Composition Cohort. Cancer Epidemiol Biomarkers Prev. 2005;14:2413-8.
16. Platz EA, De Marzo AM, Erlinger TP, Visvanathan NRK, Hoffman SC, Helzlsouer KJ.
No association between pre-diagnostic plasma C-reactive protein concentration and
subsequent prostate cancer. The Prostate. 2004;59:393-400.
17. Smolin LA, Grosvenor MB. The Trace Elements. In: Nutrition Science and
Applications. Hoboken, NJ, USA: John Wiley and Sons Inc.; 2007. pp458-95.
18. Costello L, Franklin R. The clinical relevance of the metabolism of prostate cancer; zinc
and tumor suppression: connecting the dots. Molec Cancer. 2006;5:17.
19. Richiardi L, Boffetta P, Merletti F. Analysis of nonresponse bias in a population-based
case-control study on lung cancer. J Clin Epidemiol. 2002;55:1033-40.
20. Stang A. Editorial: Nonresponse research – an underdeveloped field in epidemiology.
Eur J Epidemiol. 2003;18:929-32.
21. Morton LM, Cahill J, Hartge P. Reporting participation in epidemiologic studies: a survey
of practice. Am J Epidemiol. 2006;163:197-203.
22. Edwards P, Roberts I, Clarke M, DiGuiseppi C, Pratap S, Wentz R, et al. Increasing
response rates to postal questionnaires: systematic review. BMJ. 2002;324:1183-.
23. Sempos C. Invited commentary: Some limitations of semi-quantitative food frequency
questionnaires. Am J Epidemiol. 1992;135:1127-132.
24. Byers T. Food frequency dietary assessment: how bad is good enough ? Am J
Epidemiol. 2001;154:1087-8.

218
25. Ambrosini G, Mackerras D, de Klerk N, Musk A. Comparison of an Australian food
frequency questionnaire to diet records: implications for nutrition surveillance. Public
Health Nutr. 2003;6:415-22.
26. Willett WC, Sacks F, Trichopoulou A, Drescher G, Ferro-Luzzi A, Helsing E, et al.
Mediterranean diet pyramid: a cultural model for healthy eating. Am J Clin Nutr.
1995;61:1402S-6.
27. Meyer F, Galan P, Douville P, Bairati I, Kegle P, Bertrais S, et al. Antioxidant vitamin
and mineral supplementation and prostate cancer prevention in the SU.VI.MAX trial. Int
J Cancer. 2005;116:182-6.
28. Johnson AR, Munoz A, Gottlieb JL, Jarrard DF. High dose zinc increases hospital
admissions due to genitourinary complications. J Urol. 2007;177:639-43.

219
APPENDICES

220
Appendix 1. Example of Test for Publication Bias
Begg's funnel plot with pseudo 95% confidence limits
lo
g[or
]
s.e. of: log[or]0 .1 .2 .3 .4
-1
-.5
0
.5
1
Studies of Vegetable Intake and Prostate Cancer
The graph above plots the log(OR) for each study of vegetable intake and prostate cancer risk.
It can be seen that the study results are not evenly distributed on either side of the pooled OR
(horizontal line). The lack of symmetry about the null OR suggests but does not guarantee,
publication bias. However, the statistically significant Begg’s test (p=0.013) means that
publication bias is very likely:
Begg’s Test (STATA output):
adj. Kendall's Score (P-Q) = -56
Std. Dev. of Score = 22.21
Number of Studies = 16
z = -2.52
Pr > z = 0.012
z = 2.48 (continuity corrected)
Pr > z = 0.013 (continuity corrected)

221
Appendix 2. The International Prostate Symptom Sco re (I-PSS)
The International Prostate Symptom Score (IPSS) is a questionnaire (Figure 22) based on the
American Urological Association's BPH Symptom Score questionnaire (1) to assess the severity
of urinary symptoms, associated quality of life, and the likelihood of prostate disease (2). The
I-PSS has been tested for reliability and validity (1, 2).
Seven questions are asked relating to urinary habits: frequency, intermittency, urgency, weak
stream, straining, incomplete bladder emptying and nocturia.
References:
1. Barry MJ, Fowler F, Jr, O'Leary MP, Bruskewitz RC, Holtegrewe HL, Mebust WK, et al.
The American urological association symptom index for benign prostatic hyperplasia. The
measurement committee of the American urological association. . J Urol. 1992;148:1549-
57.
2. Barry MJ. Evaluation of symptoms and quality of life in men with benign prostatic
hyperplasia. Urology. 2001;58(6, Supp 1):25-32.

222
Figure 22. The International Prostate Symptom Score ( IPSS) Questionnaire
Over the past month, how
often have you...
Not at
all
Less than
1 time in 5
Less
than half
the time
About
half the
time
More
than half
the time
Almost
always
Your
Score
1. ...had a sensation of not emptying your bladder completely after you finished urinating?
0 1 2 3 4 5
2. ...had to urinate again less than two hours after you finished urinating?
0 1 2 3 4 5
3. ...stopped and started again several times when you urinated?
0 1 2 3 4 5
4. ...found it difficult to postpone urination?
0 1 2 3 4 5
5. ...had a weak urinary stream?
0 1 2 3 4 5
6. ...had to push or strain to begin urination?
0 1 2 3 4 5
None Once Twice 3 times 4 times 5 times or more
7. Over the past month, how many times did you most typically get up to urinate from the time you went to bed at night until the time you got up in the morning?
0 1 2 3 4 5
Total

223
Appendix 3. Published Manuscripts Presented for th is Thesis
Includes:
Paper 1: Ambrosini GL, de Klerk NH, Fritschi L, Mackerras L and Musk AW. Fruit,
vegetable, vitamin A intakes and prostate cancer risk. Prostate Cancer and
Prostatic Diseases 2008; 11: 61-66.
Paper 2: Ambrosini GL, van Roosbroeck SAH, Mackerras D, Fritschi L, de Klerk NH and
Musk AW. The reliability of ten-year dietary recall: implications for cancer
research. Journal of Nutrition 2003; 133: 2663-2668.
Paper 3: Ambrosini GL, de Klerk NH, Mackerras D, Leavy J and Fritschi L. Dietary
patterns and benign prostatic hyperplasia: a case-control study in Western
Australia. BJU International 2008; 101: 853-860.
Paper 5: Ambrosini GL, Fritschi L, de Klerk NH, Mackerras D and Leavy J. Dietary
patterns and prostate cancer: a case-control study in Western Australia. Annals
of Epidemiology in press : DOI: 10.1016/j.annepidem.2007.11.010 2008

224

225
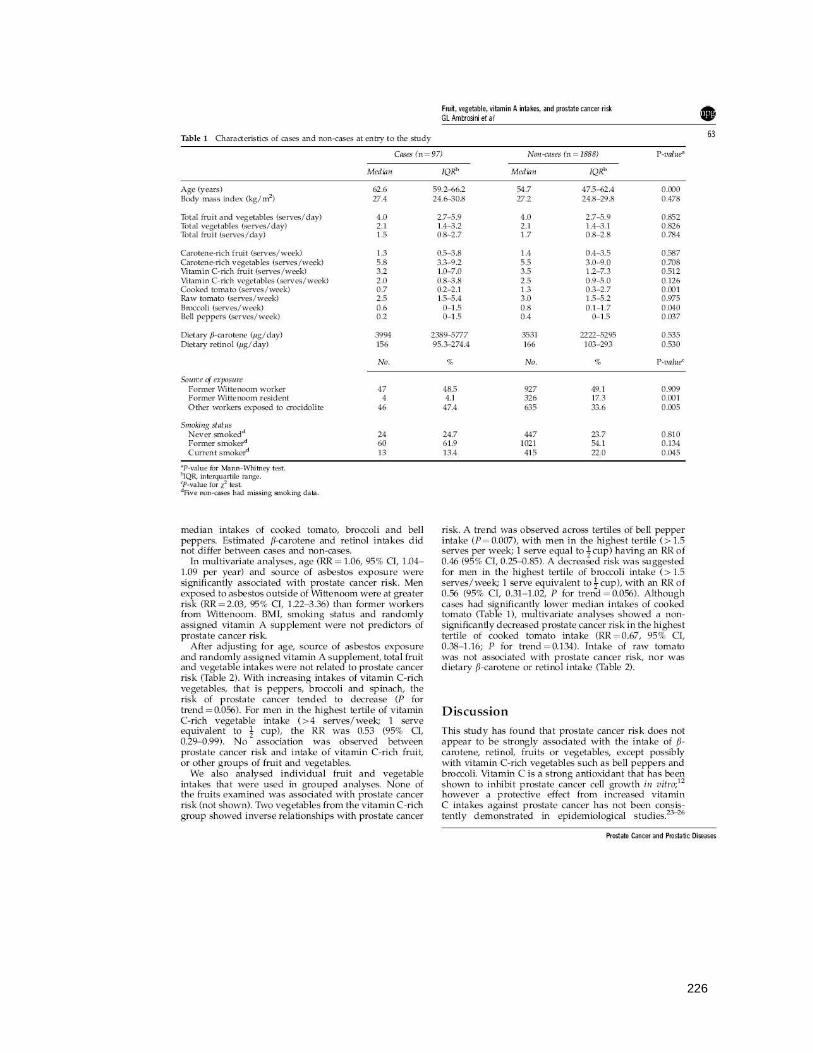
226

227

228

229

230
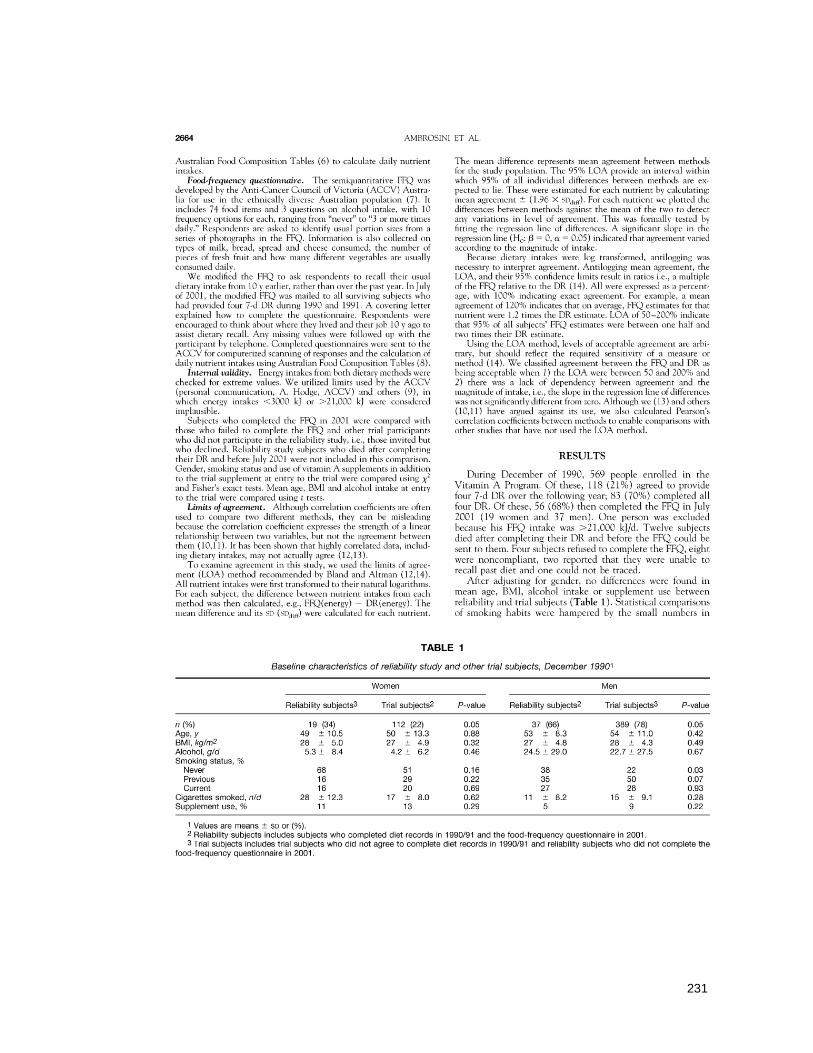
231
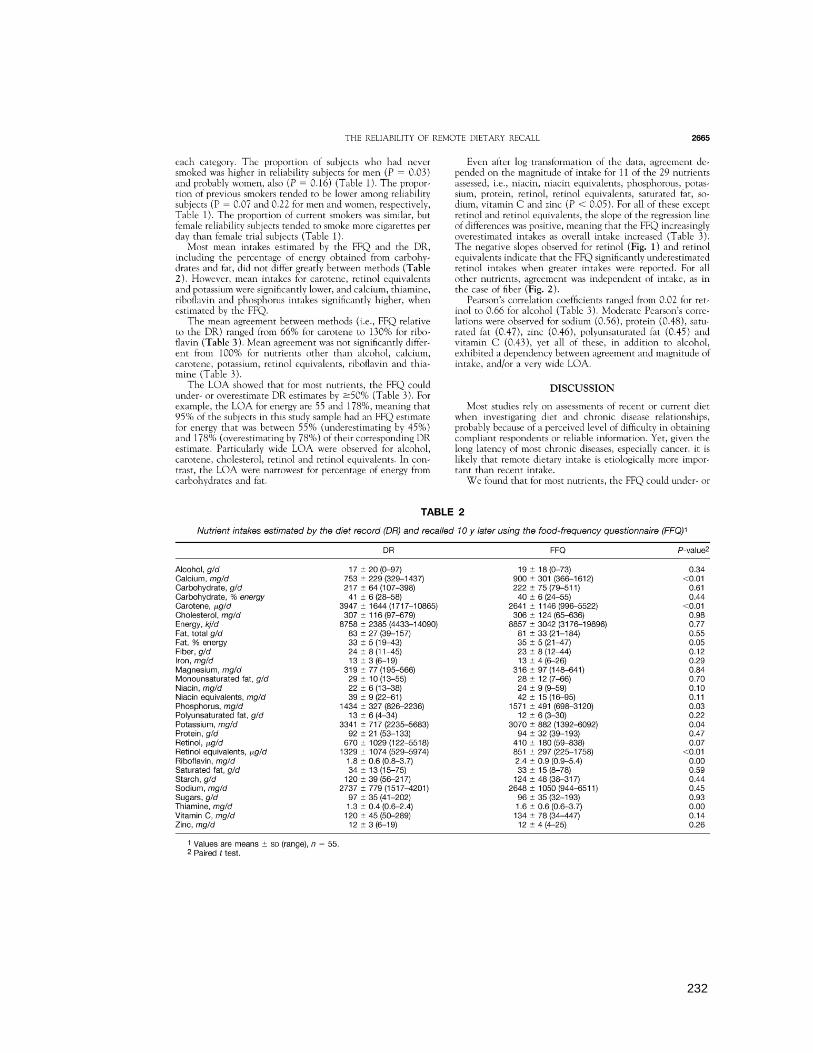
232

233

234
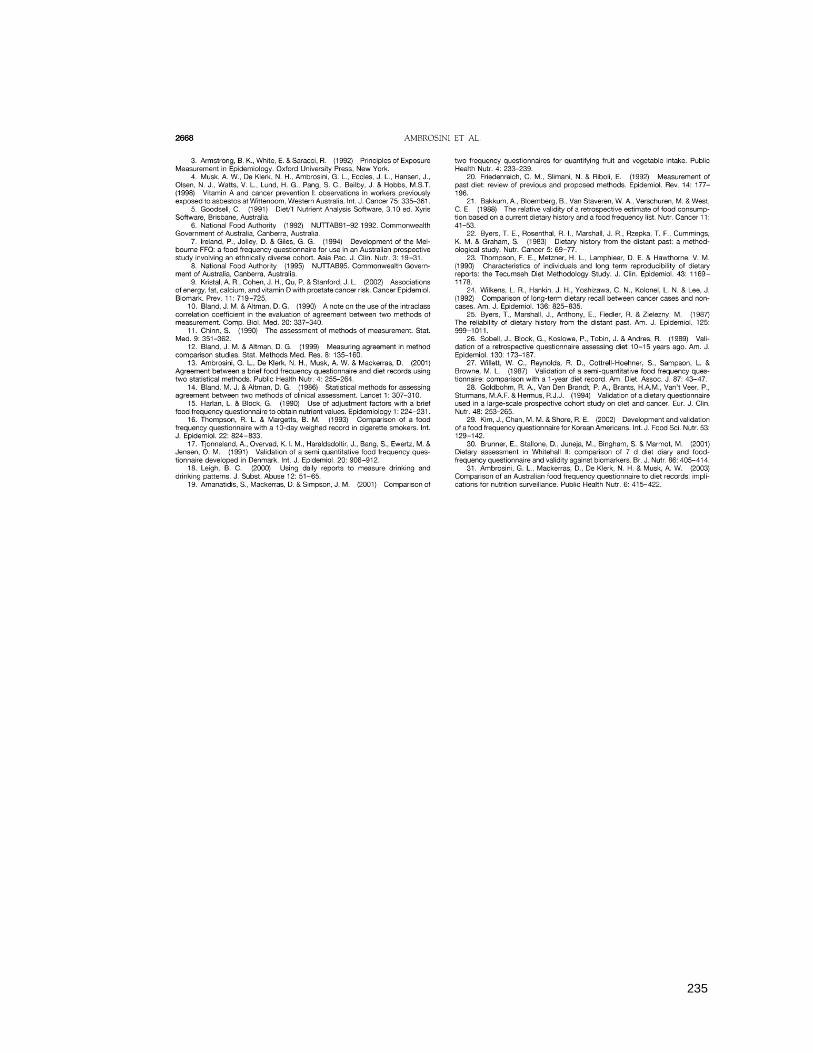
235

236
237

238

239

240
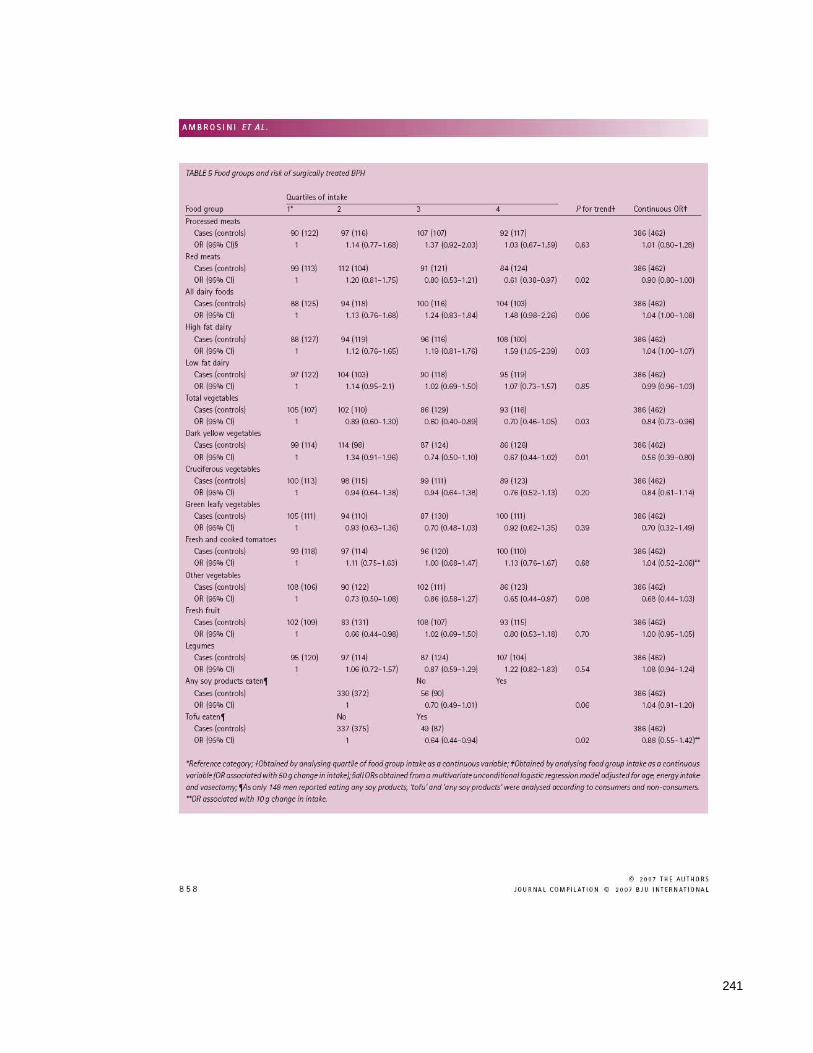
241
242

243

244

245
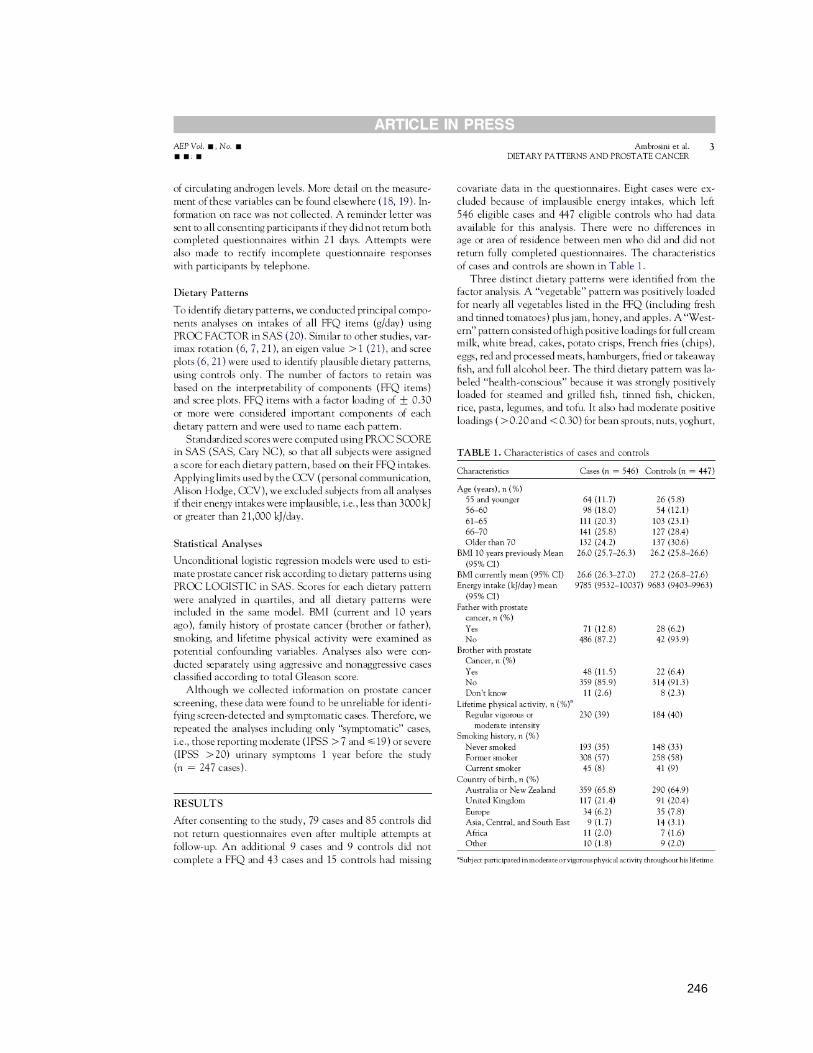
246

247
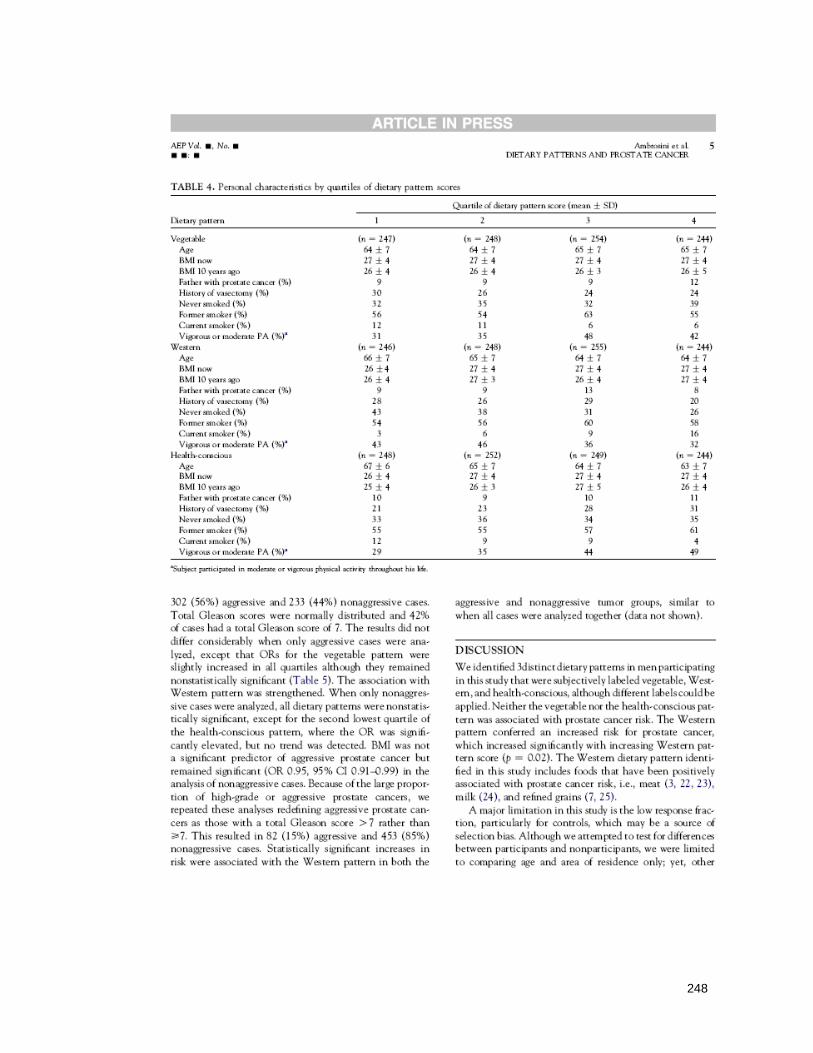
248

249

250

251
Appendix 4. The Cancer Council of Victoria’s Food Frequency
Questionnaire
This FFQ was modified from the original Cancer Council of Victoria food frequency
questionnaire, to collect information on the respondent’s diet 10 years before the study.

252

253
254

255

256
Appendix 5. Personal Characteristics and Food Inta ke by Quartiles of
Food Patterns (prostate cancer cases and controls)

257
Table 29. Personal characteristics by quartiles of (food based) dietary patterns.
Quartile of Dietary Pattern ( ± SD) 1 2 3 4 Vegetable pattern (n=247) (n=248) (n=254) (n=244) Age 64 ± 7 64 ± 7 65 ± 7 65 ± 7 BMI now 27 ± 4 27 ± 4 27 ± 4 27 ± 4 BMI 10 years ago 26 ± 4 26 ± 4 26 ± 3 26 ± 5 Father with prostate cancer (%) 9 9 9 12 History of vasectomy (%) 30 26 24 24 Never smoked (%) 32 35 32 39 Former smoker (%) 56 54 63 55 Current smoker (%) 12 11 6 6 Vigorous or moderate PA (%) 1 31 35 48 42
Western pattern (n=246) (n=248) (n=255) (n=244) Age 66 ± 7 65 ± 7 64 ± 7 64 ± 7 BMI now 26 ± 4 27 ± 4 27 ± 4 27 ± 4 BMI 10 years ago 26 ± 4 27 ± 3 26 ± 4 27 ± 4 Father with prostate cancer (%) 9 9 13 8 History of vasectomy (%) 28 26 29 20 Never smoked (%) 43 38 31 26 Former smoker (%) 54 56 60 58 Current smoker (%) 3 6 9 16 Vigorous or moderate PA (%) 1 43 46 36 32
1 Participated in moderate or vigorous physical activity throughout life

258
Table 29. Personal characteristics by quartiles of (food based) dietary patterns (cont’d).
Quartile of Dietary Pattern (mean ± SD) 1 2 3 4 Health-conscious pattern (n=248) (n=252) (n=249) (n=244) Age 67 ± 6 65 ± 7 64 ± 7 63 ± 7 BMI now 26 ± 4 27 ± 4 27 ± 4 27 ± 4 BMI 10 years ago 25 ± 4 26 ± 3 27 ± 5 26 ± 4 Father with prostate cancer (%) 10 9 10 11 History of vasectomy (%) 21 23 28 31 Never smoked (%) 33 36 34 35 Former smoker (%) 55 55 57 61 Current smoker (%) 12 9 9 4 Vigorous or moderate PA (%) 1 29 35 44 49
1 Participated in moderate or vigorous physical activity throughout life

259
Table 30. Food intake by quartiles of the 'Vegetable' pattern.
Quartile of Vegetable Pattern
Average daily intake 1, 2 1 2 3 4
(n=247) (n=248) (n=254) (n=244)
Processed meats 32 ± 29 36 ± 28 38 ± 30 44 ± 35 Red meats 94 ± 72 112 ± 68 118 ± 76 136 ± 88 Fish 36 ± 32 35 ± 27 47 ± 34 60 ± 79 Chicken 27 ± 26 28 ± 20 32 ± 21 39 ± 36 Eggs 20 ± 15 23 ± 15 22 ± 15 21 ± 15 Low fat dairy 115 ± 171 124 ± 189 140 ± 197 153 ± 194 High fat dairy 213 ± 202 242 ± 207 244 ± 228 245 ± 208 Fresh fruit 153 ± 107 183 ± 116 219 ± 127 295 ± 163 Legumes 24 ± 23 36 ± 37 46 ± 67 48 ± 40 Vegetables 58 ± 24 93 ± 25 118 ± 26 172 ± 49 Potatoes 29 ± 27 45 ± 33 59 ± 38 83 ± 53 Refined grains 128 ± 95 133 ± 97 140 ± 99 143 ± 104 Whole grains 75 ± 85 98 ± 96 132 ± 121 151 ± 138 Sweets 33 ± 36 45 ± 43 61 ± 53 81 ± 72 Sugar 21 ± 19 24 ± 19 25 ± 19 32 ± 23 Wine 116 ± 157 103 ± 151 97 ± 139 76 ± 140 Beer 247 ± 462 309 ± 521 236 ± 489 286 ± 553
1 mean ± SD (grams)
2 Processed meats - bacon, ham, salami, sausages; Red meats - beef, lamb, pork, veal, hamburger meat; Fish - fried fish, grilled or steamed fish, tinned fish; Low fat dairy - reduced fat milk, skim milk, ricotta cheese, low fat cheese, flavoured milks; High fat dairy; full cream milk, hard cheeses, firm cheeses, soft cheese, cream cheese, icecream, yoghurt; Wine - red wine, white wine, fortified wines; Legumes - peas, green beans, bean sprouts, baked beans, tofu, chickpeas, lentils, soya milk; Whole grains - high fibre bread, wholemeal bread, rye bread, multigrain bread, bran breakfast cereal, porridge, muesli; Refined grains - white bread, rice, pasta, cornflakes; Sweets - cakes, sweet pastries, sweet biscuits, chocolate; Sugar - sugar, jams.

260
Table 31. Food intake by quartiles of the 'Western’ pattern.
Quartile of Western Pattern
Average daily intake 1, 2 1 2 3 4
(n=246) (n=248) (n=255) (n=244)
Processed meats 20 ± 15 28 ± 20 43 ± 30 59 ± 38 Red meats 64 ± 37 94 ± 47 126 ± 73 177 ± 91 Fish 42 ± 46 36 ± 27 42 ± 34 60 ± 72 Chicken 27 ± 21 28 ± 29 30 ± 26 39 ± 29 Eggs 15 ± 10 19 ± 12 23 ± 15 30 ± 18 Low fat dairy 232 ± 205 141 ± 189 101 ± 170 57 ± 138 High fat dairy 140 ± 160 217 ± 202 258 ± 212 332 ± 222 Fresh fruit 280 ± 145 202 ± 126 186 ± 126 181 ± 140 Legumes 40 ± 71 34 ± 39 36 ± 24 43 ± 35 Vegetables 112 ± 56 103 ± 45 107 ± 48 118 ± 59 Potatoes 43 ± 34 50 ± 35 56 ± 46 65 ± 52 Refined grains 92 ± 81 106 ± 77 148 ± 88 199 ± 111 Whole grains 162 ± 110 129 ± 110 93 ± 111 70 ± 109 Sweets 32 ± 33 44 ± 41 58 ± 53 87 ± 71 Sugar 19 ± 16 22 ± 17 29 ± 22 33 ± 23 Wine 110 ± 143 100 ± 151 93 ± 160 89 ± 136 Beer 94 ± 241 176 ± 375 326 ± 566 484 ± 654
1 mean ± SD (grams)
2 Processed meats - bacon, ham, salami, sausages; Red meats - beef, lamb, pork, veal, hamburger meat; Fish - fried fish, grilled or steamed fish, tinned fish; Low fat dairy - reduced fat milk, skim milk, ricotta cheese, low fat cheese, flavoured milks; High fat dairy; full cream milk, hard cheeses, firm cheeses, soft cheese, cream cheese, icecream, yoghurt; Wine - red wine, white wine, fortified wines; Legumes - peas, green beans, bean sprouts, baked beans, tofu, chickpeas, lentils, soya milk; Whole grains - high fibre bread, wholemeal bread, rye bread, multigrain bread, bran breakfast cereal, porridge, muesli; Refined grains - white bread, rice, pasta, cornflakes; Sweets - cakes, sweet pastries, sweet biscuits, chocolate; Sugar - sugar, jams.

261
Table 32. Food intake by quartile of the 'Health-conscious’ pattern.
Quartile of Health-conscious Pattern
Average daily intake 1, 2 1 2 3 4
(n=248) (n=252) (n=249) (n=244)
Processed meats 34 ± 31 39 ± 34 39 ± 30 38 ± 28 Red meats 112 ± 74 107 ± 69 114 ± 79 127 ± 86 Fish 27 ± 20 34 ± 24 46 ± 36 73 ± 78 Chicken 20 ± 16 27 ± 19 31 ± 24 47 ± 37 Eggs 21 ± 15 22 ± 15 22 ± 15 22 ± 16 Low fat dairy 95 ± 179 128 ± 176 149 ± 192 161 ± 201 High fat dairy 274 ± 208 212 ± 189 229 ± 226 230 ± 218 Fresh fruit 165 ± 115 202 ± 128 210 ± 129 272 ± 163 Legumes 35 ± 26 35 ± 29 37 ± 56 46 ± 61 Vegetables 101 ± 51 104 ± 48 110 ± 53 125 ± 57 Potatoes 64 ± 50 53 ± 42 51 ± 43 47 ± 36 Refined grains 126 ± 82 119 ± 87 123 ± 90 176 ± 122 Whole grains 86 ± 114 101 ± 100 118 ± 108 150 ± 129 Sweets 60 ± 60 56 ± 57 51 ± 51 53 ± 53 Sugar 31 ± 22 24 ± 20 24 ± 20 22 ± 19 Wine 37 ± 80 78 ± 125 117 ± 151 160 ± 186 Beer 296 ± 580 313 ± 548 239 ± 450 229 ± 434
1 mean ± SD (grams)
2 Processed meats - bacon, ham, salami, sausages; Red meats - beef, lamb, pork, veal, hamburger meat; Fish - fried fish, grilled or steamed fish, tinned fish; Low fat dairy - reduced fat milk, skim milk, ricotta cheese, low fat cheese, flavoured milks; High fat dairy; full cream milk, hard cheeses, firm cheeses, soft cheese, cream cheese, icecream, yoghurt; Wine - red wine, white wine, fortified wines; Legumes - peas, green beans, bean sprouts, baked beans, tofu, chickpeas, lentils, soya milk; Whole grains - high fibre bread, wholemeal bread, rye bread, multigrain bread, bran breakfast cereal, porridge, muesli; Refined grains - white bread, rice, pasta, cornflakes; Sweets - cakes, sweet pastries, sweet biscuits, chocolate; Sugar - sugar, jams.

262
Appendix 6. Personal Characteristics and Food Inta ke by Quartiles of
Food Patterns (BPH cases and controls)

263
Table 33. Personal characteristics by quartiles of (food based) dietary patterns.
Quartile of Dietary Pattern (mean ± SD) 1 2 3 4 Vegetable pattern (n=211) (n=215) (n=212) (n=210) Age 65 ± 6 66 ± 4 66 ± 6 67 ± 6 BMI now 27 ± 5 28 ± 13 28 ± 5 27 ± 5 BMI 10 years ago 26 ± 4 27 ± 11 27 ± 5 26 ± 6 Moderate IPSS 1 (%) 27 21 29 24 Severe IPSS 2 (%) 34 36 27 33 History of vasectomy (%) 24 21 27 29 Never smoked (%) 29 35 35 35 Former smoker (%) 58 54 58 60 Current smoker (%) 13 11 8 6 Vigorous or moderate PA (%) 3 39 34 44 44 Western pattern (n=214) (n=213) (n=213) (n=208 Age 67 ± 6 66 ± 6 66 ± 6 65 ± 6 BMI now 27 ± 14 27 ± 5 27 ± 4 28 ± 6 BMI 10 years ago 26 ± 11 26 ± 4 26 ± 4 27 ± 5 Moderate IPSS 1 (%) 27 30 23 22 Severe IPSS 2 (%) 29 34 33 35 History of vasectomy (%) 26 25 26 23 Never smoked (%) 30 44 30 30 Former smoker (%) 56 59 56 57 Current smoker (%) 3 7 14 13 Vigorous or moderate PA (%) 3 42 44 39 36

264
Table 33. Personal characteristics by quartiles of (food based) dietary patterns (cont’d)
Quartile of Dietary Pattern (mean ± SD) 1 2 3 4 Health-conscious pattern (n=213) (n=214) (n=215) (n=206 Age 68 ± 5 67 ± 6 64 ± 6 65 ± 7 BMI now 26 ± 4 27 ± 5 28 ± 6 29 ± 14 BMI 10 years ago 25 ± 3 26 ± 5 27 ± 5 27 ± 11 Moderate IPSS 1 (%) 26 24 26 26 Severe IPSS 2 (%) 30 34 36 30 History of vasectomy (%) 21 26 29 24 Never smoked (%) 33 35 33 32 Former smoker (%) 54 58 55 62 Current smoker (%) 13 7 12 6 Vigorous or moderate PA (%) 3 32 43 44 42
1 International Prostate Symptom Score (IPSS) >7 and ≤19 2 International Prostate Symptoms Score (IPSS) >20 3 Participated in moderate or vigorous physical activity throughout life

265
Table 34. Food intake by quartiles of the 'Vegetable' pattern.
Quartile of Vegetable Pattern
Average daily intake 1, 2 1 2 3 4
(n=211) (n=215) (n=212) (n=210) Processed meats 29 ± 28 36 ± 30 42 ± 36 39 ± 31 Red meats 93 ± 64 105 ± 71 118 ± 77 139 ± 91 Fish 37 ± 35 38 ± 35 48 ± 35 58 ± 57 Chicken 27 ± 20 28 ± 19 30 ± 19 37 ± 39 Eggs 20 ± 15 23 ± 16 23 ± 16 22 ± 16 Low fat dairy 109 ± 175 149 ± 201 157 ± 218 130 ± 191 High fat dairy 232 ± 203 241 ± 221 239 ± 230 305 ± 254 Fresh fruit 159 ± 106 185 ± 125 234 ± 135 298 ± 169 Legumes 25 ± 34 33 ± 24 46 ± 64 53 ± 74 Vegetables 58 ± 26 92 ± 22 114 ± 28 174 ± 54 Potatoes 30 ± 29 44 ± 35 60 ± 39 85 ± 56 Refined grains 121 ± 92 122 ± 93 139 ± 100 134 ± 104 Whole grains 79 ± 79 110 ± 100 144 ± 130 172 ± 144 Sweets 33 ± 33 43 ± 45 64 ± 54 81 ± 79 Sugar 22 ± 18 24 ± 18 27 ± 20 36 ± 27 Wine 123 ± 184 94 ± 151 98 ± 149 72 ± 118 Beer 211 ± 433 227 ± 477 245 ± 489 298 ± 542
1 mean ± SD (grams)
2 Processed meats - bacon, ham, salami, sausages; Red meats - beef, lamb, pork, veal, hamburger meat; Fish - fried fish, grilled or steamed fish, tinned fish; Low fat dairy - reduced fat milk, skim milk, ricotta cheese, low fat cheese, flavoured milks; High fat dairy; full cream milk, hard cheeses, firm cheeses, soft cheese, cream cheese, icecream, yoghurt; Wine - red wine, white wine, fortified wines; Legumes - peas, green beans, bean sprouts, baked beans, tofu, chickpeas, lentils, soya milk; Whole grains - high fibre bread, wholemeal bread, rye bread, multigrain bread, bran breakfast cereal, porridge, muesli; Refined grains - white bread, rice, pasta, cornflakes; Sweets - cakes, sweet pastries, sweet biscuits, chocolate; Sugar - sugar, jams.

266
Table 35. Food intake by quartiles of the 'Western’ pattern.
Quartile of Western Pattern
Average daily intake 1, 2 1 2 3 4
(n=214) (n=213) (n=213) (n=208) Processed meats 17 ± 14 28 ± 21 41 ± 28 61 ± 40 Red meats 62 ± 36 94 ± 51 119 ± 66 181 ± 94 Fish 40 ± 51 38 ± 33 47 ± 41 56 ± 39 Chicken 25 ± 26 31 ± 32 28 ± 20 37 ± 24 Eggs 15 ± 12 19 ± 14 23 ± 16 31 ± 18 Low fat dairy 218 ± 207 155 ± 207 97 ± 178 73 ± 160 High fat dairy 154 ± 175 228 ± 224 286 ± 235 350 ± 233 Fresh fruit 280 ± 145 205 ± 132 205 ± 150 184 ± 136 Legumes 42 ± 83 34 ± 46 38 ± 43 42 ± 25 Vegetables 112 ± 56 97 ± 45 109 ± 52 120 ± 62 Potatoes 42 ± 31 52 ± 40 58 ± 50 68 ± 54 Refined grains 81 ± 73 100 ± 81 144 ± 83 192 ± 112 Whole grains 170 ± 110 140 ± 114 105 ± 126 89 ± 117 Sweets 31 ± 35 45 ± 42 60 ± 55 86 ± 78 Sugar 20 ± 18 22 ± 17 30 ± 22 37 ± 25 Wine 106 ± 148 103 ± 155 88 ± 167 91 ± 141 Beer 68 ± 203 190 ± 375 270 ± 529 460 ± 643
1 mean ± SD (grams)
2 Processed meats - bacon, ham, salami, sausages; Red meats - beef, lamb, pork, veal, hamburger meat; Fish - fried fish, grilled or steamed fish, tinned fish; Low fat dairy - reduced fat milk, skim milk, ricotta cheese, low fat cheese, flavoured milks; High fat dairy; full cream milk, hard cheeses, firm cheeses, soft cheese, cream cheese, icecream, yoghurt; Wine - red wine, white wine, fortified wines; Legumes - peas, green beans, bean sprouts, baked beans, tofu, chickpeas, lentils, soya milk; Whole grains - high fibre bread, wholemeal bread, rye bread, multigrain bread, bran breakfast cereal, porridge, muesli; Refined grains - white bread, rice, pasta, cornflakes; Sweets - cakes, sweet pastries, sweet biscuits, chocolate; Sugar - sugar, jams.

267
Table 36. Food intake by quartiles of the 'Health-conscious’ pattern.
Quartile of Health-Conscious Pattern
Average daily intake 1, 2 1 2 3 4
(n=213) (n=214) (n=215) (n=206) Processed meats 33 ± 28 37 ± 31 38 ± 33 38 ± 33 Red meats 110 ± 81 103 ± 69 116 ± 80 124 ± 80 Fish 28 ± 24 36 ± 25 45 ± 33 73 ± 61 Chicken 20 ± 16 25 ± 16 32 ± 21 44 ± 39 Eggs 22 ± 16 22 ± 15 21 ± 15 24 ± 17 Low fat dairy 97 ± 186 140 ± 202 145 ± 189 162 ± 206 High fat dairy 298 ± 229 229 ± 210 248 ± 242 240 ± 230 Fresh fruit 171 ± 117 187 ± 115 220 ± 134 299 ± 176 Legumes 36 ± 23 38 ± 44 32 ± 36 51 ± 89 Vegetables 104 ± 53 100 ± 47 105 ± 52 129 ± 61 Potatoes 69 ± 55 53 ± 38 50 ± 46 48 ± 40 Refined grains 114 ± 84 115 ± 81 124 ± 96 164 ± 118 Whole grains 104 ± 130 110 ± 97 130 ± 111 162 ± 134 Sweets 65 ± 70 48 ± 49 58 ± 60 50 ± 49 Sugar 35 ± 24 26 ± 20 25 ± 20 23 ± 22 Wine 36 ± 85 70 ± 105 127 ± 165 157 ± 201 Beer 223 ± 489 299 ± 547 254 ± 448 204 ± 454
1 mean ± SD (grams)
2 Processed meats - bacon, ham, salami, sausages; Red meats - beef, lamb, pork, veal, hamburger meat; Fish - fried fish, grilled or steamed fish, tinned fish; Low fat dairy - reduced fat milk, skim milk, ricotta cheese, low fat cheese, flavoured milks; High fat dairy; full cream milk, hard cheeses, firm cheeses, soft cheese, cream cheese, icecream, yoghurt; Wine - red wine, white wine, fortified wines; Legumes - peas, green beans, bean sprouts, baked beans, tofu, chickpeas, lentils, soya milk; Whole grains - high fibre bread, wholemeal bread, rye bread, multigrain bread, bran breakfast cereal, porridge, muesli; Refined grains - white bread, rice, pasta, cornflakes; Sweets - cakes, sweet pastries, sweet biscuits, chocolate; Sugar - sugar, jams.

268
Appendix 7. Personal Characteristics and Nutrient I ntake by Quartiles of
Nutrient Patterns (prostate cancer cases and contro ls)

269
Table 37. Personal characteristics by quartiles of nutrient intake patterns
Quartile of Nutrient Intake Pattern (mean ± SD) 1 2 3 4 Nutrient pattern 1
(n=247) (n=251) (n=250) (n=245) Age 65 ± 6 65 ± 7 65 ± 6 64 ± 7 BMI now 27 ± 4 27 ± 4 26 ± 3 27 ± 4 BMI 10 years ago 26 ± 4 26 ± 4 26 ± 3 27 ± 4 Father with prostate cancer (%) 11 7 14 8 History of vasectomy (%) 21 25 28 28 Never smoked (%) 29 31 40 37 Former smoker (%) 58 62 50 58 Current smoker (%) 13 7 10 4 Vigorous or moderate PA (%) 1 32 36 41 48
Nutrient pattern 2
(n=248) (n=248) (n=243) (n=254) Age 66 ± 6 65 ± 7 65 ± 6 63 ± 7 BMI now 27 ± 4 27 ± 4 27 ± 4 27 ± 4 BMI 10 years ago 26 ± 4 26 ± 4 26 ± 3 26 ± 4 Father with prostate cancer (%) 8 10 10 11 History of vasectomy (%) 27 27 21 27 Never smoked (%) 41 40 31 25 Former smoker (%) 54 54 59 60 Current smoker (%) 5 6 10 14 Vigorous or moderate PA (%) 1 45 39 40 34
1 Participated in moderate or vigorous physical activity throughout life
270
Table 37. Personal characteristics by quartiles of nutrient intake patterns (cont’d)
Quartile of Nutrient Intake Pattern (mean ± SD) 1 2 3 4 Nutrient pattern 3
(n=248) (n=250) (n=248) (n=247) Age 64 ± 7 65 ± 7 65 ± 6 65 ± 7 BMI now 27 ± 4 27 ± 4 27 ± 4 27 ± 4 BMI 10 years ago 27 ± 4 26 ± 4 26 ± 4 26 ± 4 Father with prostate cancer (%) 5 8 10 8 9 8 15 8 History of vasectomy (%) 22 29 29 23 Never smoked (%) 34 33 33 38 Former smoker (%) 57 57 59 54 Current smoker (%) 9 10 8 8 Vigorous or moderate PA (%) 1 35 41 38 43
1 Participated in moderate or vigorous physical activity throughout life

271
Table 38. Nutrient intakes by quartiles of Nutrient Pattern 1
Quartile of Nutrient Pattern 1
Average daily intake1 1 2 3 4
(n=247) (n=251) (n=250) (n=245)
Energy (kJ) 10722 ± 3163 9011 ± 2954 8923 ± 2788 10299 ± 3054 Total fat (g) 103 ± 10 102 ± 10 101 ± 10 93 ± 13 Saturated fat (g) 44 ± 8 42 ± 7 41 ± 7 36 ± 8 Polyunsaturated fat (g) 16 ± 6 15 ± 5 15 ± 4 15 ± 5 Monounsaturated fat (g) 35 ± 4 35 ± 5 36 ± 5 33 ± 6 Protein (g) 94 ± 13 105 ± 10 112 ± 10 122 ± 22 Carbohydrates (g) 256 ± 32 249 ± 29 243 ± 29 250 ± 43 Sugars (g) 113 ± 30 107 ± 25 106 ± 25 102 ± 30 Starch (g) 142 ± 25 140 ± 22 136 ± 21 146 ± 32 Fibre (g) 22 ± 5 24 ± 5 26 ± 5 31 ± 8 Beta-carotene (mg) 2682 ± 1321 2718 ± 1059 2888 ± 1065 3239 ± 1316 Calcium (mg) 884 ± 239 899 ± 222 943 ± 227 984 ± 288 Cholesterol (mg) 353 ± 99 363 ± 91 381 ± 94 364 ± 114 Folate (ug) 263 ± 60 302 ± 58 333 ± 52 399 ± 102 Iron (mg) 13 ± 2 15 ± 2 17 ± 2 20 ± 4 Magnesium (mg) 280 ± 45 316 ± 37 342 ± 42 404 ± 73 Niacin (mg) 20 ± 4 25 ± 2 28 ± 3 34 ± 6 Phosphorus (mg) 1516 ± 201 1664 ± 163 1791 ± 170 1969 ± 271 Potassium (mg) 2860 ± 481 3103 ± 406 3337 ± 384 3684 ± 539 Retinol (ug) 586 ± 138 515 ± 108 488 ± 98 394 ± 127 Riboflavin (mg) 2.1 ± 0.5 2.6 ± 0.5 3.0 ± 0.5 3.5 ± 0.9 Sodium (mg) 2910 ± 451 3034 ± 352 3141 ± 373 3307 ± 429 Thiamin (mg) 1.7 ± 0.4 1.9 ± 0.3 2.1 ± 0.4 2.5 ± 0.7 Vitamin C (mg) 119 ± 68 131 ± 60 137 ± 57 150 ± 80 Vitamin E (mg) 7.8 ± 1.6 7.8 ± 1.3 7.8 ± 1.3 8.0 ± 1.5 Zinc (mg) 12.1 ± 2.1 13.9 ± 1.8 15.0 ± 1.7 16.3 ± 3.4 1 energy adjusted, mean ± SD

272
Table 39. Nutrient intakes by quartiles of Nutrient Pattern 2
Quartile of Nutrient Pattern 2
Average daily intake1 1 2 3 4
(n=248) (n=248) (n=243) (n=254)
Energy (kJ) 10298 ± 3239 9251 ± 2995 9204 ± 2856 10200 ± 3105 Total fat (g) 87 ± 10 97 ± 6 102 ± 5 112 ± 8 Saturated fat (g) 35 ± 8 40 ± 6 42 ± 6 47 ± 7 Polyunsaturated fat (g) 15 ± 5 15 ± 5 16 ± 5 16 ± 5 Monounsaturated fat (g) 30 ± 4 33 ± 2 36 ± 3 40 ± 4 Protein (g) 97 ± 17 104 ± 13 110 ± 12 121 ± 20 Carbohydrates (g) 289 ± 20 260 ± 8 241 ± 8 208 ± 26 Sugars (g) 128 ± 27 114 ± 21 100 ± 21 86 ± 22 Starch (g) 159 ± 27 144 ± 18 139 ± 20 121 ± 21 Fibre (g) 29 ± 8 27 ± 6 25 ± 6 22 ± 6 Beta-carotene (mg) 2921 ± 1318 2948 ± 1200 2865 ± 1066 2793 ± 1266 Calcium (mg) 960 ± 257 944 ± 268 918 ± 203 890 ± 255 Cholesterol (mg) 286 ± 79 347 ± 64 375 ± 72 452 ± 100 Folate (ug) 365 ± 108 328 ± 76 318 ± 66 287 ± 71 Iron (mg) 17 ± 5 16 ± 3 16 ± 3 15 ± 3 Magnesium (mg) 358 ± 84 342 ± 63 331 ± 54 312 ± 60 Niacin (mg) 27 ± 8 27 ± 6 27 ± 6 27 ± 6 Phosphorus (mg) 1714 ± 320 1734 ± 268 1737 ± 226 1756 ± 233 Potassium (mg) 3356 ± 662 3263 ± 531 3198 ± 468 3169 ± 497 Retinol (ug) 432 ± 133 487 ± 120 520 ± 118 544 ± 150 Riboflavin (mg) 3.0 ± 1.0 2.8 ± 0.8 2.8 ± 0.7 2.6 ± 0.7 Sodium (mg) 2961 ± 425 3013 ± 386 3150 ± 377 3269 ± 453 Thiamin (mg) 2.2 ± 0.7 2.0 ± 0.5 2.0 ± 0.5 1.8 ± 0.4 Vitamin C (mg) 161 ± 85 134 ± 54 129 ± 62 113 ± 56 Vitamin E (mg) 8.1 ± 1.6 7.9 ± 1.2 7.9 ± 1.3 7.6 ± 1.6 Zinc (mg) 12.6 ± 2.4 13.8 ± 2.1 14.5 ± 1.9 16.4 ± 3.3 1 energy adjusted, mean ± SD

273
Table 40. Nutrient intakes by quartiles of Nutrient Pattern 3
Quartile of Nutrient Pattern 3
Average daily intake1 1 2 3 4
(n=248) (n=250) (n=248) (n=247)
Energy (kJ) 10228 ± 3523 9282 ± 3073 9245 ± 2802 10196 ± 2778 Total fat (g) 99 ± 14 100 ± 12 100 ± 10 100 ± 11 Saturated fat (g) 43 ± 9 41 ± 8 41 ± 8 39 ± 8 Polyunsaturated fat (g) 13 ± 4 15 ± 4 16 ± 5 18 ± 5 Monounsaturated fat (g) 35 ± 6 35 ± 5 35 ± 4 35 ± 5 Protein (g) 113 ± 25 109 ± 14 107 ± 13 104 ± 16 Carbohydrates (g) 246 ± 44 248 ± 32 250 ± 27 253 ± 30 Sugars (g) 98 ± 29 108 ± 26 109 ± 24 114 ± 29 Starch (g) 147 ± 33 139 ± 22 139 ± 20 138 ± 24 Fibre (g) 23 ± 7 25 ± 6 26 ± 6 30 ± 7 Beta-carotene (mg) 2046 ± 820 2449 ± 772 2983 ± 875 4046 ± 1277 Calcium (mg) 813 ± 215 930 ± 224 974 ± 235 994 ± 275 Cholesterol (mg) 397 ± 115 371 ± 86 361 ± 95 332 ± 92 Folate (ug) 291 ± 93 315 ± 80 333 ± 73 358 ± 84 Iron (mg) 16 ± 4 16 ± 3 16 ± 3 16 ± 4 Magnesium (mg) 310 ± 67 329 ± 62 340 ± 58 364 ± 73 Niacin (mg) 27 ± 7 27 ± 6 27 ± 6 27 ± 7 Phosphorus (mg) 1702 ± 300 1742 ± 242 1744 ± 227 1754 ± 281 Potassium (mg) 2956 ± 544 3152 ± 442 3299 ± 464 3578 ± 542 Retinol (ug) 429 ± 136 492 ± 112 521 ± 132 541 ± 141 Riboflavin (mg) 2.6 ± 0.9 2.8 ± 0.8 2.9 ± 0.7 2.9 ± 0.9 Sodium (mg) 3168 ± 443 3127 ± 396 3093 ± 375 3005 ± 476 Thiamin (mg) 1.9 ± 0.6 2.0 ± 0.5 2.1 ± 0.5 2.1 ± 0.6 Vitamin C (mg) 107 ± 49 125 ± 58 140 ± 60 165 ± 84 Vitamin E (mg) 6.7 ± 1.2 7.6 ± 1.0 8.0 ± 1.1 9.0 ± 1.4 Zinc (mg) 14.9 ± 3.9 14.4 ± 2.4 14.2 ± 2.2 13.9 ± 2.5 1 energy adjusted, mean ± SD

274
Appendix 8. Summary of Diet-Disease Findings

275
Table 41. Summary of Diet-Disease Findings
Prostate Cancer Prostate Cancer Benign Prostatic Hy perplasia
Vitamin A Program RR (95% CI) 1
p for trend Prostate Health Study OR (95% CI) 2
p for trend Case-control Study OR (95% CI) 2
p for trend
Hypotheses 1 and 2:
‘Vegetable’ dietary pattern 3 - 1.13 (0.72-1.78)
0.46 0.68 (0.42-1.10) 0.78 (0.63-0.97) #
0.09
‘Western’ dietary pattern 4 - 1.82 (1.15-2.87) 0.02 0.89 (0.54-1.48) 0.86 (0.69-1.08) #
0.56
‘Health-conscious’ dietary pattern 5 - 1.06 (0.72-1.58) 0.97 0.90 (0.59-1.38) 0.89 (0.75-1.06) #
0.55
Hypothesis 3:
Total fruit 0.94 (0.46-1.89) 0.85 - 0.80 (0.53-1.18) 1.00 (0.95-1.05) #
0.70
Total vegetables 0.73 (0.38-1.40) 0.35 - 0.70 (0.46-1.05) 0.84 (0.73-0.96) #
0.03
Dark yellow vegetables 6 1.11 (0.56-2.20) 0.75 - 0.67 (0.44-1.02) 0.56 (0.39-0.80) #
0.01
Cruciferous vegetables - - 0.76 (0.52-1.13) 0.84 (0.61-1.14) #
0.50
Other vegetables - - 0.65 (0.44-0.97) 0.68 (0.44-1.03) #
0.08
Vitamin C-rich veg 0.53 (0.29-0.99) 0.056 - -

276
Table 41. Summary of Diet-Disease Findings (cont’d)
Prostate Cancer Prostate Cancer Benign Prostatic Hy perplasia
Vitamin A Program RR (95% CI) 1
p for trend Prostate Health Study OR (95% CI) 2
p for trend Case-control Study OR (95% CI) 2
p for trend
Hypothesis 3 (cont’d):
Peppers 0.46 (0.25-0.85) 0.01 - -
Broccoli 0.56 (0.31-1.02) 0.06
- -
Cooked tomato 0.67 (0.38-1.16) 0.13 - 1.13 (0.76-1.67)
1.04 (0.52-2.06) # 0.68
Raw tomato
1.04 (0.60 – 1.80) 0.88 -
Zinc - 0.57 (0.40-0.82) 0.59 (0.37-0.92) #
<0.01 0.58 (0.39-0.83)
<0.01
Nutrient Pattern 1 (+ve for zinc) 7
- 0.62 (0.43-0.90) <0.01
Hypothesis 4:
Total fat - 1.08 (0.75-1.55) 1.01 (0.96-1.05) #
0.57 1.01 (0.69-1.48) 0.53
Calcium - 0.83 (0.58-1.19) 0.96 (0.91-1.01) #
0.32 1.39 (0.95-2.05) 0.18
Nutrient Pattern 1 (-ve for fats) 7
- 0.62 (0.43-0.90)
0.85 (0.74-0.97) # <0.01 -

277
Table 41. Summary of Diet-Disease Findings (cont’d)
Prostate Cancer Prostate Cancer Benign Prostatic Hy perplasia
Vitamin A Program RR (95% CI) 1
p for trend Prostate Health Study OR (95% CI) 2
p for trend Case-control Study OR (95% CI) 2
p for trend
Additional findings:
Sugars - 1.23 (0.85-1.77) 0.18
1.53 (1.04-2.27) 0.04
Carbohydrates - 1.44 (1.00-2.07) 0.10
1.20 (0.81-1.77) 0.55
Fibre - 0.99 (0.69-1.42)
0.85 (0.71-1.02) #
0.56 1.00 (0.68-1.48) 0.84
Folate 0.86 (0.60-1.24)
0.88 (0.76-1.02) #
0.77 (0.52-1.14) 0.25
High fat dairy - -
1.59 (1.05-2.39) 0.03
Beta-carotene 0.96 (0.58-1.61) 0.87 0.86 (0.60-1.24) 0.57
0.58 (0.39-0.86) <0.01
Retinol 0.85 (0.52-1.39) 0.52 -
1.53 (1.04-2.25) 0.10
Vitamin C - 1.01 (0.70-1.46) 0.83
0.88 (0.60-1.31) 0.36
Tofu 8 - - 0.64 (0.44-0.94) 0.02

278
# Odds ratio (OR) when measured as a continuous variable;
1 Risk ratio (RR) for highest vs lowest tertile;
2 OR for highest vs lowest quartile;
3 +ve for vegetables;
4 +ve for red meat, processed meat, white bread, full cream milk, etc;
5 +ve for pasta, steamed or grilled fish, rice, chicken, legumes, etc;
6 carotene-rich vegetables
7+ve for zinc, protein, fibre, folate, -ve for total and saturated fats, etc
8 consumers vs non-consumers.