diet, exercise or diet with exercise: comparing the ...diet, exercise or diet with exercise:...
TRANSCRIPT

Clark Journal of Diabetes & Metabolic Disorders (2015) 14:31 DOI 10.1186/s40200-015-0154-1
REVIEW ARTICLE Open Access
Diet, exercise or diet with exercise: comparing theeffectiveness of treatment options for weight-lossand changes in fitness for adults (18–65 years old)who are overfat, or obese; systematic review andmeta-analysisJames E Clark
Abstract
There are number of means of methods to alter body composition, and metabolic issues, available for the adultwho is overfat. The following is a systematic review and meta-analysis focused on comparing changes fromtreatment program for adults who are overfat based on analysis of aggregated effect size (ES) of inducing changes.So as to determine the relative effectiveness of such protocols and intervention plans of choice. This tieredmeta-analysis of 66-population based studies, and 162-studywise groups, a clear pattern of ES being establishedacross and within treatments. First, hypocaloric balance is necessary for changing body composition, but theeffectiveness for establishing imbalance does not equate with the effectiveness for body compositional changes, orany biomarkers associated with metabolic issues. With analysis showing that there is a necessity to include exercisein combination with diet effectively elicit changes in body composition and biomarkers of metabolic issues. Moreimportantly, the combination, resistance training (RT) was more effective than endurance training (ET) orcombination of RT and ET, particularly when progressive training volume of 2-to-3 sets for 6-to-10 reps at anintensity of ≥75% 1RM, utilizing whole body and free-weight exercises, at altering body compositional measures(ES of 0.47, 0.30, and 0.40 for loss of BM, FM, and retention of FFM respectively) and reducing total cholesterol(ES = 0.85), triglycerides (ES = 0.86) and low-density lipoproteins (ES = 0.60). Additionally RT was more effective atreducing fasting insulin levels (ES = 3.5) than ET or ET and RT. Even though generally lower ES than RT, the inclusionof ET was more effective when performed at high intensity (e.g. ≥70% VO2max or HRmax for 30-minutes 3-4x’s/wk),or in an interval training style than when utilizing the relatively common prescribed method of low-to-moderate(e.g., 50-70% VO2max or HRmax for at least equal time) steady state method, ES of 0.35, 0.39, and 0.13 for BM, FM,and FFM respectively. Thus indicating that focus of treatment should be on producing a large metabolic stress(as induced by RT or high levels of ET) rather than an energetic imbalance for adults who are overfat.
Keywords: Obesity, Exercise, Comparison, Weight loss
Correspondence: [email protected] of Mathematics, Science, and Health Careers; Department of Science,Manchester Community College, Manchester, CT 06045-1046, USA
© 2015 Clark; licensee BioMed Central. This is an Open Access article distributed under the terms of the Creative CommonsAttribution License (http://creativecommons.org/licenses/by/4.0), which permits unrestricted use, distribution, andreproduction in any medium, provided the original work is properly credited. The Creative Commons Public DomainDedication waiver (http://creativecommons.org/publicdomain/zero/1.0/) applies to the data made available in this article,unless otherwise stated.

Clark Journal of Diabetes & Metabolic Disorders (2015) 14:31 Page 2 of 28
IntroductionAccompanying the epidemic rise in the rate of obesityand obesity related diseases over the past half-centurythere has also been a rise in a variety of therapeutic in-terventions to address this epidemic. Most notable amongstthese interventions have been numerous protocols that at-tempt to change body composition, most often throughtotal mass reduction (i.e. weight loss). Resulting not only ina multibillion-dollar industry, but a greater absolute num-ber of US adults currently engaging in behaviors (e.g., hypo-caloric dieting, or involvement of general exercise andphysical activity), with the focus based on the implicationthat all mass as being equal in the equation of body mass,obesity and disease [1-3]. To support such a position, sev-eral authors [4-9] have previously noted that there are lim-ited differences in results for absolute changes in bodycomposition with comparison between the various method-ologies employed for treatment of weight issues for an indi-vidual who is overfat. While others [4,9-12] have indicatedthe responses are more related to an energetic imbalance(e.g., kcal/day, kJ/day) between dietary caloric load and ex-penditure from activity that results from the intervention ofchoice (e.g., diet, exercise, or combination therein) than theactual intervention for the adult who is overfat.However, the discussion of effective outcome must go
beyond any reduction in body mass or even health fac-tors. Instead, the overall outcome has to involve a largechange in self-selected and self-motivated behaviors. Achange that serves to increase health and fitness behav-iors and invoke a psychological adherence to exercisethat most adults who are overfat might not intrinsicallypossess. Something that has become evident in the lowattrition rates within many exercise programs and thehigh rate of repeated hypocaloric diet attempts [13-16].Yet many of the marketing verbiage, seen through anyscan of popular media, of intervention programs lead tothe idea of adherence to any program appears related tothe ability for that program to alter body mass. Whichcomes without mention or regard to any of the otherphysiological modifications, or alleviation of pathophysio-logical conditions, that arise throughout treatment thathas been noted in the continuum of fitness and fatnessfactors impacting the overall health of the adult who isoverfat [17-21]. This single focus on body mass alterationalone, leads to growing confusion within the generalpopulation as it relates to which therapeutic interventionmay provide greatest benefit. Especially, given that thereare any number of anecdotal, and single study results, in-dicating effectiveness of any of the various methods forweight loss and health improvement for the adult who isoverfat. And more so are discussions of such reportswithin the scientific community, and popular press, whichincrease such confusion by indicating distinct advantages(or disadvantages) that are in conflict with each other. But
also indicate the aforementioned limited differences be-tween methods of intervention for the adult who isoverfat.Moreover, the differences between intervention methods
used within single studies and the methods of comparisonwithin previous reviews, lead to inherent issues of com-parability of absolute changes between studies and theconclusion stipulated thereby [22,23]. In particular, thewide differences in the length of interventions and the vastelaboration and complexity within the design of some in-terventions utilized. Where most of the complexities thatappear in some programs are at a level of elaboration forthe sake of being elaborate, to function as a marketingideal, and not based on the elaboration necessitated byprinciples of periodization and progressive training[24,25]. Likewise, the length of intervention time betweencomparisons varied greatly. Where, not surprisingly, thelonger the intervention the greater absolute change rela-tive to a shorter duration intervention. And taken to-gether, may be the underlying rationale for the perplexingstats. Where even given an elevated current awareness ofhealth issues of overfatness, there are reports by theCenters for Disease Control and Prevent (CDC) [1] identi-fying that fewer than 21% of US adults meet the generalrecommendation for exercise behaviors. And that only ap-proximately 51% of US adults meet the recommendationfor aerobic (endurance) training while only 29% meet therecommendation for strength (resistance) training eachweek [1,3].Even if it is well understood that altering any health
behaviors leads to a reduction in the risk factors for pre-ventable non-communicable diseases [18,20,26-33]. Andcan lead to greater use of other healthy behaviors leadingto greater overall levels of fitness [15,27]. Where theseimprovements appear to stem from a number of endo-crinological changes that occur with both expression ofoverfatness and following exposure to exercise that ul-timately alters the health status for the individual who isoverfat [18,19,26,28,30,32-34]. The greatest impact ofthese changes appears to be related to alterations in sexhormone (i.e. testosterone and androgens), growth hor-mone, and a host of adipokines [29,34-46]. With lowutilization of healthy behaviors eliciting changes indi-cated to increase the risk for the development of meta-bolic issues, which may culminate in Type 2 DiabetesMellitus (T2DM), and are readily associated with re-duced work capacity and anabolic hormone response forthe individual who is overfat [18,26,27]. And are re-versed with exposure to physical activity (e.g., exercise)with speculation that resistance exercise may providethe greatest impact on reversing such issues [28,47-50]and evidence for greater change in body compositionfrom utilization of resistance exercise, both with andwithout conjunction with hypocaloric diet [51].

Clark Journal of Diabetes & Metabolic Disorders (2015) 14:31 Page 3 of 28
Given this level of understanding, it is perplexing thatthere would be such low investment in beneficial healthbehaviors that are highly associated with alleviatingmany of the aforementioned health issues [19,26,28,31].Which leads to the question, if it is generally understoodthat physical activity is beneficial to not only in bodymass reduction, in particular fat mass (FM) but not fat-free mass (FFM), along with improvements in manyhealth functions, then why are so few adults engagingin such behaviors? As it has been reported that some5-million U.S. deaths from non-communicable diseasescould be prevented, even with a possible stagnation inthe total proportion of the population classified as over-weight or obese via current measures [1,2]. And may berelated to the way in which exercise (in particular RT) isdiscussed in relation to the alteration of body mass,resolving metabolic issues and improvements in theoverall health status for the adults who are overfat[20,21,52-54]. Along with the means by which we dis-cuss changes elicited along with the process of compari-son and generalization of findings to the populationlarge. And a methodological bias in the employment ofexercise that leads to an over recommendation of asingle type of exercise based on personal preference[27,55-57]. Which, is compounded by the trove of anec-dotal reports for response, from a self-professed exerciseexpert, that are easily accessible via any Internet search-engine for topics related to issue of weight loss.However, just because there are issues related to direct
comparison, due to methodological differences and tak-ing into account the large inter-study discrepancies forresponses, one can still compare responses. Comparisonof responses must not come from the absolute value forchanges indicated by each study, but as performed herethrough the aggregation of responses based on thepooled effect for ES that over the sum of all studies.Thus reflecting a more reliable overall effectiveness andprovide a greater insight into the treatment phenomenonbeing offered [22,23]. Therein, the focus of this reviewhere will examine the various outcomes from treat-ments utilized for improvements in the health status forthe individual who is overfat that can be incorporatedlong-term behavioral modification. With analysis basedon the effectiveness of treatment (e.g., effect size, ES)and not on the evaluation of absolute changes relativeto either the initial state, or in comparison to a controlgroup, within the included studies. Thus providingsupport to the health-care practitioner, or fitness clubemployee, to advice patients (or clients) as to which proto-col schematics should provide the most effective means tonot only change body composition (thus providing thereinforcement reward to elicit continual behavioral modi-fication) but also improve the health status for the adultwho is overfat.
Hence, the purpose of this systematic review is explorethe current understanding of changes elicited to bodycomposition in light of the understanding related to theendocrinological and health improvements seen with thevarious intervention programs based solely on population-based studies. That is related to treatment utilization ofdiet, diet and exercise or strictly exercise intervention formeans of body mass reduction (i.e. weight loss), change inblood lipids and hormone levels. In an attempt to addressthe question if there is a difference in response betweenthe various methods in (not absolute loss but effect sizefor) loss of body mass, fat mass and fat-free mass alongwith changes in blood lipid profiles and hormonal levels?Upon which, analysis will examine four distinct hypoth-eses. First, that exercise interventions will provide agreater effectiveness means for FM reduction than anydiet intervention. Second, within exercise methods the useof RT will provide a stimulus that induces a greater effect-iveness for change in body mass change (reduction in FMwith retention of FFM) than ET, without regard to theaddition of diet to the intervention. Thirdly, exercise willprovide the stimulus that is more effective than any dietintervention at reverse hormone and adipokine/cytokinesignals to normal “healthy” ranges. Lastly, that RT will beable to produce an effectiveness of treatment that matchesthe effectiveness of treatment from ET for both alteringhormone and adipokine/cytokine signals but also forchanging blood lipids.
MethodsAs shown in the overview of the study in Figure 1, rele-vant studies (e.g., studies only involving human volun-teers that fit into category of population based evidence)were retrieved from electronic database search engines(PubMed, EBSCO Host (CINAHL, SPORTDiscus) andScopus) using the following key words in combinationwith each other: obesity, exercise, resistance training, en-durance training, strength training, aerobic training, diet,adipokine (adiponectin, leptin), cytokine (CRP,IL-1, IL-6,IL-10, TNF-α), anabolic hormone(testosterone, growthhormone),thyroid hormone, insulin, inflammation, weightloss, fat mass, and fat-free mass. From the journal arti-cles returned by the search engine, articles were in-cluded and excluded based on the following criteria.Additional studies were determined to be included forreview based on citations within relevant articles.Inclusion criteria:
� Published original research from January 1980-April2013
� Published in English or translation of articleavailable
� Utilized only human participants with reportedaverage age for volunteers ranging from 18 and

Figure 1 Description summarizing the steps for inclusion/exclusion and method leading to classification and analysis of studies involved withinthe meta-analysis.
Clark Journal of Diabetes & Metabolic Disorders (2015) 14:31 Page 4 of 28
65 years of age during the duration for theexperiment
� Study population was either identified as either“overweight” or “obese” by authors or was indicatedwithin the study as meeting at least 1 of theclassification metrics for being overweight or obese(i.e. BMI > 25 kg/m3 or WHO levels of %BF forclassification based on age and gender)
� Studies compared at least two conditions (eitherwithin subject cross-over design or comparison to acontrol or basal/baseline) and involved randomassignment to training group(s) or control and tothe order or method of training
� Study designs examined chronic adaptations (i.e.multiple training sessions, or interventions lasting atleast 4 weeks in duration)
� Main purpose was to examine hormonal or cellularresponses to exercise or diet
� Main purpose was to examine changes in body massin response to exercise or diet
� Main purpose was to examine chronic responses toeither exercise modes (e.g., resistance exercise or
endurance exercise), hypocaloric diet, orcombination of one of the exercise modes withhypocaloric diet, or combination of both exercisemodes with hypocaloric diet.
Exclusion criteria:
� Publication was a review article� Not published in English or no translation available� Study design utilized an animal model for the
problem� Population age could be classified as adolescent, or
juvenile, (average age < 18 years of age) and/orelderly (average age > 65 years of age)
� Study population either failed to meet metrics forclassification as “obese” or “overweight”, or wasindicated to have secondary disease (e.g., cancer,osteoporosis, cardiovascular disease) or hadpopulations indicated to have history of metabolicvariables and concurrent treatments (e.g., smoking,pharmacologically controlled type-2 diabetesmellitus (T2DM), cardiovascular diseases) that

Clark Journal of Diabetes & Metabolic Disorders (2015) 14:31 Page 5 of 28
might confound the response to exercise and/or diettreatment
� Study design did not randomly assign subjects to atraining group or control, or order of intervention
� Study design examined strictly acute responses (i.e.,single exercise bout, or intervention lastly fewerthan 4 weeks in duration)
� Main purpose did not involve measure of hormonalor cellular response to exercise or diet
� Results did not report absolute changes in hormonesor body mass following intervention
� Indication of use of dietary supplement, orpharmacological dosing of anabolic or androgenichormones.
Following retrieval and evaluation for inclusion, studydata (reported means and standard deviation/error formeasures of interest, number of subjects in each studygroups, duration of study) were entered into databasefor subsequent analysis, see Figure 1. From the initial ab-stracts screened, a total of 66 studies were included inthe meta-analysis, from which 162 study groups were in-cluded for comparison of responses within the review.Each included study was then classified by parameter ofmeasurement and method, along with categorization ofthe method, of therapeutic intervention, see Table 1, forpooling and tabulating data for analysis based not onlyon the outcome of measure but for demographic infor-mation. From this pooled data for treatment responsesaverages, standard deviations were calculated across thestudies classified by therapeutic intervention and meas-ure of interest regardless of duration of intervention orany additional unique characteristics of the individualstudies. Following which, pooled ES and confidence in-tervals (CI.95) of ES for each measure of interest was de-termined to examine the overall effect relative to a caseof no change (i.e. CI.95 crossing zero within the 95% ofall expected scores) based on each of the following com-parisons, 1) relative to diet-only interventions; 2) relativeto combination of diet and ET interventions; 3) relativeto the combination of diet and RT interventions; and 4)relative to the combination of diet with ET and RTinterventions.In order to complete comparisons between dissimilar
experimental designs, all studies were evaluated for a stan-dardized effect size (ES). Based on the premise for com-paring ES previously utilized [58-60], for each of themeasures of interest based on the therapeutic intervention(Figure 1). This standardized ES across all studies wasundertaken in an effort to control for difference inmethods of measurement and distinct (unique) qualifieddifferences in the therapeutic interventions (see Table 1).And thus allow for comparison between and within thevarious parameters measured based on the therapeutic
intervention in a pooled fashion of ES for response. Eachof measure of interest and within all groups (interventionsas well as indicated control) the treatment ES were cal-culated via (μpost− treatment − μpre − treatment)/(σpooled within).After which, each measure of interest had a pooled ESdetermined between the various treatment protocol group-ings and the control grouping to elicit the pooled thera-peutic effect, via equation (μchange treatment − μchange control)/(σpooled with control). Additional comparison of the pooled ESfor changes were made on between the responses noted inthe various measures of interest across, and relative to thepooled response for the control groups, indicated in thestudies included in the analysis, based on the equation,(μchange across− treatment # 1 − μchange across − treatment # 2)/(σpooled between treatment). Following which, a standardizedconfidence interval (CI) for ES was calculated withineach treatment intervention for use in the comparisonof responses between interventions for each measureof interest based on the pooling of studies forcomparison.In an effort to establish a secondary directionality for
difference between treatments, the within study treatmentES were then clustered for 2x2 χ2 analysis to determine ifany difference in the level of response, standardized ES, byoutcome based on the measure of interest for comparisonbetween responses based on relationship (i.e. above orbelow) to the pooled ES for that given treatment, andcompared between the type of treatment and then basedon sub-classification of physical activity within the treat-ment (e.g., resistance exercise, RT, endurance exercise,ET, organized exercise program, or general physical ac-tivity program), type of diet (e.g., general hypocaloric,low-fat, or low-carbohydrate diet), the combination ofthe diet with exercise programs, and based on the lengthof intervention within the grouping of treatment.
ResultsPooled effectsAs seen in Table 2, there are a wide variety of resultsthat were obtained from each of the therapeutic inter-ventions utilized. Not only for the reduction of bodymass (including FM and FFM) but also for changes inadipokines, hormones, and blood lipid profiles. Suchfindings indicate that all treatments provide an effectivemeans to elicit change relative to status at start of treat-ment or to the control treatment. Interestingly, therewere differences noted between effects favoring thecombination of diet with ET versus diet alone foralterations in body mass (χ2 = 3.09, p = 0.055). And dif-ferences indicate an effectiveness favoring for the com-bination of diet with RT versus diet along for reductionin FM (χ2 = 3.8, p < 0.05) and retention of FFM (χ2 = 6.7,p < 0.0001). With no significant difference noted be-tween the effectiveness for diet with ET or diet with

Table 1 Summary of studies include in meta-analysis indicating the therapeutic intervention used, and the principle measure of interest reported used forcomparison within analysis
Study Therapeutic intervention(Group (N) size & genderof treatment group)
Duration Summary description of therapeutic intervention Measures of Interestreported for comparison
Ahmadizad [83]$ ET (8-M) 3x’s/wk for 12-wk ET: 75–85% of MHR for 20-30-min (progressive), BM, I, Adip
RT (8-M) RT: 4x12 CRT of 11 exercises @ 50–60% 1RM
Anderssen [84] D (34-M) ET: 3x’s/wk for 52-wks D: Low Fat BM, FM, FFM, Cal
ET (34-M) ET: 60–80% of PHR for 60-min
D(E) (43-M)
Ara [85] RT (12-M) RT: 3x’s/wk for 6-wks RT: 1–3 x 3–12 @ Progressive 1RM (range 50-90%) for Squats, Leg Press, LegCurl/Ext, Hip Flexion w/ 90 s rest @ total expenditure of 220–300 kcal/session
BM, FM, FFM, T, OB
Ballor [86] ET (9-M) 3 x’s/wk for 12-wk ET: 50% VO2max x 20–60 min (progressive) BM, FM, FFM
RT: 3x8 @ 50-80% 1RM (progressive) Squat, Bench, Leg Ext/Curl, Arm Ext/Curl,Lateral Pulldown
RT (9-M)
Ballor [87] D (10-W) RT: 3x’s/wk for 8-wks D: hypocaloric @ -1000 kcal/day w/ Protein >1.0 g/kg BM, FM, FFM, Cal
RT (10-W)
D(R) (10-W) RT: 3x10-12 @ 10RM for: Chest Press, Leg Press, Lateral Pull-down, Arm Curl/Ext,Leg Curl/Ext, Calf Raise
Borg [88] D (90-M) D: 2-month ET&RT:3x’s-wk for 24-wk
D: Hypocaloric @ =1200 kcal/d for first and last wk and −500 kcal/d between BM, FM, FFM, Cal
ET (25-M)
RT (28-M) ET: 45 min @ 60-70% VO2max
RT: 3x8 @ 60-80% 1RM CRT
Bouchard [51] D (11-W) RT: 3x’s/wk for 12-wk D: Hypocaloric @ BM, FM, FFM
RT (11-W) −500 kcal/d
D(R) (12-W) RT: 3x8 @ 80% 1RM for (leg press, chest press, leg extension, shoulder press, sit-up,seated row, triceps extension, arm curl, and calf extension) w/ 60–90 s rest
Brehm [89] D, LF (20-W) 24-wks D,LF: Hypocaloric @ ≈ 1250 kcal/d with ~54% CHO, ~18% protein, ~28% fat of kcal/d BM, FM, FFM, TC, TG,LDL, HDL
D, LC: Hypocaloric @ ≈ 1160–1300 kcal/d with ~15-30% CHO, ~25% protein, ~46-57%fat of kcal/d
D, LC (22-W)
Brochu [90] D (71-W) RT: 3x’s/wk for 24-wk D: Hypocaloric @ -500 kcal/d BM, FM, FFM, TC, HDL,LDL, TG, CRP, I, Cal
RT: 3–4 x 8–12 @ 65-80% 1RM (progressive) for (Leg Press, Chest Press, LateralPulldown, Shoulder Press, Arm Curl/Ext) w/ 60–90 s rest
D(R) (36-W)
Bryner [91] D(E) (2-M/8-W) ET: 4x’s/wk RT: 3x’s/wkfor 12-wk
D: Hypocaloric @ ≈ 800 kcal/d BM, FM, FFM, Cal
ET: 20–60 min (progressive) @ self-paced
D(R) (1-M/9-W) RT: 2-4x15-12 @ 15RM-to-8-RM (progressive) for 10-exercise CRT w/ 60-s rest
Campbell [92]*$ D (8-W) RT: 3x’s/wk for 16-wk D: Hypocaloric @ -500 kcal/d BM, FM, FFM, Cal
D(R) (8-W)
Clark
JournalofDiabetes
&Metabolic
Disorders
(2015) 14:31 Page
6of
28

Table 1 Summary of studies include in meta-analysis indicating the therapeutic intervention used, and the principle measure of interest reported used forcomparison within analysis (Continued)
RT: 3x8-12 @ 80% 1RM (for Leg Ext/Curl, Leg Press, Chest Press, Arm Pull) w/60–120 s rest
Christiansen [93] D (29-M/W) ET: 3x’s/wk for 12-wk D: Hypocaloric @ ≈ 600 kcal/d BM, I, OB, TC, HDL, Cal
D(E) (25-M/W) ET: 60–75 min @ unknown intensity to equate to 500–600 kcal/session
ET (25-M/W)
Cuff [94] D(E) (10-W) 3x’s/wk for 16-wk E + R: 75-min @ 60-75% HRR w/ RT@ 2x12 for Leg Press, Leg Curl, Hip Ext, ChestPress, Latissimus Pulldown @ unknown intensity or rest E: 75 min @ 60-75% HRR
BM
D(E + R) (9-W)
Donnelly [95]* D (26-W) ET & RT: 4x’s/wk for12-weeks
D ET: 20–60 min (progressive) @ 70% HRR RT: 2–3 x 6–8 @ 70-80% 1RM (progressive)on CRT exercises unknown, rest unknown
BM, FM, FFM, Cal
D(E) (16-W)
D(R) (18-W)
D(E + R) (9-W)
Donnelly [96]* D (7-W) RT: 3x’s/wk for 12-wks D: Hypocaloric @ =700 kcal/d BM, FM, FFM, Cal
RT: 3 sets 8,6,6 @ 70% 1RM, progress to 4 sets 8.6.6.4 @ 80% 1RM for Bench Press,Latissimus Pull-down, Leg Ext/Curl, Shoulder Press, Arm Pullover, Arm Curl/Ext
D(R) (7-W)
Donnelly [97]$ ET (16-M/25-W) 5x’s/wk for 68-wks ET: 20–45 min @ 60%-75% HRR for 1st 24-wks then 55%-70% of HRM (progressive)for ≈ 2000 kcal/wk (400 kcal/session)
Dunstan [98]*$ D (17-M/W) RT: 3x’s/wk for 24-wks D: Hypocaloric BM, FM, FFM, I, TC, HDL,LDL, TG, Cal
RT: 3x8-10 @ 50-85% 1RM (progressive) for Bench Press, Leg Ext/Curl, Upright Row,Lateral Pull-down, Shoulder Press, Arm Curl/Ext, Abdominal exercises
D(R) (19-M/W)
Fisher [99]*$ D (29-W) ET & RT: 3x’s/wk for 8-wks D: Hypocaloric @ ≈ 800 kcal/d BM, FM, FFM, CRP, IL-6,TNF-α, Cal
ET: 20–40 min @ 65-80% MHR (progressive)D(E) (43-W)
RT: 1-2x10 @ 60-80% 1RM (progressive) for Leg Press, Squats, Leg Ext/Curl, ArmCurl, Lateral Pull-down, Bench Press, Military Press, Trunk Exercises
D(R) (54-W)
Foster [100]* D, HP (12-M/21-W) 52-wks D, HP: Hypocaloric following Dr. Atkins New Diet Revolution BM, FM, FFM, Cal
D (8-M/22-W) D: Hypocaloric @ M ≈ 1500–1800 kcal/d; W ≈ 1200–1500 kcal/d for 60%CHO, 15%protein, 25% fat
Geliebter [101] D (8-M/14-W) ET & RT: 3x’s/wk for 8-wks D: Hypocaloric @ <70% RMR BM, FM, FFM, Cal
D(E) (9-M/14-W) ET: 8-min bicycle erg, 8-min arm erg, 8-min cycle erg @ 55-70% VO2peak (progressive)
D(R) (8-M/14-W) RT: 2x6, 1xfatigue for Leg Ext/Curl, Chest Press, Arm Pull-over, Arm Curl/Ext, Leg Pressw/30 s rest
Goddpaster [102] D (63-M/W) ET: 5 d/wk for 24-wks D: Hypocaloric @ ≈ 1200–2100 kcal/d with 50-55% CHO, 20-25% protein, 20-30% fat BM, FM, FFM, Cal
D(E) (67-M/W) ET: total 60-min/d unknown intensity
Hallsworth [103] RT (11-M/W) 3x’s/wk for 8-wks RT: 2–3 sets x unknown rep @ 50-70% 1RM (progressive) for: Arm Curl/Ext, Chest Press,Leg Curl/Ext, Lateral Pulldown, Shoulder Press
BM, I, TC, TG
Hammer [104]*$ D, LF (14-W) ET: 5x’s/wk for 6-wks D: hypocaloric VL @ =800 kcal/d, LF @ = 1195 kcal/d BM, FM, FFM, Cal
Clark
JournalofDiabetes
&Metabolic
Disorders
(2015) 14:31 Page
7of
28

Table 1 Summary of studies include in meta-analysis indicating the therapeutic intervention used, and the principle measure of interest reported used forcomparison within analysis (Continued)
D, VL (12-W)
ET (12-W) ET: distance of 1.6-4.8 km/session (progressive) @ 60-85% HRM (progressive)
D(E), LF (8-W)
D(E), VL (6-W)
Hill [105] D (3-W) ET: daily for 5-wks D: hypocaloric @ 800 kcal/d BM, FM, FFM
D(E): distance of 1.6-5.6 km/session (progressive) @ unknown intensityD(E) (5-W)
Hill [106] D (6-W) ET: 5x’s/wk for 12-wks D: hypocaloric vary from 600–1500 kcal/d, LF @ 1200 kcal/d BM, FM, FFM
D, LF (8-W)
D(E) (10-W)
D(E), LF (8-W) ET: 20–50 min (progressive) @ 60-70% HRM
Ho [107] D(E) (15-M/W) ET & RT: 5x’s/wk for12-wks
D: hypocaloric BM, FM, FFM, I, OB, TC,HDL, LDL, TG, Cal
ET: 30-min @ 60% HRR
D(R) (16-M/W) RT: 4x12 @ 10RM for Leg Press, Leg Curl/Ext, Bench Press, Seated Row w/ 60 s rest
D(E + R) (15-M/W) E + R: ET for 15-min @ 60% HRR & RT for 2x12 @75%1RM
Ibanez [108] D (12-W) RT: 2-3x’s/wk for 16-wk D: Hypocaloric @ -500 kcal/d BM, FM, FFM, I, Adip, OB,TC, HDL, LDL, TG, Cal
RT: 3-4x10-15 @ 50-80%
D(R) (13-W) 1RM (progressive) CRT for 8-wks & 3-5x10-12@60-80% or 3-5x 4-6@80-90% alternatefor 8-wks
Irving [109]$ E(Low-Intense) (3-M/10-W) 3-5 x’s/wk for 16-wks Low-Intensity: unknown time @ RPE of 10–12 equate to 300–400 kcal/session BM, FM, FFM, GH, IGF,HDL, TG, Cal
E(High-Intense) (3-M/8-W) High Intensity: unknown time @ RPE of 15–17 to equate to 300–400 kcal/session
Josse [110]$ D(E + R), HP (30-W) ET: 7x’s/wk RT: 2x’s/wkfor 16-wks
ET: 7x’s/wk @ total expenditure of 250 kcal unknown duration or intensity BM, FM, FFM, Cal, IL-6
D(E + R), LP (30-W)
D(E + R), MP (30-W) RT: 3x10 unknown intensity & rest interval
Kempen [111] D (10-W) ET: 3x’s/wk for 8-wks D: Hypocaloric @ =500-750 kcal/d BM, FM, FFM, Cal
D(E) (10-W) ET: 90-min group exercise sessions @ 50-60% VO2max
Kerksick [112]$ E + R (17-W) ET&RT: 3x’s/wk for 14-wks E + R: @ HR of 60-80% MHR using CRT of 14 exercises either paired: BM, FM, FFM, Cal
D(E + R), HC + P
(11-W)
D(E + R),VL/HP Arm Ext/Curl, Leg Ext/Curl, Shoulder Press/Lateral Pulldown, Hip Abd/Add, ChestPress/Seated Row, Abdominal Crunch/Back Extension, Shoulder Shrug/Dip; orunpaired: Leg Press, Squat, Pec-Deck, Oblique, Hip Ext, side bends, stepping) x30 s @ unknown %1RM w/ callisthenic 30 s between sets/paired exercise
(48-W) D(E + R),LC (37-W)
D(E + R),HC (41-W)
Klimcakova [113]$ D(R) (12-M) RT: 3x’s/wk for 12-wks D: Hypocaloric BM, FM, FFM, I, Adip, OB,TNF-α, TC, HDL, TG
RT: 1x12-15 @ 60-70% for 17-exercise CRT
Clark
JournalofDiabetes
&Metabolic
Disorders
(2015) 14:31 Page
8of
28

Table 1 Summary of studies include in meta-analysis indicating the therapeutic intervention used, and the principle measure of interest reported used forcomparison within analysis (Continued)
Kraemer [114] D (8-M) RT & ET: 3x’s/wk for12-wks
D: Hypocaloric BM, FM, FFM, Cal
ET: 30–50 min (progressive) @ 70-80% PHR
ET&RT: ET then, 1-3x5-10 @5-7RM or 8-10RM (alternate) for Squat, Military Press,Bench Press, Lateral Pull-down, Seated Row, Trunk exercises, Leg Press, Leg Curls,Calf Raises, Arm Curls with 60–180 sec rest (load dependent)
D(E) (11-M)
D(E + R) (10-M)
Larsen [115]* D, HGI/HP Hypocaloric for 26-wks All diets w/ < 25-30% total kcal from fat BM, FM, FFM, Cal
(97-M/W)
D, LGI/HP LP: PRO:CHO ratio of 1:5 (10–15% total kcal protein and 57–62% total kcal CHO)
(124-M/W)
D, HGI/LP HP: PRO:CHO ratio: of 1:2 (23–28% total kcal protein and 45–50% total kcal CHO)
(106-M/W)
D, LGI/HP HGI: no change in GI diets w/ ~ 12% total kcal from protein
(124-M/W) LGI: reduction of 15 GI points compared with the high-GI diets w/ ~ 12% totalkcal from protein
Layman [116]* D, HP (12-W) 10-wks D, HP: ≈1700 kcal/d @1.6 g/kg protein in ratio of CHO:protein ~1.4 and <30% fatof kcal/d
BM, FM, FFM, I, TH, TC,HDL, DLD, TG
D, HC (12-W) D, HC: ≈1700 kcal/d @0.8 g/kg protein and ratio of CHO:protein >3.5 and <30% fatof kcal/d
Layman [117]$* D, HP (12-W) ET: 5x’s/wk RT: 2x’s/wkfor 16-wks
D, HP: ≈1700 kcal @ 1.6 g/kg for protein with CHO:protein ratio <1.5 and fat <30%of kcal/d
BM, FM, FFM, Adip, OB,Ghrelin, I, TC, HDL, LDL,TG, Cal
D(E + R), HP (12-W) D, HC: ≈1700 kcal/d @ 0.8 g/kg for protein with CHO:protein ratio >3.5 and fat <30%of kcal/d
D, HC (12-W)
D(E + R), HC (12-W) ET: 30-min @ unknown intensity
RT: 1x12 @ unknown resistance intensity for 7 exercise in CRT
Maiorana [118]$ E + R (14-M/2-W) 3x’s/wk for 8-wks E + R: CRT for RT @ 45 s of RT @ 55–65% MVC (progressive) w/ 15 s rest betweenRT followed by 5-min ET @ 70–85% PHR (progressive) intermittent to RT-exercises
BM, HDL, LDL, TC, TG
Marks [119] D (10-W) ET & RT: 3x’s/wk for20-wks
D: Hypocaloric general low fat @ -628 kcal/d BM, FM, FFM, Cal
ET: 12–36 min (progressive) @ 70-85% HRMD(E) (8-W)
D(R) (11-W) RT: 2x8-12 @ 70-90% 1RM for: Leg Ext/Curl, Seated Row, Chest Press, Arm Ext/Curl,and abdominal curls, with unknown rest
D(E + R) (9-W)ET&RT: 12–24 min of ET and 1 set of RT
Moreira [120]$ E(S) (8-M/W) 3x’s/wk for 12-wks E(S):20–60 min (progressive) @ 10% of Anaerobic Threshold BM, FM, FFM, TC, TG
E(I): 20–60 min (progressive) total time @ 2:1 ratio of 120% Anaerobic Threshold toRest time
E(I) (8-M/W)
Nicklas [121] D (53-M/W) ET & RT: 3x’s/wk for72-wks
D: Hypocaloric @ -500 kcal/d BM, CRP, IL-6, TNF-α, Cal
ET: 30–45 min @ 50-75% HRRET (53-M/W)
Clark
JournalofDiabetes
&Metabolic
Disorders
(2015) 14:31 Page
9of
28

Table 1 Summary of studies include in meta-analysis indicating the therapeutic intervention used, and the principle measure of interest reported used forcomparison within analysis (Continued)
E + R: 15-min ET @ 50-75% HRR, followed by 15-min RT @ 2x12 CRT, followed by15-min ET @ 50-75% HRR
D(E + R) (53-M/W)
Oberbach [122]$ ET (40-M/W) 4x’s/wk for 4-wks ET: 3-days: 60-min unknown intensity (20-min calisthenics/20-min steadystate/20-min “power-training” & 1-day: 60-min swimming
BM, FM, FFM, Adip, OB,IL-6, IL-10, CRP, TC, HDL,LDL, TG
Olson [123] RT (16-W) 2x’s/wk for 52-wk RT: 3x8–10 @ 8-10RM (Progressive) for unknown exercises indicated as isotonicvariable resistance machines and free weights targeting the following majormuscle groups: quadriceps, hamstrings, gluteals, pectorals, latissimus dorsi,rhomboids, deltoids, biceps and triceps
BM, FM, FFM, I, Adip, Il-6,CRP, TC, HDL, LDL, TG
Pavlou [124]*$ D (41-M) ET: 3x’s/wk for 8-wks D: Hypocaloric @ = 800 kcal/d BM, FM, FFM
D(E) (31-M) ET: 70-85% MHR for 20–45 min (progressive)
Phinney [125] D, HP (6-W) ET: 6-hrs/wk for 4-wks D: hypocaloric @ =720 kcal/d BM, FM, FFM, Cal
D(E) (6-W) ET: 6-hrs/wk total time @ 50% VO2max
Polak [126] ET (25-W) 5x’s/wk for 12-wks ET: 45-min @ 50-65% VO2max (progressive) for 2x’s/wk group exercise class,3x’s/wk cycle ergometer
BM, FM, FFM I, Adip, OB,IL-6, TC, HDL, TG
Pritchard [127] D, LF: (18-M) ET: 5x’s/wk for 52-wks D: hypocaloric @ -500 kcal/d & 20-25% fat of kcal/d BM, FM, FFM, Cal
ET (21-M) ET: 30–45 min @ 65-75% HRM
Racette [128] D (17-W) ET: 3x’s/wk for 12-wks D: hypocaloric @ =75% BMR BM, FM, FFM, Cal
D(E) (13-W) D(E): 35-min @ 65% VO2max
Rice [129] D (9-M/W) ET: 5x’s/wk RT: 3x’s/wkfor 16-wks
D: Hypocaloric @ -1000 kcal/d BM, FM, FFM
ET: 20–60 min @ 50-85% MHR (progressive)D(E) (10-M/W)
RT: 1x8-12 @ 8-12RM (progressive) for Leg Ext/Curl, Latissimus pull-over, BenchPress, Should Press, Arm Ext/Curl
D(R) (10-M/W)
Rolland [130]* D, HP (1-M/16-W) 36-wks D,HP: hypocaloric @ 800–1500 kcal/d, @ 20%CHO,40% protein, 40% fat of kcal/d BM, FM, FFM, I, Adip, OB,HDL, TC
D, LF (5-M/9-W) D, LF: hypocaloric @ -500 kcal/d @ 35%, CHO, 36% protein, 28% fat of kcal/d
Ross [131] D (15-W) ET: daily x 14-wks D: Hypocaloric @ -500 kcal/d BM, FM, FFM, I, Cal
ET: self-selected duration @ ~80% MHR (equate to 500 kcal/session)D(E) (17-W)
ET (12-W)
Ryan [132]*$ D (23-W) ET & RT: 3x’s/wk for24-wks
D: Hypocaloric @ -250-350 kcal/d BM, FM, FFM
ET: 45-min @ 50-75% HRR (progressive)D(E) (24-W)
D(R) (16-W) RT: variable resistance for 15-rep (3RM to 15 RM) 2–3 sets for Leg Press, ChestPress, Chest Flies, Latissimus Pull-down, Leg Curl/Ext, Arm Curl/Ext w/ 30 s rest
Schjerve [133]$ E(S) (13-M/W) 3x’s/wk for 12-wks IT: 10-min @ 50-60% MHR followed by 4 cycles of 4-min:3-min ratio of 85-95%MHR then 50-60% MHR followed by 5-min @ 50-60% MHR
BM, FM, FFM, TC, HDL, TG
E(I) (14-M/W)
RT (13-M/W) ET: 47-min @60-70% MHR
Clark
JournalofDiabetes
&Metabolic
Disorders
(2015) 14:31 Page
10of
28

Table 1 Summary of studies include in meta-analysis indicating the therapeutic intervention used, and the principle measure of interest reported used forcomparison within analysis (Continued)
RT: 4x5 @ 90% 1RM (progressive) for Leg Press or Squats, trunk exercises @ 3x30w/ 30 s rest
Shue [134] D (21-W) 12-wks D: Hypocaloric @ -500-1000 kcal/d I, Adip, OB, IL-6, IL-10,TNF-α, TC, HDL, LDL, TG
Sigal [135] D(E) (60-M/W) ET & RT: 3x’s/wk for24-wks
ET: 15–45 min @ 60-75% MHR (progressive) BM, FM, FFM, HDL, LDL,TG
D(R) (64-M/W) RT:2-3x7-9 @ unknown intensity in CRT w/ unknown exercises
D(E + R) (64-M/W) E + R: combined both
Slentz [136] ET (22-M/26-W) 3x’s/wk for 32-wks ET: equivalent to 12 mi/wk @ 75% VO2peak BM, FM (as indicated byabdominal)
RT (22-M/30-W) RT:3x8-12 @ unknown RM in CRT fashion
E + R (19-M/25-W) E + R: full sessions of both ET & RT
Strasser [7]*$ D (10-W) ET: 3 x’s/wk for 8-wks D: Hypocaloric @ -500 kcal/d BM, FM, FFM, TC, HDL,LDL, TG, Cal
D(E) (10-W) ET: 60-min @ 60% VO2max
Tjønna [137] E(I) (4-M/7-W) 3x’s/wk for 16-wks IT: 10-min @ 70% MHR followed by 4-cyles of 4-min:3-min @ 90% MHR and 70%MHR, then 5-min @ 50-60% MHR
BM, FM, FFM, I, Adip,HDL, TG
E(S) (4-M/4-W)ET:47-min @ 70% MHR
Tokmakidis [138]$ D(E + R) (9-W) 4x’s/wk (2x’s ET, 2 x’s RT)for 16-wks
ET: 2x’s/wk: 45-min @60-80% MHR (progressive) BM, FM, FFM,I
RT: 2x’s/wk: 3x12 @ 60% 1RM (progressive) for Bench Press, Row, Leg Ext/Curl,Latissimus, Pec Deck w/ 45–60 s rest Pull-down,
Trapp [139] E(I) (15-W) 3x’s/wk for 15-wks IT: cycle ergometer @ 8-sec sprint:12-sec recover intervals progress from 5-min to20-min total time
BM, FM, FFM,I, Adip, OB
E(S) (15-W)ET: 10–40 min @60% VO2peak (progressive)
Volpe [140]*$ D (13-M/15-W) ET: 3–5 x’s/wk for 36-wks D: hypocaloric @ ≈ −500 kcal/d BM, FM, FFM, OB, TC,HDL, LDL, TG, Cal
ET (17-M/17-W)
D(E) (14-M/14-W) ET: 15–30 min for 3–5 x’s/wk (progressive) @ unknown intensity via ski-ergometer
Wang [141]* D, HGI/HP(24-W) 8-wks hypocaloric and24-wks 1 of 4 maintainingdiets
D: 8-wks of low fat/ Hypocaloric @ =800 kcal/d & 24-wks of: BM, I, TC, HDL, LDL, TG,Cal
LF: < 25-30% total kcal from fat with compensatory increase in protein and CHOD, LGI/HP (24-W)
D, HGI/LP (24-W) LP: PRO:CHO ratio of 1:5 (10–15% total kcal protein and 57–62% total kcal CHO)
HP: PRO:CHO ratio: of 1:2 (23–28% total kcal protein and 45–50% total kcal CHO)D, LGI/HP (24-W)
HGI: no change in GI diets w/ ~ 12% total kcal from protein
LGI: reduction of 15 GI points compared with the high-GI diets w/ ~ 12% totalkcal from protein
Watkins [142] ET (14-M/W) ET: 3–4 x’s/wk for 26-wks D: hypocaloric @ ≈ 1200–1500 kcal/d w/ fat @ 15-20% total kcal/d BM, FM, FFM, I, TC, HDL,LDL, TG, Cal
D(E) (14-M/W) ET: 30–35 min @ 70-80% HRR
Wycherely [143] D (16-M/W) RT: 3x’s/wk for 16-wks D: Hypocaloric @ ≈ 1200–1250 kcal/day w/ 0.7 g/kg protein BM, FM, FFM, I, CRP, TC,HDL, LDL, TG
D,HP (12-M/W)
Clark
JournalofDiabetes
&Metabolic
Disorders
(2015) 14:31 Page
11of
28

Table 1 Summary of studies include in meta-analysis indicating the therapeutic intervention used, and the principle measure of interest reported used forcomparison within analysis (Continued)
D(R) (17-M/W) D,HP: Hypocaloric @ ≈ 1200-
1250 kcal/day @1.2 g/kg protein
D(R), HP (14-M/W) RT: 2x8-12@70-85% 1RM for Leg Press, Leg Ext, Chest Press, LatissimusPull-down, Seated Row, Arm Ext w 60 s rest
Note *denotes only treatment ES determined for diet-only intervention, $denotes only treatment ES determined within exercise interventions. Legend: D = diet, RT = resistance training, ET = Endurance Training, E + R =combination of exercise, HP = high protein diet/low carb, HC + P = high carbohydrate & protein, HC = high carbohydrate/low fat, GI = glycemic indexed diet, HGI = high glycemic diet, LGI = low glycemic diet, LC = lowcarb/no protein change, LF = low fat (American Heart Assoc.), VL = very low caloric diet, LP = low protein, MP =moderate protein, D(R) = diet and resistance training, D(E) = diet and endurance training, D(E + R) = dietand combination of exercise, E(S) = steady state endurance, E(I) = interval endurance training, MHR =maximal heart rate; PHR = peak heart rate, HRR = heart rate reserve, CRT = circuit resistance training, IT = intervaltraining, MVC =maximal volitional contraction, RPE = rating perceived exertion, TC = total cholesterol, HDL = high-density lipoproteins, LDL = low-density lipoproteins, TG = triglycerides, T = testosterone, GH = growthhormone, I = insulin, TH = thyroid hormones, IGF = insulin-like growth factor, Adip = adiponectin, OB = leptin, CRP = c-reactive protein, Cal = Caloric Expenditure or reduction from diet, M =men, W = women.
Clark
JournalofDiabetes
&Metabolic
Disorders
(2015) 14:31 Page
12of
28

Table 2 Summary of response based on the pooled therapeutic effect size (ES), from the 32 studies that indicatedcontrol group, ES (CI for ES), based on method of therapeutic intervention and measure of interest
Pooled ES (CI)
Body Masses: D D(E) ET D(R) RT D(E + R)
Body mass 1.24(0.25, 2.23) 1.19$(0.14, 2.25) 0.2¢(−0.38, 0.78) 1.06#(0.07, 3.12) 0.25(0.007, 0.42) 0.57(0.29, 0.84)
Fat mass 0.88(0.22, 1.53) 1.07$(0.41, 1.73) −0.16¢(−0.80, 0.49) 0.63#¢(0.13, 1.57) 0.36(−0.30, 0.59) 0.14(−0.86, 1.13)
Fat-free mass 0.48(0.001, 0.95) 0.02$(−1.05, 1.08) 0.80(0.61, 0.99) 1.08*#¢(0.61, 1.56) 2.23*(−1.5, 5.95) 0.20(−0.18, 0.57)
Hormones, Adipokines,Cytokines:
Insulin 0.30(−0.03, 0.63) 0.55(−0.24, 1.34) 0.11(−0.49, 0.72) 0.47#(0.01, 0.95) 0.79(−0.81, 2.39) 0.30(−0.03, 0.63)
Adiponectin 0.13(−0.18. 0.43) −0.84$(−3.01, 1.33) 1.27(−0.02, 2.54) 1.35#(−0.66, 3.36) 1.05(−0.05, 2.14)
Leptin −0.38(−1.88, 1.11) 1.57(1.25, 1.90) 1.07#(0.46,1.67) −0.38(−1.88, 1.11)
Blood Lipids:
Total cholesterol 0.39(−0.13, 0.90) 0.16$(−0.35, 0.67) −0.16(−0.67. 0.34) 0.32(−1.13, 1.76) 0.001(−0.22, 0.22) 0.93
HDL 0.11(−0.14, 0.37) 0.38$(−0.13, 0.90) 0.96(0.31, 1.60) −0.31*#(−1.11, 0.48) −0.19*(−1.00, 0.62)
LDL −0.01(−0.20, 0.18) −0.09$(−0.69, 0.50) −0.30(−0.33, −0.28) 0.04#¢(−0.89, 0.96) −0.45(−1.46, 0.56)
Triglycerides −0.05(−0.20, 0.11) 0.14$(−0.07, 0.24) −0.28(−0.81, 0.24) 0.24(0.03, 0.45) −0.27(−0.48, −0.06) 0.61(0.08, 1.14)
Caloric difference 0.48(−0.15, 1.11) 0.49$(−0.15, 1.13) 1.16*$(0.15, 2.18) 0.19(−0.50, 0.79) 0.48(−0.15, 1.11)
Note that a negative ES favors the control intervention while a positive ES favors the therapeutic intervention and that for measures of changes to fat-free mass,the indication for retention of mass is considered to be positive. Cells left empty did not have enough responses to indicate either a pooled therapeutic ES relativeto control or a CI for ES. Note that D indicates intervention of diet only, ET indicates endurance training, RT indicates resistance training, D(E) indicates interventionof diet with ET, D(R) indicates intervention of diet with resistance training, D(E + R) indicates intervention of diet with combination of training methods.*Indicates significantly greater response than diet-only intervention, $Indicates difference between modes of endurance exercise intervention, #indicates differencebetween intensity used for resistance exercise intervention, ¢indicates difference in gender response (male > female), ¢*indicates difference in gender response(female >male), for χ2-value > χ2CV, p < 0.05.
Clark Journal of Diabetes & Metabolic Disorders (2015) 14:31 Page 13 of 28
RT for alterations to BM, but a difference for effective-ness that favors RT over ET for FFM retention (χ2 =10.15, p < 0.01). When examining the effect of ET, whenseparated from the aspect of additional diet interven-tion, ET alone appears to less effective to allow for theretention of FFM than dieting alone, or in a combin-ation with use of diet (χ2 = 7.458, p < 0.01). While theuse of RT, both alone as well as in combination with dietprovides greater stimulus for retention of FFM (χ2 = 3.5,p < 0.05). There were also distinct differences noted inresponses based on gender and the type of treatmentutilized. Where males tend to have a larger pooled ESfor responses to diet with RT retention of FFM and re-duction in FM relative to female groups (χ2 = 3.94, and3.64, p < 0.05, respectively). Along with males indicatedhas having a greater level of effectiveness relative tofemales for loss of FM and retention of FFM following anintervention of diet with combination of both ET and RT(χ2 = 3.64, p < 0.05). While females trended toward hav-ing a larger pooled ES for responses to diet alone, χ2 =2.09 (p = 0.11), and in combination to ET for reductionin total body mass, χ2 = 1.94 (p = 0.12), and FM, χ2 = 3.1(p = 0.09), but not FFM. Lastly, as related to changes incaloric (energetic) balance there were no differencesnoted between any of the pooled ES for the assumeddifferences in energetic balance across the various treat-ment interventions.
In comparison of blood lipid profiles, e.g., total choles-terol (TC), high-density lipoproteins (HDL), low-densitylipoproteins (LDL), and triglycerides (TG), all treatmentoptions once again provided an effective means forchange relative to either the pre-intervention status orin comparison to the control conditon. The responsesinvoked by RT, whether alone or in combination withdiet, showed a greater effectiveness for eliciting changesin TC and LDL relative to the diet only options (χ2 =7.18, 4.95, respectively) and trends toward significancefor HDL (χ2 = 3.38, p = 0.068). But showed no differenceto the responses invoked by ET, either with or withoutthe combination of diet. While the use of ET eitheralone, or in combination with diet, show no differencefor effectiveness at eliciting changes blood lipids (TC,LDL and TG) versus the changes elicited by a diet onlyintervention. Yet trended toward favoring ET for effect-iveness in changes seen in HDL (χ2 = 2.842, p = 0.089).Additionally, there were no differences noted on thepooled effect for treatment based on the gender of theparticipant groups for any of the treatment interventionoptions. However there was a trend for women utilizingET in combination with diet for having a great effect inthe changes in HDL levels versus those seen in men (χ2 =2.0, p = 0.12).Similar to the changes seen with blood lipids, effect-
iveness for eliciting positive changes to adipokines

Clark Journal of Diabetes & Metabolic Disorders (2015) 14:31 Page 14 of 28
(adiponectin and leptin) or cytokines (c-reactive protein(CRP), TNF-α) of interest were noted occurring from alltreatment interventions. Furthermore, there were very fewdifferences in the pooled effect size versus the diet onlyintervention, with difference in ES for changes of adipo-nectin and leptin being elicited by the use of RT, eitherwith or without diet, trending toward significant dif-ference, χ2 = 3.085 (p = 0.07) and χ2 = 3.45 (p = 0.06),respectively. While there were no differences noted be-tween the therapeutic effectiveness for treatment in theresponses to either CRP or TNF-α between any of thecombinations for interventions.
Comparison between treatment effectsIn comparison of body compositional changes based onthe method of intervention, as would be expected, thereare effect size differences in treatment responses thatfavor the combination of intervention methods. While adiet alone treatment did induce a beneficial treatmenteffect following intervention. It was not more effective
Figure 2 Description of the pooled ES for treatment response and the ranwith combination of ET, or versus diet with combination of RT) methods fo(FFM). Note that the comparisons are labeled as “treatment-to-comparison”, wwith RT, D(E + R) indicating diet with ET and RT, ET indicating ET-only, anthe comparisons.
than other treatments at inducing changes in FM, seeFigure 2. While the combination of diet and ET was notas effective as any of the other treatments with respectto changing of body composition. ET appears to be ef-fective at inducing a larger loss of FFM relative to dietwith combination of RT (χ2 = 6.531, p = 0.01). With re-spect to the combination of diet and RT, this interven-tion appears to be able to induce favorable adaptions in,measurements of both FM and FFM (χ2 = 9.24 and χ2 =8.02, p < 0.01, respectively). While producing equivalentES for body mass changes as either diet alone, or diet incombination with ET, see Figure 2. Interestingly, therewere no differences noted showing a favor toward thecombination of diet with both ET and RT versus theother intervention methods. In continuation with whatwas noted in the pooled therapeutic effect size, a trendtoward gender difference for effectiveness of treatmentwas noted in the change in FFM for the utilization ofdiet with RT only in male groups versus female counter-parts (χ2 = 3.3, p = 0.06).
ge of CI for ES between intervention (versus diet alone or versus dietr changes in either Body Mass (BM), Fat Mass (Fat), and Fat-Free Massith D indicating diet-only, D(E) indicating diet with ET, D(R) indicating dietd RT indicating RT-only for the various intervention methods within

Clark Journal of Diabetes & Metabolic Disorders (2015) 14:31 Page 15 of 28
Eliciting energetic imbalance indicates a pattern thatfavors an intervention that is a combination of diet withany type of exercise versus that of either diet, or exer-cise, alone, Figure 3. Furthermore, the treatment ES forenergetic imbalance for the combination of diet and ETwere more favorable than any other treatment interven-tion combinations. Interestingly, while the combinationof diet with ET and RT was more effective then either adiet alone or exercise alone it was less effective then ei-ther ET or RT in combination with diet at inducing anenergetic imbalance. Additionally, there were no differ-ences between gender groups that would indicate a greatereffectiveness of a treatment methodology for a specificgender grouping.In regards to changes in the blood lipid profiles,
there were not only indications for difference betweentreatments, there is also a very interesting finding thattherapeutic interventions may actually induce eleva-tions in certain lipids. While the diet only interventiondid have a positive impact on TC and HDL levels, it
Figure 3 Description of the pooled ES for treatment response and the ranwith combination of either ET, RT, or combination of ET and RT) methods fintervention protocol. Note that the comparisons are labeled as “treatmentET, D(R) indicating diet with RT, D(E + R) indicating diet with ET and RT, ETintervention methods within the comparisons.
has only minimal impact on either LDL or TG levels,Figures 4, 5 and 6. Additionally, the treatment inter-ventions that combined diet with ET induced a muchlarger ES, Figure 4, for measures TC and LDL. And dietin combination with RT induces a larger ES in TC,HDL, LDL and TG changes relative to those changesseen in diet only treatments, Figures 4, 5 and 6. More-over, diet with combination of RT was able to producea much lager ES for these measures in comparison tothose induced by diet with combination of ET, for eachof these measures, see Figures 4, 5 and 6. As far aschanges in TG, diet with combination of RT appears bethe least effective for inducing changes relative to ei-ther the diet only or the diet with combination of ET,Figures 4, 5 and 6. Additionally, there appears to be apattern where the induction for changes in lipid pro-files cannot be established through the use of ET onlyfor all measures. While RT is the only intervention thatappears to be slightly more effective than diet alone ordiet in combination of ET for changes in HDL and TG,
ge of CI for ES between intervention (versus diet alone or versus dietor changes in energetic imbalance as assumed established within the-to-comparison”, with D indicating diet-only, D(E) indicating diet withindicating ET-only, and RT indicating RT-only for the various

Figure 4 Description of the pooled ES for treatment response and the range of CI for ES between intervention (versus diet alone) methods forresponse related to changes in blood lipid profiles TC, HDL, LDL, and TG. Note that labeled groups go as follows: D indicating diet-only, D(E)indicating diet with ET, D(R) indicating diet with RT, and D(E + R) indicating diet with ET and RT for the various intervention methods withinthe comparisons.
Clark Journal of Diabetes & Metabolic Disorders (2015) 14:31 Page 16 of 28
Figures 4, 5 and 6. There were gender differences notedfor effectiveness of treatment for HDL and TG but notfor LDL or TC, both of which indicate a larger effective-ness for treatment in female grouping versus malecounterparts.The most prominently reported hormones and cyto-
kine signal throughout the studies was insulin, followedby adiponectin, leptin, IL-6, CRP, and TNF-α. And assuch are the hormone and cytokines reported on here asthey provide a large enough N-size to allow for compari-son of a pooled ES and CI for ES based on treatmentintervention. In which ES for eliciting changes in insulin,Figure 7, indicates that ET in combination with diet (oras a stand-alone intervention) induces a lower effectthan diet alone. While the use of RT either alone, or incombination with diet, was more effective than dietalone it was less effective than ET or the combination ofdiet with ET and RT, see Figure 7. There was a genderdifference to response and effectiveness indicated withinthe analysis for insulin changes, with treatments appear-ing to be more effective in male groupings than in femalegroups.There were highly variable responses for effective-
ness for each treatment method to induce changes to
circulating levels of adiponectin, leptin, TNF-α, or CRP(Figures 8, 9 and 10). In which, diet alone and in com-bination with ET, were more effective than what wasseen with changes induced by the incorporation of RTfor changes to adiponectin and leptin, Figures 8, 9 and10. While the changes induced in CRP and TNF-α,Figures 8, 9 and 10, were nearly identical, i.e. ES thatcrosses 0, for differences in effectiveness for changesbetween diet alone, or diet in combination with exer-cise (either ET, RT or combination of ET and RT). Andall were more effective than the exercise alone treat-ments. Further there were no indication for a more ef-fective means to change cytokine or adipokine levelswith the utilization of diet in combination with bothET and RT. Interestingly, there were no gender differencesindicated throughout the analysis of ES for any of thechanges to the level of cytokines or adipokines followingtreatments, regardless of the methodology employed.
Comparison within treatment methodsNot only were there differences indicated between thetreatment options, but also within the various treatmentmethods. First is the differences based on diet method.

Figure 5 Description of the pooled ES for treatment response and the range of CI for ES between intervention (versus diet with combination ET)methods for response related to changes in blood lipid profiles TC, HDL, LDL, and TG. Note that labeled groups go as follows: D indicating diet-only, D(E) indicating diet with ET, D(R) indicating diet with RT, and D(E + R) indicating diet with ET and RT for the various intervention methodswithin the comparisons.
Clark Journal of Diabetes & Metabolic Disorders (2015) 14:31 Page 17 of 28
With the use of a high protein diet, indicated here as adiet with >1.5 g protein*kg−1body mass (>25% of totalkcal/d), in a hypocaloric model inducing a larger effectfor body compositional changes relative to any of theother diet methods, ES of 0.60, 0.54, 0.38 for loss ofbody mass, FM and retention of FFM respectively. Fur-ther, lower fat diet was less effective when compared toeither a glycemically controlled diet, or the high protein/low carbohydrate diet for the change of any body com-positional measures, ES of −0.64. Especially in relationto the high protein/low carbohydrate diet, ES of −1.04.Similarly, the lower carbohydrate and higher proteinmodel lead to a greater effect in changes to blood lipidsand cytokines (adiponectin and leptin) with an ES of0.60, 2.14, 0.59, and 0.77, for TC, HDL, adiponectin andleptin respectively.Also exercise of high intensity (indicted as with RT
training intensities ≥75% of 1RM at a training volume of2–4 sets of 6–10 reps and when free-weight resistance isutilized or ET utilizing interval intensities or a steady-statewith intensities ≥70% VO2max or HRmax) elicited greatereffectiveness at inducing changes to body composition, in-sulin levels, blood lipids, and cytokines (adiponectin, CRP,
IL-6), with an ES of 0.49, 0.66, 0.37, 0.50, 0.75, 0.78, 0.75,0.66, 1.15, and 0.92 for BM, FM, FFM, Insulin, TC, LDL,TG, adiponectin, CRP, and IL-6 respectively. As should beof no surprise, the combination of a high level of trainingintensity (regardless of method of exercise, ET or RT orET and RT, or in combination with diet or not) induced agreater effect on the level of energetic imbalance than alower level of training intensity. When comparisons basedon training intensity indicate a clear preference towardsuse of higher levels of training intensity. Where higher in-tensity training once again elicited a greater effect in theresponses than lower intensities (ES of 0.66, 0.3, 0.42,1.15, 0.92 for adiponectin, leptin, TNF-α, CRP and IL-6respectively). And is better than the diet only option fortreatment (ES of 0.26, 0.59, 0.29, 0.86, 0.33 for adiponec-tin, leptin, TNF-α, CRP and IL-6 respectively). Compari-son between exercise modalities indicates RT protocolsproduced a greater ES for changes in adiponectin for higherintensities (ES of 0.74), but not for lower (ES of −1.14) withno differences noted for changes in leptin, relative to ET.Likewise, RT induced a greater ES for changes in IL-6and CRP relative to ET, at higher (ES of 0.27 and 1.34,respectively) and lower intensities (ES of 0.36 and 0.76,

Figure 6 Description of the pooled ES for treatment response and the range of CI for ES between intervention (versus diet with combination ofRT) methods for response related to changes in blood lipid profiles TC, HDL, LDL, and TG. Note that labeled groups go as follows: D indicatingdiet-only, D(E) indicating diet with ET, D(R) indicating diet with RT, and D(E + R) indicating diet with ET and RT for the various interventionmethods within the comparisons.
Clark Journal of Diabetes & Metabolic Disorders (2015) 14:31 Page 18 of 28
respectively). Furthermore there is an indication for fa-voring higher intensity RT at an ES of 0.47 for BM, of0.30 for FM and 0.40 for FFM, respectively to any of theET protocols, ET and RT combination or lower intensityRT. And favor higher intensity ET at an ES for 0.35 forBM and 0.39 for FM but not for retention of FFM 0.13relative to lower intensity ET. Where comparisons be-tween exercise intensities within the ET and the RT pro-tocols, indicated favor toward ET (ES of 0.66, 1.13, 0.61,and 0.96 for TC, HDL, LDL, and TG respectively), andRT (ES of 0.85, 0.86, and 0.60 for TC, LDL, and TGrespectively).
DiscussionGiven that any change in behavior in highly sedentaryindividuals who are overfat should result in an immedi-ate effective means for altering both body compositionand health status. That occurs regardless of the methodsutilized for the adult who is overfat. And given that allstudies in publication indicate an ability to produce apositive effect to both body composition and healthstatus. It should not be surprising to find ES acrossstudies that indicate and effective treatment regardless
of methodology utilized. Yet, while all treatment optionsshow a favor for effective treatment for inducingchanges in body mass. The effectiveness by which thebody composition measures changed was highly vari-able based on the specific methodology being utilized.Moreover, they varied widely in the effectiveness forthe biomarkers of health status of the adult who isoverfat, Table 2. Moreover, the analysis of ES pooledacross studies in aggregate indicate here is that whathas been the general classically recommend treatmentfor overfatness, and associated diseases, may not actu-ally be the most effective. Where the methodological,and sociological, bias towards said programs may be theinherent rationale for continued praise and high recom-mendation to individuals who are overfat. And maypromote the reoccurring cycles of repetitive diets andexercise programs for changes in body morphology andhealth status [13,14,15,16].As evident in the fact that classically recommended,
and routinely cited in popular press, lower fat diet wasless effective for changing any body compositional mea-sures relative to the other dietary only options. Withthe higher protein diets being more effective than the

Figure 7 Description of the pooled ES for treatment response and the range of CI for ES between intervention (versus diet alone or versus dietwith combination of ET, or versus diet with combination of RT) methods for response related to changes in Insulin. Note that the comparisonsare labeled as “treatment-to-comparison”, with D indicating diet-only, D(E) indicating diet with ET, D(R) indicating diet with RT, D(E + R) indicatingdiet with ET and RT, ET indicating ET-only, and RT indicating RT-only for the various intervention methods within the comparisons.
Clark Journal of Diabetes & Metabolic Disorders (2015) 14:31 Page 19 of 28
glycemic controlled diets relative to the lower fat diets.Therefore, should a diet-only intervention be recom-mended, and in agreement with previous reviews onthe topic [61-64], a hypocaloric high-protein/low carbo-hydrate diet appears to generate the greatest ES forchange relative to all hypocaloric, and low fat, diets.This effectiveness appears within diet interventions thatutilized a level >1.5 g protein*kg−1body mass (>25% oftotal kcal/d), within the hypocaloric diet with a CI for ESinduced always favoring the high protein diet, while notwith diets with lower protein, ~1.0 g of protein*kg−1BM(<20% of total kcal/d), and higher carbohydrate (regardlessof glycemic load) threshold for ES induced a CI.95 thatcrosses into the area of having no effect (i.e. ES ≤ 0) atchanging of body composition.Further, the addition of exercise provided stimulus for
responses that are at least as effective as any diet-onlymethod for altering body composition, see Table 2 andFigure 2. And analysis of effectiveness showed prefer-ence of favor toward RT rather than the classically rec-ommended ET at being more effective to elicit beneficial
changes. When combined with diet, exercise interven-tions were more effective at inducing responses in bodycompositional changes than either an exercise, or diet,alone option for intervention. The effectiveness for exer-cise becomes more pronounced with higher levels of in-tensity of exercise regardless of the methodologyemployed (i.e. ET, RT, or combination therein) withinthe intervention protocol. Additionally, there is a cleardelineation between the modes of exercise used and theeffectiveness at inducing responses. While heavy recom-mended by a number of organizations and through avariety of position stands [17,55,65], or stated in previ-ous reviews on the subject [4,7-10,12], as being more ef-fective at inducing changes in body composition the useof a ET alone, or in combination with RT, and in com-bination with diet interventions were not more effectthan the combination of RT with diet, Figure 2.Within this difference of effectiveness for treatment,
diet with RT was not only more effective at altering BMin the most beneficial pattern (i.e. reduction of FM withretention of FFM), without regard to level of training,

Figure 8 Description of the pooled ES for treatment response and the range of CI for ES between intervention (versus diet alone) methods forresponse related to changes in Adiponectin, Leptin, CRP, TNF- α and IL-6. Note that labeled groups go as follows: D indicating diet-only, D(E)indicating diet with ET, D(R) indicating diet with RT, and D(E + R) indicating diet with ET and RT for the various intervention methods withinthe comparisons.
Clark Journal of Diabetes & Metabolic Disorders (2015) 14:31 Page 20 of 28
versus any of the other categorization of the methods forexercise. And when employed at even lower levels ofstimulation (e.g., <70% 1RM, single set for at least 12repetitions, use of pneumatic or selectorized machines,and performance of circuit resistance training) RT pro-vides responses that mimic the ES from ET, or the com-bination to ET and RT. Where responses mirror eachother, whether or not diet is involved in the treatment.And becomes more effective at higher levels of stimula-tion RT (e.g., >75-80% 1RM for at least 3 sets with repe-tition ranges of 5-to-10 with 60-to-90 second restintervals) at inducing changes in body composition thatleads to the reduction of BM and FM, while retaining(and in some cases increases of ) FFM for the individualwho is overfat. Further, ET appeared to have its greatesteffect when either in an interval style of ET, or at higherintensities of at ≥75% VO2max (or HRmax/peak), while notat the traditionally recommended moderate (e.g., 55-75%VO2max, or HRmax/peak) steady-state ET for response tochanges in BM and FM, but not for changes in FFM.
There is also the classically held view of the relation-ship between caloric imbalance and the altering bodycomposition for adults who are overfat. Where if the as-sumption is correct, there should be a relationship ofequivalence in effectiveness for changing caloric balancewith body compositional changes between treatmentmethods. However, based on analysis here, the effective-ness for inducing changes in caloric imbalance does notmatch the effectiveness to induce body compositionalchanges for the adult that is overfat. This alternateview to the equation indicates, as previously speculated[19,27], that the issue of overfatness is one that ishighly complex. Where there a variety of intercon-nected factors at play beyond the simplistic caloric bal-ance issue relative to not only body composition butalso the alteration of health status for the adult who isoverfat. And hints at a possible problem for continuallylinking these two factors in relationship to changes,not only body compositional changes but also thehealth status change. As there are number of problem
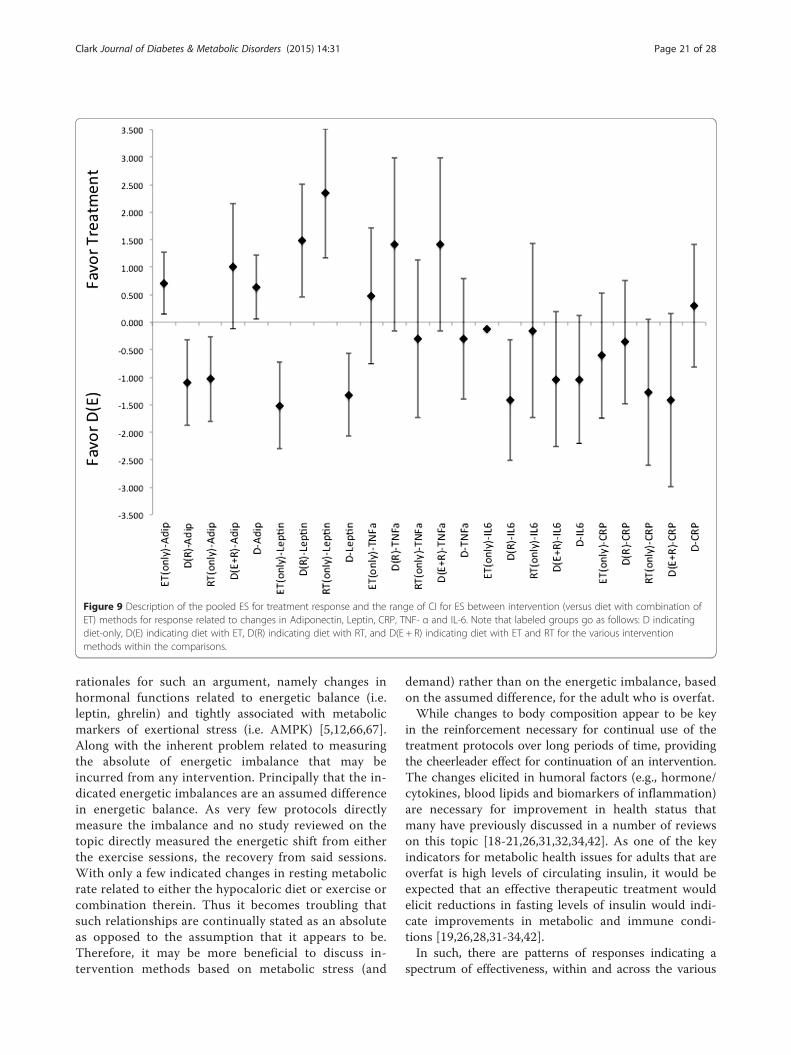
Figure 9 Description of the pooled ES for treatment response and the range of CI for ES between intervention (versus diet with combination ofET) methods for response related to changes in Adiponectin, Leptin, CRP, TNF- α and IL-6. Note that labeled groups go as follows: D indicatingdiet-only, D(E) indicating diet with ET, D(R) indicating diet with RT, and D(E + R) indicating diet with ET and RT for the various interventionmethods within the comparisons.
Clark Journal of Diabetes & Metabolic Disorders (2015) 14:31 Page 21 of 28
rationales for such an argument, namely changes inhormonal functions related to energetic balance (i.e.leptin, ghrelin) and tightly associated with metabolicmarkers of exertional stress (i.e. AMPK) [5,12,66,67].Along with the inherent problem related to measuringthe absolute of energetic imbalance that may beincurred from any intervention. Principally that the in-dicated energetic imbalances are an assumed differencein energetic balance. As very few protocols directlymeasure the imbalance and no study reviewed on thetopic directly measured the energetic shift from eitherthe exercise sessions, the recovery from said sessions.With only a few indicated changes in resting metabolicrate related to either the hypocaloric diet or exercise orcombination therein. Thus it becomes troubling thatsuch relationships are continually stated as an absoluteas opposed to the assumption that it appears to be.Therefore, it may be more beneficial to discuss in-tervention methods based on metabolic stress (and
demand) rather than on the energetic imbalance, basedon the assumed difference, for the adult who is overfat.While changes to body composition appear to be key
in the reinforcement necessary for continual use of thetreatment protocols over long periods of time, providingthe cheerleader effect for continuation of an intervention.The changes elicited in humoral factors (e.g., hormone/cytokines, blood lipids and biomarkers of inflammation)are necessary for improvement in health status thatmany have previously discussed in a number of reviewson this topic [18-21,26,31,32,34,42]. As one of the keyindicators for metabolic health issues for adults that areoverfat is high levels of circulating insulin, it would beexpected that an effective therapeutic treatment wouldelicit reductions in fasting levels of insulin would indi-cate improvements in metabolic and immune condi-tions [19,26,28,31-34,42].In such, there are patterns of responses indicating a
spectrum of effectiveness, within and across the various

Figure 10 Description of the pooled ES for treatment response and the range of CI for ES between intervention (versus diet with combination ofRT) methods for response related to changes in Adiponectin, Leptin, CRP, TNF- α and IL-6. Note that labeled groups go as follows: D indicatingdiet-only, D(E) indicating diet with ET, D(R) indicating diet with RT, and D(E + R) indicating diet with ET and RT for the various interventionmethods within the comparisons.
Clark Journal of Diabetes & Metabolic Disorders (2015) 14:31 Page 22 of 28
methods of diet, exercise or combination of diet with ex-ercise. As indicated with inducing changes in fastinglevels of insulin, where dieting alone is shown to beoverall less effective than any of the exercise or diet incombination with exercise modalities. Once again the high-protein (regardless of carbohydrate modification) diet wasmore effective than the simply having a hypocaloric, or thetraditional low fat, diet within the spectrum of diet optionsexamined, ES of 0.49. And is seen even more so when com-bined with an exercise programs, ES of 0.77. Lending furthersupport to the evolving opinion regarding the employmentof higher protein diets for adults who are overfat.Additionally, exercise was more effective at inducing
changes in fasting insulin levels than diet. And in con-gruence with many of the position stands offered andclassically recommend [1,17,55], the use of ET (bothalone and in combination with diet or in conjunction ofdiet and RT) was more effective than RT (either whenused alone or in combination with diet) for eliciting changesin insulin. This difference in treatment effectiveness is
reversed with incorporation of the high protein/low carbo-hydrate diet with combination of exercise where RT is moreeffective than ET, regardless of intensity (ES of 3.5). It shouldalso be noted that the combination of diet with RT was onlyintervention that provided a pooled therapeutic ES that didnot elicit the possibility of no response (i.e. crosses a pointof ES = 0) from treatment relative to the control. And notsurprisingly, the use of higher-intensity exercise was moreeffective than lower-intensity exercise without regard to dietselection. While these findings support the use of ET withintreatment protocols, there is an indication that RT is a viableoption for the adult who is overfat and does not self-selecttowards an ET mode of exercise [13,15,27,28]. Thusgiven the findings here, utilizing RT can be a more ef-fective treatment for reversing insulin resistance, as thepsychological adherence to the program may provideadditional reinforcement for continual use of exercisewithin a treatment regimen. And when combined withthe combination of a high protein/low carbohydratediet, RT exercise (regardless of level of intensity) can

Clark Journal of Diabetes & Metabolic Disorders (2015) 14:31 Page 23 of 28
be significantly more effective than the standard ETrecommendations.There is also a spectrum effectiveness to elicit re-
sponses in blood lipids form the various treatments indi-cates trends in the data towards the use of exercise (ET,RT or combination thereof ) either alone or in combin-ation with diet for effectiveness of treatment over theuse of simple dietary interventions. In which all treat-ments offer a small degree of effectiveness for alteringlipid profiles for the individual who is overfat. With thecombination of diet and exercise was more effective thandiet alone or exercise alone. And as indicated here, thereis a favor toward use of RT is seen with eliciting reduc-tions of blood lipids levels, TC, LDL and TG, relative toeither dieting alone, or in combination of diet with ET.Which lends further support toward using RT within thetreatment methods. As previously noted, this differencein effectiveness becomes even more pronounced in favorof the higher intensity exercise protocols (regardless ofusing ET or RT).This spectrum for a continuum of effectiveness con-
tinues as related to the levels of cytokines (e.g., TNF-α,CRP, leptin and adiponectin) related to inflammationand chronic immune response. Where any treatment isable to produce an effective change that leads toward anormal “healthy” range, thus leading to a reduced risk fordevelopment of cardiovascular disease and improvementsin work capacity and overall health [18,26,32,34,42,68].However, these responses were highly variable and mostof the indications for effectiveness, both as a therapeuticeffect and treatment effect, near that point of zero differ-ence in effect (i.e. ES = 0). Most interesting were re-sponses seen in changes to levels of CRP, found inrelation to diet alone and diet with RT. Where diet com-bined with RT induced an almost equal level of effective-ness to that of diet alone. With both indicated as beingless effective than the combination of diet with ET or thecombination of diet with ET and RT. Indicating a possiblemetabolic difference between exercise modalities that mightinduce the differential cardiovascular adaptations notedfollowing these distinct intervention protocols.Moreover, there are differences in effectiveness noted
between RT and ET. This is seen regardless of being uti-lized alone or with modification to diet, or based on theintensities of training. Based on such stratificationthere is an indication for the role of the metabolic de-mand of treatment eliciting differential response tocytokine and adipokine signals that alter whole bodymetabolism. Where it appears that the better meansfor prescription of exercise is at the higher levels oftraining intensities. And when associated with the con-cept of self-selection toward distinct exercise modesleading to greater utilization [13,15,56], supports the in-dication for practitioners to recommend and prescribe
the use of RT within treatment options that have beenspeculated about previously [28,47-50]. As incorporat-ing RT may provide the metabolic stimulus to not onlythe means for improvement of health status but as itmay be more readily self-selected lead to longer periodsof utilization such activities throughout one’s remaininglifespan as been previously suggested [15,69]. Especiallyif RT is prescribed at the higher levels of training inten-sities than what has been previously recommended andcloser to what is traditionally utilized for hypertophica-tion responses in lean and active individuals.While one intention of the study here was to examine
the changes in anabolic hormones that have shown re-duced levels with overfatness (e.g., testosterone (T) andgrowth hormone (GH)) in particular relative to the thera-peutic interventions of diet, exercise or combination ofdiet and exercise. There were too few studies that lookedat these changes in relation to the treatments that wereused, that did not involve a pharmaceutical intervention.From the few studies that examined this change, the rela-tive changes in absolute values note an increase in testos-terone and growth hormone that seem to not be relatedto the intervention used, but instead changes in FM fol-lowing treatment. While a number of studies have exam-ined the issue in responses acutely either to exerciserelative to differences between the normal fat control andthe overfat population, or in relation to a pharmaceuticaltreatment option without use of exercise. Given thecurrent opinions [36,70-72] regarding the role of suchhormones in relation to body composition and disease itseems that studying such changes may prove to be a veryfruitful avenue for future research in the various interven-tion programs. Especially given the previously notedchanges in GH from hypocaloric diets and within variousexercise treatments utilized [73,74]. Which is matchedwith the changes in levels of T, binding proteins and per-ipheral receptors for T that are associated with exercise, inparticular RT in a fasting state (which should relate wellwith a hypocaloric model), and may mirror the hormonereplacement therapy treatment application for some indi-viduals with this population [45,46,132,75-78]. However,there is limited analysis to speculate either to the extent,beyond expected changes toward normal levels, or timeframe for changes within anabolic hormones for adultswho are overfat. But given the compatibility of immuno-logical and metabolic profiles between the overfat and theelderly populations, it can be speculated that use of exer-cise, in particular RT should mimic what has been shownwith elderly populations [79-82].
ConclusionsAnalysis of effectiveness of responses both within andbetween interventions differences for treatment optionsmodalities (e.g., diet, exercise, or combination therein)

Clark Journal of Diabetes & Metabolic Disorders (2015) 14:31 Page 24 of 28
along with submodality of treatment (e.g., high intensityversus low intensity, high protein/low carbohydrate di-ets) indicate a continuum of effectiveness. Most import-antly is that protocols utilizing exercise were more effectivethan those that employed just a hypocaloric diet. With thecombination of diet with exercise (especially RT) beingmore effective than diet or diet with ET in reduction ofbody mass and fat mass while retaining of FFM followingtreatment. And are at least as effective for changing hormo-nal levels and blood lipid profiles. Also, while popular ideassuggest the necessity for acute energetic imbalance, thereappears to be no relationship between any treatments ef-fectiveness for inducing acute changes in energetic balancewith the effectiveness for induced responses to body com-position or biomarkers of health from said treatment pro-gram. All of which reinforces the idea of a more complexnetwork of factors that influence overall body compositionand health issues for the adult who is overfat, and furtherstresses the idea to focus treatment on generating a meta-bolic stress to induce chronic endocrinological (and cyto-kine) changes as opposed to the focus on the kcal/d (kJ/d)ratios of intake to expenditure.Further, based on ES for responses to RT (in combin-
ation with diet, or with diet and ET), one would be ableto expect that at the very least 55% of any population ofoverfat adults should have beneficial responses in allbody compositional measures from the incorporation ofRT into a treatment play, along with an even greaterpercentage having a favorable response to altering fast-ing levels of insulin, total cholesterol, low-density lipo-proteins and triglycerides. Additionally, when exercise isutilized at appropriate intensities (i.e. higher levels) bothET and RT provides an effective stimulus to alter TNF-α,CRP, leptin and adiponectin levels that all indicate a re-duction in the risk for cardiovascular disease and im-proved metabolic flexibility for the adult who is overfat.With RT producing a greater level of effectiveness foraltering these measures, especially when RT is progres-sive and periodized with a training volume of 2-to-3sets at 6-to-10 reps with an intensity of ≥75% 1RM anda rest interval of 60–90 seconds, and utilizes wholebody (and free-weight) exercises. And thus indicatesthat RT should be more readily recommended as an ap-propriate treatment option to adults who are overfatthan what has been recommended currently.Yet, however the effectiveness of this combination of
diet and RT might be for inducing changes, the conceptof self-selection of exercise patterns means that someadults who are overfat may select toward protocols ofET for exercise. For those who self-select toward ET, itappears that ET is more effective when performed athigh intensity (e.g., ≥70% VO2max, or HRmax) steady-state method or as an interval training style (based onES calculated gives an expectations of at least 40% of the
population showing beneficial responses to intervention).Likewise, some may select away from exercise altogether,which based on overall effectiveness should be discour-aged but if utilized as a stand alone intervention, dietscan be effective if hypocaloric and comprised of a higherpercentage of total caloric intake from protein, with anexpectation for at least 55% of the population showing abeneficial response from the intervention.Lastly, there needs to be further examination of findings
noted here. First, related to the ongoing understanding ofthe anabolic dysregulation that accompanies the situationof being overfat. In this light there is a need to examinethe relationship of changes in said hormones based onintervention within populations of individuals who areoverfat. Not with simply acute comparison to lean activepopulation, but within the concept of altering levels ofanabolic hormones, responses at peripheral tissues andthe relative timeframe for seeing such hormonal responsesbased on the various interventions utilized. And how theimpact of periodization and concurrent exercise exposurehas on these responses. Second, related to the issues ofdifferential response between genders to identify if theremay be a more beneficial response for males versus thosefor females, and vice versa. Third, based on the currentunderstanding of application of exercise modalities if thereare differential responses to programs based on locationfor intervention and professional associated with oversee-ing intervention (e.g., in hospital versus out-patient phys-ical therapy clinic versus community health center/gymnasium or for-profit health center/gymnasium). Add-itionally, and as noted earlier, there needs to be an evalu-ation of programs and protocols readily available to thepopulous or utilized within studies for this population.Most exercise programs seem to be highly elaborate forthe sake of complexity. In what appears as an effort ofmarketing the program as being different, as opposed tobeing elaborate for the sake of progressive periodization.Where the elaboration for periodization of exercise ismeant to provide stimulus for continual adaptationswithin the exerciser. Finally, most programs that havebeen established based on the idea of energetic imbal-ance need to be careful with establishing such an idea,as the energetic imbalance is based on an assumptionthat might not be held in all cases. As changes to notonly body composition but also health status comesfrom manipulation of highly elaborate network of fac-tors that interact, compliment and confound the impactof each other for the adult who is overfat leading to notonly body compositional changes, but reversal of thedeleterious health outcome of being overfat.
AbbreviationsD: Diet; ET: Endurance Training; RT: Resistance Training; E + R: Combination ofET and RT; D(E): Diet with ET; D(ER): Diet with combination of ET and RT;D(R): Diet with RT; BM: Body mass (kg); BMI: Body mass index (kg*m−3);

Clark Journal of Diabetes & Metabolic Disorders (2015) 14:31 Page 25 of 28
%BF: The percent of body mass comprised on fat mass; FM: Fat mass (kg, oras determined by %body fat); FFM: Fat-free mass (kg, or as determined by%fat-free mass); TG: Plasmal triglycerides; TC: Plasmal total cholesterol;HDL: High-density lipoproteins; LDL: Low-density lipoproteins; ES: Effect sizeas determined by pooled effect size via random effect computation;T2DM: Type 2 diabetes mellitus or metabolic syndrome; T: Testosterone;GH: Growth hormone; CRP: C-reactive protein; TNF-α: Tumor necroticfactor-alpha; VO2max: Maximal aerobic capacity; HRmax: Maximal sustainableheart rate; 1RM: Maximal level of resistance for a single repetition(i.e. maximal strength).
Competing interestsThe author declares that he has no competing interests.
Received: 12 March 2014 Accepted: 2 April 2015
References1. Centers for Disease Control and Prevention (CDC). Adult participation in
aerobic and muscle-strengthening physical activities–United States, 2011.MMWR Morbidity and mortality weekly report. 2013; 62: 326–330
2. Brown A. Snapshot: U.S. obesity rate ticking up. Gallup. 2013. http://www.gallup.com/poll/163205/snapshot-obesity-rate-ticking.aspx, Accessed,October, 20, 2013.
3. Mendes E. Americans exercising less in 2013. Gallup. 2013. http://www.gallup.com/poll/163718/americans-exercising-less-2013.aspx, Accessed,October, 20, 2013.
4. Hansen D, Dendale P, Berger J, van Loon LJC, Meeusen R. The effects ofexercise training on fat-mass loss in obese patients during energy intakerestriction. Sports Med. 2007;37:31–46.
5. Hainer V, Toplak H, Mitrakou A. Treatment modalities of obesity: what fitswhom? Diabetes Care. 2008;31 Suppl 2:S269–77.
6. Lee DC, Sui X, Blair SN. Does physical activity ameliorate the health hazardsof obesity? Br J Sports Med. 2009;43:49–51.
7. Strasser B, Spreitzer A, Haber P. Fat loss depends on energy deficit only,independently of the method for weight loss. Ann Nutr Metab.2007;51:428–32.
8. Varady KA, Bhutani S, Klempel MC, Kroeger CM. Comparison of effects ofdiet versus exercise weight loss regimens on LDL and HDL particle size inobese adults. Lipids Health Dis. 2011;10:119.
9. Votruba SB, Horvitz MA, Schoeller DA. The role of exercise in the treatmentof obesity. Nutrition. 2000;16:179–88.
10. Larson-Meyer DE, Redman L, Heilbronn LK, Martin CK, Ravussin E. Caloricrestriction with or without exercise: the fitness versus fatness debate. MedSci Sports Exerc. 2010;42:152–9.
11. Lee S, Kuk JL, Davidson LE, Hudson R, Kilpatrick K, Graham TE, et al. Exercisewithout weight loss is an effective strategy for obesity reduction in obeseindividuals with and without Type 2 diabetes. J Appl Physiol.2005;99:1220–5.
12. Williams PT. Health effects resulting from exercise versus those from bodyfat loss. Med Sci Sports Exerc. 2001;33:S611–21. discussion S640-611.
13. Brock DW, Irving BA, Gower B, Hunter GR. Differences emerge in visceraladipose tissue accumulation after selection for innate cardiovascular fitness.Int J Obesity (2005). 2011;35;2:309–12.
14. Eriksson JG. Exercise and the treatment of type 2 diabetes mellitus. Anupdate. Sports Med. 1999;27:381–91.
15. Fogelholm M. How physical activity can work? Int J Pediatr Obes.2008;3 Suppl 1:10–4.
16. Hooper LE, Foster-Schubert KE, Weigle DS, Sorensen B, Ulrich CM, McTiernan A.Frequent intentional weight loss is associated with higher ghrelin and lowerglucose and androgen levels in postmenopausal women. Nutri Res (New York,NY). 2010;30:163–70.
17. American College of Sports Medicine (ACSM), American DiabetesAssociation (ADA). Exercise and type 2 diabetes: American College of SportsMedicine and the American Diabetes Association: joint position statement.Exercise and type 2 diabetes. Med Sci Sports Exerc. 2010;42:2282–303.
18. Bruunsgaard H. Physical activity and modulation of systemic low-levelinflammation. J Leukoc Biol. 2005;78:819–35.
19. Clark JE. An overview of the contribution of fatness and fitness factors, andthe role of exercise, in the formation of health status for individuals who areoverweight. J Diab Metab Disord. 2012;11:19.
20. Duncan GE. The “fit but fat” concept revisited: population-based estimatesusing NHANES. Int J Behav Nutr Phys Act. 2010;7:47.
21. McAuley PA, Blair SN. Obesity paradoxes. J Sports Sci. 2011;29:773–82.22. Ioannidis JPA. Why most published research findings are false. PLoS Med.
2005;2, e124.23. Pereira TV, Horwitz RI, Ioannidis JPA. Empirical evaluation of very large
treatment effects of medical interventions. JAMA. 2012;308:1676–84.24. Bird SP, Tarpenning KM, Marino FE. Designing resistance training
programmes to enhance muscular fitness: a review of the acuteprogramme variables. Sports Med. 2005;35:841–51.
25. Kraemer WJ, Ratamess NA. Fundamentals of resistance training: progressionand exercise prescription. Med Sci Sports Exerc. 2004;36:674–88.
26. Booth FW, Gordon SE, Carlson CJ, Hamilton MT. Waging war on modernchronic diseases: primary prevention through exercise biology. J ApplPhysiol (Bethesda, Md : 1985). 2000;88:774–87.
27. Clark JE. Role of resistance training in obesity treatments. 1st InternationalConference on Obesity, OMICS. Philadelphia, PA, 2012.
28. Clark JE, Goon DT. The roles of resistance training for treatment of obesityrelated health issue and for changing health status of the individual who isoverfat or obese: A review. J Sports Med Phys Fit. 2015;55(3):205–22.
29. Fantuzzi G. Adipose tissue, adipokines, and inflammation. J Allergy ClinImmunol. 2005;115:911–9. quiz 920.
30. Hood DA, Irrcher I, Ljubicic V, Joseph A-M. Coordination of metabolicplasticity in skeletal muscle. J Exp Biol. 2006;209:2265–75.
31. Matheson EM, King DE, Everett CJ. Healthy lifestyle habits and mortality inoverweight and obese individuals. J Am Board Fam Med. 2012;25:9–15.
32. Mathur N, Pedersen BK. Exercise as a mean to control low-grade systemicinflammation. Mediators Inflamm. 2008;2008:109502.
33. Müssig K, Remer T, Maser-Gluth C. Brief review: Glucocorticoid excretion inobesity. J Steroid Biochem Mol Biol. 2010;121(3–5):589–93.
34. Bastard J-P, Maachi M, Lagathu C, Kim MJ, Caron M, Vidal H, et al. Recentadvances in the relationship between obesity, inflammation, and insulinresistance. Eur Cytokine Netw. 2006;17:4–12.
35. Abate N, Haffner SM, Garg A, Peshock RM, Grundy SM. Sex steroidhormones, upper body obesity, and insulin resistance. J Clin EndocrinolMetab. 2002;87:4522–7.
36. Brick DJ, Gerweck AV, Meenaghan E, Lawson EA, Misra M, Fazeli P, et al.Determinants of IGF1 and GH across the weight spectrum: fromanorexia nervosa to obesity. Eur J Endocrinol. 2010;163:185–91.
37. Dyck DJ. Adipokines as regulators of muscle metabolism and insulinsensitivity. Appl Physiol Nutr Metab. 2009;34:396–402.
38. Gerrits MF, Ghosh S, Kavaslar N, Hill B, Tour A, Seifert EL, et al. Distinctskeletal muscle fiber characteristics and gene expression in diet-sensitiveversus diet-resistant obesity. J Lipid Res. 2010;51:2394–404.
39. Gualillo O, González-Juanatey JR, Lago F. The emerging role of adipokinesas mediators of cardiovascular function: physiologic and clinicalperspectives. Trends Cardiovasc Med. 2007;17:275–83.
40. Guay AT. The emerging link between hypogonadism and metabolicsyndrome. J Androl. 2009;30:370–6.
41. Mammi C, Calanchini M, Antelmi A, Cinti F, Rosano GMC, Lenzi A, et al.Androgens and adipose tissue in males: a complex and reciprocal interplay.Int J Endocrinol. 2012;2012:789653.
42. Maya-Monteiro CM, Bozza PT. Leptin and mTOR: partners in metabolismand inflammation. Cell Cycle. 2008;7:1713–7.
43. Mohr BA, Bhasin S, Link CL, O’Donnell AB, McKinlay JB. The effect of changes inadiposity on testosterone levels in older men: longitudinal results from theMassachusetts Male Aging Study. Eur J Endocrinol. 2006;155:443–52.
44. Nannipieri M, Bonotti A, Anselmino M, Cecchetti F, Madec S, Mancini E, et al.Pattern of expression of adiponectin receptors in human adipose tissue depotsand its relation to the metabolic state. Int J Obes (Lond). 2007;31:1843–8.
45. Saad F, Aversa A, Isidori AM, Gooren LJ. Testosterone as potential effectivetherapy in treatment of obesity in men with testosterone deficiency: areview. Current Diab Reviews. 2012;8:131–43.
46. Saad F, Gooren LJ. The role of testosterone in the etiology and treatment ofobesity, the metabolic syndrome, and diabetes mellitus type 2. J Obes. 2011;doi:10.1155/2011/471584.
47. Balducci S, Zanuso S, Nicolucci A, Fernando F, Cavallo S, Cardelli P, et al.Anti-inflammatory effect of exercise training in subjects with type 2diabetes and the metabolic syndrome is dependent on exercise modal-ities and independent of weight loss. Nutr Metab Cardiovasc Dis.2009;20(8):608–17.

Clark Journal of Diabetes & Metabolic Disorders (2015) 14:31 Page 26 of 28
48. Pedersen BK, Febbraio MA. Muscles, exercise and obesity: skeletal muscle asa secretory organ. Nat Rev Endocrinol. 2012;8:457–65.
49. Shaibi GQ, Roberts CK, Goran MI. Exercise and insulin resistance in youth.Exerc Sport Sci Rev. 2008;36:5–11.
50. Tresierras MA, Balady GJ. Resistance training in the treatment of diabetes andobesity: mechanisms and outcomes. J Cardiopulm Rehabil Prev. 2009;29:67–75.
51. Bouchard DR, Soucy L, Sénéchal M, Dionne IJ, Brochu M. Impact ofresistance training with or without caloric restriction on physical capacity inobese older women. Menopause. 2009;16:66–72.
52. Ahima RS. Digging deeper into obesity. J Clin Invest. 2011;121:2076–9.53. Bacon L, Aphramor L. Weight science: evaluating the evidence for a
paradigm shift. Nutr J. 2011;10:9.54. Duncan DT, Wolin KY, Scharoun-Lee M, Ding EL, Warner ET, Bennett GG.
Does perception equal reality? Weight misperception in relation toweight-related attitudes and behaviors among overweight and obese USadults. Int J Behav Nutri Phys Act. 2011;8:20.
55. American Heart Association Nutritional Committee, Lichtenstein AH, Appel LJ,Brands M, Carnethon M, Daniels S, et al. Diet and lifestyle recommendationsrevision 2006: a scientific statement from the American Heart AssociationNutrition Committee. Circulation. 2006;114:82–96.
56. Garland T, Schutz H, Chappell MA, Keeney BK, Meek TH, Copes LE, et al. Thebiological control of voluntary exercise, spontaneous physical activity anddaily energy expenditure in relation to obesity: human and rodentperspectives. J Exp Biol. 2011;214:206–29.
57. Booth FW, Laye MJ. Lack of adequate appreciation of physical exercise’scomplexities can pre-empt appropriate design and interpretation inscientific discovery. J Physiol Lond. 2009;587:5527–39.
58. Becker B. Synthesizing stanardized mean-changing measures. Br J Math StatPsychol. 1988;41:257–78.
59. Krieger JW. Single vs. multiple sets of resistance exercise for musclehypertrophy: a meta-analysis. J Strength Cond Res. 2010;24:1150–9.
60. Morris S, DeShon RP. Combining effect size estimates in meta-analysis withrepeated measures and independent-groups designs. Psychol Methods.2002;7:105–25.
61. Mettler S, Mitchell N, Tipton KD. Increased protein intake reduces lean bodymass loss during weight loss in athletes. Med Sci Sports Exerc. 2010;42:326–37.
62. Volek JS, Westman EC. Very-low-carbohydrate weight-loss diets revisited.Cleve Clin J Med. 2002;69:849–53. 856–848 passim.
63. Volek JS, Sharman MJ, Forsythe CE. Modification of lipoproteins by verylow-carbohydrate diets. J Nutr. 2005;135:1339–42.
64. Phinney SD. Ketogenic diets and physical performance. Nutri Metabol. 2004;1:2.65. Centers for Disease Control and Prevention (CDC). School health
guidelines to promote healthy eating and physical activity. MMWRRecomm Rep. 2011;60:1–76.
66. Friedman JM, Halaas JL. Leptin and the regulation of body weight inmammals. Nature. 1998;395:763–70.
67. Meier U, Gressner AM. Endocrine regulation of energy metabolism: reviewof pathobiochemical and clinical chemical aspects of leptin, ghrelin,adiponectin, and resistin. Clin Chem. 2004;50:1511–25.
68. Buford TW, Cooke MB, Willoughby DS. Resistance exercise-induced changesof inflammatory gene expression within human skeletal muscle. Eur J ApplPhysiol. 2009;107:463–71.
69. Fortier MS, Duda JL, Guerin E, Teixeira PJ. Promoting physical activity:development and testing of self-determination theory-based interventions.Int J Behav Nutri Phys Act. 2012;9:20.
70. Li C, Ford ES, Li B, Giles WH, Liu S. Association of testosterone and sexhormone-binding globulin with metabolic syndrome and insulin resistancein men. Diabetes Care. 2010;33:1618–24.
71. Tishova Y, Kalinchenko SY. Breaking the vicious circle of obesity: the metabolicsyndrome and low testosterone by administration of testosterone to a youngman with morbid obesity. Arq Bras Endocrinol Metabol. 2009;53:1047–51.
72. Vikan T, Schirmer H, Njølstad I, Svartberg J. Low testosterone and sexhormone-binding globulin levels and high estradiol levels areindependent predictors of type 2 diabetes in men. Eur J Endocrinol.2010;162:747–54.
73. Berryman DE, Christiansen JS, Johannsson G, Thorner MO, Kopchick JJ. Roleof the GH/IGF-1 axis in lifespan and healthspan: lessons from animalmodels. Growth Horm IGF Res. 2008;18:455–71.
74. Liu H, Bravata DM, Olkin I, Nayak S, Roberts B, Garber AM, et al. Systematic review:the safety and efficacy of growth hormone in the healthy elderly. Ann InternMed. 2007;146:104–15.
75. Bhattacharya RK, Khera M, Blick G, Kushner H, Nguyen D, Miner MM. Effectof 12 months of testosterone replacement therapy on metabolic syndromecomponents in hypogonadal men: data from the Testim Registry in the US(TRiUS). BMC Endocr Disord. 2011;11:18.
76. Kelly DM, Jones TH. Testosterone: a metabolic hormone in health anddisease. J Endocrinol. 2013;217:R25–45.
77. Mekala KC, Tritos NA. Effects of recombinant human growth hormone therapy inobesity in adults: a meta analysis. J Clin Endocrinol Metab. 2009;94:130–7.
78. Scacchi M, Pincelli AI, Cavagini F. Growth hormone in obesity. Int J Obes.1999;23:260–71.
79. Consitt LA, Bloomer RJ, Wideman L. The effect of exercise type onimmunofunctional and traditional growth hormone. Eur J Appl Physiol.2007;100:321–30.
80. Craig BW, Brown R, Everhart J. Effects of progressive resistance training ongrowth hormone and testosterone levels in young and elderly subjects.Mech Ageing Dev. 1989;49:159–69.
81. Hagerman FC, Walsh SJ, Staron RS, Hikida RS, Gilders RM, Murray TF, et al.Effects of high-intensity resistance training on untrained older men. I.Strength, cardiovascular, and metabolic responses. J Gerontol A Biol SciMed Sci. 2000;55:B336–46.
82. Häkkinen K, Pakarinen A, Kraemer WJ, Newton RU, Alen M. Basalconcentrations and acute responses of serum hormones and strengthdevelopment during heavy resistance training in middle-aged and elderlymen and women. J Gerontol A Biol Med Sci. 2000;55:B95–105.
83. Ahmadizad S, Haghighi AH, Hamedinia MR. Effects of resistance versusendurance training on serum adiponectin and insulin resistance index. Eur JEndocrinol. 2007;157:625–31.
84. Anderssen SA, Carroll S, Urdal P, Holme I. Combined diet and exerciseintervention reverses the metabolic syndrome in middle-aged males: resultsfrom the Oslo Diet and Exercise Study. Scand J Med Sci Sports. 2007;17:687–95.
85. Ara I, Perez-Gomez J, Vicente-Rodriguez G, Chavarren J, Dorado C, Calbet JAL.Serum free testosterone, leptin and soluble leptin receptor changes in a6-week strength-training programme. BrJ Nutri. 2006;96:1053–9.
86. Ballor DL, Harvey-Berino JR, Ades PA, Cryan J, Calles-Escandon J. Contrastingeffects of resistance and aerobic training on body composition and metabolismafter diet-induced weight loss. Metab Clin Exp. 1996;45:179–83.
87. Ballor DL, Katch VL, Becque MD, Marks CR. Resistance weight training duringcaloric restriction enhances lean body weight maintenance. Am J Clin Nutri.1988;47:19–25.
88. Borg P, Kukkonen-Harjula K, Fogelholm M, Pasanen M. Effects of walking orresistance training on weight loss maintenance in obese, middle-aged men:a randomized trial. Int J Obes Relat Metab Disord. 2002;26:676–83.
89. Brehm BJ, Seeley RJ, Daniels SR, D’Alessio DA. A randomized trial comparinga very low carbohydrate diet and a calorie-restricted low fat diet on bodyweight and cardiovascular risk factors in healthy women. J Clin EndocrinolMetab. 2003;88:1617–23.
90. Brochu M, Malita MF, Messier V, Doucet E, Strychar I, Lavois J-M, et al. Resistancetraining does not contribute to improving the metabolic profile after a 6-monthweight loss program in overweight and obese postmenopausal women. J ClinEndocrinol Metab. 2009;94:3226–33.
91. Bryner RW, Ullrich IH, Sauers J, Donley D, Hornsby G, Kolar M, et al.Effects of resistance vs. aerobic training combined with an 800 calorieliquid diet on lean body mass and resting metabolic rate. J Am CollNutr. 1999;18:115–21.
92. Campbell WW, Haub MD, Wolfe RR, Ferrando AA, Sullivan DH, Apolzan JW,et al. Resistance training preserves fat-free mass without impacting changesin protein metabolism after weight loss in older women. Obesity (SilverSpring). 2009;17:1332–9.
93. Christiansen T, Paulsen SK, Bruun JM, Pedersen SB, Richelsen B. Exercisetraining versus diet-induced weight-loss on metabolic risk factors andinflammatory markers in obese subjects: a 12-week randomized interventionstudy. Am J Physiol Endocrinol Metab. 2010;298:E824–31.
94. Cuff DJ, Meneilly GS, Martin A, Ignaszewski A, Tildesley HD, Frohlich JJ.Effective exercise modality to reduce insulin resistance in women with type2 diabetes. Diabetes Care. 2003;26:2977–82.
95. Donnelly JE, Pronk NP, Jacobsen DJ, Pronk SJ, Jakicic JM. Effects of a very-low-calorie diet and physical-training regimens on body composition andresting metabolic rate in obese females. AmJ Clin Nutri. 1991;54:56–61.
96. Donnelly JE, Sharp T, Houmard J, Carlson MG, Hill JO, Whately JE, et al.Muscle hypertrophy with large-scale weight loss and resistance training. AmJ Clin Nutri. 1993;58:561–5.

Clark Journal of Diabetes & Metabolic Disorders (2015) 14:31 Page 27 of 28
97. Donnelly JE, Hill JO, Jacobsen DJ, Potteiger J, Sullivan DK, Johnson SL, et al.Effects of a 16-month randomized controlled exercise trial on body weightand composition in young, overweight men and women: the MidwestExercise Trial. Arch Intern Med. 2003;163:1343–50.
98. Dunstan DW, Daly RM, Owen N, Jolley D, DeCourten M, Shaw J, et al. High-intensity resistance training improves glycemic control in older patients withtype 2 diabetes. Diabetes Care. 2002;25:1729–36.
99. Fisher G, Hyatt TC, Hunter GR, Oster RA, Desmond RA, Gower BA. Effect ofdiet with and without exercise training on markers of inflammation and fatdistribution in overweight women. Obesity (Silver Spring, Md).2011;19:1131–6.
100. Foster GD, Wyatt HR, Hill JO, McGuckin BG, Brill C, Mohammed BS, et al. Arandomized trial of a low-carbohydrate diet for obesity. N Engl J Med.2003;348:2082–90.
101. Geliebter A, Maher MM, Gerace L, Gutin B, Heymsfield SB, Hashim SA. Effectsof strength or aerobic training on body composition, resting metabolic rate,and peak oxygen consumption in obese dieting subjects. Am J Clin Nutri.1997;66:557–63.
102. Goodpaster BH, Delany JP, Otto AD, Kuller L, Vockley J, South-Paul JE, et al.Effects of diet and physical activity interventions on weight loss andcardiometabolic risk factors in severely obese adults: a randomized trial.JAMA. 2010;304:1795–802.
103. Hallsworth K, Fattakhova G, Hollingsworth KG, Thoma C, Moore S, Taylor R,et al. Resistance exercise reduces liver fat and its mediators in non-alcoholicfatty liver disease independent of weight loss. Gut. 2011;60:1278–83.
104. Hammer RL, Barrier CA, Roundy ES, Bradford JM, Fisher AG. Calorie-restrictedlow-fat diet and exercise in obese women. Am J Clin Nutri. 1989;49:77–85.
105. Hill JO, Sparling PB, Shields TW, Heller PA. Effects of exercise and foodrestriction on body composition and metabolic rate in obese women. Am JClin Nutri. 1987;46:622–30.
106. Hill JO, Schlundt DG, Sbrocco T, Sharp T, Pope-Cordle J, Stetson B, et al.Evaluation of an alternating-calorie diet with and without exercise in thetreatment of obesity. Am J Clin Nutri. 1989;50:248–54.
107. Ho SS, Dhaliwal SS, Hills AP, Pal S. The effect of 12 weeks of aerobic, resistance orcombination exercise training on cardiovascular risk factors in the overweightand obese in a randomized trial. BMC Public Health. 2012;12:704.
108. Ibáñez J, Izquierdo M, Martínez-Labari C, Ortega F, Grijalba A, Forga L, et al.Resistance training improves cardiovascular risk factors in obese womendespite a significative decrease in serum adiponectin levels. Obesity (SilverSpring). 2010;18:535–41.
109. Irving BA, Weltman JY, Patrie JT, Davis CK, Brock DW, Swift D, et al. Effects ofexercise training intensity on nocturnal growth hormone secretion in obeseadults with the metabolic syndrome. J Clin Endocrinol Metabol. 2009;94:1979–86.
110. Josse AR, Atkinson SA, Tarnopolsky MA, Phillips SM. Increased consumptionof dairy foods and protein during diet- and exercise-induced weight losspromotes fat mass loss and lean mass gain in overweight and obesepremenopausal women. J Nutr. 2011;141:1626–34.
111. Kempen KP, Saris WH, Westerterp KR. Energy balance during an 8-wkenergy-restricted diet with and without exercise in obese women. Am J ClinNutri. 1995;62:722–9.
112. Kerksick C, Thomas A, Campbell B, Taylor L, Wilborn C, Marcello B, et al.Effects of a popular exercise and weight loss program on weight loss, bodycomposition, energy expenditure and health in obese women. NutritionMetabol. 2009;6:23.
113. Klimcakova E, Polak J, Moro C, Hejnova J, Majercik M, Viguerie N, et al.Dynamic strength training improves insulin sensitivity without alteringplasma levels and gene expression of adipokines in subcutaneous adiposetissue in obese men. J Clin Endocrinol Metab. 2006;91:5107–12.
114. Kraemer WJ, Volek JS, Clark KL, Gordon SE, Puhl SM, Koziris LP, et al.Influence of exercise training on physiological and performance changeswith weight loss in men. Med Sci Sports Exerc. 1999;31:1320–9.
115. Larsen TM, Dalskov S-M, van Baak M, Jebb SA, Papadaki A, Pfeiffer AFH, et al.Diets with high or low protein content and glycemic index for weight-lossmaintenance. N Engl J Med. 2010;363:2102–13.
116. Layman DK, Boileau RA, Erickson DJ, Painter JE, Shiue H, Sather C, et al. Areduced ratio of dietary carbohydrate to protein improves bodycomposition and blood lipid profiles during weight loss in adult women. JNutri. 2003;133:411–7.
117. Layman DK, Evans E, Baum JI, Seyler J, Erickson DJ, Boileau RA. Dietaryprotein and exercise have additive effects on body composition duringweight loss in adult women. J Nutri. 2005;135:1903–10.
118. Maiorana A, O’Driscoll G, Goodman C, Taylor R, Green D. Combined aerobicand resistance exercise improves glycemic control and fitness in type 2diabetes. Diabetes Res Clin Pract. 2002;56:115–23.
119. Marks BL, Ward A, Morris DH, Castellani J, Rippe JM. Fat-free mass ismaintained in women following a moderate diet and exercise program.Med Sci Sports Exerc. 1995;27:1243–51.
120. Moreira MM, Souza HPC, Schwingel PA, Sá CKC, Zoppi CC. Effects of aerobicand anaerobic exercise on cardiac risk variables in overweight adults. ArqBras Cardiol. 2008;91:200–6.
121. Nicklas BJ, Ambrosius W, Messier SP, Miller GD, Penninx BWJH, Loeser RF,et al. Diet-induced weight loss, exercise, and chronic inflammation in older,obese adults: a randomized controlled clinical trial. Am J Clin Nutri.2004;79:544–51.
122. Oberbach A, Tönjes A, Klöting N, Fasshauer M, Kratzsch J, Busse MW, et al.Effect of a 4 week physical training program on plasma concentrations ofinflammatory markers in patients with abnormal glucose tolerance. Eur JEndocrinol. 2006;154:577–85.
123. Olson TP, Dengel DR, Leon AS, Schmitz KH. Changes in inflammatorybiomarkers following one-year of moderate resistance training inoverweight women. Int J Obesity (2005). 2007;31:996–1003.
124. Pavlou KN, Steffee WP, Lerman RH, Burrows BA. Effects of dieting andexercise on lean body mass, oxygen uptake, and strength. Med Sci SportsExerc. 1985;17:466–71.
125. Phinney SD, O’Connell M, Danforth E. Effects of aerobic exercise on energyexpenditure and nitrogen balance during very low calorie dieting.Metabolism. 1988;37:758–65.
126. Polak J, Klimcakova E, Moro C, Viguerie N, Berlan M, Hejnova J, et al. Effectof aerobic training on plasma levels and subcutaneous abdominal adiposetissue gene expression of adiponectin, leptin, interleukin 6, and tumornecrosis factor alpha in obese women. Metab Clin Exp. 2006;55:1375–81.
127. Pritchard JE, Nowson CA, Wark JD. A worksite program for overweightmiddle-aged men achieves lesser weight loss with exercise than withdietary change. J Am Diet Assoc. 1997;97:37–42.
128. Racette SB, Schoeller DA, Kushner RF, Neil KM. Exercise enhances dietarycompliance during moderate energy restriction in obese women. Am J ClinNutri. 1995;62:345–9.
129. Rice B, Janssen I, Hudson R, Ross R. Effects of aerobic or resistance exerciseand/or diet on glucose tolerance and plasma insulin levels in obese men.Diabetes Care. 1999;22:684–91.
130. Rolland C, Hession M, Broom I. Effect of weight loss on adipokine levels inobese patients. Diabetes Metab Syndrome Obes. 2011;4:315–23.
131. Ross R, Janssen I, Dawson J, Kungl A-M, Kuk JL, Wong SL, et al. Exercise-induced reduction in obesity and insulin resistance in women: arandomized controlled trial. Obes Res. 2004;12:789–98.
132. Ryan AS, Nicklas BJ, Berman DM, Elahi D. Adiponectin levels do not changewith moderate dietary induced weight loss and exercise in obesepostmenopausal women. Int J Obes Relat Metab Disord. 2003;27:1066–71.
133. Schjerve IE, Tyldum GA, Tjønna AE, Stølen T, Loennechen JP, Hansen HEM,et al. Both aerobic endurance and strength training programmes improvecardiovascular health in obese adults. Clin Sci. 2008;115:283–93.
134. Sheu WH-H, Chang T-M, Lee W-J, Ou H-C, Tseng L-N, Lang H-F, et al. Effectof weight loss on proinflammatory state of mononuclear cells in obesewomen. Obesity (Silver Spring, Md). 2008;16:1033–8.
135. Sigal RJ, Kenny GP, Boulé NG, Wells GA, Prud’homme D, Fortier M, et al.Effects of aerobic training, resistance training, or both on glycemic controlin type 2 diabetes: a randomized trial. Ann Intern Med. 2007;147:357–69.
136. Slentz CA, Bateman LA, Willis LH, Shields AT, Tanner CJ, Piner LW, et al.ffects of aerobic vs. resistance training on visceral and liver fat stores, liverenzymes, and insulin resistance by HOMA in overweight adults fromSTRRIDE AT/RT. Am J Physiol Endocrinol Metab. 2011;301:E1033–9.
137. Tjønna AE, Lee SJ, Rognmo Ø, Bye A, Haram PM, Loennechen JP, et al.Aerobic interval training versus continuous moderate exercise as atreatment for the metabolic syndrome: a pilot study. Circulation.2008;118:346–54.
138. Tokmakidis SP, Zois CE, Volaklis KA, Kotsa K, Touvra A-M. The effects of acombined strength and aerobic exercise program on glucose control andinsulin action in women with type 2 diabetes. Eur J Appl Physiol.2004;92:437–42.
139. Trapp EG, Chisholm DJ, Freund J, Boutcher SH. The effects of high-intensityintermittent exercise training on fat loss and fasting insulin levels of youngwomen. Int J Obes (Lond). 2008;32:684–91.

Clark Journal of Diabetes & Metabolic Disorders (2015) 14:31 Page 28 of 28
140. Volpe SL, Kobusingye H, Bailur S, Stanek E. Effect of diet and exercise onbody composition, energy intake and leptin levels in overweight womenand men. J Am Coll Nutr. 2008;27:195–208.
141. Wang P, Holst C, Andersen MR, Astrup A, Bouwman FG, van Otterdijk S,et al. Blood profile of proteins and steroid hormones predicts weightchange after weight loss with interactions of dietary protein level andglycemic index. PLoS One. 2011;6, e16773.
142. Watkins LL, Sherwood A, Feinglos M, Hinderliter A, Babyak M, Gullette E,et al. Effects of exercise and weight loss on cardiac risk factors associatedwith syndrome X. Arch Intern Med. 2003;163:1889–95.
143. Wycherley TP, Noakes M, Clifton PM, Cleanthous X, Keogh JB, Brinkworth GD. Ahigh-protein diet with resistance exercise training improves weight loss andbody composition in overweight and obese patients with type 2 diabetes.Diabetes Care. 2010;33:969–76.
Submit your next manuscript to BioMed Centraland take full advantage of:
• Convenient online submission
• Thorough peer review
• No space constraints or color figure charges
• Immediate publication on acceptance
• Inclusion in PubMed, CAS, Scopus and Google Scholar
• Research which is freely available for redistribution
Submit your manuscript at www.biomedcentral.com/submit