diesel fuel reformulation impacts on synthetic crude …
TRANSCRIPT
1
DIESEL FUEL REFORMULATION IMPACTS
ON
SYNTHETIC CRUDE OIL DEMAND †
G. R. Hadder*
Transportation Technology Group, Oak Ridge National Laboratory,
P.O. Box 2008, MS-6472, Oak Ridge, Tennessee 37831, U.S.A.
B.D. McNutt
Office of Policy and International Affairs, United States Department of Energy,
1000 Independence Avenue, S.W., Washington, DC 20585, U.S.A.
Abstract - The Oak Ridge National Laboratory Refinery Yield Model has been used to study the impacts of
specifications for reformulated diesel fuel (RFD) produced in petroleum refineries of the U.S. Midwest in summer of
year 2010. The study shows that synthetic crude oil economics can be less attractive, with a decrease in demand,
when there is an RFD requirement.
†Research sponsored by the U.S. Department of Energy Offices of Policy and International Affairs, Energy
Efficiency and Renewable Energy, and Fossil Energy under UT-Battelle, LLC, Contract No.
DE-AC05-00OR22725 with the U.S. Department of Energy under contract.
*Corresponding author. Fax number: (865) 483-9287. E-mail: [email protected]
2
INTRODUCTION
The Oak Ridge National Laboratory Refinery Yield Model (ORNL-RYM) has been used to study the refining cost,
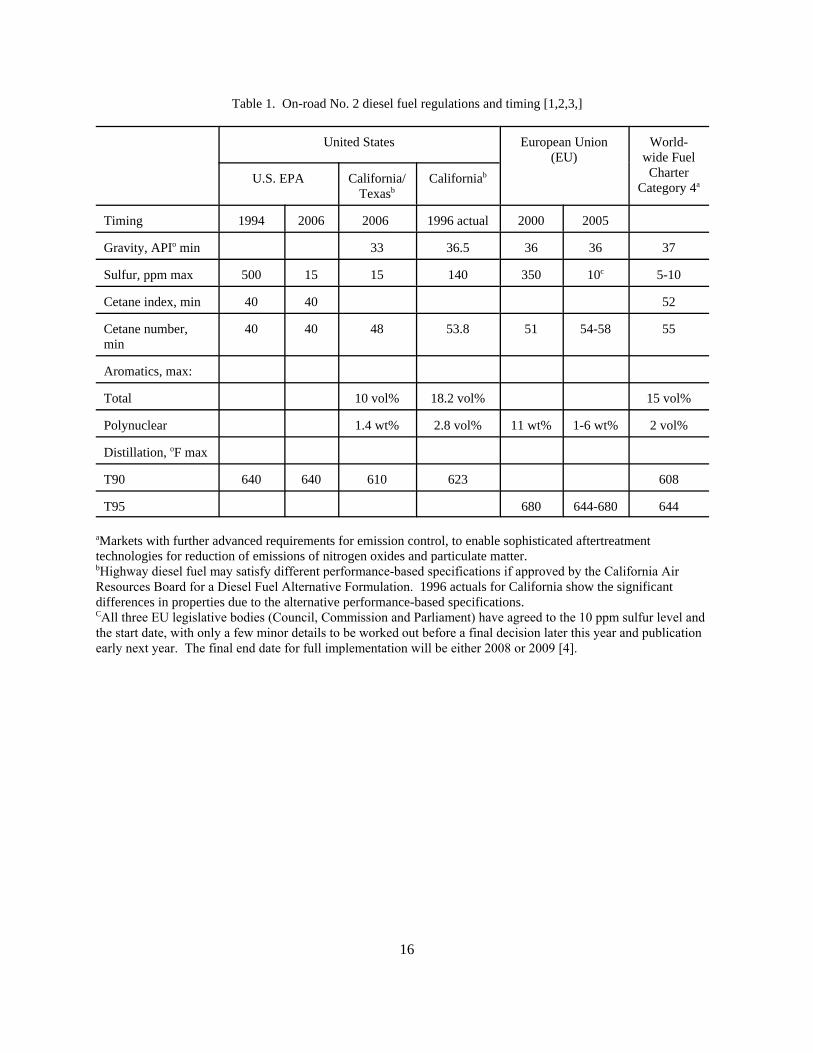
investment, operational, and crude oil impacts of specifications for reformulated diesel fuel (RFD). Table 1 shows
No. 2 on-road diesel fuel regulations and timing for several regulatory authorities and for the World Wide Fuel
Charter. Given that the diesel fuel requirements for California and Texas could be largely satisfied by alternative
performance-based specifications, the most challenging requirements for on-road diesel fuel are those specifications
recommended by the European Union and the World-wide Fuel Charter, particularly specifications for cetane
number and total aromatics. Global vehicle and engine manufacturing associations support the World-wide Fuel
Charter on the basis that “Consistent fuel quality world-wide is necessary to market high-quality automotive
products matching world-wide customer performance and environmental needs.” ORNL-RYM has been used to
estimate refining impacts with an investment pathway that assumes early notice of RFD quality requirements. With
this early notice, refinery capital investment would not yet be made to satisfy the ultra low sulfur diesel (ULSD) fuel
sulfur requirement of year 2006, giving greater flexibility for investment planning.
THE ORNL REFINERY YIELD MODEL
ORNL-RYM
ORNL-RYM is a linear program representing over 75 refining processes which can be used to produce up to 50
different products from more than 180 crude oils. An investment module provides for the addition of processing
capacity [5,6,7,8]. ORNL-RYM was updated for this study to include the most recent process configuration and
revamp cost information for distillate desulfurization units; representations of advanced desulfurization technologies
that selectively remove sulfur, with low hydrogen consumption; and representation of the most recent catalyst
developments [9,10].
ORNL-RYM tracks gravity, cetane index, aromatics, sulfur, flash point, pour point, viscosity, hydrogen content, heat
3
of combustion, distillation temperatures, and pollutant emissions for diesel fuel blendstocks and products [11, 12].
Properties for other distillates and for gasolines are handled in a similar fashion. ORNL-RYM incorporates gasoline
blending to satisfy formula and emissions standards mandated by the Clean Air Act Amendments of 1990 [13].
ORNL-RYM also represents requirements of the toxics anti-backsliding rulemaking of 2001 [14].
Overoptimization can occur as a result of the ORNL-RYM use of a modeling concept in which refinery streams with
identical distillation cut points are kept separate through different refining processes. Ratio constraints on refinery
streams can be used to avoid unrealistic separation of streams with identical distillation cut points. With ratio
constraints, the proportions of streams entering a process are constrained to equal the proportions of those streams
produced at a source process. This study makes use of ratio constraints in gasoline production, based on calibration
results. Ratio constraints are also used for distillate deep desulfurization and dearomatization processes. It is
important to recognize that refineries within a region can vary widely in technical capability, and that refineries are
subject to temporal variations in complex operations. A refining outcome (e.g., investment cost) can span a range,
and this range has uncertainty.
PREMISES
Policy Issues
The examination of the refinery impacts of an RFD requirement raises a wide range of policy issues. In establishing
specific premises for this study, we must make assumptions about the resolution of a number of currently unresolved
issues. One should not interpret these premises as official views as to the appropriate resolution of the underlying
policy issues, but only as one possible set of reasonable assumptions for the analysis. Some of the key premises that
are policy-related in an important way include the following:
C We are examining a national on-road diesel fuel reformulation requirement because there is significant
interest, among various parties, in changing diesel fuel quality (beyond sulfur reductions) for lower in-use
4
emissions, to enable new vehicle emission control systems, or to improve vehicle operating characteristics.
Understanding how the specific nature of such a requirement interacts with other fuel quality requirements,
refinery operations, or emerging crude oil options is important to policy formulation.
C The interaction of such an RFD requirement with the existing 2006 ULSD requirement will be significant
in terms of investment strategics that refiners might pursue. While we have assumed a 2010 start date for an
RFD requirement, it could happen sooner or later than that, and refiners might - or might not - invest for
ULSD in 2006 with the forward knowledge of an RFD requirement. By assuming that refiners invest once
for both programs (effectively) in 2006, this analysis examines only one end of the range of possibilities.
C Changes to off-road diesel fuel quality are quite likely in the time frame of this analysis, but the specifics
are not known. ULSD (at 15 parts per million [ppm] maximum sulfur) may become the needed fuel for
some portion of the off-road diesel fuel market while some low sulfur diesel fuel (at 500 ppm maximum
sulfur) may remain in the diesel fuel pool due to the phase-in of the ULSD requirement. For this analysis,
a volume of diesel equal to off-road volume is assumed to be at 500 ppm and the rest at 15 ppm (i.e.,
ULSD), but the actual end use markets for the two sulfur levels may be more mixed than that. The critical
implied assumption is that all high sulfur (greater than 500 ppm) diesel fuel disappears from the refinery
slate by 2010.
C Changes to gasoline requirements are likely in the time frame relevant to this analysis. We have premised
the requirements contained in recently proposed legislation (U.S. Senate Bill S.517, subsequently amended
into U.S. House of Representatives Bill H.R.4) as a plausible set of new requirements. Despite the
significant changes in that legislation (e.g., ban of methyl tertiary butyl ether [MTBE], elimination of the
reformulated gasoline [RFG] oxygenate requirement and mandated ethanol use), the actual impact on
refinery operations for the purposes of our analysis is relatively small because of pre-existing ethanol use
and the almost total absence of ether use in our U.S. Midwest study region, and the limited interactions
between gasoline quality and diesel fuel reformulation.
5
C Finally, we examine the interaction between greater use of Canadian synthetic crude oils and these tighter
diesel fuel quality specifications, with the implicit assumption that there will be a significant growth in the
volume of that synthetic crude oil production and that our study region is a natural market for that crude oil.
The need for effective integration of refinery changes in the U.S. (driven by changing product quality
requirements) and expanded synthetic crude oil production in Canada is the rationale for this paper.
Study Period and Geographic Area
The study period is summer of year 2010. The study area is U.S. Petroleum Administration for Defense District II
(PADD II), a 15 state area in the U.S. Midwest with 27 operable refineries, annually producing 22 percent of all
gasoline and 25 percent of all on-road diesel fuel produced in the U.S. Compared with other regions, PADD II has
relatively high production of on-road diesel fuel and high imports of Canadian crude oil.
Of the 27 PADD II refineries, 13 have distillate hydrotreating, and we assume that these refineries are currently
producers of low sulfur diesel fuel. Different studies have focused on a range of possibilities for refinery
participation in on-road diesel fuel production for 2006-2007. Baker & O’Brien [15] believe that only current low
sulfur diesel fuel producers are likely to continue in the ULSD market. On the other hand, MathPro [16] concludes
that some refineries that do not now produce low sulfur diesel fuel may have incentives to produce ULSD. For our
more distant outlook of year 2010 (with a 24 percent increase in on-road diesel fuel production, compared to year
2000), we assume that ULSD/RFD production can be spread among all refineries in PADD II.
Refinery Raw Materials and Products
Refinery inputs of crude oil and raw materials and refinery summer production rates are based on U.S. Department
of Energy (DOE) data, extrapolated to year 2010 [17,18]. Raw material and crude oil costs and revenues, expressed
in year 2000 U.S. dollars, are also based on DOE data [18,19].
6
Distillate Quality
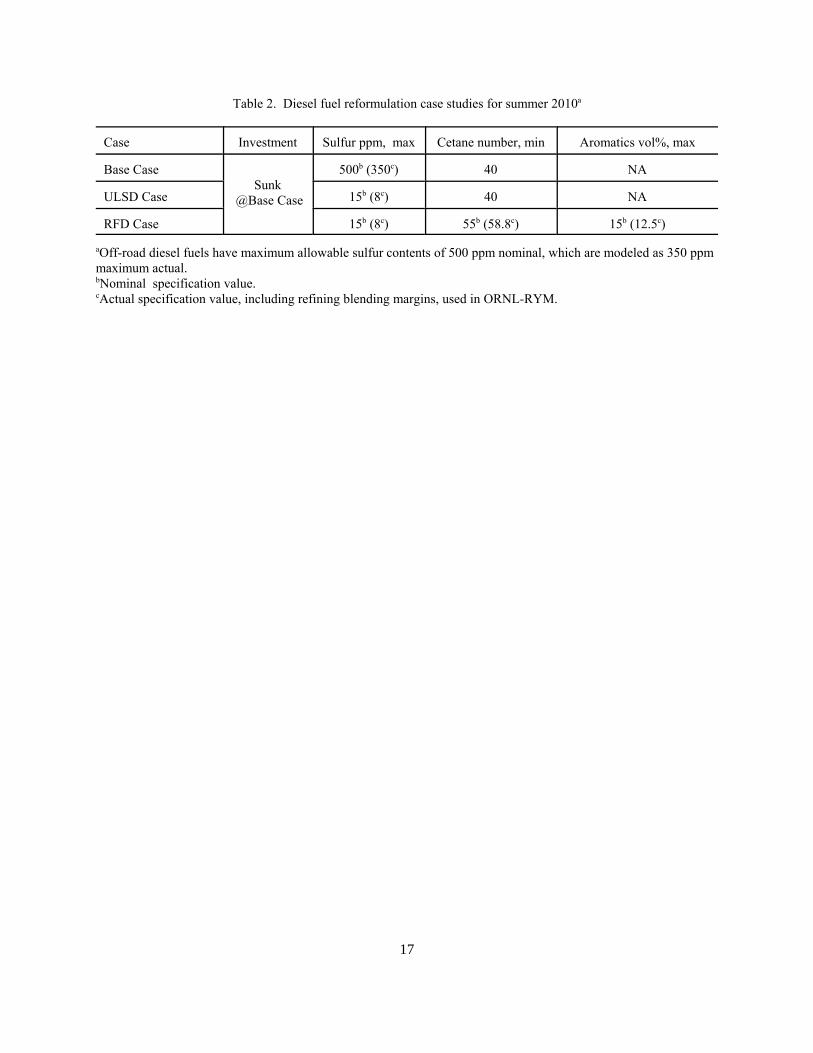
On-road diesel fuel has sulfur, cetane number, aromatics content and emissions specifications (nominal and actual)
as shown in Table 2. The actual specifications for cetane number and aromatics content are based on refiner
guidance that the lowest reasonable blending margins should be based on the reproducibility of tests that determine
property values. Reproducibility is the variability of the average values obtained by several test operators while
measuring the same item. We assume a 3.8 number margin for our cetane number specifications, based roughly on
the reproducibility of ASTM D613. For aromatics, the reproducibility of ASTM D1319 is 2.5 vol percent when total
aromatics content is approximately 15 vol percent. We have no basis for assumptions for additional margins that
may be needed for pipeline degradation of product quality.
Off-road diesel fuels (including No. 2 home heating oil) have maximum allowable sulfur contents of 500 ppm
nominal, which is modeled as 350 ppm maximum actual. Otherwise, specifications for diesel fuels, distillates and
products other than gasoline are based on industry surveys [2]. On-road diesel equivalent miles-per-gallon (mpg)
are held constant across cases.
Gasoline Quality
Gasoline properties are consistent with requirements of the U.S. Clean Air Act of 1990 and with key provisions of
proposed U.S. Senate Bill S.517 which, among other initiatives: specifies the Renewable Fuels Standard
requirement (4.3 billion gallons for the U.S. in year 2010); prohibits the use of MTBE, not later than four years after
the date of enactment; eliminates the oxygen content requirement for RFG; maintains Toxic Air Pollutant emission
reductions for RFG at 1999-2000 baseline levels; and consolidates the Volatile Organic Compound (VOC) emissions
specification for all RFGs to the more stringent requirement for southern RFG. Furthermore, RFG and CG satisfy
the toxics anti-backsliding rulemaking of 2001[14], and all gasolines contain no more than 30 ppm sulfur, on
average. For ethanol-containing gasolines, ethanol usage patterns are based on Downstream Alternatives, Inc [20].
Gasoline equivalent mpg are held constant across cases.
7
Refinery Capacity and Investment
Refinery capacity is based on in-place capacity and construction as reported in DOE and industry publications [2,
21-25]. Process capacity investment requires a nominal 15 percent after-tax discounted cash flow rate of return on
investment (ROI), and the actual investment cost assumes a 10 percent after-tax discounted cash flow ROI. For
existing capacity, typical investment costs are used for up to 20 percent expansion in capacity. For capacity greater
than the defined expansion limit, investment is subject to economies of scale, according to the “six-tenths factor”
relationship:
CostNew = (CapacityNew/CapacityTypical Size)n*CostTypical Size, with n between 0.6 and 0.7
IMPACTS OF REFORMULATION ON PADD II REFINERIES
Base Case
In the Base Case, on-road diesel fuel must satisfy current (year 2002) requirements for sulfur content (500 ppm
maximum) and cetane number (40 minimum), and there is no aromatics specification. The Base Case is not
representative of current quality requirements for off-road diesel fuels, which have premised sulfur specifications of
500 ppm maximum. By using this off-road sulfur specification in all cases, we have intentionally removed a
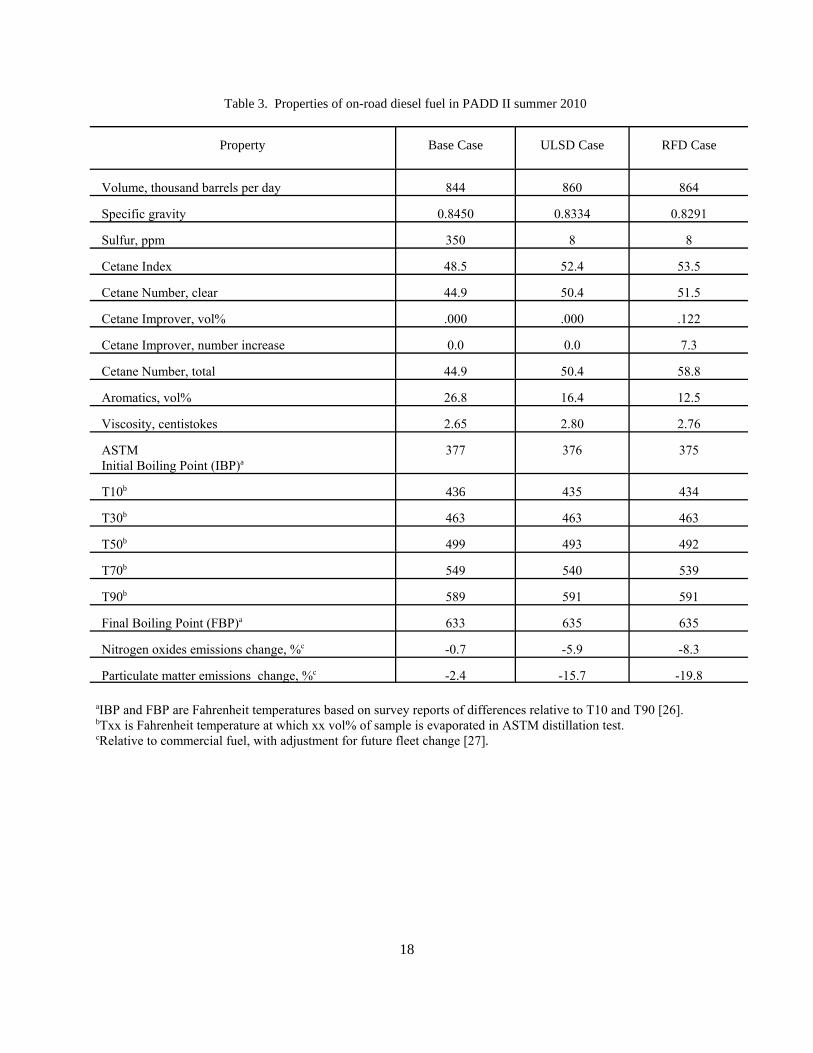
variable from the study. Key results for the Base Case and all other cases are summarized in Tables 3 through 7.
ULSD Case
In the ULSD Case, on-road diesel fuel must satisfy future requirements for sulfur content (15 ppm maximum) and
cetane number (40 minimum), but there are no requirements for reformulation to satisfy more stringent cetane and
aromatics specifications. We premise limited market penetration of advanced technologies that selectively remove
sulfur, with low hydrogen consumption. Given the Baker & O’Brien [15] projection that thirty-eight percent of
8
current low sulfur diesel producers will engage in revamps of distillate hydrotreating units, we allow revamping in
up to five refineries. For the remaining 22 refineries, we arbitrarily assume that up to three refineries (i.e., almost 15
percent technology penetration) can invest in advanced desulfurization technologies.
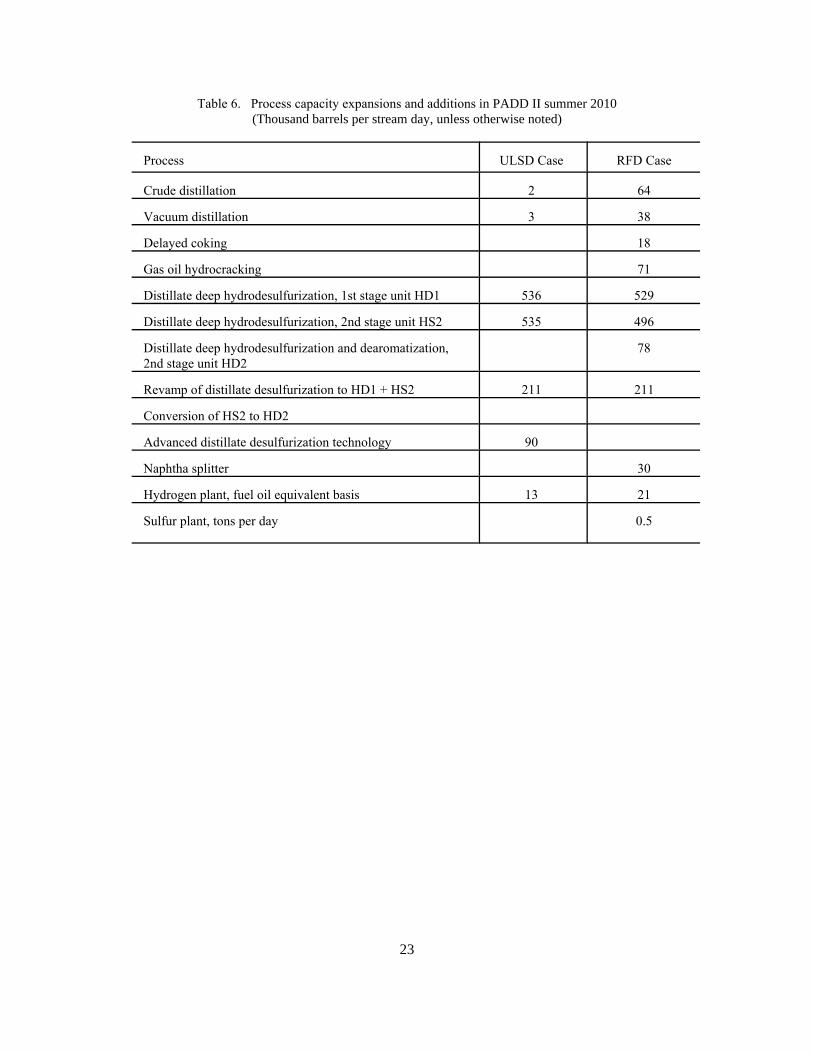
Five existing distillate desulfurization units are revamped into two-stage units in the ULSD Case(Table 6).
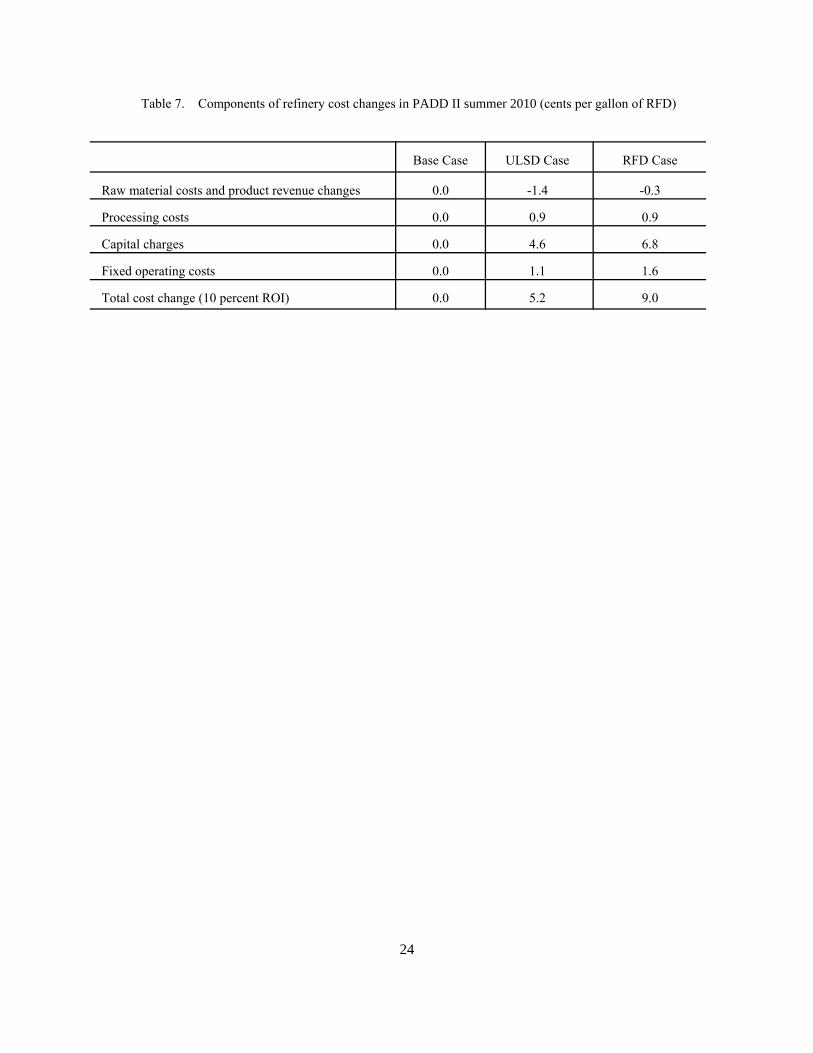
Investment in advanced technologies lowers the cost of ULSD production. Relative to the Base Case, the cost
increase for ULSD is 5.2 cents per gallon (cpg), as shown in Table 7. Sensitivity runs show a ULSD cost increase
of 7.9 cpg via two-stage deep hydrotreating, with no investment allowed in advanced technologies; and a cost
increase of 3.7 cpg with no constraints on investment in advanced technologies.
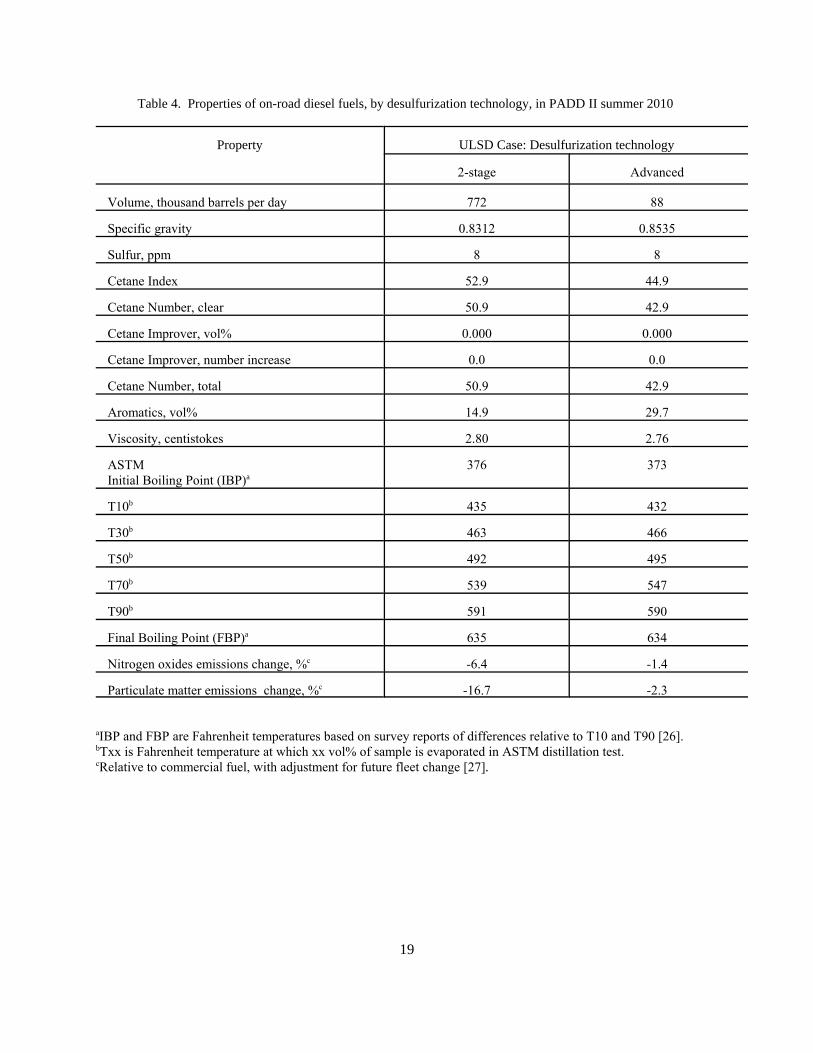
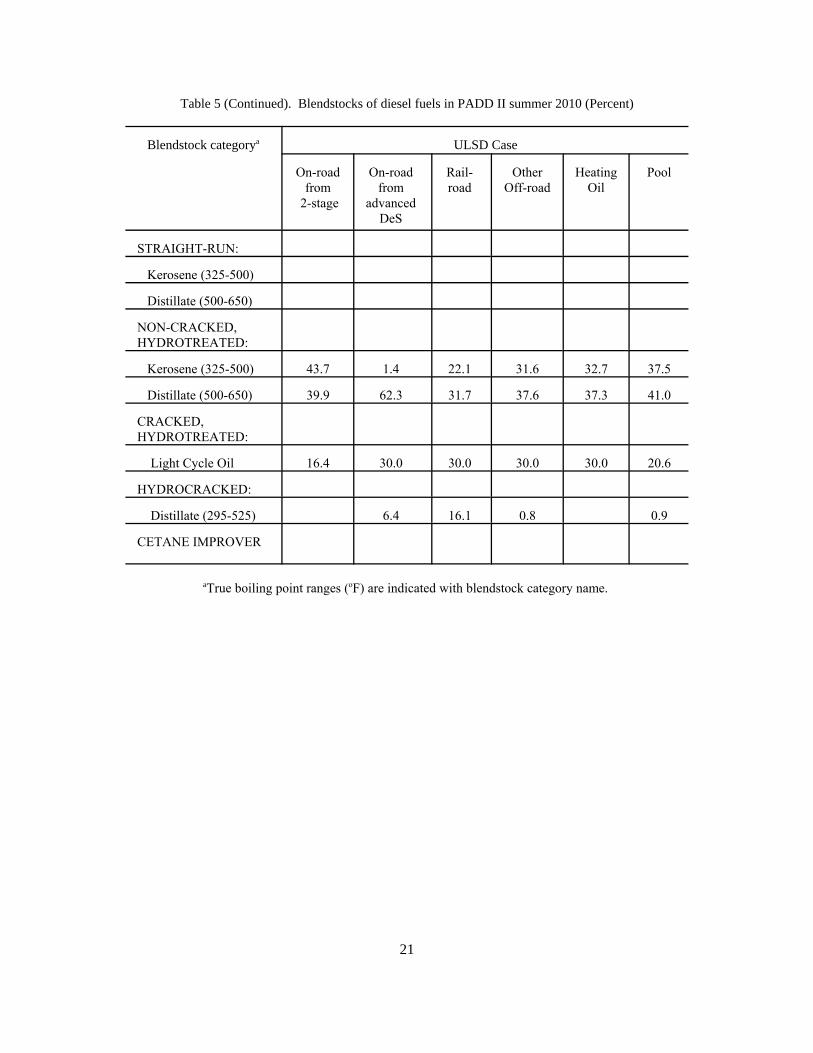
ULSD product quality is dramatically different for different desulfurization technologies. Table 4 shows that ULSD
produced with advanced technologies has substantially lower cetane quality, higher aromatics content, and poorer
emissions quality. While the advanced technologies are attractive for sulfur reduction, these technologies have little
impact on those properties (i.e., cetane quality and aromatics content) which define “reformulation” in this study.
For new two-stage installations, all of the second-stage capacity is for units with deep desulfurization, with 35
percent dearomatization. With 20 percent dearomatization in the first-stage, dearomatization across the two stages
explains a large part of the on-road diesel aromatics reduction (to 16.4 vol percent) relative to the Base Case. There
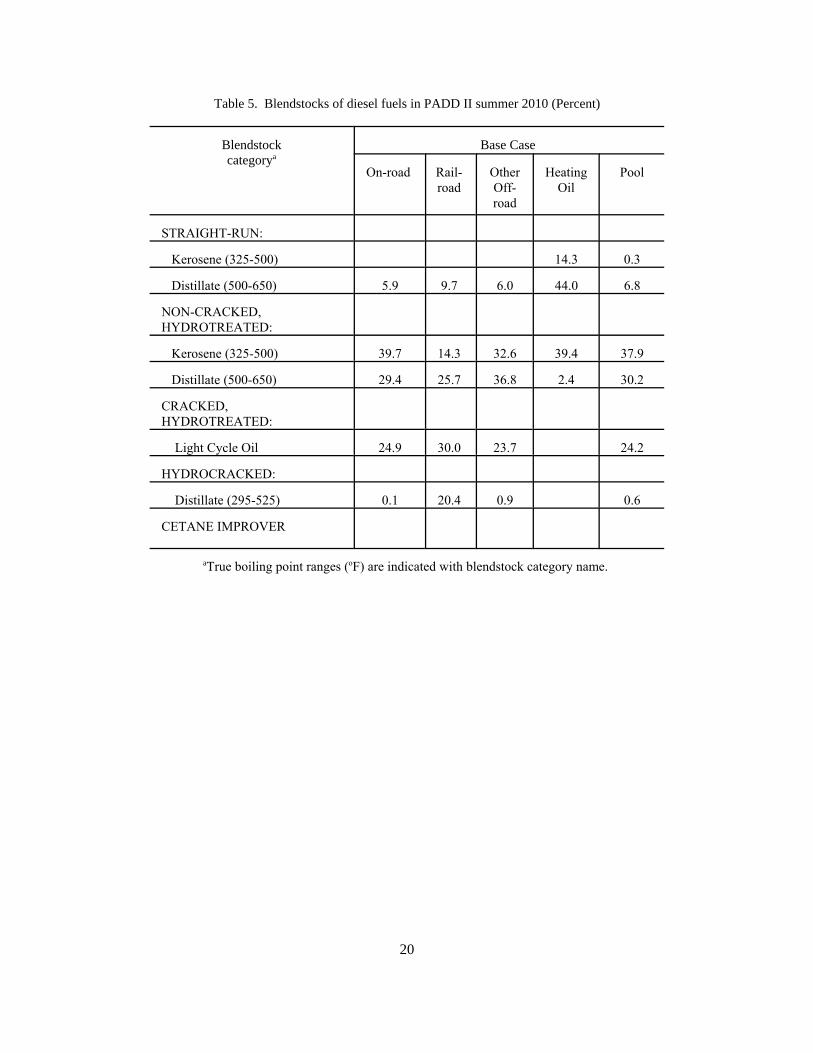
is also a shift of aromatics into the off-road diesel pool, relative to the Base Case. In the ULSD Case, the off-road
diesel pool has an aromatics content of 30.4 vol percent, compared with 24.2 vol percent in the Base Case. A
comparison of off-road diesel blendstocks for the two cases (Table 5) shows a decline in straight-run blendstocks
(higher sulfur content, lower aromatics content) and an increase in hydrotreated light-cycle oil (lower sulfur content,
higher aromatics content) in the ULSD Case.
RFD Case
In the RFD Case, ULSD is reformulated to satisfy more stringent cetane and aromatics specifications. Due to the
9
high cetane number specification for RFD, distillate upgrading is via two-stage deep hydroprocessing (Table 6).
There is no investment in advanced technologies that selectively remove. Five existing distillate desulfurization
units are revamped into two-stage units. For new two-stage installations, 14 percent of second-stage capacity is for
units with 70 percent dearomatization capability. Lesser dearomatization occurs in the first- and second-stage
distillate desulfurization units: 20 percent and 35 percent dearomatization, respectively.
Cetane improver is important in satisfying the on-road diesel cetane number specification. Table 3 shows that the
cetane improver treat rate is 0.122 vol percent. This rate is substantially higher than current regional averages. For
example, a recent industry survey shows that the cetane improver treat rate for high quality diesel fuel was 0.027 vol
percent [2].
Table 7 shows that the average cost increase for RFD is 9.0 cpg. The major component of this cost increase is
capital charges. Cetane improver (in the raw material category of Table 7) contributes 1.2 cpg to the cost increase.
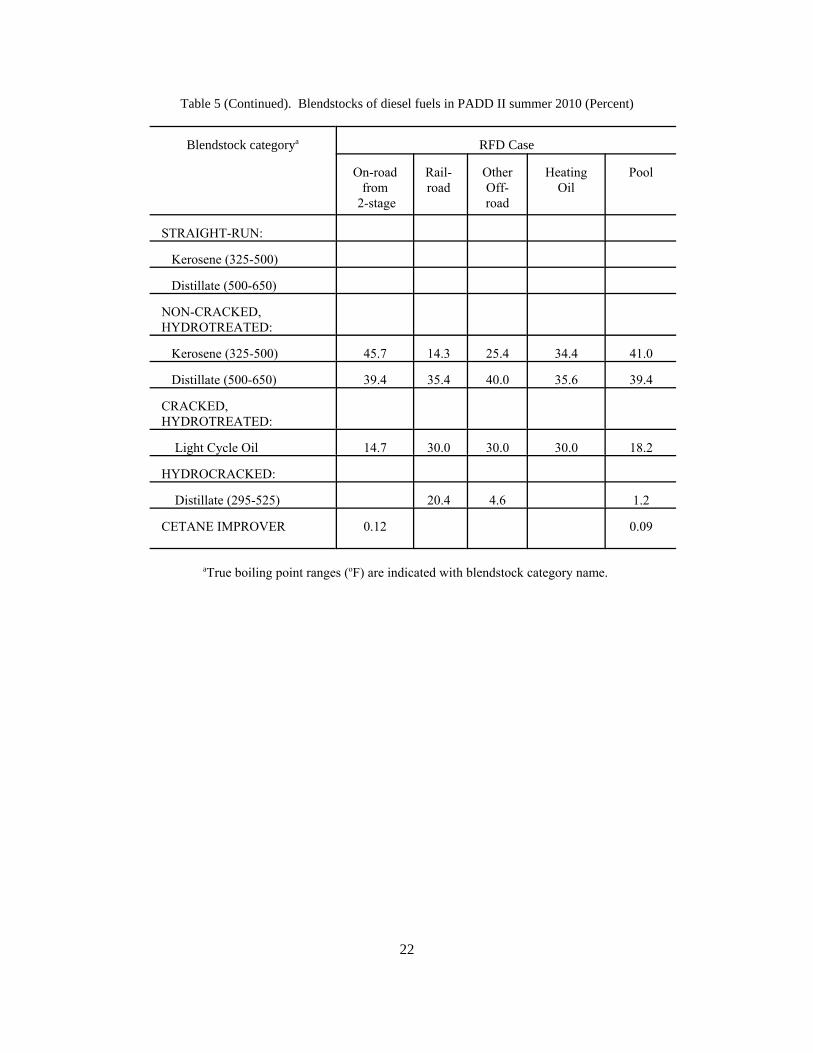
Tighter on-road specifications cause an increase in aromatics in the off-road diesel pool in the RFD Case. The off-
road diesel pool has an aromatics content of 29.3 vol percent, compared with 24.2 vol percent in the Base Case. A
comparison of off-road diesel blendstocks for the two cases (Table 5) shows a decline in straight-run blendstocks
(higher sulfur content, lower aromatics content) and an increase in hydrotreated light-cycle oil (lower sulfur content,
higher aromatics content) in the RFD Case compared to the Base Case. RFD has much-improved emissions
characteristics, relative to the commercial reference fuel. NOx emissions are reduced by 8.3 percent, and PM
emissions are reduced by 19.8 percent (Table 3).
IMPACT OF DIESEL FUEL REFORMULATION ON DEMAND
FOR CANADIAN SYNTHETIC CRUDE OIL
ORNL-RYM parametric analysis features have been used to examine the impacts of RFD on the PADD II refinery
demand for Canadian synthetic crude oil. As the production of synthetic crude oil increases, with economic
displacement of conventional crude oils, oilsands operators and refiners will face technical challenges with improved
10
quality requirements for diesel fuel, jet fuel, and heavy gas oil for fluid catalytic cracking feed [28,29]. The cetane
quality, aromatics content, and emissions specifications for RFD in our case studies would increase these challenges.
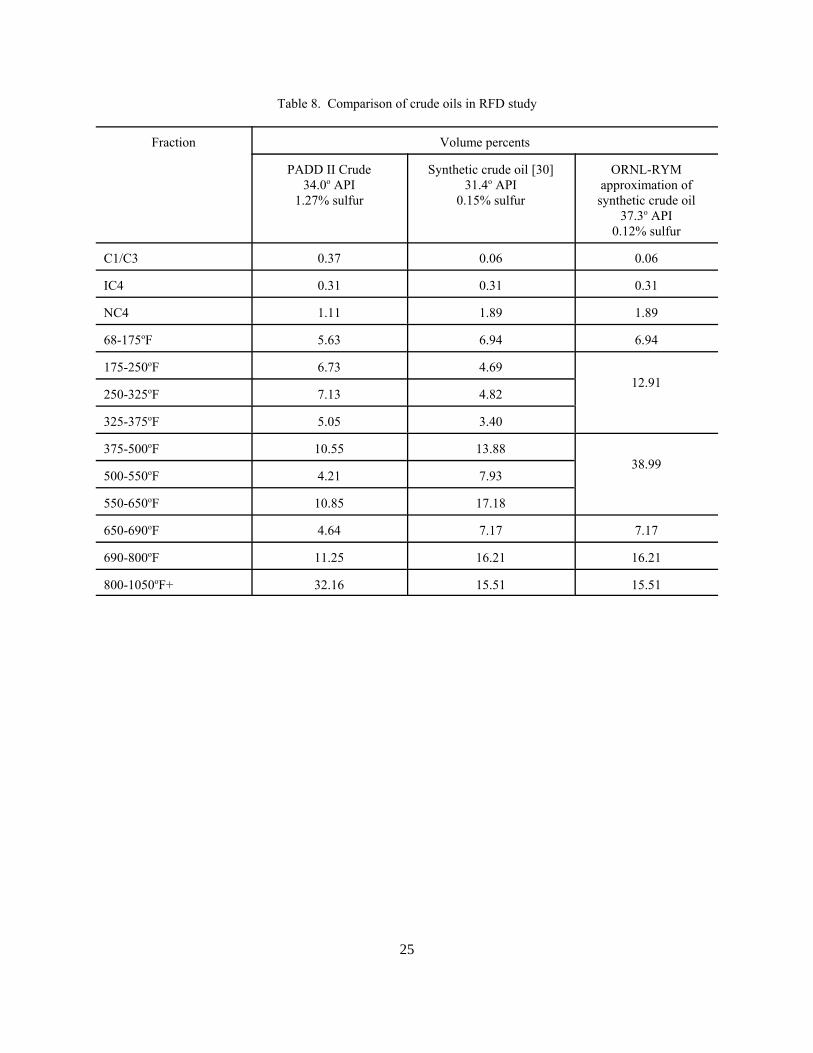
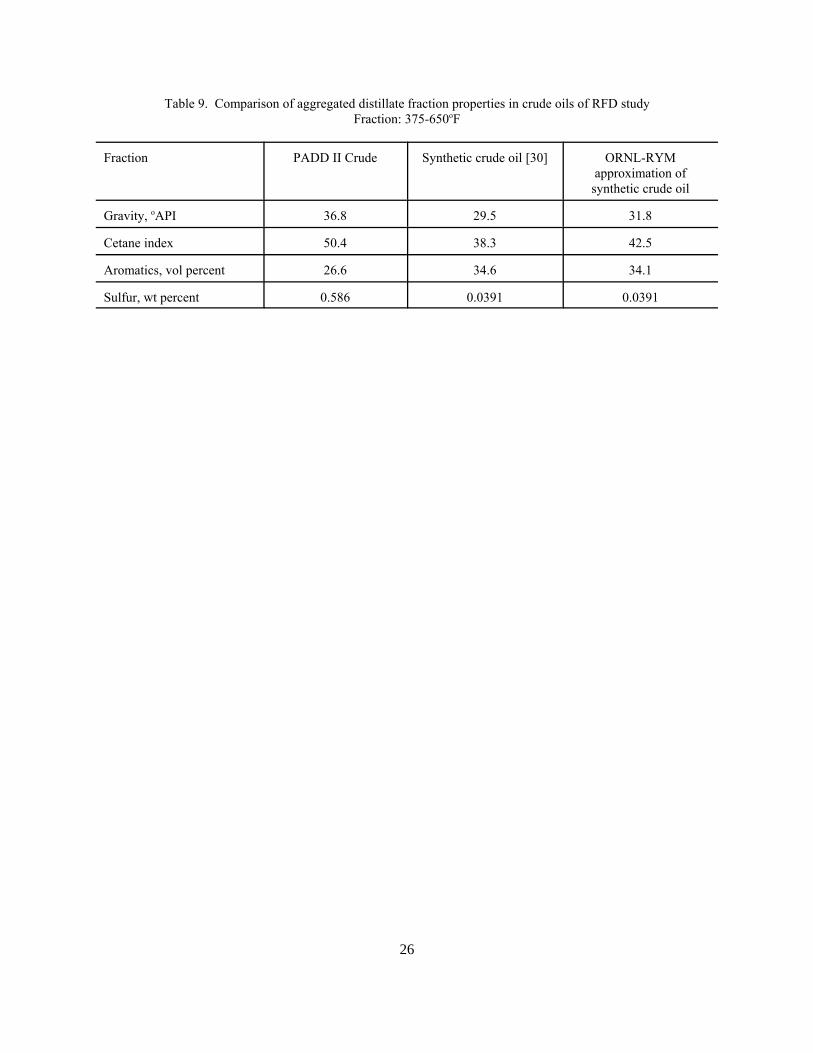
Tables 8 and 9 show fractions and selected properties for the PADD II crude oil used in the case studies; for a
Canadian synthetic crude oil; and for an ORNL-RYM approximation of that Canadian synthetic crude oil. For the
distillate fraction (Table 9), the synthetic crude oil and its approximation have substantially lower cetane indices, and
higher aromatics contents, compared to the PADD II crude oil. However, with much lower sulfur levels, the value
of synthetic crude oil should increase in the production of low sulfur products.
The parametric analysis illustrates impacts of changes in diesel product quality requirements, given the premised
synthetic crude oil quality and the PADD II refinery configurations. These cases do not address the issues of (1)
modifying the quality of synthetic crude oil to meet the requirements of crude purchasers; (2) modifying refinery
hardware to accommodate higher levels of synthetic crude oil use; or (3) impacts on product properties (e.g., jet fuel
and diesel lubricity) other than those specified in the case studies.
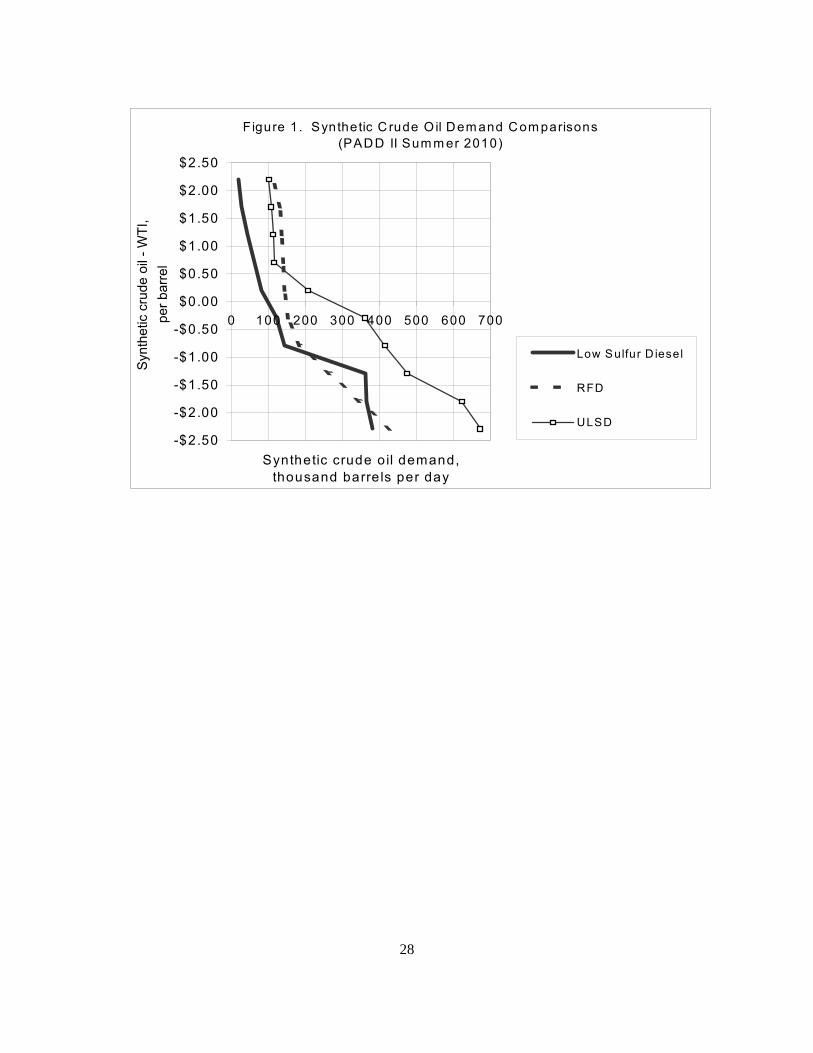
Figure 1 shows PADD II refinery demand comparisons for Canadian synthetic crude oil at various differentials in its
price relative to the price of West Texas Intermediate (WTI) crude. At the actual price differential of -$0.27 per
barrel in years 2000 and 2001 [31], the Figure 1 demand for synthetic crude oil for production of low sulfur diesel in
the Base Case is 122 MBD, or about 2.8 percent of the total PADD II crude run. This synthetic crude oil percentage
is nearly the same as the current actual 2.6 percent [32]. With production of low sulfur diesel, the demand for
synthetic crude oil is 0.3 percent of the total PADD II crude run at a price premium to WTI of $2.00 per barrel, and
8.5 percent of the total PADD II crude run at a price discount $2.00 per barrel. There is a sizeable increase in
synthetic crude oil demand when the maximum sulfur specification for on-road diesel falls from 500 ppm (Base Case
) to 15 ppm (ULSD Case). This demand increase is expected, given the low sulfur levels of synthetic crude oil.
Figure 1 also shows that diesel fuel reformulation substantially reduces the demand for synthetic crude oil at recent
prices (i.e., in the price differential neighborhood of -$0.27 per barrel in years 2000 and 2001), compared with
demand under ULSD production. The demand effect increases as price differentials drop below $0.50 per barrel.
11
Figure 1 shows that diesel fuel reformulation can reverse the synthetic crude oil demand increase that resulted from
the transition from low sulfur diesel to ULSD.
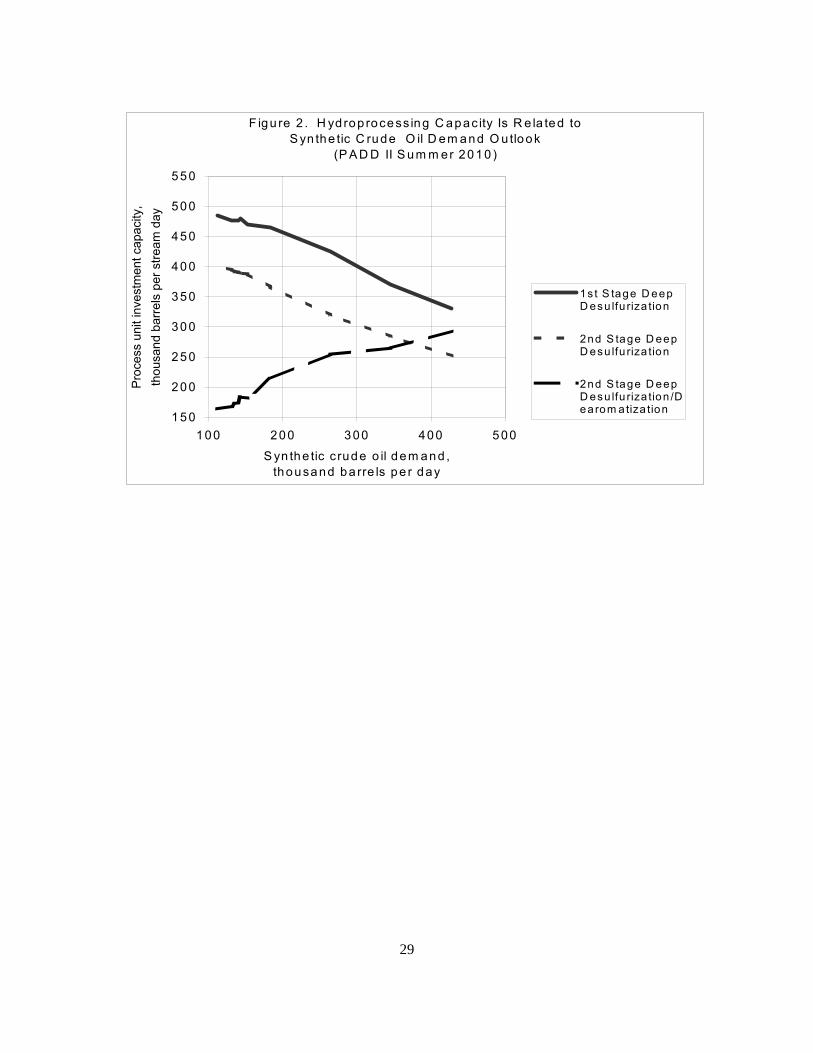
The relationship between desulfurization capacity and synthetic crude oil demand is illustrated in Figure 2. As
expected prices for synthetic crude oil fall, the expected demand for that crude increases, and investment in first- and
second stage deep desulfurization capacity declines. Due to the higher aromatics content of synthetic crude oil,
investment in second stage deep desulfurization/dearomatization capacity increases as the expected demand for
synthetic crude oil increases.
CONCLUSIONS
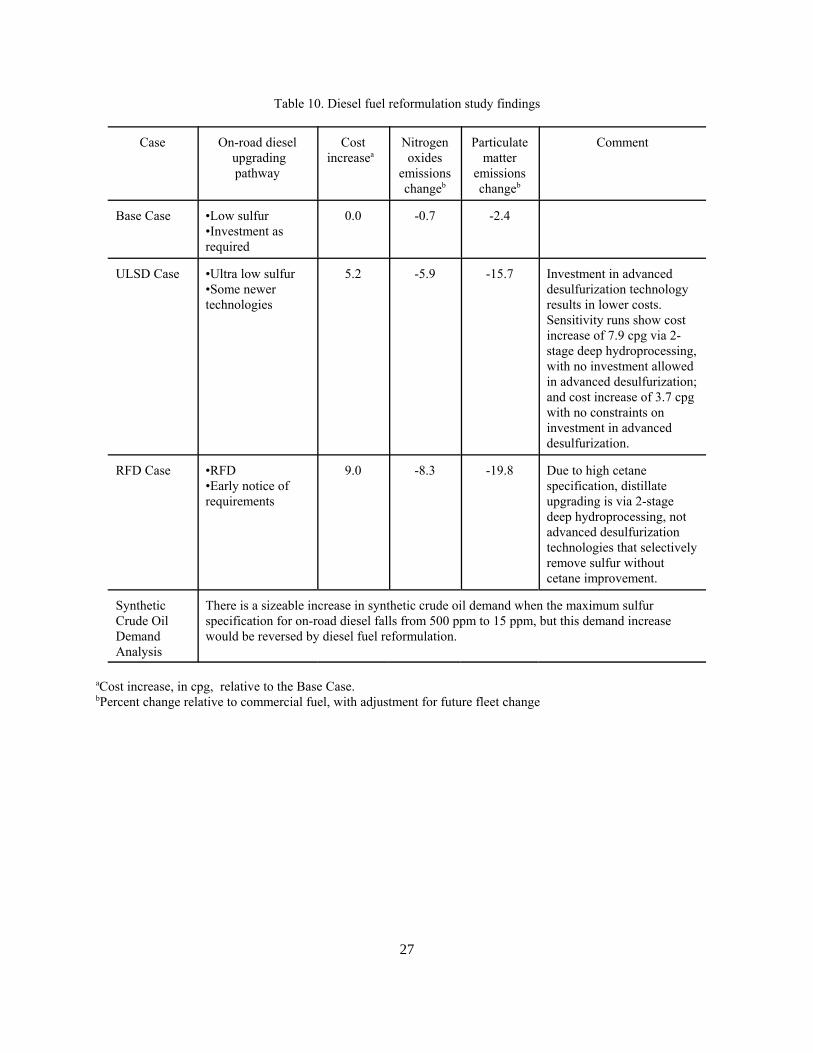
The diesel fuel reformulation study observations of Table 10 suggest the following:
C Diesel fuel reformulation costs are be substantial.
C Diesel fuel reformulation has considerable emissions reduction benefits.
C While advanced desulfurization technologies reduce the cost of ULSD, these technologies, with relatively
small impact on cetane and aromatics quality, may not be chosen for RFD production. Advanced
desulfurization technologies are on a suboptimal pathway for RFD production. These technologies could
contribute to increased costs of a delayed notice compared to an early notice investment pathway to RFD.
C It follows that refining costs are likely to be lower with early notice of product quality requirements for
RFD. With early notice of RFD requirements, refinery capital investment has not yet been made to satisfy
the ULSD requirement of year 2006, and there is greater flexibility for investment planning.
12
C There is a sizeable increase in synthetic crude oil demand as ULSD displaces low sulfur diesel fuel, but this
demand increase would be reversed by a requirement for diesel fuel reformulation.
REFERENCES
[1] Shiflett W. The Drive to Lower and Lower Sulfur: Criterion’s New Catalysts Help Refiners Tackle Sulfur, report
no. AM-01-2. Washington, DC: National Petrochemical & Refiners Association, 2001.
[2] American Petroleum Institute and National Petroleum Refiners Association. 1996 American Petroleum
Institute/National Petroleum Refiners Association Survey of Refining Operations and Product Quality. Washington
DC: API Publishing Services, 1997.
[3] European Automobile Manufacturers Association, Alliance of Automobile Manufacturers, Engine Manufacturers
Association, Japan Automobile Manufacturers Association. World-wide Fuel Charter. 2000. See also:
http://www.engine-manufacturers.org/about/Final%20WWFC%204%2000.pdf.
[4] Shapiro E. Comment on Draft DOE Study Protocol. Washington, DC: Alliance of Automobile Manufacturers,
2002.
[5] United States Department of Energy. Refinery Evaluation Modeling System (REMS) Documentation, report no.
DOE/EIA-0460. Washington, DC: Energy Information Administration, 1984.
[6] United states Department of Energy. Refinery Evaluation Modeling System (REMS) Documentation, report no.
DOE/EIA-0461. Washington, DC: Energy Information Administration, 1984.
[7] Tallett MR, Dunbar DN. Enhancement of EIA Refinery Yield Model: Extension and Demonstration on
Gasoline and Diesel Quality Issues. Flemington, NJ: EnSys Energy & Systems, Inc., 1988.
[8] Tallett MR, Dunbar DN, Leather J. Summary Documentation of Oak Ridge Refinery Yield Model Reformulated
Gasoline Update. Flemington, NJ: EnSys Energy & Systems, Inc., 1992.
[9] Dunbar DN, Tallett MR. Progress Report Number 1 - Technology and Features Enhancements to ORNL RYM.
Flemington, NJ: EnSys Energy & Systems, Inc., 2002.
[10] Dunbar DN, Tallett MR. Progress Report Number 2 - Technology and Features Enhancements to ORNL RYM.
Flemington, NJ: EnSys Energy & Systems, Inc., 2002.
13
[11] McAdams HT, Crawford RW, Hadder GR. PCR+ in Diesel Fuels and Emissions Research, report no.
ORNL/TM-2002-16. Oak Ridge, TN: Oak Ridge National Laboratory, 2002.
[12] Crawford RW. Development of NOx Emissions Model for Heavy-Duty Diesel Engines. Tucson, AZ:
RWCrawford Energy Systems, 2002.
[13] Korotney D. Revised Complex Model for Conventional and Reformulated Gasoline, report no. EPA Air
Docket A-92-12. Ann Arbor, MI: United States Environmental Protection Agency, Fuels and Standards Branch,
1993.
[14] United States Environmental Protection Agency. Control of Emissions of Hazardous Air Pollutants from Mobile
Sources, 40 CFR Parts 80, and 86.
[15] Ory RE. Potential Impacts of Sulfur Regulation on Cost and Supply of Diesel Fuels in the United States, report
no. AM-01-32. Washington, DC: National Petrochemical & Refiners Association, 2001.
[16] MathPro Inc. Prospects for Adequate Supply of Ultra Low Sulfur Diesel Fuel in the Transition Period (2006-
2007), report prepared for The Alliance of Automobile Manufacturers and The Engine Manufacturers Association.
West Bethesda, MD.
[17] United States Department of Energy. Petroleum Supply Annual 2000, report nos. DOE/EIA-0340(00)/1 and 2.
Washington, DC: Energy Information Administration, 2001 See also:
http://www.eia.doe.gov/oil_gas/petroleum/data_publications/petroleum_supply_annual/psa_volume1/psa_volume1.h
tml and
http://www.eia.doe.gov/oil_gas/petroleum/data_publications/petroleum_supply_annual/psa_volume2/psa_volume2.h
tm.l
[18] United States Department of Energy. Annual Energy Outlook 2002 with Projections to 2020, report no.
DOE/EIA-0383(2002). Washington, DC: Energy Information Administration, 2001. See also:
http://www.eia.doe.gov/oiaf/aeo/pdf/appa.pdf
[19] United States Department of Energy. Petroleum Marketing Annual, report no. DOE/EIA-0380(2001).
Washington, DC: Energy Information Administration, 2002. See also:
http://www.eia.doe.gov/oil_gas/petroleum/data_publications/petroleum_marketing_annual/pma.html
[20] Reynolds R. Infrastructure Requirements for an Expanded Fuel Ethanol Industry. South Bend, IN:
14
Downstream Alternatives, Inc., 2002. See also: http://www.afdc.doe.gov/pdfs/6235.pdf.
[21] United States Department of Energy. Refinery Capacity Data as of January 1, 2001.Washington, DC: Energy
Information Administration, 2002. See also:
http://www.eia.doe.gov/oil_gas/petroleum/data_publications/refinery_capacity_data/refcapacity.html.
[22] National Petroleum Council. U.S. Petroleum Refining, Assuring the Adequacy and Affordability of Cleaner
Fuels. Washington, DC: 2000.
[23] National Petroleum Refiners Association. NPRA Survey of U.S. Gasoline Quality and U.S. Refining Industry
Capacity to Produce Reformulated Gasolines, Part A. Washington, DC: 1991.
[24] Stell J. Worldwide Construction, Oil & Gas Journal 2001; 99(44): 82-83.
[25] Stell J. 2001 Worldwide Refining Survey, Oil & Gas Journal 2001; 99(52): 74-123.
[26] Dickson C, Sturm G. Diesel Fuels, 1994, report no. NIPER-187 PPS 94/5: Bartlesvillle, OK: National
Institute for Petroleum and Energy Research, 1994.
[27] Hadder G, Crawford RW, McAdams HT, McNutt BD. Estimating Impacts of Diesel Fuel Reformulation with
Vector-based Blending, report no. ORNL/TM-2002/225. Oak Ridge, TN: Oak Ridge National Laboratory, 2002.
[28] Yui S. 2000. Athabasca oilsands produce quality diesel and jet fuels, Oil & Gas Journal, 2000; 98(47).
[29] Yui S, Chung K. 2001. Processing oilsands is Syncrudes’s R&D focus, Oil & Gas Journal, 2001; 99(17).
[30] Clark D. Data on synthetic crude oils and Canadian heavy crude oils. Ottawa, Ontario: Natural Resources
Canada, 2002.
[31] Syncrude Canada LTD. Syncrude Canada LTD 2001 Annual Report. Fort McMurray, Alberta. See also:
http://www.syncrude.com/investors/ar01/pdf/FinRev.pdf.
[32] Natural Resources Canada. Canadian Oil Sands. In: TRB Summer Meeting, Port Huron, MI, 2002.
15
FIGURE CAPTIONS
Figure 1.Synthetic Crude Oil Demand Comparisons (PADD II Summer 2010)
Figure 2. Hydroprocessing Capacity Is Related to Synthetic Crude Oil Demand Outlook
(PADD II Summer 2010)
16
Table 1. On-road No. 2 diesel fuel regulations and timing [1,2,3,]
United States European Union(EU)
World-wide FuelCharter
Category 4aU.S. EPA California/Texasb
Californiab
Timing 1994 2006 2006 1996 actual 2000 2005
Gravity, APIo min 33 36.5 36 36 37
Sulfur, ppm max 500 15 15 140 350 10c 5-10
Cetane index, min 40 40 52
Cetane number,min
40 40 48 53.8 51 54-58 55
Aromatics, max:
Total 10 vol% 18.2 vol% 15 vol%
Polynuclear 1.4 wt% 2.8 vol% 11 wt% 1-6 wt% 2 vol%
Distillation, oF max
T90 640 640 610 623 608
T95 680 644-680 644
aMarkets with further advanced requirements for emission control, to enable sophisticated aftertreatmenttechnologies for reduction of emissions of nitrogen oxides and particulate matter. bHighway diesel fuel may satisfy different performance-based specifications if approved by the California AirResources Board for a Diesel Fuel Alternative Formulation. 1996 actuals for California show the significantdifferences in properties due to the alternative performance-based specifications.CAll three EU legislative bodies (Council, Commission and Parliament) have agreed to the 10 ppm sulfur level andthe start date, with only a few minor details to be worked out before a final decision later this year and publicationearly next year. The final end date for full implementation will be either 2008 or 2009 [4].
17
Table 2. Diesel fuel reformulation case studies for summer 2010a
Case Investment Sulfur ppm, max Cetane number, min Aromatics vol%, max
Base CaseSunk
@Base Case
500b (350c) 40 NA
ULSD Case 15b (8c) 40 NA
RFD Case 15b (8c) 55b (58.8c) 15b (12.5c)
aOff-road diesel fuels have maximum allowable sulfur contents of 500 ppm nominal, which are modeled as 350 ppmmaximum actual. bNominal specification value.cActual specification value, including refining blending margins, used in ORNL-RYM.
18
Table 3. Properties of on-road diesel fuel in PADD II summer 2010
Property Base Case ULSD Case RFD Case
Volume, thousand barrels per day 844 860 864
Specific gravity 0.8450 0.8334 0.8291
Sulfur, ppm 350 8 8
Cetane Index 48.5 52.4 53.5
Cetane Number, clear 44.9 50.4 51.5
Cetane Improver, vol% .000 .000 .122
Cetane Improver, number increase 0.0 0.0 7.3
Cetane Number, total 44.9 50.4 58.8
Aromatics, vol% 26.8 16.4 12.5
Viscosity, centistokes 2.65 2.80 2.76
ASTMInitial Boiling Point (IBP)a
377 376 375
T10b 436 435 434
T30b 463 463 463
T50b 499 493 492
T70b 549 540 539
T90b 589 591 591
Final Boiling Point (FBP)a 633 635 635
Nitrogen oxides emissions change, %c -0.7 -5.9 -8.3
Particulate matter emissions change, %c -2.4 -15.7 -19.8
aIBP and FBP are Fahrenheit temperatures based on survey reports of differences relative to T10 and T90 [26].bTxx is Fahrenheit temperature at which xx vol% of sample is evaporated in ASTM distillation test.cRelative to commercial fuel, with adjustment for future fleet change [27].
19
Table 4. Properties of on-road diesel fuels, by desulfurization technology, in PADD II summer 2010
Property ULSD Case: Desulfurization technology
2-stage Advanced
Volume, thousand barrels per day 772 88
Specific gravity 0.8312 0.8535
Sulfur, ppm 8 8
Cetane Index 52.9 44.9
Cetane Number, clear 50.9 42.9
Cetane Improver, vol% 0.000 0.000
Cetane Improver, number increase 0.0 0.0
Cetane Number, total 50.9 42.9
Aromatics, vol% 14.9 29.7
Viscosity, centistokes 2.80 2.76
ASTMInitial Boiling Point (IBP)a
376 373
T10b 435 432
T30b 463 466
T50b 492 495
T70b 539 547
T90b 591 590
Final Boiling Point (FBP)a 635 634
Nitrogen oxides emissions change, %c -6.4 -1.4
Particulate matter emissions change, %c -16.7 -2.3
aIBP and FBP are Fahrenheit temperatures based on survey reports of differences relative to T10 and T90 [26].bTxx is Fahrenheit temperature at which xx vol% of sample is evaporated in ASTM distillation test.cRelative to commercial fuel, with adjustment for future fleet change [27].
20
Table 5. Blendstocks of diesel fuels in PADD II summer 2010 (Percent)
Blendstockcategorya
Base Case
On-road Rail-road
OtherOff-road
HeatingOil
Pool
STRAIGHT-RUN:
Kerosene (325-500) 14.3 0.3
Distillate (500-650) 5.9 9.7 6.0 44.0 6.8
NON-CRACKED,HYDROTREATED:
Kerosene (325-500) 39.7 14.3 32.6 39.4 37.9
Distillate (500-650) 29.4 25.7 36.8 2.4 30.2
CRACKED,HYDROTREATED:
Light Cycle Oil 24.9 30.0 23.7 24.2
HYDROCRACKED:
Distillate (295-525) 0.1 20.4 0.9 0.6
CETANE IMPROVER
aTrue boiling point ranges (oF) are indicated with blendstock category name.
21
Table 5 (Continued). Blendstocks of diesel fuels in PADD II summer 2010 (Percent)
Blendstock categorya ULSD Case
On-roadfrom
2-stage
On-roadfrom
advancedDeS
Rail-road
OtherOff-road
HeatingOil
Pool
STRAIGHT-RUN:
Kerosene (325-500)
Distillate (500-650)
NON-CRACKED,HYDROTREATED:
Kerosene (325-500) 43.7 1.4 22.1 31.6 32.7 37.5
Distillate (500-650) 39.9 62.3 31.7 37.6 37.3 41.0
CRACKED,HYDROTREATED:
Light Cycle Oil 16.4 30.0 30.0 30.0 30.0 20.6
HYDROCRACKED:
Distillate (295-525) 6.4 16.1 0.8 0.9
CETANE IMPROVER
aTrue boiling point ranges (oF) are indicated with blendstock category name.
22
Table 5 (Continued). Blendstocks of diesel fuels in PADD II summer 2010 (Percent)
Blendstock categorya RFD Case
On-roadfrom
2-stage
Rail-road
OtherOff-road
HeatingOil
Pool
STRAIGHT-RUN:
Kerosene (325-500)
Distillate (500-650)
NON-CRACKED,HYDROTREATED:
Kerosene (325-500) 45.7 14.3 25.4 34.4 41.0
Distillate (500-650) 39.4 35.4 40.0 35.6 39.4
CRACKED,HYDROTREATED:
Light Cycle Oil 14.7 30.0 30.0 30.0 18.2
HYDROCRACKED:
Distillate (295-525) 20.4 4.6 1.2
CETANE IMPROVER 0.12 0.09
aTrue boiling point ranges (oF) are indicated with blendstock category name.
23
Table 6. Process capacity expansions and additions in PADD II summer 2010 (Thousand barrels per stream day, unless otherwise noted)
Process ULSD Case RFD Case
Crude distillation 2 64
Vacuum distillation 3 38
Delayed coking 18
Gas oil hydrocracking 71
Distillate deep hydrodesulfurization, 1st stage unit HD1 536 529
Distillate deep hydrodesulfurization, 2nd stage unit HS2 535 496
Distillate deep hydrodesulfurization and dearomatization, 2nd stage unit HD2
78
Revamp of distillate desulfurization to HD1 + HS2 211 211
Conversion of HS2 to HD2
Advanced distillate desulfurization technology 90
Naphtha splitter 30
Hydrogen plant, fuel oil equivalent basis 13 21
Sulfur plant, tons per day 0.5
24
Table 7. Components of refinery cost changes in PADD II summer 2010 (cents per gallon of RFD)
Base Case ULSD Case RFD Case
Raw material costs and product revenue changes 0.0 -1.4 -0.3
Processing costs 0.0 0.9 0.9
Capital charges 0.0 4.6 6.8
Fixed operating costs 0.0 1.1 1.6
Total cost change (10 percent ROI) 0.0 5.2 9.0
25
Table 8. Comparison of crude oils in RFD study
Fraction Volume percents
PADD II Crude34.0o API
1.27% sulfur
Synthetic crude oil [30]31.4o API
0.15% sulfur
ORNL-RYMapproximation ofsynthetic crude oil
37.3o API0.12% sulfur
C1/C3 0.37 0.06 0.06
IC4 0.31 0.31 0.31
NC4 1.11 1.89 1.89
68-175oF 5.63 6.94 6.94
175-250oF 6.73 4.6912.91
250-325oF 7.13 4.82
325-375oF 5.05 3.40
375-500oF 10.55 13.8838.99
500-550oF 4.21 7.93
550-650oF 10.85 17.18
650-690oF 4.64 7.17 7.17
690-800oF 11.25 16.21 16.21
800-1050oF+ 32.16 15.51 15.51
26
Table 9. Comparison of aggregated distillate fraction properties in crude oils of RFD studyFraction: 375-650oF
Fraction PADD II Crude Synthetic crude oil [30] ORNL-RYMapproximation ofsynthetic crude oil
Gravity, oAPI 36.8 29.5 31.8
Cetane index 50.4 38.3 42.5
Aromatics, vol percent 26.6 34.6 34.1
Sulfur, wt percent 0.586 0.0391 0.0391
27
Table 10. Diesel fuel reformulation study findings
Case On-road diesel upgradingpathway
Costincreasea
Nitrogenoxides
emissionschangeb
Particulatematter
emissionschangeb
Comment
Base Case •Low sulfur•Investment asrequired
0.0 -0.7 -2.4
ULSD Case •Ultra low sulfur•Some newertechnologies
5.2 -5.9 -15.7 Investment in advanceddesulfurization technologyresults in lower costs. Sensitivity runs show costincrease of 7.9 cpg via 2-stage deep hydroprocessing,with no investment allowedin advanced desulfurization;and cost increase of 3.7 cpgwith no constraints oninvestment in advanceddesulfurization.
RFD Case •RFD•Early notice ofrequirements
9.0 -8.3 -19.8 Due to high cetanespecification, distillateupgrading is via 2-stagedeep hydroprocessing, notadvanced desulfurizationtechnologies that selectivelyremove sulfur withoutcetane improvement.
SyntheticCrude OilDemand Analysis
There is a sizeable increase in synthetic crude oil demand when the maximum sulfurspecification for on-road diesel falls from 500 ppm to 15 ppm, but this demand increasewould be reversed by diesel fuel reformulation.
aCost increase, in cpg, relative to the Base Case.bPercent change relative to commercial fuel, with adjustment for future fleet change
28
Figure 1. Synthetic C rude O il Dem and Com parisons(PADD II Sum m er 2010)
-$2.50
-$2.00
-$1.50
-$1.00
-$0.50
$0.00
$0.50
$1.00
$1.50
$2.00
$2.50
0 100 200 300 400 500 600 700
Synthetic crude o il demand, thousand barre ls per day
Synt
hetic
cru
de o
il - W
TI,
per b
arre
l
Low Sulfur D iesel
RFD
ULSD
29
F igu re 2 . H ydrop rocess ing C apac ity Is R e la ted to S yn the tic C rude O il D em and O utlook
(P A D D II S um m er 2010 )
150
200
250
300
350
400
450
500
550
100 200 300 400 500S yn the tic c rude o il dem and ,
thousand ba rre ls pe r day
Proc
ess
unit
inve
stm
ent c
apac
ity,
thou
sand
bar
rels
per
stre
am d
ay
1 s t S tage D eepD esu lfu riza tion
2nd S tage D eepD esu lfu riza tion
2nd S tage D eepD esu lfu riza tion /Dearom atiza tion