diamond knot - microsoft cargo of salmon was salvaged in the largest salvage operation of its time....
TRANSCRIPT

Office of National Marine Sanctuaries Office of Response and Restoration
Screening Level Risk Assessment Package
Diamond Knot
March 2013

National Oceanic and Atmospheric Administration Office of National Marine Sanctuaries Daniel J. Basta, Director Lisa Symons John Wagner Office of Response and Restoration Dave Westerholm, Director Debbie Payton Doug Helton Photo: Photograph of Diamond Knot sinking Source: http://john-rawlings.newsvine.com/_news/2008/06/27/1619426-the-wreck-of-the-diamond-knot-jewel-beneath-an-emerald-sea

i
Table of Contents
Project Background .......................................................................................................................................ii
Executive Summary ......................................................................................................................................1
Section 1: Vessel Background Information: Remediation of Underwater Legacy Environmental Threats (RULET) .....................................................................................................2
Vessel Particulars .........................................................................................................................................2 Casualty Information .....................................................................................................................................3 Wreck Location .............................................................................................................................................4 Casualty Narrative ........................................................................................................................................4 General Notes ..............................................................................................................................................4 Wreck Condition/Salvage History ................................................................................................................4 Archaeological Assessment .........................................................................................................................5 Assessment ..................................................................................................................................................6 Background Information References ............................................................................................................6 Vessel Risk Factors ......................................................................................................................................7
Section 2: Environmental Impact Modeling ...............................................................................................13
Release Scenarios Used in the Modeling ...................................................................................................13 Oil Type for Release ...................................................................................................................................14 Oil Thickness Thresholds ............................................................................................................................14 Potential Impacts to the Water Column .......................................................................................................15 Potential Water Surface Slick ......................................................................................................................16 Potential Shoreline Impacts.........................................................................................................................19
Section 3: Ecological Resources At Risk ..................................................................................................22
Ecological Risk Factors ...............................................................................................................................24
Section 4: Socio-Economic Resources At Risk ........................................................................................30
Socio-Economic Risk Factors .....................................................................................................................33
Section 5: Overall Risk Assessment and Recommendations for Assessment,
Monitoring, or Remediation ..........................................................................................................39

ii
Project Background The past century of commerce and warfare has left a legacy of thousands of sunken vessels along the U.S.
coast. Many of these wrecks pose environmental threats because of the hazardous nature of their cargoes,
presence of munitions, or bunker fuel oils left onboard. As these wrecks corrode and decay, they may
release oil or hazardous materials. Although a few vessels, such as USS Arizona in Hawaii, are well-
publicized environmental threats, most wrecks, unless they pose an immediate pollution threat or impede
navigation, are left alone and are largely forgotten until they begin to leak.
In order to narrow down the potential sites for inclusion into regional and area contingency plans, in
2010, Congress appropriated $1 million to identify the most ecologically and economically significant
potentially polluting wrecks in U.S. waters. This project supports the U.S. Coast Guard and the Regional
Response Teams as well as NOAA in prioritizing threats to coastal resources while at the same time
assessing the historical and cultural significance of these nonrenewable cultural resources.
The potential polluting shipwrecks were identified through searching a broad variety of historical sources.
NOAA then worked with Research Planning, Inc., RPS ASA, and Environmental Research Consulting to
conduct the modeling forecasts, and the ecological and environmental resources at risk assessments.
Initial evaluations of shipwrecks located within American waters found that approximately 600-1,000
wrecks could pose a substantial pollution threat based on their age, type and size. This includes vessels
sunk after 1891 (when vessels began being converted to use oil as fuel), vessels built of steel or other
durable material (wooden vessels have likely deteriorated), cargo vessels over 1,000 gross tons (smaller
vessels would have limited cargo or bunker capacity), and any tank vessel.
Additional ongoing research has revealed that 87 wrecks pose a potential pollution threat due to the
violent nature in which some ships sank and the structural reduction and demolition of those that were
navigational hazards. To further screen and prioritize these vessels, risk factors and scores have been
applied to elements such as the amount of oil that could be on board and the potential ecological or
environmental impact.

1
Executive Summary: Diamond Knot
The freighter Diamond Knot, sunk after a
collision in the Strait of Juan de Fuca in
1947, was identified as a potential
pollution threat, thus a screening-level risk
assessment was conducted. The different
sections of this document summarize what
is known about the Diamond Knot, the
results of environmental impact modeling
composed of different release scenarios,
the ecological and socio-economic
resources that would be at risk in the event
of releases, the screening-level risk
scoring results and overall risk assessment,
and recommendations for assessment,
monitoring, or remediation.
Based on this screening-level assessment, each
vessel was assigned a summary score calculated
using the seven risk criteria described in this
report. For the Worst Case Discharge, Diamond
Knot scores High with 16 points; for the Most
Probable Discharge (10% of the Worse Case
volume), Diamond Knot scores Medium with 13
points. Given these scores, and higher levels of
data certainty, NOAA recommends that this site be
noted in the Area Contingency Plans and be
considered for further assessment to determine the
vessel condition, amount of oil onboard, and
feasibility of oil removal action. At a minimum, an
active monitoring program should be implemented.
Outreach efforts with the technical and recreational
dive community as well as commercial and
recreational fishermen who frequent the area
would be helpful to gain awareness of changes in
the site. Because it is such a popular dive site, this
may be an opportunity to engage local divers as
citizen-scientists in monitoring of the wreck for oil
releases and changes in its condition.
Vessel Risk Factors Risk Score
Pollution Potential Factors
A1: Oil Volume (total bbl)
Med
A2: Oil Type
B: Wreck Clearance
C1: Burning of the Ship
C2: Oil on Water
D1: Nature of Casualty
D2: Structural Breakup
Archaeological Assessment
Archaeological Assessment Not Scored
Operational Factors
Wreck Orientation
Not Scored
Depth
Confirmation of Site Condition
Other Hazardous Materials
Munitions Onboard
Gravesite (Civilian/Military)
Historical Protection Eligibility
WCD MP (10%)
Ecological Resources
3A: Water Column Resources Med Med
3B: Water Surface Resources Med Low
3C: Shore Resources Low Low
Socio-Economic Resources
4A: Water Column Resources High Med
4B: Water Surface Resources High High
4C: Shore Resources High Med
Summary Risk Scores 16 13
The determination of each risk factor is explained in the document.
This summary table is found on page 40.

Section 1: Vessel Background Information: Remediation of Underwater Legacy Environmental Threats (RULET)
2
SECTION 1: VESSEL BACKGROUND INFORMATION: REMEDIATION OF
UNDERWATER LEGACY ENVIRONMENTAL THREATS (RULET)
Vessel Particulars
Official Name: Diamond Knot
Official Number: 246686
Vessel Type: Freighter
Vessel Class: C1-M-AV1 "Sea Mavi"
class cruiser
Former Names: N/A
Year Built: 1944
Builder: Consolidated Steel, Wilmington, DE
Builder’s Hull Number: 1219
Flag: American
Owner at Loss: Alaska Steamship Company
Controlled by: N/A
Chartered to: N/A
Operated by: Alaska Steamship Company
Homeport: Seattle, WA
Length: 323 feet Beam: 50 feet Depth: 26 feet
Gross Tonnage: 3,805 Net Tonnage: 2,123
Hull Material: Steel Hull Fastenings: Welded Powered by: Oil Engines
Bunker Type: Medium Fuel Oil (Marine Diesel) Bunker Capacity (bbl): 6,516
Average Bunker Consumption (bbl) per 24 hours: 65 Liquid Cargo Capacity (bbl): N/A
Dry Cargo Capacity: Unknown
Tank or Hold Description: Unknown

Section 1: Vessel Background Information: Remediation of Underwater Legacy Environmental Threats (RULET)
3
Casualty Information
Port Departed: Unknown Destination Port: Unknown
Date Departed: Unknown Date Lost: August 13, 1947
Number of Days Sailing: Unknown Cause of Sinking: Collision with freighter Fenn Victory
Latitude (DD): 48.1716 Longitude (DD): -123.576
Nautical Miles to Shore: 1.54 Nautical Miles to NMS: 56
Nautical Miles to MPA: 7.2 Nautical Miles to Fisheries: Unknown
Approximate Water Depth (Ft): 140 Bottom Type: Mud/silt
Is There a Wreck at This Location? Yes, wreck has been positively located and identified
Wreck Orientation: Resting on its starboard side
Vessel Armament: None
Cargo Carried when Lost: 154,000 cases of Alaskan canned salmon (cargo was salvaged)
Cargo Oil Carried (bbl): 0 Cargo Oil Type: N/A
Probable Fuel Oil Remaining (bbl): Unknown ≤6,500 Fuel Type: Medium Fuel Oil (Diesel)
Total Oil Carried (bbl): ≤ 6,500 Dangerous Cargo or Munitions: No
Munitions Carried: None
Demolished after Sinking: No Salvaged: Yes, cargo of salmon was recovered
Cargo Lost: No Reportedly Leaking: No
Historically Significant: Yes Gravesite: No
Salvage Owner: Not known if any

Section 1: Vessel Background Information: Remediation of Underwater Legacy Environmental Threats (RULET)
4
Wreck Location
Chart Number: 18400
Casualty Narrative
From the Ottawa Citizen Aug. 13, 1947: "The 5,525-ton Seattle motorship Diamond Knot, sliced almost
half-way through in a collision with the freighter Fenn Victory, sank in the fog-bound strait of Juan de
Fuca at 9:05 a.m., Royal Canadian Navy officials said today. The 326-foot vessel, owned by the Alaska
Steamship Company, had a $3,000,000 salmon cargo aboard as it disappeared below the water while in
tow by two tugs. She was rammed deep amidships by the 10,681-ton freighter shortly after daybreak…"
General Notes
The cargo of salmon was salvaged in the largest salvage operation of its time. Since then the wreck has
become an icon in the Pacific Northwest with breweries and beers named in its honor.
Wreck Condition/Salvage History
“Today, the Diamond Knot has become a gold mine for Pacific Northwest Technical Divers and advanced
recreational divers who have the knowledge and skills to experience her. In addition to the damage
inflicted by the collision with the Fenn Victory, the massive cutting operations involved in the salvage
efforts further weakened the hull and much of the wreck has collapsed upon itself over time. Penetration
of the wreck is still possible at some points, but such a venture requires extreme levels of training, skill,
and caution.

Section 1: Vessel Background Information: Remediation of Underwater Legacy Environmental Threats (RULET)
5
Time and the nutrient-rich waters of the Strait of Juan de Fuca have taken their toll on the Diamond Knot.
The vessel is enshrouded with a thick encrustation of anemones, scallops, sponges, giant barnacles, and
hundreds of other underwater denizens of the Pacific Northwest. Throughout most of the wreck, it is only
the straight and regular edges obviously created by man that mark it as a sunken ship and not a
marvelously intricate rocky reef. Serving as an artificial reef, the Diamond Knot hosts huge numbers of
various species of Northwest Rockfish and Greenling that often will curiously approach divers. The
Diamond Knot is a dream for both the macro and wide-angle photographer, with life literally covering
almost every square inch of the wreck. The invertebrate population quite literally consists of everything
from the tiniest of single-celled creatures to the giant Puget Sound King Crab and virtually everything
else in between. Huge Ling Cod, Cabezon, Red Irish Lord and Wolf Eel can be found on the wreck and
make marvelous photo opportunities when they can be convinced to pose. A healthy population of Giant
Pacific Octopus (Enteroctopus dofleini) can also be found living amongst the nooks and crannies of the
wreck, feeding on the vast quantities of crustaceans to be found there. Each season individual Octopuses
of great size are reported by visiting divers and underwater photographers.
Visibility on the Diamond Knot is never constant and is heavily dependent on the season as well as both
current and weather conditions, occasionally dropping to 10 feet or less (at times, far less!). Divers would
do best to explore the ship with the attitude of accepting whatever visibility "Old Juan de Fuca" decides to
allow, planning ahead for all possible conditions.
Just as they brought the Diamond Knot to her eventual demise, today the tidal currents sweeping over the
wreck can still be fierce, and dives should be planned for slack water or periods of low tidal exchange.
While exploring the wreck, structure can be used to block much of the force of the current. However,
divers need to be constantly aware that those same currents can drastically affect their ascent and should
plan accordingly. While the Diamond Knot can be planned as a non-decompression dive, those divers
planning decompression stops using an anchor line would be well served to carry JON lines as part of
their equipment and be thoroughly acquainted with their use in high current. Additionally, a solid
knowledge of reel and lift-bag decompression techniques and skills is also recommended should a
decompressing diver be swept off the anchor line. Divers and boat crews should discuss and anticipate
such events and plan for them before they occur.”
-http://john-rawlings.newsvine.com/_news/2008/06/27/1619426-the-wreck-of-the-diamond-knot-jewel-
beneath-an-emerald-sea
Archaeological Assessment
The archaeological assessment provides additional primary source based documentation about the sinking
of vessels. It also provides condition-based archaeological assessment of the wrecks when possible. It
does not provide a risk-based score or definitively assess the pollution risk or lack thereof from these
vessels, but includes additional information that could not be condensed into database form.
Where the current condition of a shipwreck is not known, data from other archaeological studies of
similar types of shipwrecks provide the means for brief explanations of what the shipwreck might look
like and specifically, whether it is thought there is sufficient structural integrity to retain oil. This is more
subjective than the Pollution Potential Tree and computer-generated resource at risk models, and as such
provides an additional viewpoint to examine risk assessments and assess the threat posed by these

Section 1: Vessel Background Information: Remediation of Underwater Legacy Environmental Threats (RULET)
6
shipwrecks. It also addresses questions of historical significance and the relevant historic preservation
laws and regulations that will govern on-site assessments.
In some cases where little additional historic information has been uncovered about the loss of a vessel,
archaeological assessments cannot be made with any degree of certainty and were not prepared. For
vessels with full archaeological assessments, NOAA archaeologists and contracted archivists have taken
photographs of primary source documents from the National Archives that can be made available for
future research or on-site activities.
Assessment
The freighter Diamond Knot was initially listed as a potential high priority shipwreck because of its close
proximity to shore and the good condition of the wreck. The wreck is only about 1.5 miles from shore in
the Strait of Juan de Fuca, and it rests on its starboard side in approximately 140 feet of water. The
shipwreck is in extremely good condition due to the cold waters in the strait and is commonly regarded as
the best shipwreck dive site in the Pacific Northwest. Despite the wreck being in very good condition and
resting on its side (an orientation that could enable the wreck to trap oil), however, the frequency with
which the site is visited and the lack of reports of any oil coming from the wreck suggests it is likely that
little to no oil remains inside the ship.
At the time of its loss, the ship only had a bunker capacity of 6,516 bbl of marine diesel oil. Since the ship
was returning from a voyage to Alaska, it is possible that much of this oil had already been consumed
prior to the ship sinking as a result of a collision. Although NOAA archaeologists cannot guarantee the
presence or absence of oil remaining on this wreck, it seems very likely that most, if not all, of the diesel
bunkers would have vented out of the wreck shortly after its sinking or in the 64 years the wreck has spent
in the swift currents of the Strait of Juan de Fuca. Given the close proximity to shore and the relatively
shallow depth of the site, however, this may be a shipwreck that is easy for the U.S. Coast Guard to
definitively assess in regards to its pollution potential.
Should the vessel be assessed, it should be noted that this vessel is of historic significance and will require
appropriate actions be taken under the National Historic Preservation Act (NHPA) prior to any actions
that could impact the integrity of the vessel. This vessel may be eligible for listing on the National
Register of Historic Places.
Background Information References
Vessel Image Sources: http://john-rawlings.newsvine.com/_news/2008/06/27/1619426-the-wreck-of-the-
diamond-knot-jewel-beneath-an-emerald-sea
Construction Diagrams or Plans in RULET Database? No
Text References:
http://john-rawlings.newsvine.com/_news/2008/06/27/1619426-the-wreck-of-the-diamond-knot-jewel-
beneath-an-emerald-sea
Google newspapers

Section 1: Vessel Background Information: Remediation of Underwater Legacy Environmental Threats (RULET)
7
Vessel Risk Factors
In this section, the risk factors that are associated with the vessel are defined and then applied to the
Diamond Knot based on the information available. These factors are reflected in the pollution potential
risk assessment development by the U.S. Coast Guard Salvage Engineering Response Team (SERT) as a
means to apply a salvage engineer’s perspective to the historical information gathered by NOAA. This
analysis reflected in Figure 1-1 is simple and straightforward and, in combination with the accompanying
archaeological assessment, provides a picture of the wreck that is as complete as possible based on
current knowledge and best professional judgment. This assessment does not take into consideration
operational constraints such as depth or unknown location, but rather attempts to provide a replicable and
objective screening of the historical date for each vessel. SERT reviewed the general historical
information available for the database as a whole and provided a stepwise analysis for an initial indication
of Low/Medium/High values for each vessel.
In some instances, nuances from the archaeological assessment may provide additional input that will
amend the score for Section 1. Where available, additional information that may have bearing on
operational considerations for any assessment or remediation activities is provided.
Pollution Potential Tree
Figure 1-1: U.S. Coast Guard Salvage Engineering Response Team (SERT) developed the above Pollution Potential Decision Tree.
Was there oil
onboard?
(Excel)
Was the wreck
demolished?
(Excel)
Yes or ?
Low Pollution Risk
No
Yes
Medium Pollution Risk
High Pollution Risk
No or ?
Was significant cargo
lost during casualty?
(Research)
Yes
Is cargo area
damaged?
(Research)
No or ?
No or ?
Yes
Likely all cargo lost?
(Research)
No or ?
Yes

Section 1: Vessel Background Information: Remediation of Underwater Legacy Environmental Threats (RULET)
8
Each risk factor is characterized as High, Medium, or Low Risk or a category-appropriate equivalent such
as No, Unknown, Yes, or Yes Partially. The risk categories correlate to the decision points reflected in
Figure 1-1.
Each of the risk factors also has a “data quality modifier” that reflects the completeness and reliability of
the information on which the risk ranks were assigned. The quality of the information is evaluated with
respect to the factors required for a reasonable preliminary risk assessment. The data quality modifier
scale is:
High Data Quality: All or most pertinent information on wreck available to allow for thorough
risk assessment and evaluation. The data quality is high and confirmed.
Medium Data Quality: Much information on wreck available, but some key factor data are
missing or the data quality is questionable or not verified. Some additional research needed.
Low Data Quality: Significant issues exist with missing data on wreck that precludes making
preliminary risk assessment, and/or the data quality is suspect. Significant additional research
needed.
In the following sections, the definition of low, medium, and high for each risk factor is provided. Also,
the classification for the Diamond Knot is provided, both as text and as shading of the applicable degree
of risk bullet.
Pollution Potential Factors Risk Factor A1: Total Oil Volume The oil volume classifications correspond to the U.S. Coast Guard spill classifications:
Low Volume: Minor Spill <240 bbl (10,000 gallons)
Medium Volume: Medium Spill ≥240 – 2,400 bbl (100,000 gallons)
High Volume: Major Spill ≥2,400 bbl (≥100,000 gallons)
The oil volume risk classifications refer to the volume of the most-likely Worst Case Discharge from the
vessel and are based on the amount of oil believed or confirmed to be on the vessel.
The Diamond Knot is ranked as High Volume because it is thought to have a potential for up to 6,516 bbl,
although some of that may have been lost at the time of the casualty or since the vessel sank. Data quality
is medium.
The risk factor for volume also incorporates any reports or anecdotal evidence of actual leakage from the
vessel or reports from divers of oil in the overheads, as opposed to potential leakage. This reflects the
history of the vessel’s leakage. There are no reports of leakage from the Diamond Knot.
Risk Factor A2: Oil Type The oil type(s) on board the wreck are classified only with regard to persistence, using the U.S. Coast

Section 1: Vessel Background Information: Remediation of Underwater Legacy Environmental Threats (RULET)
9
Guard oil grouping1. (Toxicity is dealt with in the impact risk for the Resources at Risk classifications.)
The three oil classifications are:
Low Risk: Group I Oils – non-persistent oil (e.g., gasoline)
Medium Risk: Group II – III Oils – medium persistent oil (e.g., diesel, No. 2 fuel, light crude,
medium crude)
High Risk: Group IV – high persistent oil (e.g., heavy crude oil, No. 6 fuel oil, Bunker C)
The Diamond Knot is classified as Medium Risk because the bunker oil is diesel oil, a Group II oil type.
Data quality is high.
Was the wreck demolished?
Risk Factor B: Wreck Clearance This risk factor addresses whether or not the vessel was historically reported to have been demolished as a
hazard to navigation or by other means such as depth charges or aerial bombs. This risk factor is based on
historic records and does not take into account what a wreck site currently looks like. The risk categories
are defined as:
Low Risk: The wreck was reported to have been entirely destroyed after the casualty
Medium Risk: The wreck was reported to have been partially cleared or demolished after the
casualty
High Risk: The wreck was not reported to have been cleared or demolished after the casualty
Unknown: It is not known whether or not the wreck was cleared or demolished at the time of or
after the casualty
The Diamond Knot is classified as High Risk because there are no known historic accounts of the wreck
being demolished as a hazard to navigation. Data quality is high
Was significant cargo or bunker lost during casualty? Risk Factor C1: Burning of the Ship This risk factor addresses any burning that is known to have occurred at the time of the vessel casualty
and may have resulted in oil products being consumed or breaks in the hull or tanks that would have
increased the potential for oil to escape from the shipwreck. The risk categories are:
Low Risk: Burned for multiple days
Medium Risk: Burned for several hours
High Risk: No burning reported at the time of the vessel casualty
Unknown: It is not known whether or not the vessel burned at the time of the casualty
1 Group I Oil or Nonpersistent oil is defined as “a petroleum-based oil that, at the time of shipment, consists of hydrocarbon fractions: At least 50% of which, by volume, distill at a temperature of 340°C (645°F); and at least 95% of which, by volume, distill at a temperature of 370°C (700°F).” Group II - Specific gravity less than 0.85 crude [API° >35.0] Group III - Specific gravity between 0.85 and less than .95 [API° ≤35.0 and >17.5] Group IV - Specific gravity between 0.95 to and including 1.0 [API° ≤17.5 and >10.0]

Section 1: Vessel Background Information: Remediation of Underwater Legacy Environmental Threats (RULET)
10
The Diamond Knot is classified as High Risk because there was no report of fire at the time of casualty.
Data quality is high.
Risk Factor C2: Reported Oil on the Water This risk factor addresses reports of oil on the water at the time of the vessel casualty. The amount is
relative and based on the number of available reports of the casualty. Seldom are the reports from trained
observers so this is very subjective information. The risk categories are defined as:
Low Risk: Large amounts of oil reported on the water by multiple sources
Medium Risk: Moderate to little oil reported on the water during or after the sinking event
High Risk: No oil reported on the water
Unknown: It is not known whether or not there was oil on the water at the time of the casualty
The Diamond Knot is classified as High Risk because there is no known report of oil spreading across the
water as the vessel went down. Data quality is high.
Is the cargo area damaged? Risk Factor D1: Nature of the Casualty This risk factor addresses the means by which the vessel sank. The risk associated with each type of
casualty is determined by the how violent the sinking event was and the factors that would contribute to
increased initial damage or destruction of the vessel (which would lower the risk of oil, other cargo, or
munitions remaining on board). The risk categories are:
Low Risk: Multiple torpedo detonations, multiple mines, severe explosion
Medium Risk: Single torpedo, shellfire, single mine, rupture of hull, breaking in half, grounding
on rocky shoreline
High Risk: Foul weather, grounding on soft bottom, collision
Unknown: The cause of the loss of the vessel is not known
The Diamond Knot is classified as High Risk because it sank as a result of a collision. Data quality is
high.
Risk Factor D2: Structural Breakup This risk factor takes into account how many pieces the vessel broke into during the sinking event or
since sinking. This factor addresses how likely it is that multiple components of a ship were broken apart
including tanks, valves, and pipes. Experience has shown that even vessels broken in three large sections
can still have significant pollutants on board if the sections still have some structural integrity. The risk
categories are:
Low Risk: The vessel is broken into more than three pieces
Medium Risk: The vessel is broken into two-three pieces
High Risk: The vessel is not broken and remains as one contiguous piece
Unknown: It is currently not known whether or not the vessel broke apart at the time of loss or
after sinking
The Diamond Knot is classified as High Risk because it remains as one contiguous piece despite some
structural collapse. Data quality is high.

Section 1: Vessel Background Information: Remediation of Underwater Legacy Environmental Threats (RULET)
11
Factors That May Impact Potential Operations
Orientation (degrees) This factor addresses what may be known about the current orientation of the intact pieces of the wreck
(with emphasis on those pieces where tanks are located) on the seafloor. For example, if the vessel turtled,
not only may it have avoided demolition as a hazard to navigation, but it has a higher likelihood of
retaining an oil cargo in the non-vented and more structurally robust bottom of the hull.
The Diamond Knot is resting on its starboard side. Data quality is high.
Depth Depth information is provided where known. In many instances, depth will be an approximation based on
charted depths at the last known locations.
The Diamond Knot is 140 feet deep. Data quality is high.
Visual or Remote Sensing Confirmation of Site Condition This factor takes into account what the physical status of wreck site as confirmed by remote sensing or
other means such as ROV or diver observations and assesses its capability to retain a liquid cargo. This
assesses whether or not the vessel was confirmed as entirely demolished as a hazard to navigation, or
severely compromised by other means such as depth charges, aerial bombs, or structural collapse.
The location of the Diamond Knot is a popular dive site. Data quality is high.
Other Hazardous (Non-Oil) Cargo on Board This factor addresses hazardous cargo other than oil that may be on board the vessel and could potentially
be released, causing impacts to ecological and socio-economic resources at risk.
There are no reports of hazardous materials onboard. Data quality is high.
Munitions on Board This factor addresses hazardous cargo other than oil that may be on board the vessel and could potentially
be released or detonated causing impacts to ecological and socio-economic resources at risk.
The Diamond Knot did not carry any munitions. Data quality is high.
Vessel Pollution Potential Summary
Table 1-1 summarizes the risk factor scores for the pollution potential and mitigating factors that would
reduce the pollution potential for the Diamond Knot. Operational factors are listed but do not have a risk
score.

Section 1: Vessel Background Information: Remediation of Underwater Legacy Environmental Threats (RULET)
12
Table 1-1: Summary matrix for the vessel risk factors for the Diamond Knot color-coded as red (high risk), yellow (medium risk), and green (low risk).
Vessel Risk Factors Data
Quality Score
Comments Risk
Score
Pollution Potential Factors
A1: Oil Volume (total bbl) Medium Maximum of 6,516 bbl, not reported to be leaking
Med
A2: Oil Type High Bunker oil is diesel, a Group II oil type
B: Wreck Clearance High Vessel not reported as cleared
C1: Burning of the Ship High No fire was reported
C2: Oil on Water High No oil was reported on the water
D1: Nature of Casualty High Sank as a result of a collision
D2: Structural Breakup High Vessel remains as one contiguous piece
Archaeological Assessment
Archaeological Assessment High Detailed sinking records and site reports of this ship exist, assessment is believed to be very accurate
Not Scored
Operational Factors
Wreck Orientation High Resting on its starboard side
Not Ranked
Depth High 140 feet
Visual or Remote Sensing Confirmation of Site Condition
High Location is a popular dive site
Other Hazardous Materials Onboard
High No
Munitions Onboard High No
Gravesite (Civilian/Military) High No
Historical Protection Eligibility (NHPA/SMCA)
High NHPA

Section 2: Environmental Impact Modeling
13
SECTION 2: ENVIRONMENTAL IMPACT MODELING
To help evaluate the potential transport and fates of releases from sunken wrecks, NOAA worked with
RPS ASA to run a series of generalized computer model simulations of potential oil releases. The results
are used to assess potential impacts to ecological and socio-economic resources, as described in Sections
3 and 4. The modeling results are useful for this screening-level risk assessment; however, it should be
noted that detailed site/vessel/and seasonally specific modeling would need to be conducted prior to any
intervention on a specific wreck.
Release Scenarios Used in the Modeling
The potential volume of leakage at any point in time will tend to follow a probability distribution. Most of
the discharges would tend to be relatively small, though there could be multiple such discharges. There is
a lower probability of larger discharges, though these scenarios would cause the greatest damage. A
Worst Case Discharge (WCD) would involve the release of all of the cargo oil and bunkers present on
the vessel. In the case of the Diamond Knot this would be about 7,000 bbl (rounded up from 6,516 bbl)
based on estimates of the maximum amount of oil remaining onboard the wreck.
The likeliest scenario of oil release from most sunken wrecks, including the Diamond Knot, is a small,
episodic release that may be precipitated by disturbance of the vessel in storms. Each of these episodic
releases may cause impacts and require a response. Episodic releases are modeled using 1% of the WCD.
Another scenario is a very low chronic release, i.e., a relatively regular release of small amounts of oil
that causes continuous oiling and impacts over the course of a long period of time. This type of release
would likely be precipitated by corrosion of piping that allows oil to flow or bubble out at a slow, steady
rate. Chronic releases are modeled using 0.1% of the WCD.
The Most Probable scenario is premised on the release of all the oil from one tank. In the absence of
information on the number and condition of the cargo or fuel tanks for all the wrecks being assessed, this
scenario is modeled using 10% of the WCD. The Large scenario is loss of 50% of the WCD. The five
major types of releases are summarized in Table 2-1. The actual type of release that occurs will depend on
the condition of the vessel, time factors, and disturbances to the wreck. Note that, the episodic and
chronic release scenarios represent a small release that is repeated many times, potentially repeating the
same magnitude and type of impact(s) with each release. The actual impacts would depend on the
environmental factors such as real-time and forecast winds and currents during each release and the
types/quantities of ecological and socio-economic resources present.
The model results here are based on running the RPS ASA Spill Impact Model Application Package
(SIMAP) two hundred times for each of the five spill volumes shown in Table 2-1. The model randomly
selects the date of the release, and corresponding environmental, wind, and ocean current information
from a long-term wind and current database.
When a spill occurs, the trajectory, fate, and effects of the oil will depend on environmental variables,
such as the wind and current directions over the course of the oil release, as well as seasonal effects. The
magnitude and nature of potential impacts to resources will also generally have a strong seasonal
component (e.g., timing of bird migrations, turtle nesting periods, fishing seasons, and tourism seasons).

Section 2: Environmental Impact Modeling
14
Table 2-1: Potential oil release scenario types for the Diamond Knot.
Scenario Type Release per
Episode Time Period Release Rate
Relative Likelihood
Response Tier
Chronic (0.1% of WCD)
7 bbl Fairly regular intervals or constant
100 bbl over several days
More likely Tier 1
Episodic (1% of WCD)
70 bbl Irregular intervals Over several hours or days
Most Probable Tier 1-2
Most Probable (10% of WCD)
700 bbl One-time release Over several hours or days
Most Probable Tier 2
Large (50% of WCD)
3,500 bbl One-time release Over several hours or days
Less likely Tier 2-3
Worst Case 7,000 bbl One-time release Over several hours or days
Least likely Tier 3
The modeling results represent 200 simulations for each spill volume with variations in spill trajectory
based on winds and currents. The spectrum of the simulations gives a perspective on the variations in
likely impact scenarios. Some resources will be impacted in nearly all cases; some resources may not be
impacted unless the spill trajectory happens to go in that direction based on winds and currents at the time
of the release and in its aftermath.
For the large and WCD scenarios, the duration of the release was assumed to be 12 hours, envisioning a
storm scenario where the wreck is damaged or broken up, and the model simulations were run for a
period of 30 days. The releases were assumed to be from a depth between 2-3 meters above the sea floor,
using the information known about the wreck location and depth. It is important to acknowledge that
these scenarios are only for this screening-level assessment. Detailed site/vessel/and seasonally specific
modeling would need to be conducted prior to any intervention on a specific wreck.
Oil Type for Release
The Diamond Knot contained a maximum of 6,516 bbl of marine diesel (a Group II oil) as fuel oil. Thus,
the oil spill model was run using light fuel oil.
Oil Thickness Thresholds
The model results are reported for different oil thickness thresholds, based on the amount of oil on the
water surface or shoreline and the resources potentially at risk. Table 2-2 shows the terminology and
thicknesses used in this report, for both oil thickness on water and the shoreline. For oil on the water
surface, a thickness of 0.01 g/m2, which would appear as a barely visible sheen, was used as the threshold
for socio-economic impacts because often fishing is prohibited in areas with any visible oil, to prevent
contamination of fishing gear and catch. A thickness of 10 g/m2 was used as the threshold for ecological
impacts, primarily due to impacts to birds, because that amount of oil has been observed to be enough to
mortally impact birds and other wildlife. In reality, it is very unlikely that oil would be evenly distributed
on the water surface. Spilled oil is always distributed patchily on the water surface in bands or tarballs
with clean water in between. So, Table 2-2a shows the number of tarballs per acre on the water surface
for these oil thickness thresholds, assuming that each tarball was a sphere that was 1 inch in diameter.

Section 2: Environmental Impact Modeling
15
For oil stranded onshore, a thickness of 1 g/m2 was used as the threshold for socio-economic impacts
because that amount of oil would conservatively trigger the need for shoreline cleanup on amenity
beaches. A thickness of 100 g/m2 was used as the threshold for ecological impacts based on a synthesis of
the literature showing that shoreline life has been affected by this degree of oiling.2 Because oil often
strands onshore as tarballs, Table 2-2b shows the number of tarballs per m2 on the shoreline for these oil
thickness thresholds, assuming that each tarball was a sphere that was 1 inch in diameter.
Table 2-2a: Oil thickness thresholds used in calculating area of water impacted. Refer to Sections 3 and 4 for explanations of the thresholds for ecological and socio-economic resource impacts.
Oil Description Sheen
Appearance Approximate Sheen
Thickness No. of 1 inch
Tarballs Threshold/Risk Factor
Oil Sheen Barely Visible 0.00001 mm 0.01 g/m2
~5-6 tarballs per acre
Socio-economic Impacts to Water Surface/Risk Factor 4B-1 and 2
Heavy Oil Sheen Dark Colors 0.01 mm 10 g/m2 ~5,000-6,000 tarballs per acre
Ecological Impacts to Water Surface/ Risk Factor 3B-1 and 2
Table 2-2b: Oil thickness thresholds used in calculating miles of shoreline impacted. Refer to Sections 3 and 4 for explanations of the thresholds for ecological and socio-economic resource impacts.
Oil Description Oil
Appearance Approximate Sheen
Thickness No. of 1 inch
Tarballs Threshold/Risk Factor
Oil Sheen/Tarballs Dull Colors 0.001 mm 1 g/m2 ~0.12-0.14 tarballs/m2
Socio-economic Impacts to Shoreline Users/Risk Factor 4C-1 and 2
Oil Slick/Tarballs Brown to Black 0.1 mm 100 g/m2 ~12-14 tarballs/m2 Ecological Impacts to Shoreline Habitats/Risk Factor 3C-1 and 2
Potential Impacts to the Water Column
Impacts to the water column from an oil release from the Diamond Knot will be determined by the
volume of leakage. Because oil from sunken vessels will be released at low pressures, the droplet sizes
will be large enough for the oil to float to the surface. Therefore, impacts to water column resources will
result from the natural dispersion of the floating oil slicks on the surface, which is limited to about the top
33 feet. The metric used for ranking impacts to the water column is the area of water surface in mi2 that
has been contaminated by 1 part per billion (ppb) oil to a depth of 33 feet. At 1 ppb, there are likely to be
impacts to sensitive organisms in the water column and potential tainting of seafood, so this concentration
is used as a screening threshold for both the ecological and socio-economic risk factors for water column
resource impacts. To assist planners in understanding the scale of potential impacts for different leakage
volumes, a regression curve was generated for the water column volume oiled using the five volume
scenarios, which is shown in Figure 2-1. Using this figure, the water column impacts can be estimated for
any spill volume.
2 French, D., M. Reed, K. Jayko, S. Feng, H. Rines, S. Pavignano, T. Isaji, S. Puckett, A. Keller, F. W. French III, D. Gifford, J. McCue, G. Brown, E. MacDonald, J. Quirk, S. Natzke, R. Bishop, M. Welsh, M. Phillips and B.S. Ingram, 1996. The CERCLA type A natural resource damage assessment model for coastal and marine environments (NRDAM/CME), Technical Documentation, Vol. I - V. Office of Environmental Policy and Compliance, U.S. Dept. of the Interior, Washington, DC.

Section 2: Environmental Impact Modeling
16
Figure 2-1: Regression curve for estimating the volume of water column at or above 1 ppb aromatics impacted as a
function of spill volume for the Diamond Knot.
Potential Water Surface Slick
The slick size from an oil release from the Diamond Knot is a function of the quantity released. The
estimated water surface coverage by a fresh slick (the total water surface area “swept” by oil over time)
for the various scenarios is shown in Table 2-3, as the mean result of the 200 model runs. Note that this is
an estimate of total water surface affected over a 30-day period. The slick will not be continuous but
rather be broken and patchy due to the subsurface release of the oil. Surface expression is likely to be in
the form of sheens and streamers.
Table 2-3: Estimated slick area swept on water for oil release scenarios from the Diamond Knot.
Scenario Type Oil Volume (bbl)
Estimated Slick Area Swept Mean of All Models
0.01 g/m2 10 g/m2
Chronic 7 61 mi2 24 mi2
Episodic 70 170 mi2 77 mi2
Most Probable 700 400 mi2 225 mi2
Large 3,500 990 mi2 480 mi2
Worst Case Discharge 7,000 1,600 mi2 700 mi2
The location, size, shape, and spread of the oil slick(s) from an oil release from the Diamond Knot will
depend on environmental conditions, including winds and currents, at the time of release and in its
aftermath. The areas potentially affected by oil slicks, given that we cannot predict when the spill might
occur and the range of possible wind and current conditions that might prevail after a release, are shown
in Figure 2-2 and Figure 2-3 using the Most Probable volume and the socio-economic and ecological
thresholds.
0
20
40
60
80
100
120
140
160
0 1,000 2,000 3,000 4,000 5,000 6,000 7,000 8,000
Are
a (s
q. m
i.)
of
the
Up
pe
r 3
3 F
ee
t o
f W
ate
r
Spill Volume (bbl)
Water Column Impact

Section 2: Environmental Impact Modeling
17
Figure 2-2: Probability of surface oil (exceeding 0.01 g/m2) from the Most Probable spill of 700 bbl of light fuel oil
from the Diamond Knot at the threshold for socio-economic resources at risk.
Figure 2-3: Probability of surface oil (exceeding 10 g/m2) from the Most Probable spill of 700 bbl of light fuel oil from
the Diamond Knot at the threshold for ecological resources at risk.

Section 2: Environmental Impact Modeling
18
The maximum potential cumulative area swept by oil slicks at some time after a Most Probable Discharge
is shown in Figure 2-4 as the timing of oil movements.
Figure 2-4: Water surface oiling from the Most Probable spill of 700 bbl of light fuel oil from the Diamond Knot shown
as the area over which the oil spreads at different time intervals.
The actual area affected by a release will be determined by the volume of leakage, whether it is from one
or more tanks at a time. To assist planners in understanding the scale of potential impacts for different
leakage volumes, a regression curve was generated for the water surface area oiled using the five volume
scenarios, which is shown in Figure 2-5. Using this figure, the area of water surface with a barely visible
sheen can be estimated for any spill volume.

Section 2: Environmental Impact Modeling
19
Figure 2-5: Regression curve for estimating the amount of water surface oiling as a function of spill volume for the
Diamond Knot, showing both the ecological threshold of 10 g/m2 and socio-economic threshold of 0.01 g/m2.
Potential Shoreline Impacts
Based on these modeling results, shorelines on both the U.S. and Canadian sides of the Strait of Juan de
Fuca, in Canada from Victoria to Sydney Island, the San Juan Islands, and from Anacortes to Dungeness
Spit are at risk. Figure 2-6 shows the probability of oil stranding on the shoreline at concentrations that
exceed the threshold of 1 g/m2, for the Most Probable release of 700 bbl. However, the specific areas that
would be oiled will depend on the currents and winds at the time of the oil release(s), as well as on the
amount of oil released. Figure 2-7 shows the single oil spill scenario that resulted in the maximum extent
of shoreline oiling for the Most Probable volume. Estimated miles of shoreline oiling above the threshold
of 1 g/m2 by scenario type are shown in Table 2-4.
Table 2-4a: Estimated shoreline oiling from leakage from the Diamond Knot. (U.S. and Canada)
Scenario Type Volume (bbl) Estimated Miles of Shoreline Oiling Above 1 g/m2
Rock/Gravel/Artificial Sand Wetland/Mudflat Total
Chronic 7 0 0 0 0
Episodic 70 0 0 0 0
Most Probable 700 2 0 0 2
Large 3,500 4 0 0 4
Worst Case Discharge 7,000 6 0 0 6
Table 2-4b: Estimated shoreline oiling from leakage from the Diamond Knot. (U.S. only)
Scenario Type Volume (bbl) Estimated Miles of Shoreline Oiling Above 1 g/m2
Rock/Gravel/Artificial Sand Wetland/Mudflat Total
Chronic 7 0 0 0 0
Episodic 70 0 0 0 0.3
Most Probable 700 2 0 0 2
Large 3,500 3 0 0 3
Worst Case Discharge 7,000 5 0 0 5
0
200
400
600
800
1,000
1,200
1,400
1,600
1,800
0 1,000 2,000 3,000 4,000 5,000 6,000 7,000 8,000
Are
a (s
q. m
i.)
Spill Volume (bbl)
Water Surface Area Oiled
0.01 g/m2 Threshold 10 g/m2 Threshold

Section 2: Environmental Impact Modeling
20
Figure 2-6: Probability of shoreline oiling (exceeding 1.0 g/m2) from the Most Probable Discharge of 700 bbl of light
fuel oil from the Diamond Knot.
Figure 2-7: The extent and degree of shoreline oiling from the single model run of the Most Probable Discharge of
700 bbl of light fuel oil from the Diamond Knot that resulted in the greatest shoreline oiling.

Section 2: Environmental Impact Modeling
21
The actual shore length affected by a release will be determined by the volume of leakage and
environmental conditions during an actual release. To assist planners in scaling the potential impact for
different leakage volumes, a regression curve was generated for the total shoreline length oiled using the
five volume scenarios, which is shown in Figure 2-8. Using this figure, the shore length oiled can be
estimated for any spill volume.
Figure 2-8: Regression curve for estimating the amount of shoreline oiling at different thresholds as a function of spill
volume for the Diamond Knot.
The worst case scenario for shoreline exposure along the potentially impacted area for the WCD volume
(Table 2-5) and the Most Probable volume (Table 2-6) consists of rocky shores and gravel beaches.
Table 2-5: Worst case scenario shoreline impact by habitat type and oil thickness for a leakage of 7,000 bbl from the Diamond Knot.
Shoreline/Habitat Type
Lighter Oiling
Oil Thickness <1 mm Oil Thickness >1 g/m2
Heavier Oiling
Oil Thickness >1 mm Oil Thickness >100 g/m2
Rocky and artificial shores/Gravel beaches 19 miles 17 miles
Sand beaches 1 mile 0 miles
Salt marshes and tidal flats 0 miles 0 miles
Table 2-6: Worst case scenario shoreline impact by habitat type and oil thickness for a leakage of 700 bbl from the Diamond Knot.
Shoreline/Habitat Type
Lighter Oiling
Oil Thickness <1 mm Oil Thickness >1 g/m2
Heavier Oiling
Oil Thickness >1 mm Oil Thickness >100 g/m2
Rocky and artificial shores/Gravel beaches 8 miles 5 miles
Sand beaches 0 miles 0 miles
Salt marshes and tidal flats 0 miles 0 miles
0
1
2
3
4
5
6
7
0 1,000 2,000 3,000 4,000 5,000 6,000 7,000 8,000
Len
gth
(m
i.)
Spill Volume (bbl)
Shoreline Oiling
1 g/m2 Threshold 100 g/m2 Threshold

Section 3: Ecological Resources at Risk
22
SECTION 3: ECOLOGICAL RESOURCES AT RISK
Ecological resources at risk from a catastrophic release of oil from the Diamond Knot (Table 3-1) include
numerous guilds of birds, particularly those sensitive to surface oiling while rafting or plunge diving to
feed and are present in nearshore/offshore waters. As can be noted in the table, large numbers of birds
winter in both coastal and offshore waters, and many of the beaches are very important shorebird habitat.
In addition, this region is important for commercially important fish and invertebrates. The Salish Sea is
the second largest estuary in the U.S. and is a hotspot for marine biodiversity.
Table 3-1: Ecological resources at risk from a release of oil from the Diamond Knot. (*FT = Federal threatened; FE = Federal endangered; ST = State threatened; SE = State endangered).
Species Group Species Subgroup and Geography Seasonal Presence
Seabirds Commonly found in the area: Ancient murrelet, pigeon guillemot, common murre, rhinoceros auklet, common loon, cormorant, Pacific loon, red-throated loon, western grebe, gulls, shorebirds, bufflehead, goldeneye, harlequin duck, long-tailed duck, scaup, scoter spp., waterfowl, great blue heron Productive waters of the Strait of Juan de Fuca support populations of foraging and nesting seabirds
Western half of the Strait has the highest density of marbled murrelets (FT) in Washington and possibly U.S.; nesting in forests along the Strait
River deltas support large foraging and roosting flocks of gulls (Heermann’s in late summer and Thayer’s in winter) and substantial winter flocks of black oystercatcher
Seabird nesting colonies present at Race Rocks, Sooke Bay Islets, Argyle Islets, Parkinson Cliff, San Simon Point, Freshwater Bay, Port Angeles, Dungeness Bay; alcids, cormorants and black oystercatchers are common colonial nesters
High abundance of great blue herons nesting at Freshwater Bay
Bald eagle nests common along the Strait
Port Angeles Harbor: Thousands of gulls, regularly >100 great blue heron, largest wintering concentrations of Barrow’s and common goldeneyes, and harlequin ducks on northern Olympic Peninsula
Dungeness Bay
Sandflats and mudflats are foraging area for 10,000s of shorebirds, gulls and waterfowl migrating and wintering
Brant, diving ducks, seabirds, loons, grebes, and diving birds forage in eelgrass beds
Deception Pass
Large numbers of common and Pacific loon, cormorants, grebes, mergansers and alcids foraging in the winter
Large numbers of red-throated loons from Nov-Apr, peak Dec-Feb
Black oystercatcher present in winter, nesting on at least 1 island in summer
Greater than 300 pigeon guillemots mate and nest on cliffs
Chain Islets and Great Chain Islet
Largest colony of glaucous-winged gulls in British Columbia
Up to 2,000 Brandt’s cormorants (>2% of the world population); pelagic cormorants also present in low abundance
Bufflehead: Nov-Apr Ancient murrelet: Nov-Apr Murre: Aug-Mar Loons: Sep-May Grebe: Oct-Apr Scoters: Aug-May Waterfowl: Sep-Jun Rhinoceros auklet: Mar-Sep Pigeon guillemot present year round, nests Jul-Aug Shorebirds most common spring/fall Nesting Gulls:May-Sep Harlequin ducks: Apr-Aug Great blue herons: Feb-Jul

Section 3: Ecological Resources at Risk
23
Species Group Species Subgroup and Geography Seasonal Presence
Other nesting species include double-crested cormorants (100s), pigeon guillemots and black oystercatchers
Harlequin ducks found seasonally
Marine Mammals Harbor seal haul-outs and rookeries are common throughout the area
High densities (counts >500) recorded at Smith and Minor Island
Areas with large aggregations (counts >100) recorded: Colville Island, Goose Island, Race Rocks, Chain Isles, Trial Islands, D’Arcy Island
Elephant seals can be found at Dungeness Spit and on Smith/Minor Islands. Some pupping has been observed but not in high numbers
Trial Island and Race Rocks are haul-outs for California (common) and Steller sea lions (less common) Sea otters are rare in Juan de Fuca Strait; normal range is west from Pillar Point
Harbor seals pup May-Aug, molt Aug-Oct Steller sea lions more common in winter California sea lions present Sep-May Otters present year round
Cetaceans Common: Gray whale, killer whale (FE), minke whale, harbor porpoise, Dall’s porpoise all commonly occur in interior waters
Interior Washington waters are critical habitat for killer whales
Southern resident population of killer whales (87 animals) common in inland waters (especially Haro Strait); disperse to coastal ocean during the winter
Inland WA harbor porpoise population estimate is 10,682
Minke whales present spring-fall Gray whales present Feb-Dec, calves present in spring Harbor porpoises present year round, calve Jun-Aug
Fish and Invertebrates
Anadromous
Chinook salmon (FT), coho salmon (FE), steelhead (FT), bull trout (FT), chum salmon, pink salmon, sockeye salmon, coastal cutthroat trout and green sturgeon (FT) populations spawn in coastal rivers
Elwha River is critical habitat for eulachon (FT)
Southern shore of Juan de Fuca strait is green sturgeon critical habitat
San Juan Islands are critical habitat for Chinook salmon
Juveniles and adults forage in estuarine and coastal environments
Adults forage in ocean waters prior to upstream migration Beach spawning fish
Surf smelt spawn in the upper intertidal zone of coarse sand/gravel beaches; eggs adhere to the substrate; spawning beaches are found along the south shore of Juan de Fuca Strait and on Guss Island
Sand lance spawn on Whidbey Island, Mackaye Harbor, Dungeness Harbor Intertidal fish and invertebrates
Rocky intertidal areas are habitat for tidepool sculpin, wolf eel, juvenile lingcod and greenling, gunnels, eelpouts, pricklebacks, cockcombs, and warbonnets
Beaches along the Strait of Juan de Fuca have high abundance and diversity of clams and other invertebrates, including Pacific oysters
Nearshore subtidal
Dungeness crab move nearshore to spawn near sand beaches
Pacific geoducks common in subtidal sandy beach areas
Pinto abalone present in nearshore subtidal habitats
Pacific herring spawn adhesive eggs on nearshore seagrass and algae in Dungeness Bay, Westcott Bay, Sooke Harbor and Esquimalt Lagoon; adult form aggregations in nearshore waters prior to spawning
Demersal
Cutthroat trout spawn winter-May Juvenile salmon migrate to coastal waters in spring but are present year round Chum adults present in coastal waters Jul-Oct Smelt spawn year round Herring spawn Jan-Apr Oysters spawn in the summer Rockfish and halibut spawn in deeper waters in winter/spring

Section 3: Ecological Resources at Risk
24
Species Group Species Subgroup and Geography Seasonal Presence
Many species of rockfish, including boccacio (FE), canary rockfish (FT) and yelloweye rockfish (FT) are found in the area and can be associated with rocky reef habitats and kelp beds
Larval stages of these animals use epipelagic waters and juveniles recruit to structurally complex nearshore habitats
Bottom features support productive halibut habitat in the Strait of Juan de Fuca
Benthic Habitats Extensive coastal eelgrass beds are present from Dungeness point west, along the southern shore of San Juan Islands, Oak Bay Islands and in Sooke Harbor
Dungeness Bay has one of the largest eelgrass beds in the western U.S. Large kelp beds are present along the southern and northern shore of Strait of Juan de Fuca and the shoreline around Victoria Other species of kelp and turf grass common in intertidal areas
Kelp canopy is fullest Mar-Nov
The Environmental Sensitivity Index (ESI) atlases for the potentially impacted coastal areas from a leak
from the Diamond Knot are generally available at each U.S. Coast Guard Sector. They can also be
downloaded at: http://response.restoration.noaa.gov/esi. These maps show detailed spatial information on
the distribution of sensitive shoreline habitats, biological resources, and human-use resources. The tables
on the back of the maps provide more detailed life-history information for each species and location. The
ESI atlases should be consulted to assess the potential environmental resources at risk for specific spill
scenarios. In addition, the Geographic Response Plans within the Area Contingency Plans prepared by the
Area Committee for each U.S. Coast Guard Sector have detailed information on the nearshore and
shoreline ecological resources at risk and should be consulted.
Ecological Risk Factors
Risk Factor 3: Impacts to Ecological Resources at Risk (EcoRAR)
Ecological resources include plants and animals (e.g., fish, birds, invertebrates, and mammals), as well as
the habitats in which they live. All impact factors are based on both the Worst Case and the Most
Probable Discharge oil release from the wreck. Risk factors for ecological resources at risk (EcoRAR) are
divided into three categories:
Impacts to the water column and resources in the water column;
Impacts to the water surface and resources on the water surface; and
Impacts to the shoreline and resources on the shoreline.
The impacts from an oil release from the wreck would depend greatly on the direction in which the oil
slick moves, which would, in turn, depend on wind direction and currents at the time of and after the oil
release. Impacts are characterized in the risk analysis based on the likelihood of any measurable impact,
as well as the degree of impact that would be expected if there is an impact. The measure of the degree of
impact is based on the median case for which there is at least some impact. The median case is the
“middle case” – half of the cases with significant impacts have less impact than this case, and half have
more.

Section 3: Ecological Resources at Risk
25
For each of the three ecological resources at risk categories, risk is defined as:
The probability of oiling over a certain threshold (i.e., the likelihood that there will be an impact
to ecological resources over a certain minimal amount); and
The degree of oiling (the magnitude or amount of that impact).
As a reminder, the ecological impact thresholds are: 1 ppb aromatics for water column impacts; 10 g/m2
for water surface impacts; and 100 g/m2 for shoreline impacts.
In the following sections, the definition of low, medium, and high for each ecological risk factor is
provided. Also, the classification for the Diamond Knot is provided, both as text and as shading of the
applicable degree of risk bullet, for the WCD release of 7,000 bbl and a border around the bullet for the
risk for the Most Probable Discharge of 700 bbl.
Risk Factor 3A: Water Column Impacts to EcoRAR
Water column impacts occur beneath the water surface. The ecological resources at risk for water column
impacts are fish, marine mammals, and invertebrates (e.g., shellfish, and small organisms that are food for
larger organisms in the food chain). These organisms can be affected by toxic components in the oil. The
threshold for water column impact to ecological resources at risk is a dissolved aromatic hydrocarbons
concentration of 1 ppb (i.e., 1 part total dissolved aromatics per one billion parts water). Dissolved
aromatic hydrocarbons are the most toxic part of the oil. At this concentration and above, one would
expect impacts to organisms in the water column.
Risk Factor 3A-1: Water Column Probability of Oiling of EcoRAR
This risk factor reflects the probability that at least 0.2 mi2 of the upper 33 feet of the water column would
be contaminated with a high enough concentration of oil to cause ecological impacts. The three risk
scores for water column oiling probability are:
Low Oiling Probability: Probability = <10%
Medium Oiling Probability: Probability = 10 – 50%
High Oiling Probability: Probability > 50%
Risk Factor 3A-2: Water Column Degree of Oiling of EcoRAR
The degree of oiling of the water column reflects the total volume of water that would be contaminated by
oil at a concentration high enough to cause impacts. The three categories of impact are:
Low Impact: impact on less than 0.2 mi2 of the upper 33 feet of the water column at the
threshold level
Medium Impact: impact on 0.2 to 200 mi2 of the upper 33 feet of the water column at the
threshold level
High Impact: impact on more than 200 mi2 of the upper 33 feet of the water column at the
threshold level
The Diamond Knot is classified as High Risk for oiling probability for water column ecological resources
for the WCD of 7,000 bbl because 100% of the model runs resulted in contamination of more than 0.2 mi2
of the upper 33 feet of the water column above the threshold of 1 ppb aromatics. It is classified as

Section 3: Ecological Resources at Risk
26
Medium Risk for degree of oiling because the mean volume of water contaminated was 130 mi2 of the
upper 33 feet of the water column. For the Most Probable Discharge of 700 bbl, the Diamond Knot is
classified as High Risk for oiling probability for water column ecological resources because 86% of the
model runs resulted in contamination of more than 0.2 mi2 of the upper 33 feet of the water column above
the threshold of 1 ppb aromatics. It is classified as Medium Risk for degree of oiling because the mean
volume of water contaminated was 17 mi2 of the upper 33 feet of the water column.
Risk Factor 3B: Water Surface Impacts to EcoRAR
Ecological resources at risk at the water surface include surface feeding and diving sea birds, sea turtles,
and marine mammals. These organisms can be affected by the toxicity of the oil as well as from coating
with oil. The threshold for water surface oiling impact to ecological resources at risk is 10 g/m2 (10 grams
of floating oil per square meter of water surface). At this concentration and above, one would expect
impacts to birds and other animals that spend time on the water surface.
Risk Factor 3B-1: Water Surface Probability of Oiling of EcoRAR
This risk factor reflects the probability that at least 1,000 mi2 of the water surface would be affected by
enough oil to cause impacts to ecological resources. The three risk scores for oiling are:
Low Oiling Probability: Probability = <10%
Medium Oiling Probability: Probability = 10 – 50%
High Oiling Probability: Probability > 50%
Risk Factor 3B-2: Water Surface Degree of Oiling of EcoRAR
The degree of oiling of the water surface reflects the total amount of oil that would affect the water
surface in the event of a discharge from the vessel. The three categories of impact are:
Low Impact: less than 1,000 mi2 of water surface impact at the threshold level
Medium Impact: 1,000 to 10,000 mi2 of water surface impact at the threshold level
High Impact: more than 10,000 mi2 of water surface impact at the threshold level
The Diamond Knot is classified as Medium Risk for oiling probability for water surface ecological
resources for the WCD because 29% of the model runs resulted in at least 1,000 mi2 of the water surface
affected above the threshold of 10 g/m2. It is Low Risk for degree of oiling because the mean area of
water contaminated was 700 mi2. The Diamond Knot is classified as Low Risk for oiling probability for
water surface ecological resources for the Most Probable Discharge because 0% of the model runs
resulted in at least 1,000 mi2 of the water surface affected above the threshold of 10 g/m
2. It is classified
as Low Risk for degree of oiling because the mean area of water contaminated was 225 mi2.
Risk Factor 3C: Shoreline Impacts to EcoRAR
The impacts to different types of shorelines vary based on their type and the organisms that live on them.
In this risk analysis, shorelines have been weighted by their degree of sensitivity to oiling. Wetlands are
the most sensitive (weighted as “3” in the impact modeling), rocky and gravel shores are moderately
sensitive (weighted as “2”), and sand beaches (weighted as “1”) are the least sensitive to ecological
impacts of oil.
Section 3: Ecological Resources at Risk
27
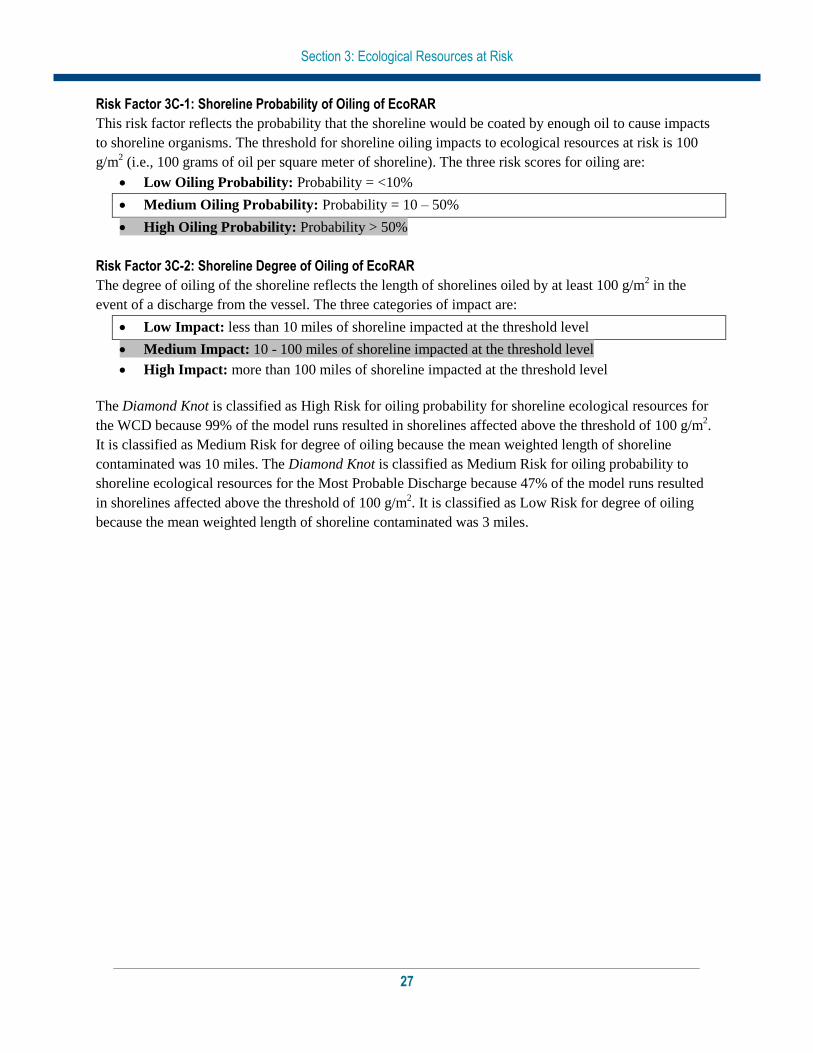
Risk Factor 3C-1: Shoreline Probability of Oiling of EcoRAR
This risk factor reflects the probability that the shoreline would be coated by enough oil to cause impacts
to shoreline organisms. The threshold for shoreline oiling impacts to ecological resources at risk is 100
g/m2 (i.e., 100 grams of oil per square meter of shoreline). The three risk scores for oiling are:
Low Oiling Probability: Probability = <10%
Medium Oiling Probability: Probability = 10 – 50%
High Oiling Probability: Probability > 50%
Risk Factor 3C-2: Shoreline Degree of Oiling of EcoRAR
The degree of oiling of the shoreline reflects the length of shorelines oiled by at least 100 g/m2 in the
event of a discharge from the vessel. The three categories of impact are:
Low Impact: less than 10 miles of shoreline impacted at the threshold level
Medium Impact: 10 - 100 miles of shoreline impacted at the threshold level
High Impact: more than 100 miles of shoreline impacted at the threshold level
The Diamond Knot is classified as High Risk for oiling probability for shoreline ecological resources for
the WCD because 99% of the model runs resulted in shorelines affected above the threshold of 100 g/m2.
It is classified as Medium Risk for degree of oiling because the mean weighted length of shoreline
contaminated was 10 miles. The Diamond Knot is classified as Medium Risk for oiling probability to
shoreline ecological resources for the Most Probable Discharge because 47% of the model runs resulted
in shorelines affected above the threshold of 100 g/m2. It is classified as Low Risk for degree of oiling
because the mean weighted length of shoreline contaminated was 3 miles.

Section 3: Ecological Resources at Risk
28
Considering the modeled risk scores and the ecological resources at risk, the ecological risk from
potential releases of the WCD of 7,000 bbl of light fuel oil from the Diamond Knot is summarized as
listed below and indicated in the far-right column in Table 3-2:
Water column resources – Medium, because of the importance of shallow, nearshore habitats as
rearing and spawning habitat for listed and commercial species
Water surface resources – Medium, because of the very large number of wintering, nesting, and
migratory birds present and at risk from even light sheens
Shoreline resources – Low, because mostly exposed rocky shores and gravel beaches are at risk,
where light oil do not persist
Table 3-2: Ecological risk factor scores for the Worst Case Discharge of 7,000 bbl of light fuel oil from the Diamond Knot.
Risk Factor Risk Score Explanation of Risk Score Final Score
3A-1: Water Column Probability EcoRAR Oiling
Low Medium High 100% of the model runs resulted in at least 0.2 mi2 of the upper 33 feet of the water column contaminated above 1
ppb aromatics Med 3A-2: Water Column Degree EcoRAR Oiling
Low Medium High The mean volume of water contaminated above 1 ppb was 130 mi2 of the upper 33 feet of the water column
3B-1: Water Surface Probability EcoRAR Oiling
Low Medium High 29% of the model runs resulted in at least 1,000 mi2of
water surface covered by at least 10 g/m2 Med
3B-2: Water Surface Degree EcoRAR Oiling
Low Medium High The mean area of water contaminated above 10 g/m2
was 700 mi2
3C-1: Shoreline Probability EcoRAR Oiling
Low Medium High 99% of the model runs resulted in shoreline oiling of 100
g/m2 Low
3C-2: Shoreline Degree EcoRAR Oiling
Low Medium High The length of shoreline contaminated by at least 100
g/m2 was 10 mi

Section 3: Ecological Resources at Risk
29
Considering the modeled risk scores and the ecological resources at risk, the ecological risk from
potential releases of the WCD of 700 bbl of light fuel oil from the Diamond Knot is summarized as listed
below and indicated in the far-right column in Table 3-3:
Water column resources – Medium, because of the importance of shallow, nearshore habitats as
rearing and spawning habitat for listed and commercial species
Water surface resources – Low, because of the relatively small area and short persistence of
sheens from light fuel oils
Shoreline resources – Low, because of the small amount of shoreline impact on mostly exposed
rocky shores and gravel beaches are at risk, where light oils do not persist
Table 3-3: Ecological risk factor scores for the Most Probable Discharge of 700 bbl of light fuel oil from the Diamond Knot.
Risk Factor Risk Score Explanation of Risk Score Final Score
3A-1: Water Column Probability EcoRAR Oiling
Low Medium High 86% of the model runs resulted in at least 0.2 mi2 of the upper 33 feet of the water column contaminated above 1
ppb aromatics Med
3A-2: Water Column Degree EcoRAR Oiling
Low Medium High The mean volume of water contaminated above 1 ppb was 17 mi2 of the upper 33 feet of the water column
3B-1: Water Surface Probability EcoRAR Oiling
Low Medium High 0% of the model runs resulted in at least 1,000 mi2of
water surface covered by at least 10 g/m2 Low
3B-2: Water Surface Degree EcoRAR Oiling
Low Medium High The mean area of water contaminated above 10 g/m2
was 225 mi2
3C-1: Shoreline Probability EcoRAR Oiling
Low Medium High 47% of the model runs resulted in shoreline oiling of 100
g/m2 Low
3C-2: Shoreline Degree EcoRAR Oiling
Low Medium High The length of shoreline contaminated by at least 100
g/m2 was 3 mi

Section 4: Socio-Economic Resources at Risk
30
SECTION 4: SOCIO-ECONOMIC RESOURCES AT RISK
In addition to natural resource impacts, spills from sunken wrecks have the potential to cause significant
social and economic impacts. Socio-economic resources potentially at risk from oiling are listed in Table
4-1 and shown in Figures 4-1 and 4-2. The potential economic impacts include disruption of coastal
economic activities such as commercial and recreational fishing, boating, vacationing, commercial
shipping, and other activities that may become claims following a spill.
Socio-economic resources in the areas potentially affected by a release from the Diamond Knot include
very highly utilized recreational beaches in the Puget Sound of Washington. The area has significant
coastlines devoted to state beaches and parks to preserve the natural beauty of the coast. Many areas along
the entire potential spill zone are widely popular seaside resorts and support recreational activities such as
boating, diving, sightseeing, sailing, fishing, and wildlife viewing.
A release could impact shipping lanes that accommodate important ports in the Puget Sound and
Columbia River, as well as along the Pacific coasts of Washington and Oregon. There are over 3,100
vessel port calls annually with over 210 million tonnage. Commercial fishing is economically important
to the region. Regional commercial landings for 2010 exceeded $121M. Tribal nations in the area also
conduct a significant amount of subsistence fishing in these waters. There are six Tribal Nations with total
populations of over 19,000 that are present in the area of potential impact.
In addition to the ESI atlases, the Geographic Response Plans within the Area Contingency Plans
prepared by the Area Committee for each U.S. Coast Guard Sector have detailed information on
important socio-economic resources at risk.
Spill response costs for a release of oil from the Diamond Knot would be dependent on volume of oil
released and specific areas impacted. The specific shoreline impacts and spread of the oil would
determine the response required and the costs for that response.
Table 4-1: Socio-economic resources at risk from a release of oil from the Diamond Knot.
Resource Type Resource Name Economic Activities
Beach Communities Clallam Bay Coupeville Dungeness Friday Harbor Gardiner Greenbank Lopez Oak Harbor Port Angeles Port Angeles Port Hadlock Port Stanley Port Townsend Similk Beach
Potentially affected beach resorts and beach-front communities in Washington provide recreational activities (e.g., swimming, boating, recreational fishing, wildlife viewing, nature study, sports, dining, camping, and amusement parks) with substantial income for local communities and state tax income. Many of these recreational activities are limited to or concentrated into the late spring through the early fall months.

Section 4: Socio-Economic Resources at Risk
31
Resource Type Resource Name Economic Activities
National Parks Olympic National Park National parks provide recreation for local and tourist populations while preserving and protecting the nation’s natural shoreline treasures.
National Wildlife Refuges
Dungeness NWR Protection Island NWR San Juan Islands NWR
National wildlife refuges in Washington may be impacted. These federally managed and protected lands provide refuges and conservation areas for sensitive species and habitats.
State Parks Deception Pass State Park Fort Casey State Park Fort Ebey State Park Fort Townsend State Park Fort Worden State Park James Island State Park Jones Island State Park Joseph Whidbey State Park Limekiln State Park Mystery Bay State Park Posey Island State Park Sequim Bay State Park South Whidbey State Park Spencer Spit State Park Stuart Island State Park
Coastal state parks are significant recreational resources for the public (e.g., swimming, boating, recreational fishing, wildlife viewing, nature study, sports, dining, camping, and amusement parks). They provide income to the states. State parks in Washington are potentially impacted. Many of these recreational activities are limited to or concentrated into the late spring into early fall months.
Tribal Lands Lower Elwha Klallam Indian Reservation Lummi Indian Reservation Makah Indian Reservation Port Gamble Indian Reservation Swinomish Indian Reservation Tulalip Indian Reservation
The Puget Sound area of Washington includes six Tribal Reservations with over 19,000 members.
Commercial Fishing A number of fishing fleets use the surrounding waters for commercial fishing purposes.
Anacortes-LaConner Total Landings (2010): $13.6M
Bellingham Total Landings (2010): $26.9M
Blaine Total Landings (2010): $9.0M
Neah Bay Total Landings (2010): $7.7M
Olympia Total Landings (2010): $16.2M
Port Townsend Total Landings (2010): $4.1M
Seattle Total Landings (2010): $22.1M
Shelton Total Landings (2010): $17.6M
Tacoma Total Landings (2010): $3.8M
Ports There are a number of significant commercial ports in the Pacific Northwest that could potentially be impacted by spillage and spill response activities. The port call numbers below are for large vessels only. There are many more, smaller vessels (under 400 GRT) that also use these ports.
Anacortes, WA 11 port calls annually
Bellingham, WA 3 port calls annually
Bremerton, WA 3 port calls annually
Cherry Point, WA 271 port calls annually
Everett, WA 81 port calls annually
Ferndale, WA 101 port calls annually
Manchester, WA 14 port calls annually
March Point, WA 188 port calls annually
Olympia, WA 22 port calls annually
Point Wells, WA 14 port calls annually
Port Angeles, WA 325 port calls annually
Port Townsend, WA 1 port call annually

Section 4: Socio-Economic Resources at Risk
32
Resource Type Resource Name Economic Activities
Seattle, WA 1,046 port calls annually
Tacoma, WA 1,035 port calls annually
Westport, WA 13 port calls annually
Figure 4-1: Tribal lands, ports, and commercial fishing fleets at risk from a release from the Diamond Knot.

Section 4: Socio-Economic Resources at Risk
33
Figure 4-2: Beaches, coastal state parks, and Federal protected areas at risk from a release from the Diamond Knot.
Socio-Economic Risk Factors
Risk Factor 4: Impacts to Socio-economic Resources at Risk (SRAR)
Socio-economic resources at risk (SRAR) include potentially impacted resources that have some
economic value, including commercial and recreational fishing, tourist beaches, private property, etc. All
impact factors are evaluated for both the Worst Case and the Most Probable Discharge oil release from
the wreck. Risk factors for socio-economic resources at risk are divided into three categories:
Water Column: Impacts to the water column and to economic resources in the water column
(i.e., fish and invertebrates that have economic value);
Water Surface: Impacts to the water surface and resources on the water surface (i.e., boating and
commercial fishing); and
Shoreline: Impacts to the shoreline and resources on the shoreline (i.e., beaches, real property).
The impacts from an oil release from the wreck would depend greatly on the direction in which the oil
slick moves, which would, in turn, depend on wind direction and currents at the time of and after the oil
release. Impacts are characterized in the risk analysis based on the likelihood of any measurable impact,
as well as the degree of impact that would be expected if there were one. The measure of the degree of
impact is based on the median case for which there is at least some impact. The median case is the

Section 4: Socio-Economic Resources at Risk
34
“middle case” – half of the cases with significant impacts have less impact than this case, and half have
more.
For each of the three socio-economic resources at risk categories, risk is classified with regard to:
The probability of oiling over a certain threshold (i.e., the likelihood that there will be exposure
to socio-economic resources over a certain minimal amount known to cause impacts); and
The degree of oiling (the magnitude or amount of that exposure over the threshold known to
cause impacts).
As a reminder, the socio-economic impact thresholds are: 1 ppb aromatics for water column impacts; 0.01
g/m2 for water surface impacts; and 1 g/m
2 for shoreline impacts.
In the following sections, the definition of low, medium, and high for each socio-economic risk factor is
provided. Also, in the text classification for the Diamond Knot shading indicates the degree of risk for the
WCD release of 7,000 bbl and a border indicates degree of risk for the Most Probable Discharge of 700
bbl.
Risk Factor 4A-1: Water Column: Probability of Oiling of SRAR
This risk factor reflects the probability that at least 0.2 mi2 of the upper 33 feet of the water column would
be contaminated with a high enough concentration of oil to cause socio-economic impacts. The threshold
for water column impact to socio-economic resources at risk is an oil concentration of 1 ppb (i.e., 1 part
oil per one billion parts water). At this concentration and above, one would expect impacts and potential
tainting to socio-economic resources (e.g., fish and shellfish) in the water column; this concentration is
used as a screening threshold for both the ecological and socio-economic risk factors.
The three risk scores for oiling are:
Low Oiling Probability: Probability = <10%
Medium Oiling Probability: Probability = 10 – 50%
High Oiling Probability: Probability > 50%
Risk Factor 4A-2: Water Column Degree of Oiling of SRAR
The degree of oiling of the water column reflects the total amount of oil that would affect the water
column in the event of a discharge from the vessel. The three categories of impact are:
Low Impact: impact on less than 0.2 mi2 of the upper 33 feet of the water column at the
threshold level
Medium Impact: impact on 0.2 to 200 mi2 of the upper 33 feet of the water column at the
threshold level
High Impact: impact on more than 200 mi2 of the upper 33 feet of the water column at the
threshold level
The Diamond Knot is classified as High Risk for oiling probability and Medium Risk for degree of oiling
for water column socio-economic resources for the WCD of 7,000 bbl because 100% of the model runs
resulted in contamination of more than 0.2 mi2 of the upper 33 feet of the water column above the

Section 4: Socio-Economic Resources at Risk
35
threshold of 1 ppb aromatics, and the mean volume of water contaminated was 130 mi2 of the upper 33
feet of the water column. For the Most Probable Discharge of 700 bbl, the Diamond Knot is classified as
High Risk for oiling probability for water column socio-economic resources because 86% of the model
runs resulted in contamination of more than 0.2 mi2 of the upper 33 feet of the water column above the
threshold of 1 ppb aromatics. It is classified as Medium Risk for oil degree because the mean volume of
water contaminated was 17 mi2 of the upper 33 feet of the water column.
Risk Factor 4B-1: Water Surface Probability of Oiling of SRAR
This risk factor reflects the probability that at least 1,000 mi2 of the water surface would be affected by
enough oil to cause impacts to socio-economic resources. The three risk scores for oiling are:
Low Oiling Probability: Probability = <10%
Medium Oiling Probability: Probability = 10 – 50%
High Oiling Probability: Probability > 50%
The threshold level for water surface impacts to socio-economic resources at risk is 0.01 g/m2 (i.e., 0.01
grams of floating oil per square meter of water surface). At this concentration and above, one would
expect impacts to socio-economic resources on the water surface.
Risk Factor 4B-2: Water Surface Degree of Oiling of SRAR
The degree of oiling of the water surface reflects the total amount of oil that would affect the water
surface in the event of a discharge from the vessel. The three categories of impact are:
Low Impact: less than 1,000 mi2 of water surface impact at the threshold level
Medium Impact: 1,000 to 10,000 mi2 of water surface impact at the threshold level
High Impact: more than 10,000 mi2 of water surface impact at the threshold level
The Diamond Knot is classified as High Risk for oiling probability and Medium Risk for degree of oiling
for water surface socio-economic resources for the WCD because 62% of the model runs resulted in at
least 1,000 mi2 of the water surface affected above the threshold of 0.01 g/m
2, and the mean area of water
contaminated was 1,600 mi2. The Diamond Knot is classified as Low Risk for oiling probability for water
surface socio-economic resources for the Most Probable Discharge because 5% of the model runs resulted
in at least 1,000 mi2 of the water surface affected above the threshold of 0.01 g/m
2. It is classified as Low
Risk for degree of oiling because the mean area of water contaminated was 410 mi2.
Risk Factor 4C: Shoreline Impacts to SRAR
The impacts to different types of shorelines vary based on economic value. In this risk analysis, shorelines
have been weighted by their degree of sensitivity to oiling. Sand beaches are the most economically
valued shorelines (weighted as “3” in the impact analysis), rocky and gravel shores are moderately valued
(weighted as “2”), and wetlands are the least economically valued shorelines (weighted as “1”). Note that
these values differ from the ecological values of these three shoreline types.
Risk Factor 4C-1: Shoreline Probability of Oiling of SRAR
This risk factor reflects the probability that the shoreline would be coated by enough oil to cause impacts
to shoreline users. The threshold for impacts to shoreline SRAR is 1 g/m2 (i.e., 1 gram of oil per square

Section 4: Socio-Economic Resources at Risk
36
meter of shoreline). The three risk scores for oiling are:
Low Oiling Probability: Probability = <10%
Medium Oiling Probability: Probability = 10 – 50%
High Oiling Probability: Probability > 50%
Risk Factor 4C-2: Shoreline Degree of Oiling of SRAR
The degree of oiling of the shoreline reflects the total amount of oil that would affect the shoreline in the
event of a discharge from the vessel. The three categories of impact are:
Low Impact: less than 10 miles of shoreline impacted at threshold level
Medium Impact: 10 - 100 miles of shoreline impacted at threshold level
High Impact: more than 100 miles of shoreline impacted at threshold level
The Diamond Knot is classified as High Risk for oiling probability for shoreline socio-economic
resources for the WCD because 99% of the model runs resulted in shorelines affected above the threshold
of 1 g/m2. It is classified as Medium Risk for degree of oiling because the mean length of weighted
shoreline contaminated was 13 miles. The Diamond Knot is classified as High Risk for oiling probability
and Low Risk for degree of oiling for shoreline socio-economic resources for the Most Probable
Discharge as 56% of the model runs resulted in shorelines affected above the threshold of 1 g/m2, and the
mean length of weighted shoreline contaminated was 3 miles.

Section 4: Socio-Economic Resources at Risk
37
Considering the modeled risk scores and the socio-economic resources at risk, the socio-economic risk
from potential releases of the WCD of 7,000 bbl of light fuel oil from the Diamond Knot is summarized
as listed below and indicated in the far-right column in Table 4-2:
Water column resources – High, because there would be a significant impact on the water
column in important fishing grounds
Water surface resources – High, because although there would be a moderate area of impact on
the water surface in areas of shipping lanes, there are important subsistence fishing areas of tribal
nations that may be impacted. It should be noted that oil on the surface will not be continuous but
rather be broken and patchy and in the form of sheens and streamers
Shoreline resources – High, because although a moderate area of shoreline may be impacted it
has many high-value socio-economic resources
Table 4-2: Socio-economic risk factor ranks for the Worst Case Discharge of 7,000 bbl of light fuel oil from the Diamond Knot.
Risk Factor Risk Score Explanation of Risk Score Final Score
4A-1: Water Column Probability SRAR Oiling
Low Medium High 100% of the model runs resulted in at least 0.2 mi2 of the upper 33 feet of the water column contaminated above 1
ppb aromatics High
4A-2: Water Column Degree SRAR Oiling
Low Medium High The mean volume of water contaminated above 1 ppb was 130 mi2 of the upper 33 feet of the water column
4B-1: Water Surface Probability SRAR Oiling
Low Medium High 62% of the model runs resulted in at least 1,000 mi2 of
water surface covered by at least 0.01 g/m2 High
4B-2: Water Surface Degree SRAR Oiling
Low Medium High The mean area of water contaminated above 0.01 g/m2
was 1,600 mi2
4C-1: Shoreline Probability SRAR Oiling
Low Medium High 99% of the model runs resulted in shoreline oiling of 1
g/m2 High
4C-2: Shoreline Degree SRAR Oiling
Low Medium High The length of shoreline contaminated by at least 1 g/m2
was 13 mi

Section 4: Socio-Economic Resources at Risk
38
Considering the modeled risk scores and the socio-economic resources at risk, the socio-economic risk
from potential releases of the Most Probable Discharge of 700 bbl of light fuel oil from the Diamond
Knot is summarized as listed below and indicated in the far-right column in Table 4-3:
Water column resources – Medium, because there would be a moderate impact on the water
column in important fishing grounds
Water surface resources – High, because although there would be a moderate area of impact on
the water surface in areas of shipping lanes, there are important subsistence fishing areas of tribal
nations that may be impacted. It should be noted that oil on the surface will not be continuous but
rather be broken and patchy and in the form of sheens and streamers
Shoreline resources – Medium, because although a relatively small area of shoreline may be
impacted it has many high-value socio-economic resources
Table 4-3: Socio-economic risk factor ranks for the Most Probable Discharge of 700 bbl of light fuel oil from the Diamond Knot.
Risk Factor Risk Score Explanation of Risk Score Final Score
4A-1: Water Column Probability SRAR Oiling Low Medium High
86% of the model runs resulted in at least 0.2 mi2 of the upper 33 feet of the water column contaminated above 1
ppb aromatics Med
4A-2: Water Column Degree SRAR Oiling Low Medium High
The mean volume of water contaminated above 1 ppb was 17 mi2 of the upper 33 feet The mean volume of
water contaminated of the water column
4B-1: Water Surface Probability SRAR Oiling
Low Medium High 5% of the model runs resulted in at least 1,000 mi2 of
water surface covered by at least 0.01 g/m2 High
4B-2: Water Surface Degree SRAR Oiling
Low Medium High The mean area of water contaminated above 0.01g/m2
was 410 mi2
4C-1: Shoreline Probability SRAR Oiling
Low Medium High 56% of the model runs resulted in shoreline oiling of 1
g/m2 Med
4C-2: Shoreline Degree SRAR Oiling
Low Medium High The length of shoreline contaminated by at least 1 g/m2
was 3 mi

Section 5: Overall Risk Assessment and Recommendations for Assessment, Monitoring, or Remediation
39
SECTION 5: OVERALL RISK ASSESSMENT AND RECOMMENDATIONS
FOR ASSESSMENT, MONITORING, OR REMEDIATION
The overall risk assessment for the Diamond Knot is comprised of a compilation of several components
that reflect the best available knowledge about this particular site. Those components are reflected in the
previous sections of this document and are:
Vessel casualty information and how the site formation processes have worked on this vessel
Ecological resources at risk
Socio-economic resources at risk
Other complicating factors (war graves, other hazardous cargo, etc.)
Table 5-1 summarizes the screening-level risk assessment scores for the different risk factors, as
discussed in the previous sections. The ecological and socio-economic risk factors are presented as a
single score for water column, water surface, and shoreline resources as the scores were consolidated for
each element. For the ecological and socio-economic risk factors each has two components, probability
and degree. Of those two, degree is given more weight in deciding the combined score for an individual
factor, e.g., a high probability and medium degree score would result in a medium overall for that factor.
In order to make the scoring more uniform and replicable between wrecks, a value was assigned to each
of the 7 criteria. This assessment has a total of 7 criteria (based on table 5-1) with 3 possible scores for
each criteria (L, M, H). Each was assigned a point value of L=1, M=2, H=3. The total possible score is 21
points, and the minimum score is 7. The resulting category summaries are:
Low Priority 7-11
Medium Priority 12-14
High Priority 15-21
For the Worst Case Discharge, Diamond Knot scores High with 16 points; for the Most Probable
Discharge, Diamond Knot scores Medium with 13 points. Under the National Contingency Plan, the U.S.
Coast Guard and the Regional Response Team have the primary authority and responsibility to plan,
prepare for, and respond to oil spills in U.S. waters. Based on the technical review of available
information, NOAA proposes the following recommendations for the Diamond Knot. The final
determination of what type of action, if any, rests with the U.S. Coast Guard. Because it is such a popular
dive site, this may be an opportunity to engage local divers as citizen-scientists in monitoring of the wreck
for oil releases and changes in its condition.
Diamond Knot Possible NOAA Recommendations
✓ Wreck should be considered for further assessment to determine the vessel condition, amount of oil onboard, and feasibility of oil removal action
Use surveys of opportunity to attempt to locate this vessel and gather more information on the vessel condition
✓ Conduct active monitoring to look for releases or changes in rates of releases
✓ Be noted in the Area Contingency Plans so that if a mystery spill is reported in the general area, this vessel could be investigated as a source
✓ Conduct outreach efforts with the technical and recreational dive community as well as commercial and recreational fishermen who frequent the area, to gain awareness of changes in the site

Section 5: Overall Risk Assessment and Recommendations for Assessment, Monitoring, or Remediation
40
Table 5-1: Summary of risk factors for the Diamond Knot.
Vessel Risk Factors Data
Quality Score
Comments Risk
Score
Pollution Potential Factors
A1: Oil Volume (total bbl) Medium Maximum of 6,516 bbl, not reported to be leaking
Med
A2: Oil Type High Bunker oil is diesel, a Group II oil type
B: Wreck Clearance High Vessel not reported as cleared
C1: Burning of the Ship High No fire was reported
C2: Oil on Water High No oil was reported on the water
D1: Nature of Casualty High Sank as a result of a collision
D2: Structural Breakup High Vessel remains as one contiguous piece
Archaeological Assessment
Archaeological Assessment
High Detailed sinking records and site reports of this ship exist, assessment is believed to be very accurate
Not Scored
Operational Factors
Wreck Orientation High Resting on its starboard side
Not Scored
Depth High 140 feet
Visual or Remote Sensing Confirmation of Site Condition
High Location is a popular dive site
Other Hazardous Materials Onboard
High No
Munitions Onboard High No
Gravesite (Civilian/Military)
High No
WCD Most
Probable
Ecological Resources
3A: Water Column Resources
High Shallow, nearshore habitats are rearing and spawning habitat for listed and commercial species
Med Med
3B: Water Surface Resources
High Large numbers of birds are at risk from larger releases that are more persistent
Med Low
3C: Shore Resources High Limited shoreline impact from light fuel oils that do not persist on rocky shores and gravel beaches
Low Low
Socio-Economic Resources
4A: Water Column Resources
High Significant impact on the water column in important fishing grounds
High Med
4B: Water Surface Resources
High
Although there could be a moderate area of impact on the water surface in areas of shipping lanes, there are important subsistence fishing areas of tribal nations that may be impacted
High High
4C: Shore Resources High Although a moderate area of shoreline could be impacted, it has many high-value socio-economic resources
High Med
Summary Risk Scores 16 13