dial gauge
DESCRIPTION
this is an awesome dialgauge referenceTRANSCRIPT

400 Commonwealth Drive, Warrendale, PA 15096-0001 U.S.A. Tel: (724) 776-4841 Fax: (724) 776-5760
SAE TECHNICALPAPER SERIES 983054
Design of a Twist Fixture to Measure theTorsional Stiffness of a Winston Cup Chassis
Lonny L. Thompson, Jon K. Lampert and E. Harry LawDepartment of Mechanical Engineering, Clemson Univ.
Reprinted From: 1998 Motorsports Engineering Conference ProceedingsVolume 1: Vehicle Design and Safety
(P-340/1)
Motorsports EngineeringConference and Exposition
Dearborn, MichiganNovember 16-19, 1998
The appearance of this ISSN code at the bottom of this page indicates SAE’s consent that copies of thepaper may be made for personal or internal use of specific clients. This consent is given on the condition,however, that the copier pay a $7.00 per article copy fee through the Copyright Clearance Center, Inc.Operations Center, 222 Rosewood Drive, Danvers, MA 01923 for copying beyond that permitted by Sec-tions 107 or 108 of the U.S. Copyright Law. This consent does not extend to other kinds of copying such ascopying for general distribution, for advertising or promotional purposes, for creating new collective works,or for resale.
SAE routinely stocks printed papers for a period of three years following date of publication. Direct yourorders to SAE Customer Sales and Satisfaction Department.
Quantity reprint rates can be obtained from the Customer Sales and Satisfaction Department.
To request permission to reprint a technical paper or permission to use copyrighted SAE publications inother works, contact the SAE Publications Group.
No part of this publication may be reproduced in any form, in an electronic retrieval system or otherwise, without the prior writtenpermission of the publisher.
ISSN 0148-7191Copyright 1998 Society of Automotive Engineers, Inc.
Positions and opinions advanced in this paper are those of the author(s) and not necessarily those of SAE. The author is solelyresponsible for the content of the paper. A process is available by which discussions will be printed with the paper if it is published inSAE Transactions. For permission to publish this paper in full or in part, contact the SAE Publications Group.
Persons wishing to submit papers to be considered for presentation or publication through SAE should send the manuscript or a 300word abstract of a proposed manuscript to: Secretary, Engineering Meetings Board, SAE.
Printed in USA
All SAE papers, standards, and selectedbooks are abstracted and indexed in theGlobal Mobility Database
1
983054
Design of a Twist Fixture to Measure theTorsional Stiffness of a Winston Cup Chassis
Lonny L. Thompson, Jon K. Lampert and E. Harry LawDepartment of Mechanical Engineering, Clemson Univ.
Copyright © 1998 Society of Automotive Engineers, Inc.
ABSTRACT
The torsional stiffness of a vehicle’s chassis significantlyaffects its handling characteristics and is therefore animportant parameter to measure. In this work a new twistfixture apparatus designed to measure the torsional stiff-ness of a Winston Cup series race car chassis isdescribed. The twist fixture is relatively light weight,adjustable, and easily transportable by one person forquick set-up on different chassis. Measured values of tor-sional stiffness are reported for several different chassis.The fixture applies vertical displacements (using linear,jack-screw actuators) at the front spring perches of thechassis while holding the rear perches fixed. Conven-tional race car scales located under the front assemblymeasure the resulting reaction forces due to the displace-ments. Dial indicators are placed at selected locationsalong the chassis to measure deflections. Using the dialindicator readings, the measured reaction forces and thechassis geometry, the torsional stiffness of the chassiscan be calculated. Ball-joint connections between thetwist fixture and chassis have been carefully designed tominimize unwanted rotational restraints. A typical testinvolves twisting the chassis in increments up to a setpoint and then untwisting it back to the starting point. Theaverage torsional stiffness value is determined from aleast-squares fit. An uncertainty and repeatability analy-sis of typical data is presented to determine the sensitiv-ity of the stiffness measurement as a function ofuncertainty in scale readings, dial indicators and geome-try measurements. To help validate the twist fixture, thetorsional stiffness of a standard frame structure with aknown stiffness value based on an analytical mechanicssolution is measured and compared. Tests conductedusing the standard resulted in measured values of tor-sional stiffness slightly higher (about 6%) than the analyt-ical prediction. The difference between measured andpredicted values is within the expected uncertainty ofmaterial constants, geometry, dial indicator measure-ments and the assumptions inherent in the analyticalsolution.
INTRODUCTION
The torsional stiffness of a NASCAR Winston Cup Serieschassis can have a significant effect on its handling [1]. Inorder for the suspension to control the vehicle’s motion,chassis flexibility must be minimized. Winston Cup chas-sis are primarily constructed of mild steel tubular and boxbeam members. The floor-pan and firewall are con-structed of thin gauge, steel sheet metal. An illustration ofa chassis is shown in Figure 1. Although much of thechassis’ geometry is dictated by NASCAR rules [2], thereare several modifications and additions that can be madeto significantly alter the torsional stiffness. Much efforthas been made to predict the torsional stiffness of alter-native Winston Cup chassis designs using finite elementanalysis (FEA) [3,4,5,6]. In order to validate these finiteelement models an experimental method is needed todirectly measure torsional stiffness. The purpose of thisproject is to design and build a twist fixture for measuringthe torsional stiffness of alternative Winston Cup chassisdesigns. The rapid measurement of torsional stiffnessallows different chassis designs to be evaluated andcompared. The measured data may also be used to vali-date finite element models.
The following design constraints were applied to the twistfixture design:
1. ability to twist the chassis in both a clockwise andcounter-clockwise direction about the chassis’ longi-tudinal axis,
2. ability to measure torsional stiffness with a total error(from uncertainty and regression analyses) of lessthan 5%,
3. adjustable to different chassis geometries includinglateral and longitudinal widths of attachment points,
4. repeatable measured data.
The following design criteria were applied to the twist fix-ture design:

2
1. does not require removal of major suspension com-ponents in order to measure chassis stiffness,
2. light weight and easily transportable,
3. low cost of materials and maintenance,
4. minimum constraints on chassis during twist.
To satisfy the constraints and meet the objectives, a twistis designed and analyzed. To twist the chassis, knownequal and opposite vertical displacements are applied tothe front spring perches. The displacements are appliedusing linear actuators (jack-screws) and measured withdial indicators. Reaction forces are measured using stan-dard race scales. The applied torque is calculated fromthe reaction forces. The chassis twist angle is calculatedfrom the applied displacements and the lateral distancebetween displacement actuators. The torsional stiffnessis then calculated by dividing the torque by the twistangle.
Figure 1. Finite element model of a typical Winston Cup chassis showing steel tubing, box-beams, floor pan and firewall.
LINEAR JACK-SCREW CONCEPT
A new twist fixture design is introduced which uses linear,jack-screw actuators at the left and right posts to applyequal and opposite vertical displacements to twist thechassis about a virtual pivot point close to the verticalchassis center (see Figure 2). This ensures the chassis istwisted in pure rotation, resulting in an accurate mea-surement of the absolute chassis stiffness. Furthermore,controlling independent jack-screws on the left and rightside allows the chassis to be twisted precisely about itscenterline by adjusting each actuator’s travel accordingly.
CONSTRAINT CONDITIONS
In order to determine minimum constraint conditions atthe ends of the twist fixture posts, which allow the chassisto rotate freely yet maintain a stable configuration, a finiteelement analysis is performed. The finite element modelused for this constraint study consists of a typical Hop-
kins Chassis model [6], a model of the twist fixture andthe constraints between them. The coordinate systemused for this study has the positive x-axis longitudinallyoriented towards the rear of the chassis, the positive y-axis laterally oriented towards the right of the chassis andthe positive z-axis is vertically oriented towards the top ofthe chassis.
Figure 2. Illustration of twist fixture based on linear, jackscrew actuators.
To simulate ball joint constraints, translational degrees offreedom between the posts and the chassis are coupledand rotational degrees of freedom are left uncoupled.Hinge joints at the base of a post are modeled by fixingtranslational degrees of freedom in all directions and fix-ing rotational degrees of freedom about the x-axis (qy =free). A solid attachment is modeled by coupling bothrotational and translation degrees of freedom. To twist thechassis about the longitudinal axis, the bases of the frontposts are translated in the vertical direction, equal andopposite on each side. The vertical reactions at thebases of the front posts are used to calculate the torque.Stiffness is calculated from the torque divided by theapplied twist angle.
Based on the finite element study, the minimum con-straints are determined as:
• (LR) Left-Rear Post: Fixed degrees of freedom at thebottom, free rotation about all axes (ball joint) at thetop.
• (RR) Right Rear Post: Ball joints at the bottom andtop.
• (LF) Left-Front Post: Free rotation about the y-axiswith all other degrees of freedom fixed at the bottom,ball joint at the top.
• (RF) Right Front Post: Ball joints at the bottom andtop.

3
These boundary conditions showing free translationalmotion of the chassis are illustrated in Figure 3. Theseconstraint conditions allow for free translation of the topsof the right posts in both the longitudinal and lateral direc-tions. They also allow free longitudinal translation at thetop of the left-front post.
Figure 3. Minimum constraint boundary conditions showing free translational motion of the chassis.
In order to simplify construction set-up, several alterna-tive constraints are considered. The alternative constraintconditions are based on eliminating degrees of freedomat the bottom of the posts.
Alternative constraint set-ups:
1. Minimum constraint set-up.
2. Case 1 with fixed x and z rotation at the base of theRR post.
3. Case 2 with fixed y rotation at the base of the RRpost.
4. Case 3 with fixed x and z rotation at the base of theRF post.
5. Case 4 with fixed y rotation at the base of the LFpost.
6. Case 4 with fixed y rotation at the base of the RFpost.
7. Case 4 with fixed y rotation at the base of both frontposts.
The torsional stiffness for each case is compared to theminimum constraint set-up in Figure 4. The results indi-cate that the difference for all the cases considered isless than 0.25% from the minimum set-up. For ease ofconstruction, the constraints corresponding to case 4 areused for the twist fixture design. Figure 5 illustrates theconstraints used on the actual fixture.
Figure 4. Percent difference in stiffness of different constraint cases compared to minimum constraint case.
Figure 5. Constraints used on actual twist fixture.
At the top ends of the vertical posts, ball joints are usedto allow for the rotational degrees of freedom of the chas-sis connection to be decoupled from the twist fixture. Atthe rear, the bases of the vertical posts are bolted solidlyto the support platform. At the front, a hinge joint is usedbetween the posts and the jackscrews to allow rotationabout the lateral axis only.
TWIST FIXTURE DESIGN
In this section a twist fixture design is presented basedon the jack-screw concept for twisting the chassis whichuses support stands bolted to the floor. Vertical postsconnect the jack-screws to the chassis at the front springperch. In the rear, vertical posts connect the chassisdirectly to bolted support stands. The rear assembly con-sists of two identical stands, one of which is illustrated inFigure 6. Figure 7 shows a photograph of the actual rear
P e rce nt Diffe re nce in T orsiona l S tiffne ss from M in im um
Constra in t Ca se
0.00
0.140.15 0.16
0.17 0.17
0.21
0.00
0.05
0.10
0.15
0.20
0.25
1 2 3 4 5 6 7
Cas e
%

4
stand. A triangular post on the stand is used to facilitateattachment to the chassis without removal of the reartrailing arms. A ball joint is used at the attachment to thechassis and allows all rotational degrees of freedom to bedecoupled. Since the stands are bolted solidly to thefloor, all rotations and translations are fixed at the base.Slots are milled in the stands to allow for lateral adjust-ment of the spacing between the two stands.
Figure 8 shows an illustration of the front assembly.Pieces of angle iron are welded to the ends and sides forbolts that fix the assemblies to the floor. Slots are alsomilled in the front assemblies to allow for adjustmentsboth laterally and longitudinally. The attachments at thechassis and the jack-screws use ball joints at the top ofthe posts where they attach to the chassis and hingejoints at the bottom where they attach to the jack-screws.Figure 9 shows a photograph of the actual front assem-bly.
The front assemblies of the fixture weighed approxi-mately 83 lb. each while the rear assemblies weighedapproximately 48 lb. each. Both the size and weight ofthe assemblies of the bolted fixture allowed a single per-son to transport it. The jack-screw, hinge joint and postcan also be removed (in one piece) from the front assem-bly to reduce the total amount of weight that is carried atone time. This would separate the front assembly into twocomponents weighing 54 lb. and 29 lb. each.
Figure 6. Illustration of rear stand for twist fixture.
Figure 7. Photograph of rear stand for twist fixture.
Figure 8. Illustration of front assembly for twist fixture.
Figure 9. Photograph of front assembly for twist fixture.
5
The race scales are placed directly under the frontassemblies. At large enough twist angles the reactionforce at one of the front posts changes from compressionto tension. As a result, this scale no longer reads thereaction force since it is only capable of measuring com-pressive loads. Use of tension/compression load cells inplace of the scales would allow tension to be recorded,however this is not necessary. Since the tops of all fourposts have ball joints, which uncouple the rotationaldegrees of freedom from the chassis, the change in mag-nitude of the tension load on one scale is the same as thechange in magnitude of the compressive load on theother scale, i.e., |∆Rr| = |∆Rl|. As a result, only the scalewith the compressive load is used to record reactions.The validity of this observation is evident in test data andfrom analysis. Both the test data for different chassis andthe finite element data from the chassis model describedearlier show that the changes in the reaction forces aftertwisting the chassis any set amount are equal in magni-tude and opposite in direction. To clarify the use of onlythe compressive reaction, an analysis was performed ofa simplified asymmetric chassis structure with appliedequal and opposite displacements [7]. The analysisshows that for an asymmetric structure supported withball joints at the corners, the left and right side reactionforces are equal and opposite.
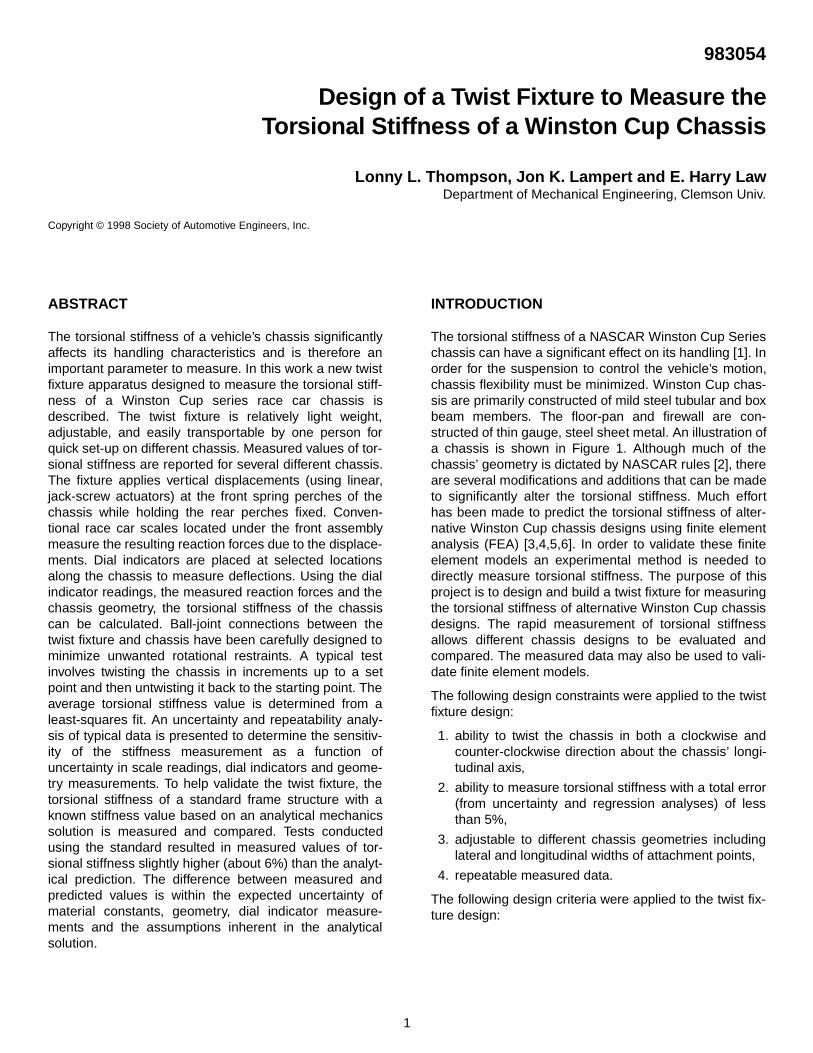
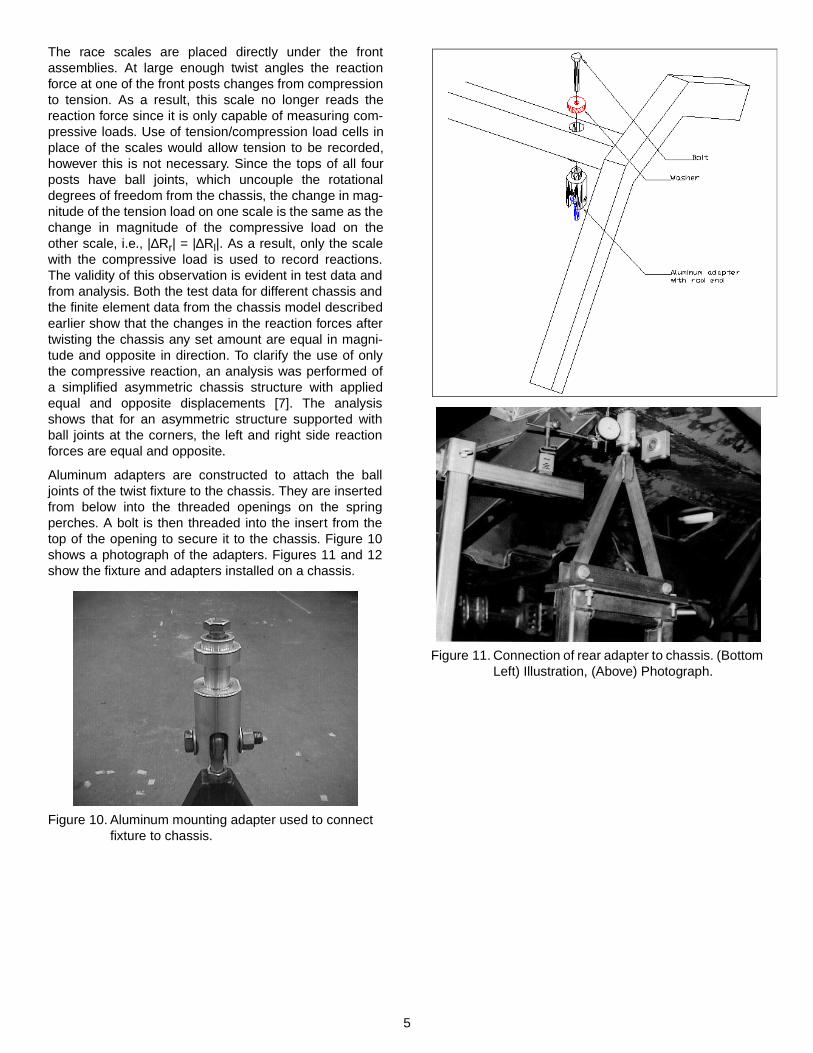
Aluminum adapters are constructed to attach the balljoints of the twist fixture to the chassis. They are insertedfrom below into the threaded openings on the springperches. A bolt is then threaded into the insert from thetop of the opening to secure it to the chassis. Figure 10shows a photograph of the adapters. Figures 11 and 12show the fixture and adapters installed on a chassis.
Figure 10. Aluminum mounting adapter used to connect fixture to chassis.
Figure 11. Connection of rear adapter to chassis. (Bottom Left) Illustration, (Above) Photograph.

6
Figure 12. Connection of front adapter to chassis. (Top) Illustration, (Bottom) Photograph.
Since the fixture is bolted to the floor, holes must bedrilled in the floor to accommodate the bolts. These holesmust be accurately located in order to ensure that the fix-ture lines up with the chassis. Two methods can be usedto determine the hole locations.
The first, and easiest method, is to install the fixture tothe chassis and simply transfer the hole locations to thefloor. Before the holes are marked, the chassis is leveledand the front posts are aligned vertically. Once the holesare marked, the chassis and fixture are moved and theholes are drilled. This method ensures that all holes lineup correctly.
The other method involves measuring the chassis firstand then determining the hole locations from the chassis’geometry. The aluminum adapters that mate with thetwist fixture are installed and then the measurements canbe taken. The following three measurements are needed:lateral distance between front adapters, df, lateral dis-tance between rear adapters, dr, longitudinal distancebetween front and rear adapters, L. Measurements mustbe made to the centerlines of the bolts that will attach thefixture to the adapters. Once these measurements aredetermined, the exact hole locations can be calculated.To ensure that the fixture’s adjustment will be sufficient
for all chassis measured, choose the hole locations to behalf way between the minimum and maximum calculatedlocations. Details for the layout and drilling proceduresare given in [8].
MEASUREMENT OF TORSIONAL STIFFNESS AND UNCERTAINTY ANALYSIS
In this section, the procedures used to calculate torsionalstiffness using the twist fixture for a typical Winston Cupchassis are discussed. Measurements from a fullyassembled car are used to illustrate the uncertainty in thedesign. Dial indicators are used to measure the equaland opposite applied vertical deflections δ, at the left andright front spring perches. For given small deflections δ,the front twist angle is
(Eq. 1)
where Lf is the lateral distance between the front dial indi-cators. Force reactions at the left front and right front,denoted Rl and Rr, respectively, are measured by scales.The torque is calculated from
(Eq. 2)
where Ls is the lateral distance between the scales. Thetwist angle is adjusted by subtracting the deflection at therear. The twist angle at the rear, θr, is calculated from ver-tical deflections measured near the rear spring perches.
(Eq. 3)
where δr and δl are the right and left vertical deflectionsmeasured (by dial indicators) near the rear springperches and Lr is the lateral distance between the reardial indicators. The torsional stiffness at each incrementis calculated by
(Eq. 4)
where θ = θf - θr. The increment is chosen such that atleast 10 data points are obtained.
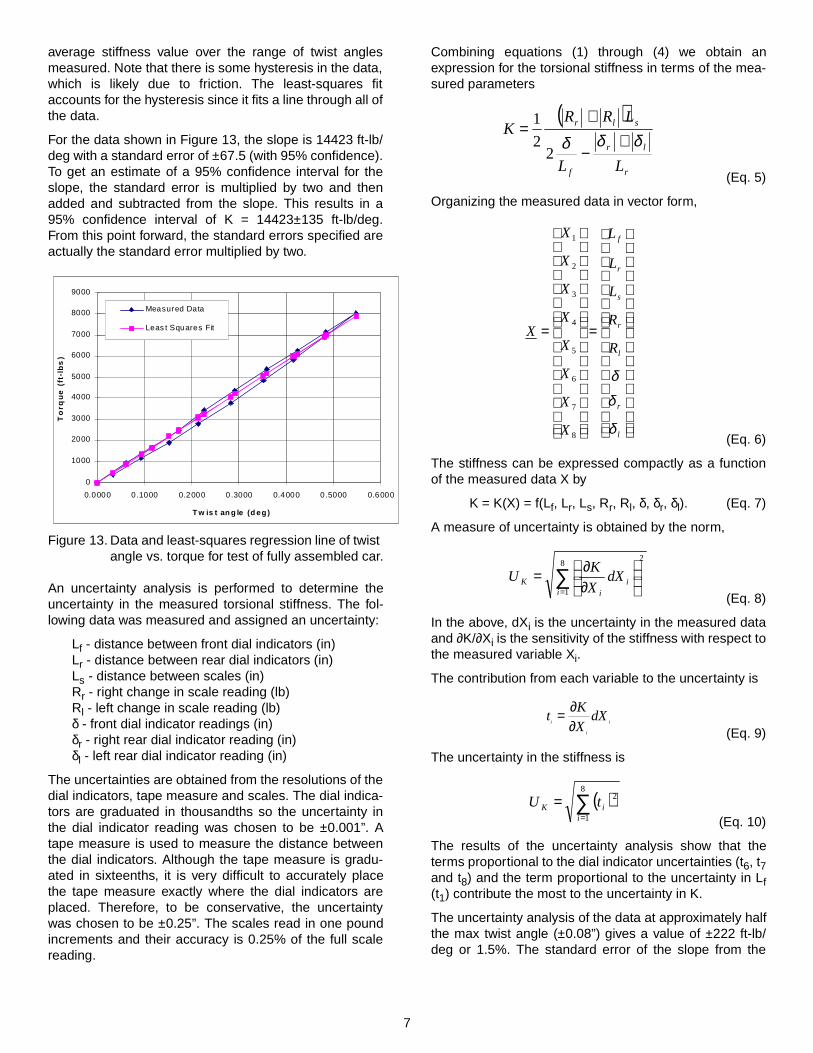
Test results for torque vs. relative twist angle q for thefully assembled car are given in Figure 13. The chassis istwisted in increments, with data recorded at each step.After several steps the twist angle is reversed until reach-ing zero. A least-squares regression is performed on thedata with q as the dependent (x) variable and the torqueas the independent (y) variable. The y-intercept is forcedto zero since zero twist angle results in zero torque. Theslope of the least-squares regression line represents an
)(2
radiansL f
f
δθ =
slr L
RRT
+=
2
)(radiansLr
lrr
δδθ
+=
θT
K =
7
average stiffness value over the range of twist anglesmeasured. Note that there is some hysteresis in the data,which is likely due to friction. The least-squares fitaccounts for the hysteresis since it fits a line through all ofthe data.
For the data shown in Figure 13, the slope is 14423 ft-lb/deg with a standard error of ±67.5 (with 95% confidence).To get an estimate of a 95% confidence interval for theslope, the standard error is multiplied by two and thenadded and subtracted from the slope. This results in a95% confidence interval of K = 14423±135 ft-lb/deg.From this point forward, the standard errors specified areactually the standard error multiplied by two.
Figure 13. Data and least-squares regression line of twist angle vs. torque for test of fully assembled car.
An uncertainty analysis is performed to determine theuncertainty in the measured torsional stiffness. The fol-lowing data was measured and assigned an uncertainty:
Lf - distance between front dial indicators (in)Lr - distance between rear dial indicators (in)Ls - distance between scales (in)Rr - right change in scale reading (lb)Rl - left change in scale reading (lb)δ - front dial indicator readings (in)δr - right rear dial indicator reading (in)δl - left rear dial indicator reading (in)
The uncertainties are obtained from the resolutions of thedial indicators, tape measure and scales. The dial indica-tors are graduated in thousandths so the uncertainty inthe dial indicator reading was chosen to be ±0.001”. Atape measure is used to measure the distance betweenthe dial indicators. Although the tape measure is gradu-ated in sixteenths, it is very difficult to accurately placethe tape measure exactly where the dial indicators areplaced. Therefore, to be conservative, the uncertaintywas chosen to be ±0.25”. The scales read in one poundincrements and their accuracy is 0.25% of the full scalereading.
Combining equations (1) through (4) we obtain anexpression for the torsional stiffness in terms of the mea-sured parameters
(Eq. 5)
Organizing the measured data in vector form,
(Eq. 6)
The stiffness can be expressed compactly as a functionof the measured data X by
K = K(X) = f(Lf, Lr, Ls, Rr, Rl, δ, δr, δl). (Eq. 7)
A measure of uncertainty is obtained by the norm,
(Eq. 8)
In the above, dXi is the uncertainty in the measured dataand ∂K/∂Xi is the sensitivity of the stiffness with respect tothe measured variable Xi.
The contribution from each variable to the uncertainty is
(Eq. 9)
The uncertainty in the stiffness is
(Eq. 10)
The results of the uncertainty analysis show that theterms proportional to the dial indicator uncertainties (t6, t7and t8) and the term proportional to the uncertainty in Lf(t1) contribute the most to the uncertainty in K.
The uncertainty analysis of the data at approximately halfthe max twist angle (±0.08”) gives a value of ±222 ft-lb/deg or 1.5%. The standard error of the slope from the
0
1000
2000
3000
4000
5000
6000
7000
8000
9000
0.0000 0.1000 0.2000 0.3000 0.4000 0.5000 0.6000
T w is t an g le (d eg )
To
rqu
e (
ft-l
bs
)
Measured Data
Leas t Squares Fit
( )
r
lr
f
slr
LL
LRRK
δδδ +−
+=
22
1
=
=
l
r
l
r
s
r
f
R
R
L
L
L
X
X
X
X
X
X
X
X
X
δ
δ
δ
8
7
6
5
4
3
2
1
∑=
∂∂=
8
1
2
ii
iK dX
X
KU
i
i
idX
X
Kt
∂∂=
( )∑=
=8
1
2
iiK tU

8
least-squares regression is added onto the uncertaintynumber in order to obtain the total error. The standarderror from the least-squares regression is ±135 ft-lb/deg.So the best estimate of the stiffness is K = 14423±357 ft-lb/deg or 2.5% error (with 95% confidence).
An estimate of the twist angle required to obtain a speci-fied uncertainty value can be obtained by twisting thechassis an arbitrary amount and measuring the reactionforces and dial indicator readings. The reaction forcesand dial indicator readings at higher displacements canbe estimated easily since the reaction forces vary linearlywith displacement. A twist angle is determined whichgives approximately 1 % uncertainty at the maximumtwist angle (which ensures only 2-3% uncertainty at halfthe max twist angle). A detailed description of the uncer-tainty analysis results, test procedure and twist fixtureset-up is given in [8].
VALIDATION USING A STANDARD
To validate the twist fixture, a standard is constructedwith a known torsional stiffness. The standard is a simplecircular “torque tube” with rectangular sections welded tothe ends to interface with the twist fixture (see Figure 14).The circular center section is a piece of structural steeltubing with an outside diameter of 2” and an average wallthickness of 0.110”. The square beam sections on theends are made of 2x2” square structural steel with anaverage wall thickness of 0.1875”.
Welded to the ends of the square sections are specialadapters (see Figure 15) that were constructed to allowthe insertion of a rod-end (ball joint). The adapters alsoallow the displacements from the twist fixture jack-screwsto be applied directly at the center of the cross-section ofthe square members.
Figure 14. Illustration of standard and twist fixture.
Figure 15. Rod-end adapters used on standard(cutaway view).
The test procedure is the same as that used with thechassis except the maximum twist value is much larger.The standard is twisted in increments of ±0.100” up to amaximum value of ±1.000” measured with the front dialindicators placed 32” apart.Based on beam theory to pre-dict the deflection of the square beams, simple torsion forthe circular tube, and with ball joints (free rotations) ateach end of the standard, the vertical reactions at thefront are equal and opposite with magnitude,
where
Az = Right-front reaction forceBz = Left-front reaction forceG = Modulus of rigidity of steelJ = Second polar moment of area of circular tubeδ = Twist fixture jack-screw displacementl = Longitudinal distance between front and rear supportsd = Lateral distance between left and right supportsE = Modulus of elasticity of steelI = Second moment of area of square sections
From the applied twist angle θ = 2δ/d, the torsional stiff-ness predicted by the analysis is,
An uncertainty analysis of the analytically determinedstiffness was performed resulting in an uncertainty of±3.23 ft-lb/deg. The uncertainty of the analytical stiffnessis then K=94.58 ±3.23 ft-lb/deg (with 95% confidence).
A finite element model was also created to validate thehand analysis, see Figure 16. The finite element modelconsists entirely of beam elements for both the standardand the twist fixture. The finite element results matchedwith the analytical solution.
9
Figure 16. Finite element model of standard.
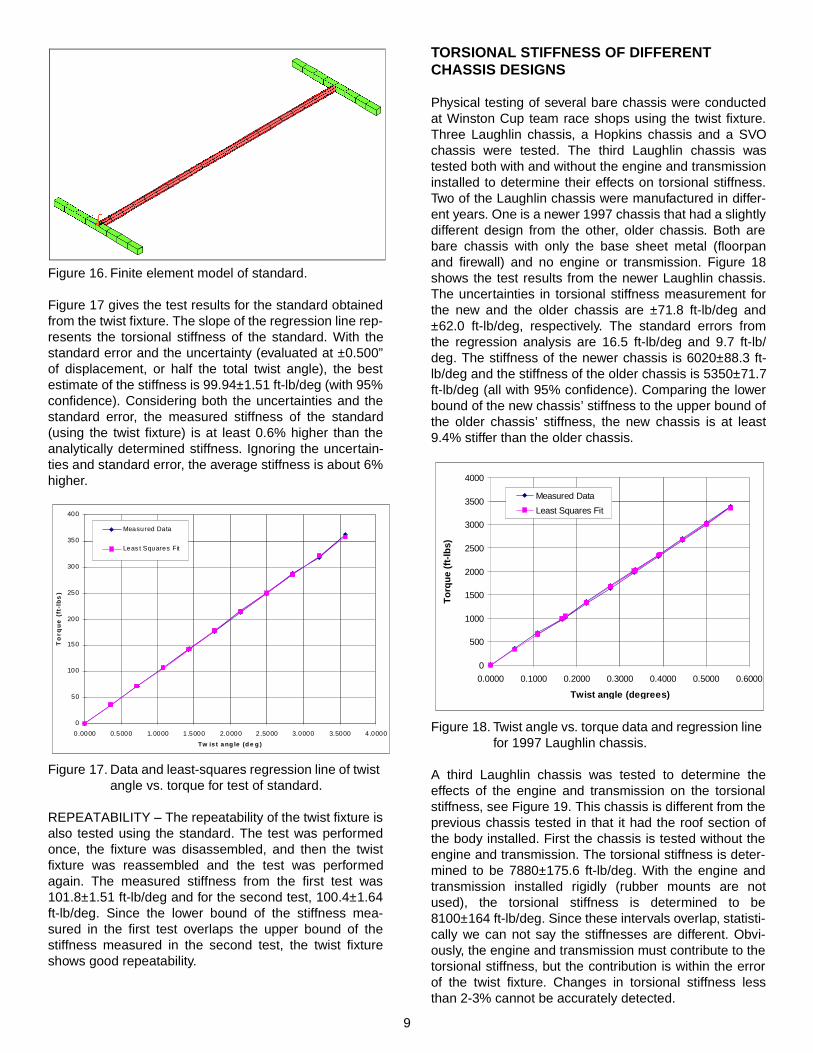
Figure 17 gives the test results for the standard obtainedfrom the twist fixture. The slope of the regression line rep-resents the torsional stiffness of the standard. With thestandard error and the uncertainty (evaluated at ±0.500”of displacement, or half the total twist angle), the bestestimate of the stiffness is 99.94±1.51 ft-lb/deg (with 95%confidence). Considering both the uncertainties and thestandard error, the measured stiffness of the standard(using the twist fixture) is at least 0.6% higher than theanalytically determined stiffness. Ignoring the uncertain-ties and standard error, the average stiffness is about 6%higher.
Figure 17. Data and least-squares regression line of twist angle vs. torque for test of standard.
REPEATABILITY – The repeatability of the twist fixture isalso tested using the standard. The test was performedonce, the fixture was disassembled, and then the twistfixture was reassembled and the test was performedagain. The measured stiffness from the first test was101.8±1.51 ft-lb/deg and for the second test, 100.4±1.64ft-lb/deg. Since the lower bound of the stiffness mea-sured in the first test overlaps the upper bound of thestiffness measured in the second test, the twist fixtureshows good repeatability.
TORSIONAL STIFFNESS OF DIFFERENT CHASSIS DESIGNS
Physical testing of several bare chassis were conductedat Winston Cup team race shops using the twist fixture.Three Laughlin chassis, a Hopkins chassis and a SVOchassis were tested. The third Laughlin chassis wastested both with and without the engine and transmissioninstalled to determine their effects on torsional stiffness.Two of the Laughlin chassis were manufactured in differ-ent years. One is a newer 1997 chassis that had a slightlydifferent design from the other, older chassis. Both arebare chassis with only the base sheet metal (floorpanand firewall) and no engine or transmission. Figure 18shows the test results from the newer Laughlin chassis.The uncertainties in torsional stiffness measurement forthe new and the older chassis are ±71.8 ft-lb/deg and±62.0 ft-lb/deg, respectively. The standard errors fromthe regression analysis are 16.5 ft-lb/deg and 9.7 ft-lb/deg. The stiffness of the newer chassis is 6020±88.3 ft-lb/deg and the stiffness of the older chassis is 5350±71.7ft-lb/deg (all with 95% confidence). Comparing the lowerbound of the new chassis’ stiffness to the upper bound ofthe older chassis’ stiffness, the new chassis is at least9.4% stiffer than the older chassis.
Figure 18. Twist angle vs. torque data and regression line for 1997 Laughlin chassis.
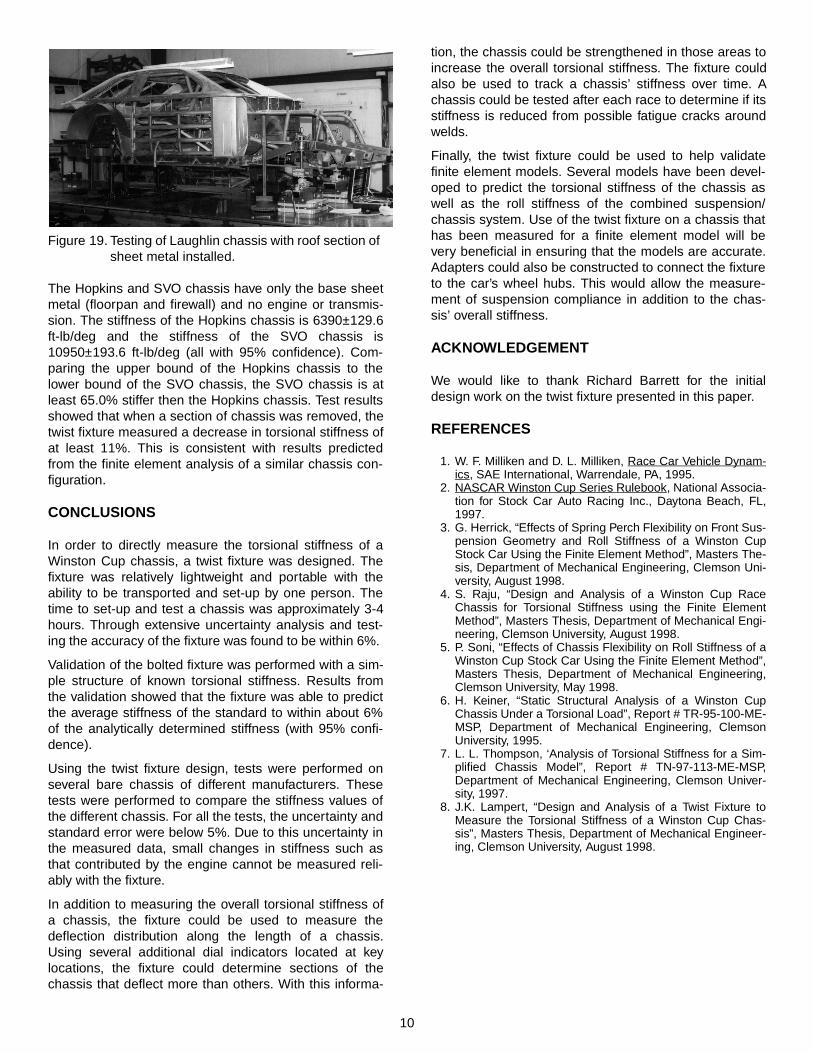
A third Laughlin chassis was tested to determine theeffects of the engine and transmission on the torsionalstiffness, see Figure 19. This chassis is different from theprevious chassis tested in that it had the roof section ofthe body installed. First the chassis is tested without theengine and transmission. The torsional stiffness is deter-mined to be 7880±175.6 ft-lb/deg. With the engine andtransmission installed rigidly (rubber mounts are notused), the torsional stiffness is determined to be8100±164 ft-lb/deg. Since these intervals overlap, statisti-cally we can not say the stiffnesses are different. Obvi-ously, the engine and transmission must contribute to thetorsional stiffness, but the contribution is within the errorof the twist fixture. Changes in torsional stiffness lessthan 2-3% cannot be accurately detected.
0
50
100
150
200
250
300
350
400
0.0000 0.5000 1.0000 1.5000 2.0000 2.5000 3.0000 3.5000 4.0000
Tw is t ang le (d e g )
To
rqu
e (
ft-l
bs
)
Measured Data
Leas t Squares Fit
0
500
1000
1500
2000
2500
3000
3500
4000
0.0000 0.1000 0.2000 0.3000 0.4000 0.5000 0.6000
Twist angle (degrees)
To
rqu
e (f
t-lb
s)
Measured Data
Least Squares Fit
10
Figure 19. Testing of Laughlin chassis with roof section of sheet metal installed.
The Hopkins and SVO chassis have only the base sheetmetal (floorpan and firewall) and no engine or transmis-sion. The stiffness of the Hopkins chassis is 6390±129.6ft-lb/deg and the stiffness of the SVO chassis is10950±193.6 ft-lb/deg (all with 95% confidence). Com-paring the upper bound of the Hopkins chassis to thelower bound of the SVO chassis, the SVO chassis is atleast 65.0% stiffer then the Hopkins chassis. Test resultsshowed that when a section of chassis was removed, thetwist fixture measured a decrease in torsional stiffness ofat least 11%. This is consistent with results predictedfrom the finite element analysis of a similar chassis con-figuration.
CONCLUSIONS
In order to directly measure the torsional stiffness of aWinston Cup chassis, a twist fixture was designed. Thefixture was relatively lightweight and portable with theability to be transported and set-up by one person. Thetime to set-up and test a chassis was approximately 3-4hours. Through extensive uncertainty analysis and test-ing the accuracy of the fixture was found to be within 6%.
Validation of the bolted fixture was performed with a sim-ple structure of known torsional stiffness. Results fromthe validation showed that the fixture was able to predictthe average stiffness of the standard to within about 6%of the analytically determined stiffness (with 95% confi-dence).
Using the twist fixture design, tests were performed onseveral bare chassis of different manufacturers. Thesetests were performed to compare the stiffness values ofthe different chassis. For all the tests, the uncertainty andstandard error were below 5%. Due to this uncertainty inthe measured data, small changes in stiffness such asthat contributed by the engine cannot be measured reli-ably with the fixture.
In addition to measuring the overall torsional stiffness ofa chassis, the fixture could be used to measure thedeflection distribution along the length of a chassis.Using several additional dial indicators located at keylocations, the fixture could determine sections of thechassis that deflect more than others. With this informa-
tion, the chassis could be strengthened in those areas toincrease the overall torsional stiffness. The fixture couldalso be used to track a chassis’ stiffness over time. Achassis could be tested after each race to determine if itsstiffness is reduced from possible fatigue cracks aroundwelds.
Finally, the twist fixture could be used to help validatefinite element models. Several models have been devel-oped to predict the torsional stiffness of the chassis aswell as the roll stiffness of the combined suspension/chassis system. Use of the twist fixture on a chassis thathas been measured for a finite element model will bevery beneficial in ensuring that the models are accurate.Adapters could also be constructed to connect the fixtureto the car’s wheel hubs. This would allow the measure-ment of suspension compliance in addition to the chas-sis’ overall stiffness.
ACKNOWLEDGEMENT
We would like to thank Richard Barrett for the initialdesign work on the twist fixture presented in this paper.
REFERENCES
1. W. F. Milliken and D. L. Milliken, Race Car Vehicle Dynam-ics, SAE International, Warrendale, PA, 1995.
2. NASCAR Winston Cup Series Rulebook, National Associa-tion for Stock Car Auto Racing Inc., Daytona Beach, FL,1997.
3. G. Herrick, “Effects of Spring Perch Flexibility on Front Sus-pension Geometry and Roll Stiffness of a Winston CupStock Car Using the Finite Element Method”, Masters The-sis, Department of Mechanical Engineering, Clemson Uni-versity, August 1998.
4. S. Raju, “Design and Analysis of a Winston Cup RaceChassis for Torsional Stiffness using the Finite ElementMethod”, Masters Thesis, Department of Mechanical Engi-neering, Clemson University, August 1998.
5. P. Soni, “Effects of Chassis Flexibility on Roll Stiffness of aWinston Cup Stock Car Using the Finite Element Method”,Masters Thesis, Department of Mechanical Engineering,Clemson University, May 1998.
6. H. Keiner, “Static Structural Analysis of a Winston CupChassis Under a Torsional Load”, Report # TR-95-100-ME-MSP, Department of Mechanical Engineering, ClemsonUniversity, 1995.
7. L. L. Thompson, ‘Analysis of Torsional Stiffness for a Sim-plified Chassis Model”, Report # TN-97-113-ME-MSP,Department of Mechanical Engineering, Clemson Univer-sity, 1997.
8. J.K. Lampert, “Design and Analysis of a Twist Fixture toMeasure the Torsional Stiffness of a Winston Cup Chas-sis”, Masters Thesis, Department of Mechanical Engineer-ing, Clemson University, August 1998.