diagnostic odyssey for rare diseases: exploration of ... · final diagnosis for a subset of rare...
TRANSCRIPT

Diagnostic odyssey for rare diseases:exploration of potential indicators
PIRU Publication 2015-13
Nick Black, Fred Martineau and Tommaso Manacorda

For further details, please contact:
Nick BlackPolicy Innovation Research Unit (PIRU)Department of Health Services Research & PolicyLondon School of Hygiene and Tropical Medicine15–17 Tavistock PlaceLondon WC1H 9SHEmail: [email protected]
© Copyright 2015. Not to be reproduced without permission.
Diagnostic odyssey for rare diseases:exploration of potential indicators
April 2015
Nick Black, Fred Martineau and Tommaso Manacorda

Acknowledgments
This report was commissioned by the Department of Health from a team at the London School of Hygiene and Tropical Medicine, as part of the Policy Innovation Research Unit (PIRU). We are grateful to all 22 experts (listed in Appendix 4) who provided information, suggestions and excellent advice as we worked on this report, and to Alastair Kent, Chair of the Department of Health Rare Diseases Forum. This is independent research commissioned and funded by the Policy Research Programme in the Department of Health, and the views expressed are those of the authors and may not reflect those of the funders.
Suggested citation
Black N, Martineau F, Manacorda T. (2015) Diagnostic odyssey for rare diseases:exploration of potential indicators. London: Policy Innovation Research Unit, LSHTM.

Diagnostic odyssey for rare diseases: exploration of potential indicators
Contents Executive summary 1
1. Introduction 3
2. Methods 5
3. How has the rare disease diagnostic odyssey been assessed? 9
4. What can be learnt from other clinical areas? 13
5. Conceptual framework for diagnostic odyssey 14
6. What can existing databases contribute? 15
7. Options for monitoring the rare disease odyssey 20
8. Recommendations 25
References 29
Appendix 1 Systematic review protocol and search strategies 30
Appendix 2 Results of systematic review 36
Appendix 3 Review of rare disease databases 54
Appendix 4 Interview participants 59
Appendix 5 Interview topic guide 60
Appendix 6 References for systematic review 61
Appendix 7 Presenting symptoms for rare diseases previously used to measure time to diagnosis 65


Diagnostic odyssey for rare diseases: exploration of potential indicators
1
Executive summary
1. The medical journey travelled by patients with a rare disease (and their families) from initial disease recognition or onset of symptoms to a final diagnosis may involve serial referrals to several specialists and a plethora of, often invasive, tests. This odyssey can be prolonged and, as a result, have serious consequences for the health of patients.
2. Measuring diagnostic odysseys presents several methodological challenges:
• the small numbers of people affected means there is only weak statistical power to detect changes in the length of odysseys;
• the low incidence of each disease means that, except for specialist centres, collecting data on patients dispersed over a large number of providers is a logistical challenge;
• there is no universally agreed definition of the start and end points of odysseys.
3. Our aim was to explore whether an accurate, robust and cost-effective method can be developed for the routine measurement of rare diseases diagnostic odysseys to enable the impact of interventions and policies, such as the 2013 UK Strategy for Rare Diseases, to be evaluated.
4. We carried out:
• a review of 66 studies of 40 rare diseases to establish how the diagnostic odyssey has been investigated in the UK and elsewhere;
• a review of databases that monitor the time to diagnosis in other conditions that can have prolonged diagnostic odysseys (cancers and diabetes);
• a review of five categories of databases that offer opportunities to provide information about rare diseases diagnostic odysseys: generic hospital databases; primary care databases; rare diseases databases; specialist department databases; and the recently established National Congenital Anomaly & Rare Disease Registration Service;
• interviews with 22 experts in the field of rare diseases.
5. The diagnostic odyssey comprises three periods of time: patient interval; primary care interval; and specialist care interval:
Presentation to care
Referral to specialist care
Onset of symptoms and/or signs
Primary care interval Specialist care interval
Diagnosis
Patient interval
First time the patient/parent
notices what will later be classified as a symptom or
sign of the disease
First time the patient/parent
is seen in primary care
Time at which responsibilty for
the diagnosis shifts to specialist care
Time at which diagnosis is made
Diagnostic odyssey for rare diseases: exploration of potential indicators
2
6. We recommend that:
• monitoring of the odyssey should be retrospective in design and focus on a ‘basket’ of tracer diseases;
• primary care data should form the foundation initially restricted to data from primary care research databases;
• the foundation provided by primary care data should be enhanced and validated by the addition of data from three other sources: rare diseases databases; specialist department databases; and patient/parent surveys;
• these proposals should be subject to widespread consultation among all those with an interest in and expert knowledge of the clinical, diagnostic and management of the conditions;
• whatever course of action is subsequently decided upon will need to be rigorously tested in pilot studies of two or three rare diseases.
The policy adopted will need to be reviewed in the light of two promising prospects: the availability of the General Practice Extraction Service and the National Congenital Anomaly & Rare Disease Registration Service. These may provide better options for monitoring the diagnostic odyssey than the short-term solutions being proposed.

Diagnostic odyssey for rare diseases: exploration of potential indicators
3
1.1 Background
The medical journey travelled by patients with a rare disease (and their families) from initial disease recognition or onset of symptoms to a final diagnosis may involve serial referrals to several specialists and a plethora of, often invasive, tests. This odyssey can be prolonged and, as a result, have serious consequences for the health of patients. A 2004 European survey of the time between identification of early symptoms and a final diagnosis for a subset of rare diseases (Crohn’s disease, Cystic fibrosis, Duchenne muscular dystrophy, Ehlers-Danlos syndrome, Marfan syndrome, Prader Willi syndrome, Tuberous sclerosis, Fragile X syndrome) reported 25% of patients had to wait between 5 and 30 years [1]. During the odyssey people may receive sub-optimal care and support, which will also have adverse resource implications for the health service [2].
A rare disease is a life-threatening or chronically debilitating disease that affects five people or fewer in 10,000 and requires special, combined efforts to enable patients to be treated effectively. The total number of rare diseases is steadily increasing (current estimates suggest 5000 to 8000) because genetic research is beginning to explain disease patterns that were not understood before. Research suggests that one in 17 people may suffer from a rare disease at some point in their lifetime. In the UK, this means that more than 3 million people may have a rare disease. At least 80% of rare diseases have an identified genetic origin and 50% of new cases are in children. Measuring diagnostic odysseys presents several methodological challenges:
• the small numbers of people affected means there is only weak statistical power to detect changes in the length of odysseys;
• the low incidence of each disease means that, except for specialist centres, collecting data on patients dispersed over a large number of providers is a logistical challenge;
• there is no universally agreed definition of the start and end points of odysseys.
Several options have been proposed and adopted:
Depending on the particular condition and each person’s particular experiences with that condition, a diagnostic odyssey may be conceptualised as beginning when the affected person first became symptomatic or at each stage of the health service pathway necessary in order for a diagnosis to be possible.
The end of the diagnostic odyssey for conditions that have an easily accessible, highly specific laboratory test is often clearly defined. However for some conditions, early laboratory results may be suggestive – but not definitive – of a diagnosis of a rare disease. Other conditions can only be diagnosed clinically by an appropriately experienced clinician. For such conditions the point at which a differential diagnosis becomes a
1. Introduction
Starting pointInitial symptoms/concern raised by patient or parentPresentation to primary carePresentation to secondary careEnd pointClinical diagnosis Laboratory results suggestive of diagnosisLaboratory results confirm diagnosisCondition-specific management started

Diagnostic odyssey for rare diseases: exploration of potential indicators
4
confirmed diagnosis is unclear; it may therefore also be appropriate to consider a diagnostic odyssey to have ended once a specific management plan is commenced.
The 2013 UK Strategy for Rare Diseases [2] seeks to address, amongst other issues, the delay in diagnosis and, hence the delay in timely and appropriate intervention. In order to assess the effectiveness of the UK strategy for rare diseases and the associated actions, it would be helpful to explore whether a monitoring system might be established that provides some measure or indicator of any improvement in the diagnosis of rare diseases to shorten the duration of the diagnostic odyssey.
Consistent with the notion of ‘rare’ diseases used by the UK Strategy and the underlying concerns about prolonged diagnostic odysseys, this project does not consider several categories of rarely occurring diseases:
• cancers; • acute conditions including infectious diseases; • congenital anomalies; • conditions which are screened for in neonates (in which there is no prolonged
odyssey. Some neonates will be incorrectly diagnosed as suffering from a rare disease – false positives – and subsequently experience a diagnostic odyssey but these unfortunate instances are beyond the scope of this report).
While the focus is on past and current attempts to measure the odyssey for rare diseases, any lessons that can be learnt from similar challenges in other clinical areas (such as cancers) were explored.
1.2 Aim
To explore whether an accurate, robust and cost-effective method can be developed for the routine measurement of the rare diseases diagnostic odysseys to enable the impact of interventions and policies, such as the 2013 UK Strategy for Rare Diseases, to be evaluated.
1.3 Objectives
To carry out a literature review on rare diseases diagnostic odysseys to establish how it has been investigated in the UK and elsewhere.
To consider existing databases that monitor the time to diagnosis in other conditions (eg certain cancers).
To identify existing sources of data on rare diseases that might be used including GP-based records, hospital administrative data, and specialist clinical databases and registries of rare diseases. To assess the extent to which each database includes details about the duration of the pathway to diagnosis, the quality of the data, the availability of historic data, and the feasibility of linking data to other databases. To develop a conceptual framework of the diagnostic odyssey for the purposes of monitoring.
To develop options for ways of monitoring the diagnostic odyssey for patients with rare diseases and assess against pre-determined criteria.

Diagnostic odyssey for rare diseases: exploration of potential indicators
5
2.1 Systematic review
The aim was to identify and synthesise quantitative research into the diagnostic odyssey of long-term, non-communicable rare diseases, with a primary focus on how studies have defined, collected and analysed time to diagnosis. The inclusion criteria were:
• conducted in OECD countries; • measured, evaluated or sought to understand time to diagnosis; • investigated one or more non-communicable, chronic rare diseases; • reported explicitly defined quantitative measures of time to diagnosis in a population
of patients with a rare disease.
Included studies were not limited by language, type of publication or publication date. All quantitative study designs were eligible, with the exception of single case studies or very small case series, unless this represented the entire population for a given disease, as such designs would not assist the aim of this review. In contrast to the subsequent phases of this project, the systematic review did include rare diseases due to malignancies, congenital anomalies and conditions screened for during the neonatal period.
Medline, Embase and PsychINFO databases were searched using search strategies based on the following broad logic:
[rare disease] AND [diagnostic odyssey] AND [quantitative study design] AND [OECD country]
Full search strategies for each database are included in Appendix 1 along with the full review protocol. Institutional repositories of key organisations concerned with rare diseases were also searched, key experts were contacted, and the references of identified studies were screened. After removal of duplicate entries, 10% of retrieved articles were independently screened (by abstract followed by full text) by two members of the review team using EPPI-Reviewer software, with the remainder screened by a single reviewer.
Data were extracted by one reviewer and checked for accuracy by a second. Data extracted included: study design; rare disease(s) investigated; population sampled including method and sampling frame; definition and operationalization of time to diagnosis; data collection and analysis method; findings; conclusions; and methodological limitations identified by authors. Full details appear in Appendix 2.
A narrative synthesis was conducted. As the primary aim of the review was to synthesise the data collection methods rather than the actual results, no formal quality appraisal tool used. Instead, the quality of studies was appraised as part of the synthesis and discussion rather than a separate process.
In addition to an overall analysis, it was intended to consider two sub-groups: studies using routine data only; and studies measuring time to diagnosis as a continuous rather than categorical variable. However, there were only five studies that measured time to diagnosis so the latter analysis was not conducted.
2. Methods

Diagnostic odyssey for rare diseases: exploration of potential indicators
6
2.2 Lessons that can be learnt from databases in other clinical areas
The challenge of achieving early diagnosis also exists for several common conditions, most notably some cancers and diabetes. Measurement of time to diagnosis in these areas is likely to provide lessons for rare diseases. We conducted a rapid review of the literature and sought the views of experts to identify significant research that has been carried out in cancer and in diabetes.
Medline and Embase were searched using synonyms for ‘time to diagnosis’ or ‘diagnostic odyssey’, and MeSH (Medical Subject Heading) terms for the United Kingdom, limited to studies published in English from 2008 onwards but not limited by disease. Search results were consecutively screened by title, abstract and full text by a single reviewer. Data were extracted on the definition of ‘time to diagnosis’, data collection method and data analysis method.
2.3 Review of databases with information on rare diseases in England
Data regarding the diagnostic pathway of patients with rare diseases is included in the large amount of information that is generated from daily clinical activity in the English NHS. Although not all these data are routinely available, useful data can be extracted for ad hoc research studies. There are two principal categories of database: generic and disease-specific.
Generic databasesWeb searches and interviews with experts identified four sources of generic patient-level clinical data routinely collected in England (from all or large samples of the population): the Clinical Practice Research Datalink (CPRD, which includes the former General Practice Research Database, GPRD); the Health Improvement Network (THIN); the QResearch database; and Hospital Episode Statistics (HES). These were investigated to assess whether their data would allow a robust measure of the diagnostic odyssey for rare diseases. (Two other commercial databases were identified, DIN-Link [3] and UK IMS Disease Analyzer [4], but were not considered to be relevant).
The websites for the four databases were reviewed and some users were interviewed. In addition, research papers that relied on the databases were identified and reviewed to obtain detailed information about: the variables included in the databases (data dictionaries); data collection mechanisms; extent of national coverage; opportunities to link with other databases; and the completeness and accuracy of the data for measuring time to diagnosis.
Disease-specific databasesSeveral databases exist that collect data about patients with rare diseases. They are often referred to as registries. In January 2014 Orphanet published a list of such databases across Europe [5]. We reviewed the list and identified 74 (Appendix 3) that provide data on England. Some were then excluded for one of the following reasons:
• conditions where a diagnostic odyssey is unlikely to occur because of the natural history, such as obvious or life-threatening conditions presenting at birth;
• acute diseases and cancers, considering that delay in diagnosis for such conditions (which may well be rare in terms of prevalence) represent significantly different issues in terms of health services and policy research from those investigated in the present study;

Diagnostic odyssey for rare diseases: exploration of potential indicators
7
• conditions that neonates are screened for, the gold-standard intervention to reduce time to diagnosis;
• regional coverage only, so could not provide data for a national indicator (though national networks of regional databases were included if they covered much of the country).
The websites of the 48 databases were reviewed to assess the information they included. This led to a shortlist of databases that would allow the time to diagnosis to be determined. We focus on the databases that exist in England (or the UK). Although some of these contribute to European databases, reviews of the latter would provide no additional information so no attention was paid to the wider European composite databases.
2.4 Key informant interviews
Interviews were conducted with a range of experts with an interest in the diagnosis and management of rare diseases in the UK, including patients and parents. Participants were purposively sampled, to maximise variation in perspectives, from the following groups: specialist clinicians who care for people with rare diseases; specialist laboratory staff; generalist clinicians who occasionally care for people with rare diseases; policymakers and commissioners; and patient organisation representatives. Participants were selected to cover a range of rare diseases and geographical locations across the UK (Appendix 4).
The majority of interviews were conducted in-person by one or two members of the research team. When preferred by the participant, or a face-to-face meeting was not possible, the interview was conducted by telephone or email.
Interviews were semi-structured, informed by a topic guide (Appendix 5) developed iteratively throughout the research, and lasted on average 30 minutes. Notes were taken and content analysis performed.
2.5 Develop a conceptual framework of diagnostic odyssey
The interview data and findings of the literature reviews were used to develop a conceptual framework. This informed both the criteria used to identify sources of data and the appraisal of existing databases. The conceptualisation of diagnostic odyssey that was developed was influenced by the Aarhus Statement which addresses definitions of milestones and intervals in cancer diagnosis odysseys [6].
2.6 Assess options for monitoring the diagnostic odyssey
The database options for monitoring the odyssey were assessed against the following criteria:
• range of rare diseases included; • information on diagnostic odyssey: extent to which data are included; • representativeness of cases included: extent of selection bias; • accuracy of case recruitment: sensitivity (no false negatives) and specificity (no
false positives); • data completeness: extent to which missing data might bias findings; • validity of data: on diagnostic odyssey;

Diagnostic odyssey for rare diseases: exploration of potential indicators
8
• credibility: how meaningful the data are to patient/parents and clinicians; • timeliness: how up-to-date the data are; • burden and cost of additional data collection: additional time and expense to
provide data on diagnostic odyssey.

Diagnostic odyssey for rare diseases: exploration of potential indicators
9
3.1 Systematic review search results
A total of 1046 unique abstracts were screened to give 66 included studies (Figure 1). The references that are cited in this section appear in Appendix 6. Studies were conducted in the UK1-10, USA11-25, Denmark26, 27, Norway28, 29, Austria30, Germany31-36, Greece37, 38, Italy34, 39-41, Spain42, 43, New Zealand44, 45, France46-50, Canada25, 48, 51-54, Israel55, Sweden56, 57, Switzerland35, Australia58, 59, Ireland60, 61, Netherlands62, Estonia63 and three multi-country studies covering more than ten European studies64-66.
The 66 Included studies covered 40 rare diseases or categories of rare disease. The majority of these diseases were only investigated in one or two studies, with the exception of cystic fibrosis (13 studies), Fabry disease (4 studies) and Fragile X (3 studies) as shown in Table 1.
3. How has the rare disease diagnostic odyssey been assessed?
Figure 1 PRISMA flow diagram showing screening and selection of studiesId
enti
fica
tio
n
Records from databases (Medline + Embase = 1303
PsychInfo = 96)
Additional records identified through other sources
(n = 3)
Titles/abstracts screened after duplicates removed (n = 1046)
Full text articlesassessed for eligibility
(n = 168)
Records excluded(n = 878)
Full-text articles excluded(n = 102)
Studies included (n = 66)
Scr
eeni
ngIn
clud
ed

Diagnostic odyssey for rare diseases: exploration of potential indicators
10
Table 1 Frequency of rare diseases investigated by included studies
Disease Number of studies
Cystic Fibrosis 13
Fabry Disease 4
Fragile X 3
Alpha1-antitrypsin deficiency, Bronchiectasis, Duchenne muscular dystrophy, Haemophilia, Infantile Spasms/West Syndrome, Niemann-Pick disease type C, Takayasu arteritis
2
Acquired Angioedema, Adult-onset Still’s disease, Amytrophic lateral sclerosis, Batten Disease/neuronal ceroid lipofuscinosis, Cerebrotendinous xanthomatosis, Cervical Dystonia, Chylomicron retention disease/Anderson’s disease, Clarkson’s disease/Idiopathic systemic capillary leak syndrome, Complex regional pain syndrome, Congenital Dyserythropoietic Anemia Type I, Congenital Hypothyroidism, Dopa-responsive dystonia, Dystonia or hemifacial spasm, Erythromyalgia, Familial amyloid polyneuropathy, Gastric Cancer, GM2 gangliosidosis, Hereditary angio-oedema, Hirschsprung’s Disease, Homocysteinuria, Inborn errors of metabolism, Juvenile dermatomyositis, Long QT syndrome, Lymphangioleiomyomatosis, Marfan Syndrome, Myasthenia gravis, Myotonic dystrophy, Porphyria, Primary immunodeficiencies, Primary myoclonus-dystonia, Pyridoxine dependent seizures, Variant Creutzfeldt-Jakob Disease
1
3.2 Method of data collection
The most common data collection method was retrospective case record review, followed by data already held within disease-specific databases and information from patient/family by questionnaire or interview (Table 2).
Sample sizes ranged from 827 to 27,69216, with a median of 98 patients. Studies that required clinicians to complete special questionnaires or perform direct consultations had smaller sample sizes, while those using disease-specific databases had the largest.
Existing routine data were used in 26 studies while the rest collected new data. Not surprisingly the former studies included more patients (mean sample sizes 1667 and 230 respectively). The majority of studies (n=43) collected data retrospectively.
Data collection method Number of studies Mean sample size
Retrospective case record review 34 187
Disease-specific database 15 2777
Patient/family: questionnaire or interview
11 211
Clinician: questionnaire 7 65
Specialist questionnaire 5 63
Surveillance unit 4 97
Facility database 3 1211
Generic database 2 1311
Table 2 Number of studies and mean sample size by data collection methodStudies using multiple data collection methods are recorded more than once.

Diagnostic odyssey for rare diseases: exploration of potential indicators
11
3.3 Representativeness of patient populations
There are several potential challenges to ensuring that data on people with rare diseases are representative of the entire population of such people:
i. patients with mild symptoms may not present to a doctor 57, 63 and, conversely, those with severe symptoms may die before a diagnosis can be made52;
ii. if diagnosis relies on clinician judgement (rather than an accurate diagnostic test), some patients may remain undiagnosed8;
iii. if diagnosis depends on a diagnostic test that is not widely available, cases may be unrecognised;
iv. if inclusion of cases in a database depends on voluntary reporting by doctors rather than active case finding, recruitment is likely to be incomplete which may bias the information;
v. diagnosis may later be revised after the benefit of a longer period of observation28, 56; vi. databases held by pharmaceutical companies may be biased towards those
who are eligible for treatment; those with co-morbidities that contraindicate the treatment or who are unable to access the treatment may be under represented11;
vii. given that patients can only be included once they are diagnosed, databases will be biased towards those whose time to diagnosis is shorter26;
viii. if diagnosis depends on a new test, its introduction will detect previously unrecognised cases that never contributed to the estimation of time to diagnosis. As a result, the time to diagnosis for patients with that condition may increase, suggesting a deterioration in the service rather than an improvement51;
ix. where a sampling frame is limited to a particular specialty or department, patients managed primarily by other specialties may be missed. For example, patients with primary immune deficiency are normally managed by immunologists but some specific disease are managed in haematology or rheumatology36.
3.4 Definition of start and end of time to diagnosis
The most common definition to mark the beginning of time to diagnosis was that of symptom onset, used in 49 studies (Table 3). Many studies gave little or no information about how symptom onset was operationalised for data collection – those that did are shown in Appendix 7. Specific symptoms were either defined in advance, particularly studies collecting data from large databases32, 33, or were elicited through open questions to ascertain the start of symptoms or concerns.
Definition of start of time to diagnosis Number of studies
Birth 14
Symptom onset 49
Presentation – primary care 9
Presentation – secondary care 3
Presentation – tertiary care 4
Not specified 1
Table 3 Frequency of choice of start of time to diagnosis

Diagnostic odyssey for rare diseases: exploration of potential indicators
12
Fourteen studies used the patient’s date of birth to mark the beginning of time to diagnosis for congenital or genetic conditions. A minority used the date of first presentation to primary care (or any health care worker) and a few used presentation to specialist care in order to focus specifically on health service delays to diagnosis.
Most (94%) studies used the date of definitive diagnosis to mark the end of time to diagnosis. One study specified that they considered the diagnostic odyssey to end only when that result had been communicated to the patient 34.
Three studies used the date of probable or presumptive diagnosis: one on congenital hypothyroidism was conducted in 1978 when laboratory tests were new and symptomatic diagnosis was common53; one on variant Creutzfeldt-Jakob Disease where a definitive diagnosis is only possible post-mortem9; and one on inborn errors of metabolism defined a diagnosis once ‘clinical history, physical examination and initial laboratory investigations pointed to a condition and therapy and counselling were instituted’ 54.
Of the four studies that used the commencement of disease-specific clinical management as a proxy for diagnosis, one of particular note used the date of referral to a specialist as a proxy for the diagnosis of complex regional pain syndrome55, making the assumption either that a referral would not occur unless a diagnosis had been made, or that the specialist clinic would be guaranteed to make the ‘correct’ diagnosis immediately.
Notable limitations for defining the start and end points include:
i. the challenge of balancing the specificity of symptoms defined as heralding the onset of the disease and the danger of excluding or under-representing non-specific or non-classical symptoms;
ii. ascertaining symptom onset is likely to require patient-reported data which may be subject to recall bias if asked at or after the time of diagnosis50;
iii. relying on health care professionals reporting may misrepresent patients’ views66 and precludes the ability to prompt for more subtle, earlier signs of disease 23;
iv. using presentation to a particular level of care as a starting point for time to diagnosis excludes those who have never entered that level of care, for example those using centres in a different geographical area45, milder cases or those who were felt unsuitable or did not want specialist care53;
v. studies using start of treatment as a proxy for date of diagnosis make the assumption that treatment starts soon after a diagnosis is made25.
3.5 Types of analysis of time to diagnosis
The majority of studies (n=42) reported means or medians of time to diagnosis. One study noted a bimodal distribution of time to diagnosis: patients were either diagnosed quickly on presentation or experienced a prolonged delay (or were never diagnosed)54. Therefore parametric tests or summarising time to diagnosis using means or medians may fail to represent the actual odyssey that people experience.
Definition of end of time to diagnosis Number of studies
Definitive diagnosis 62
Probable diagnosis 3
Treatment/disease specific management started 4
Table 4 Frequency of choice of end of time to diagnosis

Diagnostic odyssey for rare diseases: exploration of potential indicators
13
4. What can be learnt from other clinical areas?
A search revealed potentially helpful attempts to assess the diagnostic odyssey in two other clinical areas – cancer and diabetes. Four different approaches have been used that might be considered for rare diseases.
4.1 One-off national service evaluation
Concern about delays in cancer diagnosis led to the establishment of a service evaluation, the National Audit of Cancer Diagnosis in Primary Care [7]. Conducted in 2009/10 in 1170 general practices in England, data on 18,879 patients who had a confirmed malignancy were collected from clinical records and hospital correspondence. Three intervals were identified within the diagnostic pathway: patient interval, that is time between the first symptom and the first consultation; primary care interval, the time between first presentation and date of referral (the number of consultations for relevant symptoms that they had with a GP before referral was also collected) and referral interval, defined as the time between referral and first specialist consultation.
4.2 General practice research databases
Another approach in cancer care involved use of the General Practice Research Database (GPRD) which includes data on about 10% of the population. Patient data were extracted to compare the length of the whole diagnostic interval (time between first presentation with symptoms attributable to cancer and cancer diagnosis) in two cohorts of patients, one diagnosed in 2001-2002 and the other in 2007-2008 to see if the time to diagnosis changed after the adoption of the 2005 NICE Referral Guidance for Suspected Cancer [9, 10]. This work suggests that data included in GPRD (now incorporated in the Clinical Practice Research Datalink, CPRD) may be accurate and detailed enough to attribute recorded symptoms to later diagnoses, using a set of putative symptoms derived from the literature or diagnostic guidelines.
4.3 Primary care information systems
The National Adult Diabetes Audit, the largest annual clinical audit in the world, collected primary care data from 2.47 million patients in 2011/12 [11]. Although the diagnostic pathway is not a focus of the audit, it illustrates how primary care data are potentially an effective option for studying this topic. Until concerns were raised about care.data, data were extracted by local primary care staff. The data required was specified by the Health & Social Care Information Centre (HSCIC) and extraction processes were produced to be run on the different information systems that general practices use to store health records [12]. In time it is hoped to extract data using the General Practice Extraction Service (GPES) which will offer greater flexibility and not require any work for local primary care staff [13].
4.4 National disease registries
The National Cancer Research Service collects data from the cancer registries in England. Data from the eight English registries are combined with similar data from the rest of the UK by the National Cancer Registration Service. It includes data on the date of referral from primary care and date of diagnosis so provides a model for determining the specialist care interval.

Diagnostic odyssey for rare diseases: exploration of potential indicators
14
The definition of key time points in the Aarhus statement [6] was adapted to inform the proposed conceptual framework. A number of theoretical choices were made, influenced by the literature review and of the opinions of the experts interviewed.
The framework recognises four time points (Figure 2):
• date of onset of symptom/s: defined as the first time the patient /parent notices what will later be classified as a symptom of the disease;
• date of presentation to primary care: time at which it would be feasible for a clinician to start investigating or referring to specialist care;
• date of referral to specialist care: time at which responsibility for the diagnosis shifts to specialist (secondary or tertiary) care. When there is direct presentation to emergency or to secondary care, such an interval would be zero;
• date of diagnosis: time when the final diagnosis is given to the patient.
The four time points allow three intervals to be calculated:
• patient interval: between the time of onset of symptoms and the presentation to primary care; includes the waiting time for an appointment;
• primary care interval: between the first presentation to primary care and referral to specialist (usually secondary) care;
• specialist care interval: time between the first referral and diagnosis; includes waiting time for an appointment. May involve further referrals from ‘general specialist’ such as general paediatrician to specialist in tertiary care.
5. Conceptual framework for diagnostic odyssey
Presentation to care
Referral to specialist care
Onset of symptoms and/or signs
Primary care interval Specialist care interval
Diagnosis
Patient interval
First time the patient/parent
notices what will later be classified as a symptom or
sign of the disease
First time the patient/parent
is seen in primary care
Time at which responsibilty for
the diagnosis shifts to specialist care
Time at which diagnosis is made
Figure 2 Conceptual framework

Diagnostic odyssey for rare diseases: exploration of potential indicators
15
Five categories of databases were identified that offer opportunities of providing information about rare diseases diagnostic odysseys: generic hospital databases; primary care databases; rare diseases databases; specialist department databases; and the recently established National Congenital Anomaly & Rare Disease Registration Service.
6.1 Generic hospital databases
Hospital Episode Statistics (HES) collects data about all episodes of hospital care being provided by NHS hospitals in England (with similar systems in the other parts of the UK) [14]. In theory, once a person had been diagnosed with a rare disease, their previous outpatient consultations and inpatient episodes could be identified. Thus, a picture of their odyssey from date of referral to specialist care could be constructed. In addition, patients could be linked to other databases (see below) to complete the odyssey.
In practice, shortcomings in data completeness, accuracy of the diagnostic data, and difficulties in linkage (partly due to failure to always use patients’ NHS numbers) severely limit the capability of HES. As a result, the information on rare diseases odysseys would be incomplete and may be misleading if systematic biases exist in the data collection (eg more complete data for those patients with shorter odysseys). In practice, no examples of using HES to inform the odyssey were found.
6.2 Primary care information systems
Primary care is theoretically the best setting to collect data about the diagnostic odyssey in rare diseases, given that virtually all information about the patient’s clinical pathway is supposed to be either generated by primary care or transmitted to it by other care providers. GP information systems should contain data which would be accurate enough to measure the diagnostic odyssey of rare diseases.
General practices use one of several information systems to manage their clinical records. There are four main providers: INPS, EMIS, Microtest and TPP. Until late 2012 a fifth provider existed (CSC, iSoft system) but has since been withdrawn from the market [15]. Data from these systems are increasingly being used to create aggregated databases either for research purposes or for service functions (management, reimbursement, clinical audit).
Research The three main databases constructed for research from GP systems are the CPRD, THIN, and QResearch.
(i) Clinical Practice Research Datalink (CPRD)This routinely collects data from general practices in the UK using INPS Vision software from self-selected practices that have volunteered to participate. It is funded by the National Institute of Health Research (NIHR) and the Medicines and Healthcare products Regulatory Agency (MHRA) and covers about 10% of the population [4, 16]. In March 2011 it contained records from over 12 million patients and by December 2013, there were over 13 million patients, of which approximately 5.5 million were active. The CPRD aims to link data from what was previously known as the General Practice Research Database (GPRD) with HES and other patient databases. Such linkage is reported to be currently available for about 60% of the participating practices. Many research studies have used GPRD data (either before or after its incorporation in the CPRD): 1159 publications in 1988-2013 [8].
6. What can existing databases contribute?

Diagnostic odyssey for rare diseases: exploration of potential indicators
16
One example of a study of a rare disease was the determination of the prevalence of Huntington disease in UK [17]. Another example of use of these data for a rare disease is a study being carried out at IMS Health, in collaboration with Novartis Pharmaceuticals, where the clinical pathway of patients with tuberous sclerosis is being constructed from GP data linked to HES data [18]. Time to diagnosis in these patients is not a specific focus but data that has been extracted, cleaned and consolidated would allow this kind of measurement to be made.
(ii) The Health Innovation Network (THIN) Data collected by general practices using the INPS Vision software is also available through this database. It was developed from GPRD but, since 2002, it has been independent and run commercially by CSD Medical Research UK (formerly known as EPIC). Many general practices using INPS Vision provide data to both databases. THIN covers 587 practices and contains data on 12.3 million patients, 3.6 million of which are active. It is commonly used in research: 477 research papers published in 2004-2014 relied on data extracted from THIN [19].
(iii) QResearchThis is a database that collects data from general practices using the EMIS information system [20]. It is jointly owned by the University of Nottingham and EMIS. It currently gathers data from 950 general practices (about 12% of all practices), including health records from over 13 million patients. The number of practices participating has increased significantly since 2006. Around 200 research papers have been reported on the QResearch website since 1998. Data from QResearch has been extensively used to derive risk prediction algorithms for a number of conditions.
Two issues were identified as specifically associated with the use of data from these research databases. First, there is concern about the representativeness of the data. Although this has been thoroughly assessed and is generally considered to be acceptable [21], it has not been established in the case of rare diseases. Because of their rarity, a partial coverage of English patient records together with the low prevalence of cases may substantially affect the statistical power and the generalisability of the measurements made. Second, there are concerns about the truncation of data. Since these databases are restricted to a small sample of general practices, patients moving in and out of practices will truncate the data and provide incomplete information. The impact of this as regards measuring a diagnostic odyssey needs to be assessed.
Service useTo overcome concerns about the representativeness of data from self-selected practices participating in research databases, increasingly there are opportunities to extract data from all practices. There are two principal approaches to obtaining patient-level data: local extraction and central extraction.
(i) Local extractionThis requires the cooperation and involvement of staff in each and every general practice who have to interrogate their local information system. This is the approach used to obtain data centrally for the Quality & Outcomes Framework for which practices have a strong financial incentive to participate. There are two recent examples of use of this approach in cancer and adult diabetes.
The NACDPC recruited general practices and asked them to extract data on cancer patients from their information system. It had to be reported in a standard way by

Diagnostic odyssey for rare diseases: exploration of potential indicators
17
entering the data into a spreadsheet. This approach gave good results in terms of participation and validity, where representativeness of data was found to be satisfactory when compared with cancer registry data.
The National Adult Diabetes Audit used a strategy designed centrally but with an application for each of the brands of software in use locally. In other words, the terms used to identify patients with diabetes and those used to identify the data that were being requested were translated into the different languages that local systems use. Each participating practice ran a number of instructions prepared by the NDA for their system and obtained the data that needed to be returned. Most (88%) of general practices in England participated in 2011-2012 and the quality of data collected was reported to be excellent [22]. The method depended on local staff downloading the extraction software, running it and transmitting the output to the Health & Social Care Information Centre (HSCIC).
(ii) Central extraction To overcome additional work for local general practice staff and to ensure 100% coverage, the General Practice Extraction Service (GPES) was conceived. It is to be hosted by HSCIC and is intended to provide data from all the main general practice information systems. Once up and running, the GPES will provide access to a much larger proportion of English patients’ primary care records than existing databases. Currently technical challenges and political concerns about patient confidentiality are impeding progress to establish the GPES. Thus the level of accuracy of the data it would provide or its consistency is not known. No published use of this extraction system has been identified from web and database searches. Although extremely promising for the future, the GPES cannot yet be considered as a viable option to measure the diagnostic odyssey in rare diseases.
Three issues were identified as specifically associated with the use of data from these service databases. First, there are transcription issues. Currently, information generated in secondary care, such as a diagnosis made by a specialist, needs to be manually transcribed into primary care records. This may or may not happen and, if it does, there is a danger of errors being introduced. Letters reporting a diagnosis may simply be attached as document files to the patient record, or written in an open text comment, but not properly coded as such. This means that querying a primary care database for patients with a specific diagnosis may miss cases and that a more complicated and possibly iterative process could be needed.
Second, there are coding issues. The Read Codes used in primary care clinical information systems is unlikely to be specific enough to allow the correct identification of some (many) rare diseases. In addition, the lack of a code for a rare disease will lead to inconsistent coding, with the same condition being coded differently in different patients.
Finally, there are limitations in the reporting of symptoms before a diagnosis is made. The probability that the first symptoms of a rare disease are timely and accurately reported at presentation depends on their severity, the specificity of available codes and on clinician judgement. This means that the same symptoms may or may not be reported by different clinicians for different patients. This risk is likely to be higher with more unspecific and less severe symptoms.

Diagnostic odyssey for rare diseases: exploration of potential indicators
18
6.3 Rare disease databases
Orphanet identifies 74 unique rare disease databases in England. However, 26 did not meet the inclusion criteria of this review and were excluded: 12 were regional rather than national in coverage (mostly congenital anomaly registers which were included as part of the British Isles Network of Congenital Anomaly Registers); nine were conditions obvious at birth or already targeted by screening; and five were cancer or acute diseases.
Of the 48 databases meeting the inclusion criteria, 32 had an active, functioning website (Figure 3). Of those, 22 provided some information on the data variables collected including 12 that provided details. The details were either contained in a data dictionary or in a protocol for the database. As regards the diagnostic odyssey, five collected both the time of onset of symptoms and the time of diagnosis. It is possible that a larger number of databases collect such data but either the data dictionary was not available online, or access was restricted to those registered or contributing data.
In those databases that collect data about time of onset of symptoms and time of diagnosis, the definitions used to identify such events were generally vague. Thus the validity of these data should be appraised before being accepted and used.
Figure 3 Summary of databases collecting data about rare diseases in England
Included databases = 48
Databases with a working website = 32
Websites providing information about collection data = 22
Websites providing detailed list of data = 12
Websites with a private area
= 10Time of
diagnosis = 8
Onset of symptoms
= 6
Time of diagnosis
AND onset of
symptoms = 5

Diagnostic odyssey for rare diseases: exploration of potential indicators
19
6.4 Specialist department databases
Some specialist departments (such as clinical genetics laboratories or centres for investigating and treating rare metabolic conditions) have created their own databases. While some may include information on the diagnostic odyssey, they are inevitably limited in scope to the experiences of a single specialist centre. Despite this limitation, such specialist databases could assist in identifying patients with a rare disease.
The National Pulmonary Hypertension Audit, managed by HSCIC, is an example of how specialist department databases can be used to collect patient-level data on a rare condition [23]. All eight centres designated for the care of patients with pulmonary hypertension in the UK participate, collecting data on patient demographics, diagnosis, clinical management and survival. The audit does not collect data on time to diagnosis but its functioning mechanism could be replicated for other conditions, where a limited set of centres for specialist care exists.
Although a disease that is diagnosed by means of a genetic test is not synonymous with it being a rare disease, a large number of the latter involve genetic testing as part of their diagnostic odyssey. Databases run by different genetic laboratories are unlikely to record information about onset of symptoms but as they always include a patient’s NHS number, linkage to other databases could prove fruitful. In addition, specialist department data will have high validity and accurate coding. There are 32 laboratories in the UK Genetic Testing Network so establishing a national data collection system appears feasible, although a detailed assessment would need to be carried out.
6.5 National Congenital Anomaly & Rare Disease Registration Service (NCARDRS)
Public Health England is currently creating a single comprehensive national congenital anomaly and rare disease registration service. Their vision is influenced by their experience of creating and managing the National Cancer Registration Service (NCRS). As the NCARDRS is currently at an early stage of development it is not yet clear what its structure and contents will be. The aim is that all rare diseases identified in the internationally recognised Orphanet rare disease classification system will be included. The service will provide data for patients, their families, clinicians, public health and research to improve monitoring of the frequency, nature, cause and outcomes of congenital anomalies and rare diseases [24].
The Registration Service will encompass the existing British Isles Network of Congenital Anomaly Registers (BINOCAR), which covers about half the population, with plans to extend it to the whole country by the end of 2015. BINOCAR currently collects data on 89 conditions, 60 of which are listed as rare diseases. Given that the majority of these conditions are diagnosed prenatally or immediately after birth, this initiative will not meet concerns about prolonged diagnostic odysseys. Nonetheless the wider vision of the NCARDRS, which plans to use rare diseases databases and seeks to identify affected people from other sources, may have something to contribute to measuring diagnostic odysseys.

Diagnostic odyssey for rare diseases: exploration of potential indicators
20
There are three existing sources of data that could provide data on the diagnostic odyssey – general practice information systems, GP research databases, specialist department databases – and two potential sources that either are being planned – NCARDRS – or could be established – patient/parent surveys. We consider the strengths and limitations of each as well as the developmental opportunities that exist to enhance them.
7.1 Primary care information systems
Local general practice information systems contain clinical data on all registered members of the population. Diagnoses are identified by Read codes.
Strengths • general practice clinical records contain detailed data about all episodes of primary
and secondary care received by each patient which could identify the key points in the diagnostic odyssey;
• systems cover all patients registered in the UK; people with rare diseases are likely to be registered;
• may be possible to identify first presentation of what later turn out to be relevant symptoms/signs.
Limitations • the Read codes, by which symptoms and diagnoses are coded, may not be
detailed enough to identify all rare diseases; • the time of onset of symptoms may not have been recorded; • data extraction awaits the successful implementation of GPES; • practices would have to be individually enrolled, though could be part of overall
agreement for all national clinical audits; • information governance issues (care.data) need to be addressed; • key items of data may not be in the GP’s electronic record but in letters and
documents from specialist care, accessible only by free text scanning of attached documents.
Development opportunities • lack of detail in Read codes could be addressed if diagnoses were validated
from other sources (by linkage to HES, rare disease databases, and specialist department databases); or national monitoring could be restricted to a ‘basket’ of rare diseases for which Read coding is adequate;
• time of onset of symptoms could be estimated by GPs but compliance by GPs and accuracy (hindsight bias) uncertain;
• GP participation rates are likely to increase if a financial Incentive (as with the QOF) is deployed;
• as and when GP Extraction Service becomes available, there will be no extra workload on practice staff (though the level of participation by practices may be less than 100%);
• estimates of cost could be obtained from a review of the costs associated with NDA and with NACDPC. Similarly, lessons could be learnt about information governance issues.
7. Options for monitoring the rare disease odyssey

Diagnostic odyssey for rare diseases: exploration of potential indicators
21
7.2 Primary care research databases
These databases (CPRD, QResearch and THIN) provide higher quality data than GP data information systems in general but are restricted to samples of self-selected practices that may not be representative. Strengths • data have been checked, cleaned and shown to be meet certain quality standards; • strong cooperation with the participating practices would facilitate any additional
data requirements.
Limitations • the Read codes, by which symptoms and diagnoses are coded, may not be
detailed enough to identify all rare diseases; • the time of onset of symptoms may not have been recorded by those entering data; • data truncation may affect the validity of measured time to diagnosis; • each database covers a limited proportion of UK population: CPRD (the largest) has
about 5.5 million patients, about 10% of the population. This will limit the statistical power of diagnostic odyssey measurements, particularly for diseases of very low prevalence.
Development opportunities • lack of detail in Read codes could be addressed if diagnoses were validated from
other sources (by existing linkage to HES or new linkages to rare disease databases and specialist department databases); or national monitoring could be restricted to a ‘basket’ of rare diseases for which Read coding is adequate;
• time of onset of symptoms could be estimated by GPs though accuracy (hindsight bias) uncertain;
• combining data from the three major databases (CPRD, THIN and Qresearch) would increase statistical power.
7.3 Rare disease databases
A small number of rare diseases have a specific national database (register) that includes patient level data.
Strengths • data have been checked, cleaned and shown to be meet certain quality standards. • use of multiple sources to identify all cases should ensure high sensitivity and
specificity for cases included; • database custodians are likely to be well motivated to make data available for
monitoring diagnostic odyssey; • likely to have high credibility with patients/parents and clinicians; • some databases have strong patient/parent involvement and sense of ownership.
Limitations • only five such databases that include data on time of onset of symptoms/signs and
time of diagnosis have been identified, but more may exist; • the representativeness and completeness (sensitivity) of cases included is unknown
but likely to vary between databases.
Development opportunities • many other existing rare disease databases may be able to expand their datasets to
include information on the odyssey at minimal extra burden or cost.

Diagnostic odyssey for rare diseases: exploration of potential indicators
22
7.4 Specialist department databases
Many specialist facilities (hospital departments, clinical genetic laboratories) maintain their own databases, holding administrative and clinical information at patient-level. As they directly support the clinical management of patients, the data are detailed, complete and up-to-date.
Strengths • high volume of patients with a range of rare diseases; • appropriate for the rarest conditions and conditions managed in one or a small
number of facilities; • quality and completeness of data likely to be high; • likely to be amenable to addition of additional data variables on odyssey; • likely to have high credibility with patients/parents and clinicians; • database custodians are likely to be well motivated to make data available for
monitoring diagnostic odyssey.
Limitations • not so useful for conditions that are managed at different levels of care, or in
multiple facilities in a given catchment area; • lack of standardisation of data collected between specialist facilities could limit
opportunities for aggregating data to gain national information; • limited in scope by geography (unless a national centre) and disease type – those
not treated or tested for in specialised facilities will not be included; • unlikely to collect data on early phases of diagnostic odyssey; • lack of clear catchment population may lead to some patients being excluded. This
may underestimate length of odyssey as those missed likely to experience longer journey;
• datasets collected may have altered over time limiting longitudinal monitoring; • facilities that maintain the best databases may also be those that minimise the
length of the odyssey, this biasing the results.
Development opportunities • specialist facility databases which currently do not include data on the odyssey
could add variables on time to diagnosis; • the UK Genetic Testing Network provides an opportunity to create national
information through sharing data from specialist facilities.
7.5 Patient/parent survey
Rather than relying on clinical records, an alternative approach would be to collect information from patients/parents using survey methods.
Strengths • allows collection of data on when the first concerns occurred, which may be
missing from clinical records; • good method for identifying time at which the diagnosis was communicated to the
patient/parent, which may be an important component of the odyssey; • captures not only the patient/parents’ objective view of the length of the odyssey
but also their subjective judgement as to the acceptability of it; • could also collect information on the quality of the odyssey (eg emotional impact of
‘looping’ through different specialties and hospitals with unnecessary repeat tests,

Diagnostic odyssey for rare diseases: exploration of potential indicators
23
whether or not their condition is taken seriously, number of wrong diagnoses that preceded the correct one);
• patients/parents likely to be highly motivated to participate so high response rates; • likely to have additional benefits by empowering patients/parents and providing
feedback of concerns to stimulate improvements in services.
Limitations • expensive and resource intensive to collect new data routinely; • patients/parents judgement of attribution of relevant symptoms/signs may be
inaccurate; • subject to recall bias as patients/parents can only be asked about the onset of
symptoms/first presentation after the final diagnosis is made, in some cases several decades later.
Development opportunities • lessons could be learnt from those rare disease databases that already incorporate
patient/parent surveys.
7.6 National Congenital Anomaly & Rare Disease Registration Service (NCARDRS)
The NCARDRS is planning to start incorporating rare diseases during 2015. When it is fully operational it could monitor the diagnostic odyssey. It’s difficult to assess its strengths and limitations until more detail becomes available so what follows is somewhat speculative.
Strengths • it would provide a comprehensive, single national database covering the whole of
England; • data will have been checked, cleaned and shown to be meet certain quality
standards; • use of multiple sources to identify all cases should ensure high sensitivity and
specificity for cases included; • likely to have high credibility with patients/parents and clinicians; • high volume of patients with a range of rare diseases; • NCARDRS are amenable to addition of additional data variables on odyssey; • database custodians are likely to be well motivated to make data available for
monitoring diagnostic odyssey.
Limitations • it is still at an initial stage and is designed to be implemented in stages. So the
ability to measure diagnostic odysseys may be some way off; • current plans do not include routine data from primary care which would be
necessary to measure the diagnostic odyssey.
Development opportunities • being at an initial stage of development, it offers an opportunity to include the
measurement of diagnostic odyssey within its scope.

Diagnostic odyssey for rare diseases: exploration of potential indicators
24
7.7 Summary of options
The options have been assessed against the following nine criteria:
• range of rare diseases included; • information on diagnostic odyssey: extent to which data are included; • representativeness of cases included: extent of selection bias; • accuracy of case recruitment: sensitivity (no false negatives) and specificity (no
false positives); • data completeness: extent to which missing data might bias findings; • validity of data: on diagnostic odyssey; • credibility: how meaningful the data are to patient/parents and clinicians; • timeliness: how up-to-date the data are; • burden and cost of additional data collection: additional time and expense to
provide data on diagnostic odyssey.
For each criterion, the extent to which each option does or could satisfactorily meet the requirement has been judged as:
Red = considerable limitationOrange = some limitationGreen = no existing limitation
Given uncertainty as to what the capabilities of the National Congenital Anomaly & Rare Disease Registration Service will be, it was not possible to assess it.
Figure 4 Assessment criteria for six potential data sources
Criteria
GP information systems
Primary care research databases
Rare disease database
Specialist department database
Patient/Parent Survey
Range of diseases
Information on diagnostic odyssey
Representativeness of cases
Accuracy of case recruitment
Data completeness
Data validity
Credibility
Timeliness
Additional burden and cost

Diagnostic odyssey for rare diseases: exploration of potential indicators
25
8.1 Key considerations in formulating a solution
No single data collection approach can accurately and cost-effectively collect routine measurements of the diagnostic odyssey for all 5000-8000 rare diseases across the whole of the UK. The heterogeneity of diseases as regards their symptoms, signs, pathology, and natural history means that patients’ experiences and diagnostic pathways vary. This, combined with the rarity of each disease, means that we recommend that monitoring of the odyssey should be retrospective in design and focus on a ‘basket’ of tracer diseases.
i. Retrospective approachGiven the low incidence of rare diseases, assessment of the diagnostic odyssey will inevitably need to start with the endpoint (when the diagnosis is eventually made) and then retrospectively look back at the events and timings of steps along the journey. This means that the completeness and accuracy of the odyssey will depend on the data collected at the time (eg date of referral from primary care) or on the recall of such events by patients/parents or clinicians.
ii. Tracer conditionsIt is not feasible to assess the diagnostic odyssey for all rare diseases. The selection of ‘tracer’ conditions needs to maximise the generalisability of the results to the wide range of rare diseases that exist. To achieve this, the following criteria should be observed in determining suitable rare diseases for consideration:
• relevance: evidence (which may well be anecdotal) that prolonged odysseys exist and that it has an adverse impact on patients/parents;
• disease prevalence: sufficient to provide an acceptable statistical power to detect the impact of policy/practice interventions;
• diagnostic specificity: sufficient to be able to isolate condition by codes used in routine databases;
• existence of tell-tale presenting symptoms and signs: to enable a date to be determined at which a health professional could reasonably be expected to actively consider a diagnosis of a rare disease.
In selecting tracer conditions from those that meet these criteria, it would be advisable to include a range that reflected not only the variety of diagnostic categories (eg musculoskeletal, metabolic, developmental etc) but also that involved a range of diagnostic specialties (eg clinical genetics, imaging, biochemistry etc).
Although there is no suitable single source of data available, a combination of existing sources, with some enhancements, could produce a feasible way forward. We recommend the use primary care data as the foundation and to build on that through more specialist data sources such as rare disease databases and specialist department databases. In addition, patient/parent surveys could enhance knowledge and understanding of the diagnostic odyssey still further. Details of such an approach are outlined below.
8. Recommendations

Diagnostic odyssey for rare diseases: exploration of potential indicators
26
Patient interval Primary care interval Specialist care interval
8.2 Primary care databases
Ideally, information systems in all general practices would be used so that everyone with a diagnosis of a rare disease could be identified. However, currently that is not feasible due to technical limitations with extracting data remotely (without burdening general practice staff with additional work), and political concerns about patient confidentiality that are restricting access to and the use of such data. Until these issues are resolved, alternative approaches must be used. Whilst not perfect, they may be fit-for-purpose if the data are handled cautiously.
We recommend the use of primary care research databases. The feasibility of identifying patients has already been demonstrated for tuberous sclerosis and Huntington’s disease, and the cost is relatively low (Figure 5). The principal limitations are:
• the range of diseases to be included in the basket would be limited by the specificity and sensitivity of Read codes;
• the restricted coverage of the UK population to self-selected general practices may bias the findings (though this could be minimised by combining data from several research databases);
• the lack of data on the patient interval would preclude measuring the effects of interventions aimed at reducing it.
As and when it becomes possible to extract data from all general practices (using the General Practice Extraction Service), the sample sizes will be much enlarged and selection bias will be minimal (Figure 6). There will still be the issue of the lack of specificity and sensitivity of Read codes for some rare diseases. The work to design the queries for data extraction will be able to capitalise on experience from working with the primary care research databases.
Figure 5 Diagnostic intervals for rare diseases covered by primary care research databases and coverage of population
Coverage of population with rare diseases
GP information system
10%
0%
Figure 6 Diagnostic intervals for rare diseases covered by GP information systems and coverage of population
Patient interval
Coverage of population with rare diseases Primary care research databases
10%
0%Primary care interval Specialist care interval

Diagnostic odyssey for rare diseases: exploration of potential indicators
27
8.3 Supplementary sources
The foundation provided by primary care data can be enhanced and validated by the addition of data from three other sources: rare diseases databases; specialist department databases; and patient/parent surveys.
Rare diseases databasesAlthough relevant for only a limited number of diseases, we recommend the use of rare diseases databases to enhance the data from primary care. Using patient identifiers, data from rare diseases databases could be linked to primary care research databases at the individual level (subject to meeting confidentiality requirements). This would help inform the primary care and specialist care intervals in the diagnostic odyssey. Meanwhile, the custodians of rare diseases databases should be encouraged to include data that allows all three intervals in the odyssey to be determined.
Specialist department databases In a similar way, we recommend that patients identified in primary care research databases be sought in databases run by specialist departments. The strengths of these databases are the high number of patients with rare diseases included. We recommend including:
• genetic sequencing centres: a large and increasing number of rare diseases are diagnosed using genetic tests carried out by a small number of regional or national reference laboratories. Utilising their electronic records, supplemented by a small number of specific questions concerning time to diagnosis on test request forms, gives access to a large number of patients with rare diseases;
• quaternary care centres specialising in rare diseases: their patients are likely to be those with a relatively long diagnostic odyssey. Although not generalizable to all patients with a rare disease, the most severely affected patients are those for whom it is arguably most important to improve time to diagnosis.
Patient/parent surveyThe principal gap in the information available from routine databases is data on the time of patients’/parents’ initial concern that there might be a problem (the start of the patient interval). We recommend the use of a patient/parent survey to help establish the patient interval.
General practice research databases can’t be used to identify individual patients so it will not be possible to try and generate linked data. Instead, patients would need to be recruited through patient associations, rare diseases databases or specialist department databases. As data from different sources would be based on different patients, the assumption would have to be made that both sources were representative of the odysseys of all patients (Figure 7).
Figure 7 Diagnostic intervals for rare diseases covered by primary care research databases and survey, and coverage of population
Coverage of population with rare diseases Primary care research databases
10%
0%
Patient/parent survey
Patient interval Primary care interval Specialist care interval

Diagnostic odyssey for rare diseases: exploration of potential indicators
28
As and when primary care information systems can be utilised, patients/parents could be invited to participate in a survey by their GP, avoiding any information governance obstacles. Responses could then be linked to the routine databases at the individual level (ie data from both sources would relate to the same patients) (Figure 8). The survey need not be limited to the patient interval but could seek to validate the clinical records of the other two intervals. In addition the survey could obtain information on the ways the odyssey had affected patients’/parents’ quality of life, not just quantifying the length.
There would be additional work for participating practices but the low prevalence of patients with rare diseases would mean it was slight. Given the importance of the odyssey for most of those surveyed, a high response rate would be expected. However, given the large number of general practices (over 8000 in England), the work involved in managing a survey would be considerable, as would be the cost.
8.4 The way forward
We recommend that these proposals be subject to widespread consultation among all those with an interest in and expert knowledge of the clinical, diagnostic and management aspects of the conditions and among those with expert knowledge of the relevant information systems. Whatever course of action is subsequently decided upon will need to be rigorously tested before widespread implementation.
We recommend that the feasibility of any proposals are tested in pilot studies of two or three rare diseases. This will enable a number of suppositions to be tested including:
• the ability to identify the diseases in the general practice research databases; • the feasibility of using more than one GP research database and whether there is
sufficient added value to justify such a strategy; • the amount of information on the diagnostic odyssey that can be obtained from the
GP research database/s; • the cost and benefit of supplementing such data with that obtained from rare
diseases databases; • the cost and benefit of supplementing such data with that obtained from specialist
department databases; • the feasibility and response rates of patient/parent surveys; • the feasibility of rare diseases databases and specialist department databases
extending their datasets to include information on the odyssey.
Finally, whatever policy is adopted, it will need to be reviewed in the light of two promising prospects. Both the General Practice Extraction Service and the National Congenital Anomaly & Rare Disease Registration Service may provide better options for monitoring the diagnostic odyssey than the short-term solutions being proposed.
Figure 8 Diagnostic intervals for rare diseases covered by GP information systems and survey, and coverage of population
Coverage of population with rare diseases
10%
0%
Patient/parent survey GP information system
Patient interval Primary care interval Specialist care interval

Diagnostic odyssey for rare diseases: exploration of potential indicators
29
1. Survey of the delay in diagnosis for eight rare diseases in Europe (EURORDISCARE).www.eurordis.org/sites/default/files/publications/Fact_Sheet_Eurordiscare2.pdf
2. UK Strategy for Rare Diseases. www.gov.uk/government/uploads/system/uploads/attachment_data/file/260562/UK_Strategy_for_Rare_Diseases.pdf
3. Carey IM, et al. Developing a large electronic primary care database (Doctors’ Independent Network) for research. Int J Med Inform 2004;73(5):443-453.
4. Williams T, van Staa T, Puri S, Eaton S. Recent advances in the utility and use of the General Practice Research Database as an example of a UK Primary Care Data resource. Therapeutic Advances in Drug Safety 2012;3(2):89-99.
5. www.orpha.net/orphacom/cahiers/docs/GB/Registries.pdf
6. 6. Weller D, et al. The Aarhus statement: improving design and reporting of studies on early cancer diagnosis. Br J Cancer 2012;106(7):1262-1267.
7. Royal College of General Practitioners. National Audit of Cancer Diagnosis in Primary Care. www.rcgp.org.uk/policy/rcgp-policy-areas/national-audit-of-cancer-diagnosis-in-primary-care.aspx
8. www.cprd.com/Bibliography/Researchpapers.asp
9. National Institute for Health and Clinical Excellence. Referral Guidelines for Suspected Cancer. London: NICE, 2005.
10. Neal RD, et al. Comparison of cancer diagnostic intervals before and after implementation of NICE guidelines: analysis of data from the UK General Practice Research Database. Br J Cancer 2014;110(3):584-592.
11. www.hscic.gov.uk/nda
12. www.hscic.gov.uk/media/13822/National-Diabetes-Audit---FAQs/pdf/NDA_FAQ_v_0.3.pdf
13. www.hscic.gov.uk/gpes/faqs?faqdetailid=3530&inplace=true
14. www.hscic.gov.uk/hes
15. www.ehi.co.uk/news/ehi/8063/csc-to-withdraw-from-primary-care
16. Thomas SL, et al. Chickenpox and risk of stroke: a self-controlled case series analysis. Clin Infect Dis 2014;58(1):61-68.
17. Evans SJW, Douglas I, Rawlins MD, Wexler NS, Tabrizi SJ, Smeeth L. Prevalence of adult Huntington’s disease in the UK based on diagnoses recorded in general practice records. J Neurol Neurosurg Psychiatry doi:10.1136/jnnp-2012-304636.
18. Demuth D, et al. Economic Impact Of Patients With Tuberous Sclerosis Complex (TSC) In The UK: A Retrospective Database Analysis In The Clinical Practice Research Datalink (CPRD). Value in Health 2014;17(3):A137.
19. http://csdmruk.cegedim.com/THINBibliography.pdf
20. www.qresearch.org/SitePages/Home.aspx
21. Herrett E, et al. Validation and validity of diagnoses in the General Practice Research Database: a systematic review. Br J Clin Pharmacol 2010;69(1):4-14.
22. www.hscic.gov.uk/catalogue/PUB12421/nati-diab-audi-11-12-summ-rep.pdf
23. www.hscic.gov.uk/catalogue/PUB13318/nati-pulm-hype-audi-2013-rep.pdf
24. Public Health England. Vision for a congenital anomaly and rare disease registration service in England. London: Public Health England, 2014.
References

Diagnostic odyssey for rare diseases: exploration of potential indicators
30
Appendix 1 Systematic review protocol and search strategiesProtocol registered at PROSPERO, registration number CRD42014013877
Research aim
To identify and synthesise existing quantitative research into the diagnostic odyssey of long-term, non-communicable rare diseases in OECD countries, with a primary focus on how studies have defined, collected and analysed time to diagnosis.
A secondary aim of the review is to identify and extract data on what is known about the length and determinants of time to diagnosis. However, this will not be the primary focus of the synthesis and findings will be presented in the synthesis only where they aid interpretation of the usefulness of different research methods used. Data extracted on study findings will, however, be presented in results tables to allow their use by interested academics or clinicians.
Review Methods
Inclusion and Exclusion CriteriaRare diseases will be defined as any disease identified as a rare disease by www.orpha.net, www.eurordis.org or any condition that meets the criteria for a rare disease set out in the UK Strategy for Rare Diseases, namely ‘a life-threatening or chronically debilitating disease that affects 5 people or fewer in 10,000’.1
The aim of this review is to investigate methods for assessing diagnostic odysseys in patients with rare diseases that are often inherited or congenital, and may go undiagnosed for months or years. The causes and consequences of such diagnostic delays are sufficiently different from delays measured in minutes or hours in diagnosing acute conditions such as meningococcal meningitis (classified as a rare disease by orpha.net) to warrant separate consideration. The scope of the review will therefore be further limited to long term conditions of a non-infectious origin.
‘Diagnostic odyssey’ will be defined as: a time to definitive diagnosis longer that what the natural history of the disease and available technologies would allow, and whose delay may affect the health or emotional wellbeing of the patient or their family, their clinical management including secondary prevention and symptomatic treatment, or their access to social support services. The review will only include studies that measure time to diagnosis of a rare disease from an explicitly defined starting point in the disease pathway to a defined diagnosis date.
The review will not be limited by language, place of publication or publication date. Foreign language texts will be translated by a member of the research team or colleague fluent in that language. All quantitative study designs will be considered, including descriptive designs, except case studies of one or a small number of patients which will be excluded as not sufficiently informative. However, given that in some ultra-rare diseases an entire country may only have a small number of cases of a particular disease, case series of the entire case population of a facility, region or country over a specified time period will be included in the review.
In summary, studies will be included if they:
1. Were conducted in a World Bank defined OECD country
2. Measure, evaluate or seek to understand time to diagnosis, defined as length of time from onset of disease, onset of symptoms or presentation to any level of the health services until the correct diagnosis is made.
1 Department of Health. The UK Strategy for Rare Diseases. London, UK; 2013.

Diagnostic odyssey for rare diseases: exploration of potential indicators
31
Included: only age at diagnosis measured, where it was used by study authors as a marker of time to diagnosis in a congenital conditionExcluded: only age at diagnosis measured, where used by study authors as a marker of disease onset.
3. Investigate one or more non-communicable, chronic rare diseases.Excluded: time to diagnosis of a complication resulting from an underlying disorder, whether rare or not; rare subtypes of a common disease
4. Report explicitly defined quantitative measures of time to diagnosis in a population of patients with a rare disease. Excluded: studies that do not explicitly define the start or end points of the time to diagnosis measure Excluded: case study designs unless representing a complete case population of a facility, region or country over a specified time period
Search StrategyMedline, Embase and PsychINFO will be searched using search strategies based on the following broad logic:
[rare disease] AND [diagnostic odyssey] AND [quantitative study design] AND [OECD country]
Full search strategies for each database are given below. Of note, synonyms of rare diseases alone were felt unlikely to retrieve all relevant articles, while it was not feasible to include specific terms for the several thousand rare diseases currently known. As a pragmatic compromise, eight rare diseases (namely Crohn’s disease, cystic fibrosis, Duchenne’s muscular dystrophy, Ehlers-Danlos Syndrom, Marfan syndrome, Prader-Willi Syndrome, Tuberous Sclerosis and Fragile X syndrome) that were the focus of an early EURORDIS report2 plus an additional seven conditions explicitly named in the UK Strategy for Rare Diseases1 (sickle cell anaemia, spina bifida, phenylketonuria, congenital hypothyroidism, medium chain acyl-CoA dehydrogenase deficiency, long QT syndrome and infantile epilepsy) were added to the search strategy as ‘tracer’ conditions. However, study eligibility was not limited to these 15 conditions.
In addition, institutional repositories of key organisations concerned with rare diseases will also be searched, as well as contacting key experts, screening the references of included studies and screening studies previously known to the authors.
Screening and Data ExtractionAfter de-duplication, the titles and abstracts of a random 10% of retrieved articles will be independently dual screened by two members of the review team using EPPI-Reviewer software. Differences in screening outcome will be reconciled through discussion and mutual agreement between the two screeners with reference to the study inclusion criteria, with input from the third reviewer if needed to solve any outstanding disagreements. Following reconciliation, the remaining abstracts will be screened by a single reviewer. The full text of the remaining eligible articles will then be screened in a similar manner, with 10% dual screened and the remainder single screened following reconciliation.
Data will be extracted by a single reviewer and checked for accuracy by a second. Data will be extracted on: 2 Eurordis. Survey of the delay in
diagnosis for 8 rare diseases in Europe (’Eurordiscare 2’). 2009.
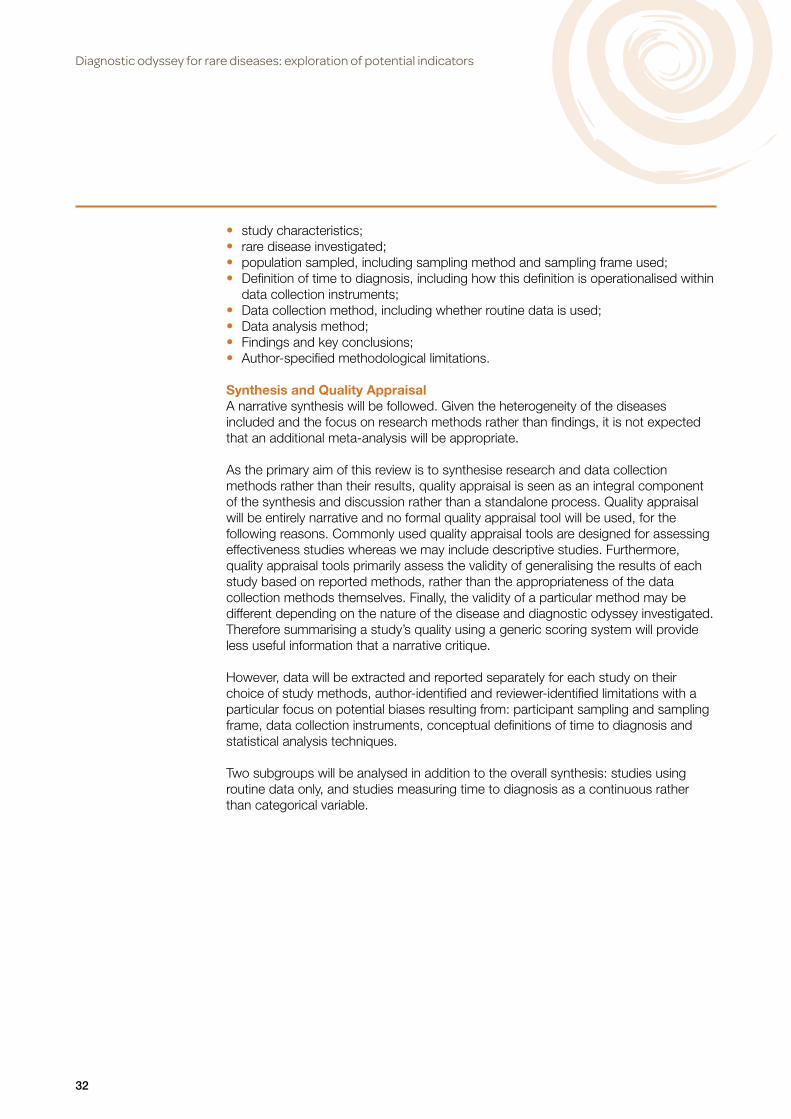
Diagnostic odyssey for rare diseases: exploration of potential indicators
32
• study characteristics; • rare disease investigated; • population sampled, including sampling method and sampling frame used; • Definition of time to diagnosis, including how this definition is operationalised within
data collection instruments; • Data collection method, including whether routine data is used; • Data analysis method; • Findings and key conclusions; • Author-specified methodological limitations.
Synthesis and Quality AppraisalA narrative synthesis will be followed. Given the heterogeneity of the diseases included and the focus on research methods rather than findings, it is not expected that an additional meta-analysis will be appropriate.
As the primary aim of this review is to synthesise research and data collection methods rather than their results, quality appraisal is seen as an integral component of the synthesis and discussion rather than a standalone process. Quality appraisal will be entirely narrative and no formal quality appraisal tool will be used, for the following reasons. Commonly used quality appraisal tools are designed for assessing effectiveness studies whereas we may include descriptive studies. Furthermore, quality appraisal tools primarily assess the validity of generalising the results of each study based on reported methods, rather than the appropriateness of the data collection methods themselves. Finally, the validity of a particular method may be different depending on the nature of the disease and diagnostic odyssey investigated. Therefore summarising a study’s quality using a generic scoring system will provide less useful information that a narrative critique.
However, data will be extracted and reported separately for each study on their choice of study methods, author-identified and reviewer-identified limitations with a particular focus on potential biases resulting from: participant sampling and sampling frame, data collection instruments, conceptual definitions of time to diagnosis and statistical analysis techniques.
Two subgroups will be analysed in addition to the overall synthesis: studies using routine data only, and studies measuring time to diagnosis as a continuous rather than categorical variable.

Diagnostic odyssey for rare diseases: exploration of potential indicators
33
Database search strategies
# Concept Search terms Hits (11/9/14) Notes
1 Key focus of review
diagnostic odyssey.mp 71 Included without further filters
2 Rare disease Exp Rare Diseases/ 24431 [MeSH] introduced 2003
3 Rare disease?.mp 49980
4 Orphan disease?.mp 1235
5 ((rare or orphan or low prevalence or low incidence or uncommon or infrequent) adj1 (disease? or illness$ or condition?)).mp
85313
6 Or/2-5 85313
7 Tracer conditions
exp crohn disease/ or exp cystic fibrosis/ or exp Muscular Dystrophy, Duchenne/ or exp Ehlers-Danlos Syndrome/ or exp Marfan syndrome/ or exp Prader-Willi Syndrome/ or exp Tuberous Sclerosis/ or exp Fragile X Syndrome/
222245 Diseases included in Eurordiscare rare diseases survey
8 (crohn or crohn's or cystic fibrosis or duchenne or duchenne's or Ehlers-Danlos or marfan or marfan's or prader willi or tuberous sclerosis or fragile X).mp
280105 Conditions spec. mentioned in Ch3/4 of UKRDS re: early detection/ diagnosis
9 Anemia, Sickle Cell/ or exp Spinal Dysraphism/ or exp Phenylketonurias/ or exp Congenital Hypothyroidism/ or exp Lipid Metabolism, Inborn Errors/ or exp Long QT Syndrome/ or exp Spasms, Infantile/
356880
10 (Sickle cell or spina bifida or phenylkenoturia or congenital hypothyroidism or medium chain acyl-CoA dehydrogenase deficiency or MCADD or MCAD or long QT syndrome or infantile epilepsy).mp
94337
11 Or/6-9 655274
12 Diagnostic odyssey
Exp delayed diagnosis/ 8363
13 ((odyssey? or late or delay$ or prolong$ or long or interval) adj3 (diagnos$ or identif$) or time to diagnosis or lag-time or symptom interval or patient interval).mp
140960
14 ((onset or start$ or duration) adj3 (symptom? or disease or condition or illness)) adj7 diagnos$.mp
17770
15 Or/22-24 155723
16 RD + DO 6 and 15 2745
17 (RD or Tracer) + DO
(6 or 11) and 15 8824
18 OECD exp Australia/ or New Zealand/ or exp Japan/ or korea/ or “republic of korea”/ or Austria/ or Belgium/ or Czech Republic/ or exp Scandinavia/ or Estonia/ or Finland/ or exp France/ or exp Germany/ or Greece/ or Hungary/ or Iceland/ or Ireland/ or exp Italy/ or Luxembourg/or Netherlands/ or Poland/ or Portugal/ or Slovakia/ or Slovenia/ or Spain/ or Switzerland/ or exp Great Britain/ or Israel/ or exp Canada/ or exp United States/
4795730
Medline and Embase:

Diagnostic odyssey for rare diseases: exploration of potential indicators
34
# Concept Search terms Hits (11/9/14) Notes
19 OECD Australia or new Zealand or japan or austria or belgium or (korea not ((democratic adj3 korea) or north korea)) or czech republic or (scandinavia or denmark or norway or Sweden) or estonia or finland or france or germany or greece or hungary or Iceland or (ireland or eire) or italy or luxembourg or (netherlands or holland) or poland or portugal or (slovakia or slovak republic) or slovenia or (spain or balearic islands or canary islands) or switzerland or (great britain or GBR or united kingdom or UK or england or scotland or wales or northern ireland or channel islands or isle of man) or israel or canada or ((united states adj2 america) or united states or USA) or (oecd countr* or “Organisation for Economic Co-operation and Development”).mp.
6337110
20 Or/28-29 6772971
21 RD + DO + OECD
6 and 15 and 20 416
22 (RD or Tracer) + DO + OECD
(6 or 11) and 15 and 20 1582
23 Study design/article type
Exp Case-Control Studies/ or Control Groups/ or Matched-Pair Analysis/ or ((case* adj5 control*) or (case adj3 comparison*) or control group*).ti,ab or case control.tw
1619423
24 cohort studies/ or longitudinal studies/ or follow-up studies/ or prospective studies/ or retrospective studies/ or cohort.ti,ab. or longitudinal.tw or prospective.ti,ab or retrospective.tw or (cohort adj (study or studies)).tw or Cohort analy$.tw or (Follow up adj (study or studies)).tw
3822380
25 Cross-Sectional Studies/ or cross-sectional.ti,ab. or ("prevalence study" or "incidence study" or "prevalence studies" or "incidence studies" or "transversal studies" or "transversal study").ti,ab.
518045
26 "clinical trial".pt. or "clinical trial, phase i".pt. or "clinical trial, phase ii".pt. or clinical trial, phase iii.pt. or clinical trial, phase iv.pt. or controlled clinical trial.pt. or "multicenter study".pt. or "randomized controlled trial".pt. or double-blind method/ or clinical trials as topic/ or clinical trials, phase i as topic/ or clinical trials, phase ii as topic/ or clinical trials, phase iii as topic/ or clinical trials, phase iv as topic/ or controlled clinical trials as topic/ or randomized controlled trials as topic/ or early termination of clinical trials as topic/ or multicenter studies as topic/ or ((randomi?ed adj7 trial*) or (controlled adj3 trial*) or (clinical adj2 trial*) or ((single or doubl* or tripl* or treb*) and (blind* or mask*))).ti,ab.
1895823
27 Epidemiologic Studies/ or (observational adj (study or studies)).tw 271211
28 Intervention$ or control$ or evaluat$ or effect?.tw 18567518
29 Or/23-28 20655421
30 Animals/ 6984680
31 Humans/ 28685331
32 30 not (30 and 31) 5104444
33 (News or comment or editorial).pt 1460015
34 comment on.cm 602974
35 29 not (32 or 33 or 34) 18231468
Medline and Embase:

Diagnostic odyssey for rare diseases: exploration of potential indicators
35
# Concept Search terms Hits (11/9/14) Notes
36 RD + DO + OECD + design
29 not (32 or 33 or 34)(6 and 15 and 20 and 35) or 1
318 Embase – 204Medline – 114
37 RD or Tracer) + DO + OECD + design
((6 or 11) and 15 and 20 and 35) or 1 1207 Embase – 848Medline - 359
Medline and Embase:
# Concept Search terms Hits (8/9/14)
1 Key focus of review
diagnostic odyssey.mp. 1
2 Rare disease Rare disease?.mp. 304
3 Orphan disease?.mp. 17
4 ((rare or orphan or low prevalence or low incidence or uncommon or infrequent) adj1 (disease? or illness$ or condition?)).mp.
740
5 or/2-4 740
6 Tracer conditions
exp cystic fibrosis/ or exp Muscular disorders/ or exp Prader Willi Syndrome/ or exp Fragile X Syndrome/
7875
7 (crohn or crohn's or cystic fibrosis or duchenne or duchenne's or Ehlers-Danlos or marfan or marfan's or prader willi or tuberous sclerosis or fragile X).mp.
4198
8 exp Sickle Cell Disease/ or exp Spina Bifida/ or exp Phenylketonuria/ or exp Lipid Metabolism Disorders/
1867
9 (Sickle cell or spina bifida or phenylkenoturia or congenital hypothyroidism or medium chain acyl-CoA dehydrogenase deficiency or MCADD or mcad or long QT syndrome or infantile epilepsy).mp.
2081
10 or/6-9 12207
11 Diagnostic odyssey
((odyssey? or late or delay$ or prolong$ or long or interval) adj3 (diagnos$ or identif$) or time to diagnosis or lag-time or symptom interval or patient interval).mp
3574
12 ((onset or start$ or duration) adj3 (symptom? or disease or condition or illness)) adj7 diagnos$.mp
438
13 or/11-12 3940
14 (5 and 13) or 1 13
15 ((5 or 10) and 13) or 1 96
PsychINFO:

Diagnostic odyssey for rare diseases: exploration of potential indicators
36
Ap
pen
dix
2 R
esu
lts
of s
yste
mat
ic r
evie
w
Aut
hor-
Yr
Title
Cou
ntry
Rar
e d
isea
ses(
s)
Sam
ple
si
ze
Pro
sp/r
etro
Ro
utin
e/d
e no
vo
Dat
aCo
ll m
etho
d
Sam
plin
g F
ram
e
Sta
rtin
g p
oin
t: T
TD
End
ing
po
int:
TT
D
Find
ings
and
ke
y co
nclu
sion
s
Byg
um 2
013
Acq
uire
d an
gioe
dem
a--o
ccur
renc
e,
clin
ical
feat
ures
and
ass
ocia
ted
diso
rder
s in
a D
anis
h na
tionw
ide
patie
nt c
ohor
t
Den
mar
k
Acq
uire
d
Ang
ioed
ema
8 R
etro
spec
tive
De
novo
Clin
ical
cas
e no
te re
view
,D
irect
clin
ical
exa
min
atio
n/hi
stor
y, P
atie
nt/f
amily
qu
estio
nnai
re
Hos
pita
l rec
ords
Ons
et o
f sym
ptom
s
Dia
gnos
is
The
mea
n du
ratio
n fro
m th
e on
set o
f sym
ptom
s to
the
diag
nosi
s of
AA
E w
as 1
yea
r an
d 8
mon
ths
(0 m
onth
s to
5 y
ears
).
Eve
nsen
200
6
Epi
dem
iolo
gy a
nd o
utco
me
of a
dult-
onse
t Stil
l’s d
isea
se in
Nor
ther
n N
orw
ay
Nor
way
Ad
ult-
ons
et S
till’
s d
isea
se
13R
etro
spec
tive
De
novo
Clin
ical
cas
e no
te re
view
Hos
pita
l rec
ords
Not
spe
cifie
d
Dia
gnos
is
Mea
n di
agno
stic
del
ay w
as 5
.4
mon
ths
(rang
e 0.
5–18
).
Hub
er 2
010
[Alp
ha1-
antit
ryps
in d
efici
ency
in
Aus
tria
: ana
lysi
s of
the
Aus
tria
n A
lpha
1-in
tern
atio
nal-r
egis
try
data
base
]
Aus
tria
Alp
ha1-
anti
tryp
sin
defi
cien
cy
139
Ret
rosp
ectiv
e
Rou
tine
Reg
istr
y
Dis
ease
regi
stry
Age
at o
nset
of
resp
irato
ryco
mpl
aint
s
Age
at d
iagn
osis
The
mea
n du
ratio
n be
twee
n th
e on
set o
f sym
ptom
s an
d th
e fin
al
diag
nosi
s w
as 6
.5 y
ears
.
Gre
ulic
h 20
13
Alp
ha1-
antit
ryps
in d
efici
ency
-
diag
nost
ic te
stin
g an
d di
seas
e aw
aren
ess
in G
erm
any
and
Italy
Ger
man
y, It
aly
Alp
ha1-
anti
tryp
sin
defi
cien
cy
Not
su
pplie
dP
rosp
ectiv
e
Rou
tine
Reg
istr
y
Dis
ease
regi
stry
Sho
win
g sy
mpt
oms
of d
isea
se
Rec
eivi
ng a
diag
nost
ic te
st/t
est
resu
lt co
mm
unic
ated
The
med
ian
time
inte
rval
be
twee
n th
e on
set o
f sym
ptom
s an
d di
agno
sis
was
6 y
ears
(IQ
R
11; r
ange
, 0-4
0) a
nd 7
yea
rs(IQ
R, 1
3; r
ange
, 0-7
3).
Ro
cche
tti 2
012
Mod
elin
g de
lay
to d
iagn
osis
for
Am
yotr
ophi
c la
tera
l scl
eros
is: U
nder
repo
rtin
g an
d in
cide
nce
estim
ates
Italy
Am
ytro
phi
c la
tera
l sc
lero
sis
1799
Pro
spec
tive
Rou
tine
Reg
istr
y
Dis
ease
regi
stry
Dat
e of
firs
t oc
curr
ence
of
sym
ptom
s th
at c
anbe
une
quiv
ocal
lylin
ked
to th
edi
seas
e
Dia
gnos
is
Mea
n de
lay
to d
iagn
osis
from
sy
pmto
m o
nset
is 4
58 d
ays
(SE
=
11.
53);
med
ian
dela
y is
316
da
ys.
Cro
w 1
997
Bat
ten
dise
ase
in th
e w
est o
f S
cotla
nd19
74-1
995
incl
udin
g fiv
e ca
ses
of th
e ju
veni
le fo
rm w
ith g
ranu
lar
osm
ioph
ilic
Sco
tland
Bat
ten
Dis
ease
/ne
uro
nal c
ero
id
lipo
fusc
ino
sis
12R
etro
spec
tive
De
novo
Clin
ical
cas
e no
te re
view
Clin
ical
dat
abas
e
Age
at w
hich
sym
ptom
s w
ere
first
not
ed
Age
at d
iagn
osis
Mea
n de
lay
to d
iagn
osis
from
sy
pmto
m o
nset
is 4
58 d
ays
(SE
=
11.
53);
med
ian
dela
y is
316
da
ys.

Diagnostic odyssey for rare diseases: exploration of potential indicators
37
Aut
hor-
Yr
Title
Cou
ntry
Rar
e d
isea
ses(
s)
Sam
ple
si
ze
Pro
sp/r
etro
Ro
utin
e/d
e no
vo
Dat
aCo
ll m
etho
d
Sam
plin
g F
ram
e
Sta
rtin
g p
oin
t: T
TD
End
ing
po
int:
TT
D
Find
ings
and
ke
y co
nclu
sion
s
Anw
ar 2
013
Phe
noty
ping
adu
lts w
ith n
on-c
ystic
fibro
sis
bron
chie
ctas
is:
A p
rosp
ectiv
e ob
serv
atio
nal c
ohor
t st
udy
Eng
land
Bro
nchi
ecta
sis
189
Pro
spec
tive
De
novo
Dire
ct c
linic
alex
amin
atio
n/hi
stor
yA
ge a
t sym
ptom
onse
t
Age
at d
iagn
osis
Mea
n di
agno
stic
del
ay 1
7 ye
ars.
Exc
elle
nt n
on-in
vasi
ve
diag
nost
ic te
chni
ques
hav
e be
en w
idel
y av
aila
ble
for
two
deca
des,
sug
gest
ing
that
inde
x of
sus
pici
on fo
rth
is c
ondi
tion
rem
ains
low
.
Twis
s 20
05
New
Zea
land
nat
iona
l inc
iden
ce o
fbr
onch
iect
asis
“to
o hi
gh”
for
a de
velo
ped
coun
try
New
Zea
land
Bro
nchi
ecta
sis
65P
rosp
ectiv
e
Rou
tine
Spe
cial
ist q
uest
ionn
aire
,S
urve
illanc
e un
it
Sur
veilla
nce
data
base
Age
at o
nset
of
coug
h
Age
at d
iagn
osis
At d
iagn
osis
(med
ian
5.2
year
s)
40%
of c
ases
had
cou
gh fo
r >
2 ye
ars.
Pilo
-de-
la-F
uent
e 20
11
Cer
ebro
tend
inou
s xa
ntho
mat
osis
in
Spa
in: c
linic
al, p
rogn
ostic
, and
ge
netic
sur
vey
Spa
in
Cer
ebro
tend
ino
usxa
ntho
mat
osi
s
25R
etro
spec
tive
De
novo
Clin
ical
cas
e no
te re
view
,D
irect
clin
ical
exam
inat
ion/
hist
ory
Pat
ient
s di
agno
sed
wat
the
mai
n re
fere
nce
cent
res
for
gene
tic d
iagn
osis
of C
TX in
Spa
in
Age
at fi
rst
neur
olog
ical
sym
ptom
/pre
sent
ing
sym
ptom
Dia
gnos
is
An
aver
age
dela
y of
19
year
s w
as o
bser
ved
betw
een
sym
ptom
on
set a
nd c
linic
al d
iagn
osis
(ra
nge
2–44
). Th
is lo
ng d
elay
m
ay b
e pa
rtia
lly b
ecau
se o
f the
he
tero
gene
ity o
f neu
rolo
gica
l sy
mpt
oms
that
cha
ract
eriz
e C
TX,
the
lack
of s
peci
ficity
of e
arly
fe
atur
es (d
iarr
hea,
cat
arac
ts),
and
the
unaw
aren
ess
of ra
re d
isea
ses
in c
linic
al p
ract
ice.
Jank
ovi
c 20
11
Rat
iona
le a
nd d
esig
n of
a
pros
pect
ive
stud
y: C
ervi
cal D
ysto
nia
Pat
ient
Reg
istr
y fo
r O
bser
vatio
n of
O
naB
otul
inum
toxi
nA E
ffica
cy (C
D
PR
OB
E)
US
A
Cer
vica
l Dys
toni
a
609
Pro
spec
tive
Rou
tine
Pat
ient
/fam
ilyqu
estio
nnai
re o
r st
ruct
ured
inte
rvie
w
Dis
ease
regi
stry
Sym
ptom
ons
et
Dia
gnos
is
Tim
e to
dia
gnos
is 5
.4 ±
8.6
ye
ars.
Per
etti
200
9
Chy
lom
icro
n re
tent
ion
dise
ase:
A
long
term
stu
dy o
f tw
o co
hort
s
Fran
ce, C
anad
a
Chy
lom
icro
n re
tent
ion
dis
ease
/A
nder
son’
s d
isea
se
16R
etro
spec
tive
De
novo
Clin
ical
cas
e no
te re
view
Hos
pita
l rec
ords
Age
at o
nset
of
sym
ptom
s
Dia
gnos
is
Del
ay in
dia
gnos
is w
as
cons
ider
ably
long
er in
the
Fren
ch
coho
rt (6
.3 ±
1.3
yea
rs) c
ompa
red
to th
e C
anad
ian
coho
rt (1
.3 ±
0.0
4 ye
ars)
. Thi
s de
lay
was
likel
y du
e to
la
ck o
f aw
aren
ess
for t
he d
isea
se
and
perh
aps
to p
oor a
cces
sibi
lity
to a
com
pete
nt g
astro
ente
rolo
gy
serv
ice.

Diagnostic odyssey for rare diseases: exploration of potential indicators
38
Aut
hor-
Yr
Title
Cou
ntry
Rar
e d
isea
ses(
s)
Sam
ple
si
ze
Pro
sp/r
etro
Ro
utin
e/d
e no
vo
Dat
aCo
ll m
etho
d
Sam
plin
g F
ram
e
Sta
rtin
g p
oin
t: T
TD
End
ing
po
int:
TT
D
Find
ings
and
ke
y co
nclu
sion
s
Kap
oo
r 20
10
Idio
path
ic s
yste
mic
cap
illary
leak
synd
rom
e (C
lark
son’
s di
seas
e): t
he
May
o cl
inic
exp
erie
nce
US
A
Cla
rkso
n’s
dis
ease
/Id
iop
athi
csy
stem
ic c
apill
ary
leak
syn
dro
me
24R
etro
spec
tive
De
novo
Clin
ical
cas
e no
te re
view
Hos
pita
l rec
ords
Ons
et o
f sym
ptom
s
Dia
gnos
is
Med
ian
time
to d
iagn
osis
from
sy
mpt
om o
nset
was
1.1
yea
rs
(inte
rqua
rtile
ran
ge, 0
.5-4
.1
year
s). I
n 3
patie
nts,
a fo
rmal
di
agno
sis
was
mad
e m
ore
than
5 y
ears
afte
r th
e on
set o
f sy
mpt
oms
(afte
r 5.
5, 8
.0, a
nd
32.0
yea
rs).
dela
y in
dia
gnos
is
and/
or m
isdi
agno
sis
led
to
incr
ease
d pa
tient
mor
bidi
ty in
ou
r se
ries.
Kac
hko
200
8
Com
plex
regi
onal
pai
n sy
ndro
mes
inch
ildre
n an
d ad
oles
cent
s
Isra
el
Co
mp
lex
reg
iona
l p
ain
synd
rom
e
14R
etro
spec
tive
De
novo
Clin
ical
cas
e no
te re
view
Hos
pita
l rec
ords
Ons
et o
f sym
ptom
s/
initi
atin
g ev
ent,
time
from
see
king
m
edic
al h
elp
Ref
erra
l to
pain
clin
ic
The
med
ian
time
from
ons
et o
f sy
mpt
oms
to s
eeki
ng m
edic
al
help
was
4.4
6 w
eeks
(ran
ge 2
–
82 w
eeks
). Th
e m
edia
n tim
e to
re
ferr
al to
pai
n cl
inic
was
24.
51
wee
ks (r
ange
1.2
– 9
4).
Bad
er-M
euni
er 2
005
Clin
ical
and
labo
rato
ry
man
ifest
atio
ns o
f con
geni
tal
dyse
ryth
ropo
ietic
ane
mia
type
I in
a
coho
rt o
f Fre
nch
child
ren
Fran
ce
Co
ngen
ital
D
yser
ythr
op
oie
tic
Ane
mia
Typ
e I
12R
etro
spec
tive
De
novo
Spe
cial
ist q
uest
ionn
aire
Exi
stin
g co
hort
/stu
dy
sam
ple
Ons
et o
f ana
emia
Cor
rect
dia
gnos
is
The
mea
n tim
e el
apse
d fro
m th
e on
set o
f ane
mia
unt
il th
e co
rrec
t di
agno
sis
was
est
ablis
hed
was
5.
1 ye
ars
(rang
e 0.
2–18
).
Alm
197
8
Con
geni
tal h
ypot
hyro
idis
m in
S
wed
en. I
ncid
ence
and
age
at
diag
nosi
s
Sw
eden
Co
ngen
ital
H
ypo
thyr
oid
ism
112
Ret
rosp
ectiv
e
De
novo
Clin
ical
cas
e no
te re
view
Birt
h, a
ge o
f ons
etof
sym
ptom
s
Dia
gnos
is
The
diag
nosi
s w
as d
elay
ed u
ntil
afte
r an
age
of t
hree
mon
ths
in
52 %
of t
he c
ases
. The
age
at
onse
t of s
ympt
oms
com
patib
lew
ith h
ypot
hyro
idis
m c
ould
be
eva
luat
ed in
84
of th
e 11
2 ch
ildre
n w
ith C
H. O
f the
se,
76 (9
1 %
) had
one
or
mor
e sy
mpt
oms
befo
re th
e ag
e of
th
ree
mon
ths.
This
fact
sup
port
s th
e vi
ew th
at m
ass
scre
enin
g of
ne
wbo
rns
for
cong
enita
lhy
poth
yroi
dism
has
to b
e in
trod
uced
in S
wed
en.

Diagnostic odyssey for rare diseases: exploration of potential indicators
39
Aut
hor-
Yr
Title
Cou
ntry
Rar
e d
isea
ses(
s)
Sam
ple
si
ze
Pro
sp/r
etro
Ro
utin
e/d
e no
vo
Dat
aCo
ll m
etho
d
Sam
plin
g F
ram
e
Sta
rtin
g p
oin
t: T
TD
End
ing
po
int:
TT
D
Find
ings
and
ke
y co
nclu
sion
s
Wilc
ken
1983
Dia
gnos
tic d
elay
in c
ystic
fibr
osis
: Le
sson
s fro
m n
ewbo
rn s
cree
ning
Aus
tral
ia
Cys
tic
Fib
rosi
s
33R
etro
spec
tive
De
novo
Clin
ical
cas
e no
te re
view
, D
irect
clin
ical
exam
inat
ion/
hist
ory
Not
spe
cifie
d
Age
of i
nitia
lpr
esen
tatio
n to
med
ical
att
entio
n
Age
at d
iagn
osis
Mea
n de
lay
betw
een
pres
enta
tion
with
sym
ptom
s an
d di
agno
sis
of C
F in
clin
ical
ly
diag
nose
d in
fant
s w
as 2
.6
year
s. O
ur in
vest
igat
ion
show
s th
at w
ithou
t scr
eeni
ng th
ere
are
appr
ecia
ble
dela
ys b
etw
een
onse
t of s
ympt
oms
and
diag
nosi
s.
Lai 2
005
The
surv
ival
adv
anta
ge o
f pat
ient
s w
ith c
ystic
fibr
osis
dia
gnos
ed
thro
ugh
neon
atal
scr
eeni
ng:
Evi
denc
e fro
m th
e U
nite
d S
tate
s cy
stic
fibr
osis
Fou
ndat
ion
Reg
istr
y da
ta
US
A
Cys
tic
Fib
rosi
s
2769
2U
ncle
ar/n
o in
fo
Rou
tine
Reg
istr
y
Dis
ease
regi
stry
Birt
h
Dia
gnos
is
With
in M
I and
SC
REE
N
grou
ps, g
reat
er th
an 5
0% w
ere
diag
nose
d be
fore
1 m
onth
, an
d gr
eate
r tha
n 75
% w
ere
diag
nose
d be
fore
3 m
onth
s of
lif
e (T
able
I). I
n co
ntra
st, l
ess
than
20%
of p
atie
nts
in th
e S
YM
PTO
Mgr
oup
wer
e di
agno
sed
befo
re 3
mon
ths,
and
alm
ost h
alf
wer
e di
agno
sed
afte
r age
1 y
ear.
San
der
s 20
12
Com
parin
g ag
e of
cys
tic fi
bros
is
diag
nosi
s an
d tr
eatm
ent i
nitia
tion
afte
r ne
wbo
rn s
cree
ning
with
two
com
mon
str
ateg
ies
US
A
Cys
tic
Fib
rosi
s
1288
Unc
lear
/no
info
Rou
tine
Reg
istr
y
Dis
ease
regi
stry
Birt
h
Tim
e of
dia
gnos
is
Com
pare
d to
infa
nts
born
in IR
T/IR
T st
ates
, inf
ants
bor
n in
IRT/
DN
A s
tate
s w
ere
youn
ger
at th
e tim
e of
dia
gnos
is (m
edia
n 2.
3 w
eeks
ver
sus
4.0
wee
ks in
IRT/
IRT
stat
es, p
b0.0
01).
Farr
ell 2
007
Dia
gnos
is o
f cys
tic fi
bros
is in
the
Rep
ublic
of I
rela
nd: E
pide
mio
logy
an
d co
sts
Irela
nd
Cys
tic
Fib
rosi
s
649
Unc
lear
/no
info
Rou
tine
Reg
istr
y
Dis
ease
regi
stry
Birt
h
Dia
gnos
is
The
aver
age
age
of d
iagn
osis
w
as d
elay
ed to
24.
6 m
onth
s.
Long
er d
elay
s w
hen
diag
nosi
s fo
llow
ed re
spira
tory
sym
ptom
s,
rath
er th
an g
astr
oint
estin
alsi
gns,
and
als
o in
girl
s co
mpa
red
to b
oys,
par
ticul
arly
thos
e pr
esen
ting
with
resp
irato
ry
sym
ptom
s.

Diagnostic odyssey for rare diseases: exploration of potential indicators
40
Aut
hor-
Yr
Title
Cou
ntry
Rar
e d
isea
ses(
s)
Sam
ple
si
ze
Pro
sp/r
etro
Ro
utin
e/d
e no
vo
Dat
aCo
ll m
etho
d
Sam
plin
g F
ram
e
Sta
rtin
g p
oin
t: T
TD
End
ing
po
int:
TT
D
Find
ings
and
ke
y co
nclu
sion
s
Nic
k Je
rry
2010
Effe
cts
of g
ende
r an
d ag
e at
di
agno
sis
on d
isea
se p
rogr
essi
on in
lo
ng-t
erm
sur
vivo
rs o
f cys
tic fi
bros
is
US
A
Cys
tic
Fib
rosi
s
3120
Pro
spec
tive,
De
novo
, Rou
tine
Clin
ical
cas
e no
te re
view
, Fa
cilit
y da
taba
se, R
egis
try
Dis
ease
regi
stry
Birt
h
Dia
gnos
is
Col
orad
o da
taba
se:
child
hood
diag
nose
d ag
e at
di
agno
sis
rang
ing
from
birt
h to
10
yea
rs (m
edia
n, 2
.0 y
r) an
d an
A
D c
ohor
t (n=
109;
ran
ge, 1
8–84
yr
; med
ian,
52.
0 yr
) CFF
regi
stry
: m
edia
n ag
e at
dia
gnos
is fo
r th
e C
D c
ohor
t (n=
1,43
6) w
as 1
.7
year
s, c
ompa
red
with
37.
4 ye
ars
for
the
AD
coh
ort (
n=1,
178)
, with
ag
e at
dia
gnos
is r
angi
ng fr
om 1
8 to
80.
7 ye
ars
(med
ian,
37.
4 yr
).
Jack
son
2010
Del
ayed
cys
tic fi
bros
is p
rese
ntat
ion
in c
hild
ren
in th
e ab
senc
e of
ne
wbo
rn s
cree
ning
Irela
nd
Cys
tic
Fib
rosi
s
601
Unc
lear
/no
info
Rou
tine
Reg
istr
y
Dis
ease
regi
stry
Birt
h
Dia
gnos
is
Mod
es o
f pre
sent
atio
n w
ere
each
sig
nific
antly
ass
ocia
ted
with
de
laye
d pr
esen
tatio
n. C
hild
ren
with
resp
irato
ry s
ympt
oms
had
the
grea
test
like
lihoo
d of
del
ayed
di
agno
sis
(med
ian
age:
20.
4 m
onth
s), f
ollo
wed
by
thos
ew
ith re
spira
tory
and
ga
stro
inte
stin
al s
ympt
oms
(9.2
mon
ths)
. Gen
der w
as n
ot
sign
ifica
ntly
ass
ocia
ted
with
a
dela
yed
pres
enta
tion
whe
n pr
esen
tatio
n m
ode
was
take
n in
to a
ccou
nt.
Sp
ence
r 19
94
Cys
tic fi
bros
is in
chi
ldre
n fro
m e
thni
cm
inor
ities
in th
e W
est M
idla
nds
Eng
land
Cys
tic
Fib
rosi
s
16U
ncle
ar/n
o in
fo
Rou
tine
Clin
ical
dat
abas
eB
irth
Dia
gnos
is
The
med
ian
age
of d
iagn
osis
w
as s
imila
r in
the
whi
te
Eur
opea
n an
d no
nwhi
te p
atie
nts
(0.4
2 vs
. 0.3
3 ye
ars,
95%
CI f
or
the
diffe
renc
e of
the
med
ians
-0.
15, 0
.37)
.

Diagnostic odyssey for rare diseases: exploration of potential indicators
41
Aut
hor-
Yr
Title
Cou
ntry
Rar
e d
isea
ses(
s)
Sam
ple
si
ze
Pro
sp/r
etro
Ro
utin
e/d
e no
vo
Dat
aCo
ll m
etho
d
Sam
plin
g F
ram
e
Sta
rtin
g p
oin
t: T
TD
End
ing
po
int:
TT
D
Find
ings
and
ke
y co
nclu
sion
s
Cho
ng 2
000
Ret
rosp
ectiv
e es
timat
ion
of th
e bi
rth
prev
alen
ce fo
r de
laye
d on
set
diso
rder
s: a
pplic
atio
n to
cys
tic
fibro
sis
in N
ova
Sco
tia
Can
ada
Cys
tic
Fib
rosi
s
98P
rosp
ectiv
e
Rou
tine
Reg
istr
y
Dis
ease
regi
stry
Birt
h
Dia
gnos
is
It w
as fo
und
that
25
of th
e 77
w
ere
diag
nose
d in
thei
r fir
st
wee
k of
life
, 21
wer
e di
agno
sed
betw
een
one
wee
k an
d th
ree
mon
ths,
17
betw
een
thre
e m
onth
s an
d si
x m
onth
s, a
nd 1
4 be
twee
n si
x m
onth
s an
d on
e ye
ar.
Acc
ordi
ngly,
the
age-
at-d
iagn
osis
pr
obab
ility
estim
ates
for t
hese
tim
e pe
riods
are
0.2
41, 0
.203
, 0.
164
and
0.13
5, re
spec
tivel
y,
with
app
roxi
mat
e st
anda
rd e
rrors
0.
043,
0.0
40, 0
.036
7 an
d 0.
034.
Lim
201
4
Dia
gnos
is o
f cys
tic fi
bros
is in
Lo
ndon
and
Sou
th E
ast E
ngla
nd
befo
re a
nd a
fter
the
intr
oduc
tion
of
new
born
scr
eeni
ng
Eng
land
Cys
tic
Fib
rosi
s
347
Pro
spec
tive
De
novo
Clin
ical
cas
e no
te re
view
,Fa
cilit
y da
taba
se
All
patie
nts
unde
r ca
re o
fon
e of
the
CF
spec
ialis
tce
ntre
s in
the
regi
on
1. A
ge a
t firs
t sy
mpt
oms
2. B
irth
3. A
ge a
t firs
tpr
esen
tatio
n of
C
Frel
ated
sym
ptom
sto
a h
ealth
pr
ofes
sion
al
Dia
gnos
is
Uns
cree
ned
child
ren
- m
edia
n TT
D fr
om in
itial
Sx
= 1
yea
r, 10
%
>6
year
s S
cree
ned
child
ren
- m
edia
n ag
e of
dia
gnos
is 3
w
eeks
.
Pra
pp
hal 1
989
Cys
tic fi
bros
is in
bla
cks
in
Was
hing
ton,
DC
: fifte
en y
ears
’ ex
perie
nce
US
A
Cys
tic
Fib
rosi
s
188
Ret
rosp
ectiv
e
De
novo
Clin
ical
cas
e no
te re
view
Hos
pita
l rec
ords
Ons
et o
f sym
ptom
s
Dia
gnos
is
Ther
e w
ere
no s
tatis
tical
ly
sign
ifica
nt d
iffer
ence
s in
ave
rage
du
ratio
n of
sym
ptom
s pr
ior t
o di
agno
sis
betw
een
blac
ks a
nd
whi
tes
(bla
cks
X =
1.2
6 +
/- 3
.00
year
s; w
hite
s X
= 0
.96
+/-
3.0
3 ye
ars;
p>
0.05
).
Ste
inra
ths
2008
Del
ays
in d
iagn
osin
g cy
stic
fibr
osis
: ca
n w
e fin
d w
ays
to d
iagn
ose
it ea
rlier
?
Can
ada
Cys
tic
Fib
rosi
s
122
Ret
rosp
ectiv
e
De
novo
Clin
ical
cas
e no
te re
view
Hos
pita
l rec
ords
Ons
et o
f sym
ptom
s
Dia
gnos
is
Excl
udin
g th
e ad
ult p
atie
nts
and
patie
nts
with
mec
oniu
m il
eus,
m
ean
age
at d
iagn
osis
of C
F w
as 3
.6 y
ears
, and
mea
n de
lay
in d
iagn
osis
afte
r firs
t sym
ptom
s w
as 2
.1 y
ears
. Con
side
rabl
e de
lays
in d
iagn
osis
of c
hild
ren
with
CF
occu
r whe
n th
e di
seas
e is
iden
tified
sol
ely
on c
linic
al
pres
enta
tion.

Diagnostic odyssey for rare diseases: exploration of potential indicators
42
Aut
hor-
Yr
Title
Cou
ntry
Rar
e d
isea
ses(
s)
Sam
ple
si
ze
Pro
sp/r
etro
Ro
utin
e/d
e no
vo
Dat
aCo
ll m
etho
d
Sam
plin
g F
ram
e
Sta
rtin
g p
oin
t: T
TD
End
ing
po
int:
TT
D
Find
ings
and
ke
y co
nclu
sion
s
Bal
nave
s 19
95
The
impa
ct o
f new
born
scr
eeni
ng
on c
ystic
fibr
osis
test
ing
in V
icto
ria,
Aus
tral
ia
Aus
tral
ia
Cys
tic
Fib
rosi
s
167
Ret
rosp
ectiv
e
De
novo
Clin
ical
cas
e no
te re
view
,Fa
cilit
y da
taba
se
Adm
inis
trat
ive
data
base
,H
ospi
tal r
ecor
ds
Birt
h
Dia
gnos
is
The
age
at d
iagn
osis
bef
ore
1989
var
ied
from
1 to
10
year
s.
In g
ener
al, t
his
time
is n
ow
appr
oxim
atel
y si
x w
eeks
, whe
n th
e sw
eat t
ests
are
per
form
ed in
A
F508
het
eroz
ygou
s in
fant
s.
Farr
ell P
hilip
200
3
Bro
ncho
pulm
onar
y di
seas
e in
ch
ildre
n w
ith c
ystic
fibr
osis
afte
r ea
rly o
r de
laye
d di
agno
sis
US
A
Cys
tic
Fib
rosi
s
103
Pro
spec
tive
De
novo
Clin
ical
cas
e no
te re
view
Exi
stin
g co
hort
/stu
dy
sam
ple
Birt
h
Dia
gnos
is
In th
e sc
reen
ed g
roup
(56
patie
nts)
, dia
gnos
is w
as m
ade
at a
you
nger
age
of 1
2.4
wee
ks,
com
pare
d w
ith th
e di
agno
sis
in c
ontr
ol g
roup
(47
cont
rol
patie
nts)
at t
he a
ge o
f 95.
8 w
eeks
(p<
0.00
1).
Tad
ic 2
012
Dop
a-re
spon
sive
dys
toni
a re
visi
ted:
Dia
gnos
tic d
elay
, res
idua
l sig
ns, a
ndno
nmot
or s
igns
Ger
man
y
Do
pa-
resp
onsi
vedy
ston
ia
23R
etro
spec
tive
De
novo
Clin
ical
cas
e no
te re
view
,D
irect
clin
ical
exam
inat
ion/
hist
ory,
Pat
ient
/fam
ilyqu
estio
nnai
re o
r st
ruct
ured
inte
rvie
w
Hos
pita
l rec
ords
Age
at o
nset
Age
at d
iagn
osis
Thea
vera
ge (S
D) d
elay
in
diag
nosi
s w
as 1
5.5
(16.
3) y
ears
.
Mo
ham
ed 2
000
Del
ayed
dia
gnos
is o
f Duc
henn
e m
uscu
lar
dyst
roph
y
Eng
land
Duc
henn
e m
uscu
lar
dys
tro
phy
21R
etro
spec
tive
Rou
tine
Clin
ical
cas
e no
te re
view
Hos
pita
l rec
ords
Age
at fi
rst
spec
ialis
t (no
n-G
P)
med
ical
con
tact
Age
at d
iagn
osis
Mea
n ag
e at
dia
gnos
is fo
r tho
se
not p
icke
d up
by
a sc
reen
ing
prog
ram
me
or u
nder
the
age
of
6 m
onth
s w
as 4
.5 y
ears
(ran
ge
1.9-
6.8)
. Age
at fi
rst s
peci
alis
t pr
esen
tatio
n) w
as 1
.9 y
ears
(1.3
-4.2
yea
rs).
Van
Rui
ten
2014
Impr
ovin
g th
e di
agno
sis
of
duch
enne
mus
cula
r dy
stro
phy
Eng
land
Duc
henn
e m
uscu
lar
dys
tro
phy
20R
etro
spec
tive
De
novo
Clin
ical
cas
e no
te re
view
Sin
gle
tert
iary
cen
tre
1. A
ge o
f firs
tsy
mpt
oms
2. F
irst e
ngag
emen
t w
ith a
hea
lth
prof
essi
onal
Dia
gnos
is
The
tota
l del
ay fr
om p
aren
tal
conc
ern
to d
iagn
osis
was
19.
2 (4
–50)
mon
ths.
impr
ovem
ent
in th
e ag
e of
dia
gnos
is o
f DM
D
alth
ough
ther
e co
ntin
ues
to b
ea
dela
y in
pre
sent
atio
n to
a h
ealth
prof
essi
onal
and
a d
elay
in
obta
inin
g a
CK
test
.
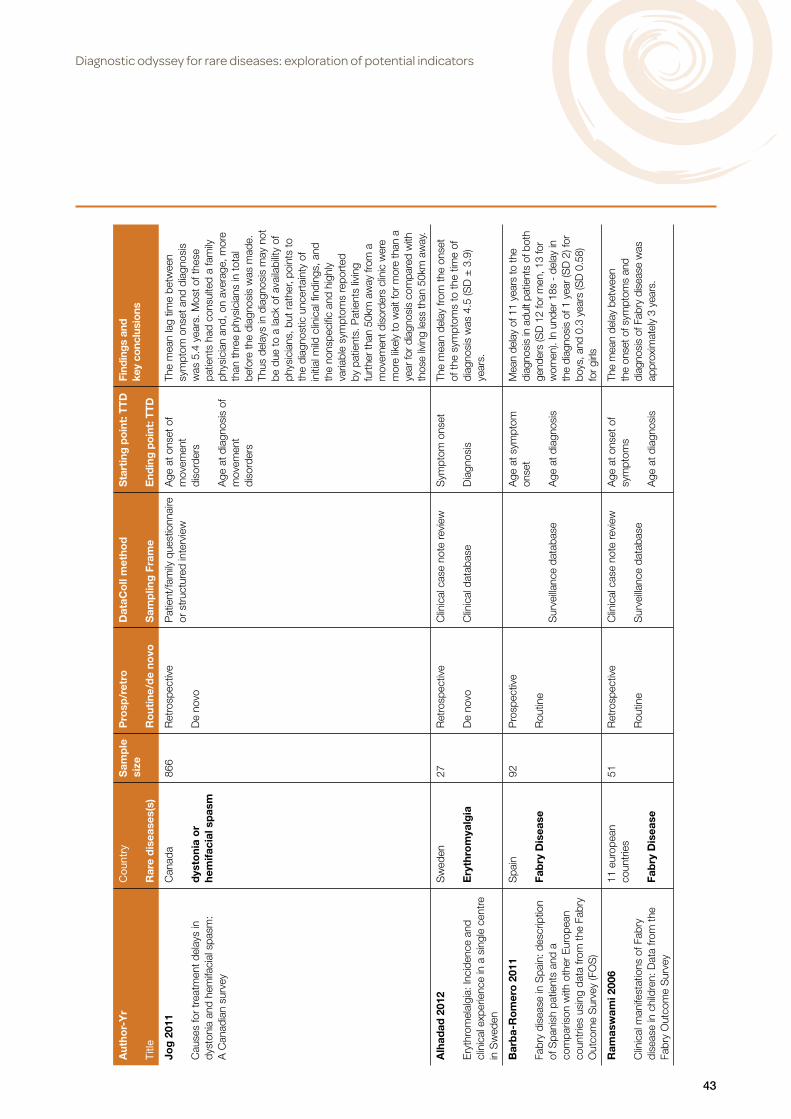
Diagnostic odyssey for rare diseases: exploration of potential indicators
43
Aut
hor-
Yr
Title
Cou
ntry
Rar
e d
isea
ses(
s)
Sam
ple
si
ze
Pro
sp/r
etro
Ro
utin
e/d
e no
vo
Dat
aCo
ll m
etho
d
Sam
plin
g F
ram
e
Sta
rtin
g p
oin
t: T
TD
End
ing
po
int:
TT
D
Find
ings
and
ke
y co
nclu
sion
s
Jog
201
1
Cau
ses
for
trea
tmen
t del
ays
in
dyst
onia
and
hem
ifaci
al s
pasm
: A
Can
adia
n su
rvey
Can
ada
dys
toni
a o
r he
mifa
cial
sp
asm
866
Ret
rosp
ectiv
e
De
novo
Pat
ient
/fam
ily q
uest
ionn
aire
or
str
uctu
red
inte
rvie
wA
ge a
t ons
et o
fm
ovem
ent
diso
rder
s
Age
at d
iagn
osis
of
mov
emen
tdi
sord
ers
The
mea
n la
g tim
e be
twee
n sy
mpt
om o
nset
and
dia
gnos
is
was
5.4
yea
rs. M
ost o
f the
se
patie
nts
had
cons
ulte
d a
fam
ily
phys
icia
n an
d, o
n av
erag
e, m
ore
than
thre
e ph
ysic
ians
in to
tal
befo
re th
e di
agno
sis
was
mad
e.
Thus
del
ays
in d
iagn
osis
may
not
be
due
to a
lack
of a
vaila
bilit
y of
ph
ysic
ians
, but
rat
her,
poin
ts to
th
e di
agno
stic
unc
erta
inty
of
initi
al m
ild c
linic
al fi
ndin
gs, a
nd
the
nons
peci
fic a
nd h
ighl
y va
riabl
e sy
mpt
oms
repo
rted
by
pat
ient
s. P
atie
nts
livin
g fu
rthe
r tha
n 50
km a
way
from
a
mov
emen
t dis
orde
rs c
linic
wer
em
ore
likel
y to
wai
t for
mor
e th
an a
ye
ar fo
r dia
gnos
is c
ompa
red
with
th
ose
livin
g le
ss th
an 5
0km
aw
ay.
Alh
adad
201
2
Ery
thro
mel
algi
a: In
cide
nce
and
clin
ical
exp
erie
nce
in a
sin
gle
cent
re
in S
wed
en
Sw
eden
Ery
thro
mya
lgia
27R
etro
spec
tive
De
novo
Clin
ical
cas
e no
te re
view
Clin
ical
dat
abas
e
Sym
ptom
ons
et
Dia
gnos
is
The
mea
n de
lay
from
the
onse
t of
the
sym
ptom
s to
the
time
of
diag
nosi
s w
as 4
.5 (S
D ±
3.9
) ye
ars.
Bar
ba-
Ro
mer
o 2
011
Fabr
y di
seas
e in
Spa
in: d
escr
iptio
n of
Spa
nish
pat
ient
s an
d a
com
paris
on w
ith o
ther
Eur
opea
n co
untr
ies
usin
g da
ta fr
om th
e Fa
bry
Out
com
e S
urve
y (F
OS
)
Spa
in
Fab
ry D
isea
se
92P
rosp
ectiv
e
Rou
tine
Sur
veilla
nce
data
base
Age
at s
ympt
omon
set
Age
at d
iagn
osis
Mea
n de
lay
of 1
1 ye
ars
to th
edi
agno
sis
in a
dult
patie
nts
of b
oth
gend
ers
(SD
12
for m
en, 1
3 fo
rw
omen
). In
und
er 1
8s -
del
ay in
th
e di
agno
sis
of 1
yea
r (S
D 2
) for
bo
ys, a
nd 0
.3 y
ears
(SD
0.5
8)
for g
irls
Ram
asw
ami 2
006
Clin
ical
man
ifest
atio
ns o
f Fab
ry
dise
ase
in c
hild
ren:
Dat
a fro
m th
e Fa
bry
Out
com
e S
urve
y
11 e
urop
ean
coun
trie
s
Fab
ry D
isea
se
51R
etro
spec
tive
Rou
tine
Clin
ical
cas
e no
te re
view
Sur
veilla
nce
data
base
Age
at o
nset
of
sym
ptom
s
Age
at d
iagn
osis
The
mea
n de
lay
betw
een
the
onse
t of s
ympt
oms
and
diag
nosi
s of
Fab
ry d
isea
se w
as
appr
oxim
atel
y 3
year
s.

Diagnostic odyssey for rare diseases: exploration of potential indicators
44
Aut
hor-
Yr
Title
Cou
ntry
Rar
e d
isea
ses(
s)
Sam
ple
si
ze
Pro
sp/r
etro
Ro
utin
e/d
e no
vo
Dat
aCo
ll m
etho
d
Sam
plin
g F
ram
e
Sta
rtin
g p
oin
t: T
TD
End
ing
po
int:
TT
D
Find
ings
and
ke
y co
nclu
sion
s
Meh
ta 2
004
Fabr
y di
seas
e de
fined
: Bas
elin
e cl
inic
al m
anife
stat
ions
of 3
66
patie
nts
in th
e Fa
bry
Out
com
e S
urve
y
11 e
urop
ean
coun
trie
s
Fab
ry D
isea
se
366
Ret
rosp
ectiv
e
Rou
tine
Clin
ical
cas
e no
te re
view
Sur
veilla
nce
data
base
Ons
et o
f sym
ptom
s
Dia
gnos
is
Mea
n de
lay
from
ons
et o
f sy
mpt
oms
to c
orre
ct d
iagn
osis
w
as 1
3·7
and
16·3
yea
rs in
m
ales
and
fem
ales
, res
pect
ivel
y.
For s
ome
patie
nts
ther
e w
as
a de
lay
of >
50
year
s be
fore
co
rrec
t dia
gnos
is, a
nd d
elay
s of
> 2
0 ye
ars
betw
een
onse
t of
sym
ptom
s an
d di
agno
sis
wer
e co
mm
on.
And
riko
s 20
10
Evo
lutio
n of
Fab
ry d
isea
se in
mal
epa
tient
s: th
e G
reek
exp
erie
nce
Gre
ece
Fab
ry D
isea
se
16P
rosp
ectiv
e
De
novo
Dire
ct c
linic
alex
amin
atio
n/hi
stor
y
Not
spe
cifie
d
Age
at o
nset
of
sym
ptom
s
Age
of d
iagn
osis
Dia
gnos
is w
as d
elay
ed fo
r a
mea
n of
abo
ut 1
8 ye
ars.
Luig
etti
201
3
Ttr-
rela
ted
amyl
oid
neur
opat
hy:
Clin
ical
, ele
ctro
phys
iolo
gica
l and
pa
thol
ogic
al fi
ndin
gs in
fifte
en
unre
late
d pa
tient
s
Italy
Fam
ilial
am
ylo
idp
oly
neur
op
athy
15R
etro
spec
tive
De
novo
Clin
ical
cas
e no
te re
view
Sym
ptom
ons
et
Dia
gnos
is
Mea
n ag
e at
ons
et w
as 6
6.1
± 4
.8; m
ean
age
at d
iagn
osis
w
as 7
0.3
± 5
.2; m
ean
inte
rval
be
twee
n sy
mpt
oms
onse
t and
di
agno
sis
was
4 y
ears
(4.3
±2.
4).
The
dela
y fro
m s
ympt
om o
nset
to
final
dia
gnos
is c
ould
be
part
ially
ex
plai
ned
by th
e di
ffere
nce
betw
een
the
phen
otyp
e th
at
we
obse
rved
and
the
clas
sica
l ‘‘P
ortu
gues
e’’ o
ne.

Diagnostic odyssey for rare diseases: exploration of potential indicators
45
Aut
hor-
Yr
Title
Cou
ntry
Rar
e d
isea
ses(
s)
Sam
ple
si
ze
Pro
sp/r
etro
Ro
utin
e/d
e no
vo
Dat
aCo
ll m
etho
d
Sam
plin
g F
ram
e
Sta
rtin
g p
oin
t: T
TD
End
ing
po
int:
TT
D
Find
ings
and
ke
y co
nclu
sion
s
Bai
ley
Do
nald
200
9
No
chan
ge in
the
age
of d
iagn
osis
fo
r fra
gile
X s
yndr
ome:
Fin
ding
s fro
m a
nat
iona
l par
ent s
urve
y
US
A
Frag
ile X
S
ynd
rom
e
249
Ret
rosp
ectiv
e
De
novo
Pat
ient
/fam
ily q
uest
ionn
aire
or
str
uctu
red
inte
rvie
wFi
rst c
once
rn b
yso
meo
ne a
bout
the
child
, tim
e th
at a
prof
essi
onal
firs
tco
nfirm
ed a
deve
lopm
enta
lde
lay
Con
firm
ed d
iagn
osis
of
Fra
gile
X
On
aver
age,
som
eone
firs
t be
cam
e co
ncer
ned
at 1
1.6
mon
ths.
A p
rofe
ssio
nal c
onfir
med
a
dela
y 8
mon
ths
late
r. S
oon
ther
eafte
r, ch
ildre
n be
gan
early
inte
rven
tion.
The
dia
gnos
is o
f FXS
was
con
firm
ed 1
2 to
14
mon
ths
late
r. Th
e av
erag
e le
ngth
of
time
betw
een
first
con
cern
and
di
agno
sis
was
24
mon
ths.
Chi
ldre
n w
ith m
ore
co-o
ccur
ring
cond
ition
s w
ere
give
n th
e di
agno
sis
earli
er (B
=1.
64;
SE=
0.76
; P=
.03)
and
had
shor
ter d
elay
s be
twee
n fir
st
conc
ern
and
diag
nosi
s (B
=1.
81;
SE=
0.73
; P=
.01)
.
Bai
ley
Do
nald
200
0
Fam
ily e
xper
ienc
es a
nd fa
ctor
s as
soci
ated
with
the
diag
nosi
s of
fra
gile
X s
yndr
ome
US
A
Frag
ile X
S
ynd
rom
e
41R
etro
spec
tive
De
novo
Pat
ient
/fam
ily q
uest
ionn
aire
or
str
uctu
red
inte
rvie
wIn
itial
con
cern
abou
t dev
elop
men
tex
pres
sed
byso
meo
ne/d
iagn
osis
of d
evel
opm
enta
lde
lay
mad
e
Dia
gnos
is o
f Fra
gile
X m
ade
The
aver
age
fam
ily h
ad
deve
lopm
enta
l con
cern
s at
9
mon
ths
of a
ge. D
evel
opm
enta
l de
lay
was
det
erm
ined
at 2
4 m
onth
s on
ave
rage
and
Fra
gile
Xw
as d
iagn
osed
at 3
5 m
onth
s on
aver
age.
Cen
ters
fo
r D
isea
se 2
002
Del
ayed
dia
gnos
is o
f fra
gile
X
synd
rom
e -
Uni
ted
Sta
tes,
19
90-1
999
US
A
Frag
ile X
S
ynd
rom
e
15R
etro
spec
tive
De
novo
Pat
ient
/fam
ily q
uest
ionn
aire
or
str
uctu
red
inte
rvie
w
Exi
stin
g co
hort
/stu
dy
sam
ple
Firs
t con
cern
sab
out t
he c
hild
’sde
velo
pmen
t or
beha
viou
r
Dia
gnos
is
Med
ian
age
at th
e im
te s
omeo
ne
first
bec
ame
conc
erne
d ab
out
the
child
’s d
evel
opm
ent/
beha
viou
r: 12
mon
ths
(rang
e 0-
50 m
onth
s). A
ge a
t di
agno
sis
- m
edia
n 26
mon
ths,
ra
nge
6-10
1 m
onth
s).

Diagnostic odyssey for rare diseases: exploration of potential indicators
46
Aut
hor-
Yr
Title
Cou
ntry
Rar
e d
isea
ses(
s)
Sam
ple
si
ze
Pro
sp/r
etro
Ro
utin
e/d
e no
vo
Dat
aCo
ll m
etho
d
Sam
plin
g F
ram
e
Sta
rtin
g p
oin
t: T
TD
End
ing
po
int:
TT
D
Find
ings
and
ke
y co
nclu
sion
s
Bla
nkar
t 20
12
Doe
s he
alth
care
infra
stru
ctur
e ha
ve a
n im
pact
on
dela
y in
di
agno
sis
and
surv
ival
?
Ger
man
y
Gas
tric
Can
cer
2175
Pro
spec
tive
Rou
tine
Adm
inis
trat
ive
data
base
Adm
inis
trat
ive
data
base
Ons
et o
f dis
ease
/fir
st s
ympt
oms
Initi
al d
iagn
osis
The
likel
ihoo
d of
bei
ng d
iagn
osed
in
crea
sed
with
an
incr
ease
in g
ener
al
prac
titio
ners
(p <
0.0
001)
and
ga
stro
ente
rolo
gist
s (p
< 0
.000
1) in
ru
ral a
reas
. In
urba
n ar
eas
a hi
gher
de
nsity
of g
ener
al p
ract
ition
ers
redu
ced
dela
y in
dia
gnos
is (p
=
0.02
62),
whi
le a
hig
her
dens
ity o
f ga
stro
ente
rolo
gist
s di
d no
t (p
= 0
.248
0). D
elay
in d
iagn
osis
can
be
redu
ced
by h
ighe
r av
aila
bilit
y of
gen
eral
pra
ctiti
oner
s an
d ga
stro
ente
rolo
gist
s in
rur
al a
reas
. G
iven
the
alre
ady
very
hig
h de
nsity
of
phys
icia
ns in
urb
an a
reas
ther
e is
no
effe
ct o
f add
ition
al g
astr
oent
erol
ogis
ts.
Sm
ith
Nic
hola
s 20
12
GM
2 ga
nglio
sido
sis
in a
UK
st
udy
ofch
ildre
n w
ith p
rogr
essi
vene
urod
egen
erat
ion:
73
case
s re
view
ed
UK
GM
2 g
ang
liosi
do
sis
73P
rosp
ectiv
e
Rou
tine
Spe
cial
ist q
uest
ionn
aire
,S
urve
illanc
e un
it
Sur
veilla
nce
data
base
Age
at s
ympt
omm
anife
stat
ion,
excl
udin
g th
ose
iden
tified
follo
win
gdi
agno
sis
in a
sibl
ing
Dia
gnos
is
A d
elay
of 6
.8 m
onth
s (ra
nge
1–25
mo)
an
d 7.
8 m
onth
s (ra
nge
2–12
mo)
from
sy
mpt
om o
nset
to d
iagn
osis
was
see
n in
infa
ntile
-ons
et T
SD
and
San
dhof
f di
seas
e re
spec
tivel
y (o
vera
ll av
erag
e of
7.4
mo)
. Tim
e to
dia
gnos
is a
vera
ged
7.4
mon
ths
and
28.0
mon
ths
in
infa
ntile
and
juve
nile
-ons
et d
isea
se
resp
ectiv
ely.
Byg
um 2
009
Her
edita
ry a
ngio
-oed
ema
in
Den
mar
k: a
nat
ionw
ide
surv
ey
Den
mar
k
Her
edit
ary
ang
io-o
edem
a
82R
etro
spec
tive
De
novo
Clin
ical
cas
e no
te re
view
,P
atie
nt/f
amily
que
stio
nnai
re
Clin
ical
dat
abas
e, D
isea
sere
gist
ry
Ons
et o
f sym
ptom
s
Dia
gnos
is
The
mea
n du
ratio
n fro
m th
e on
set
of s
ympt
oms
to th
e di
agno
sis
of
HA
E w
as 1
6Æ3
year
s (ra
nge
0–63
). Th
e tim
e fro
m th
e fir
st s
ympt
om
to th
e di
agno
sis
was
18Æ
6 ye
ars
(0–6
3) in
the
perio
d 20
01–2
002
and
10Æ
3 ye
ars
(0–4
5) in
the
perio
d 20
07–2
008.
ther
e w
as n
o si
gnifi
cant
di
ffere
nce
in th
e di
agno
stic
del
ay in
in
dex
case
s an
d re
lativ
es: 1
5.6
year
s (0
–45)
vs.
16.
6 ye
ars
(0–6
3) a
lthou
gh
the
diag
nosi
s in
nin
e re
lativ
es w
as
esta
blis
hed
befo
re th
e on
set o
f clin
ical
sy
mpt
oms)
.

Diagnostic odyssey for rare diseases: exploration of potential indicators
47
Aut
hor-
Yr
Title
Cou
ntry
Rar
e d
isea
ses(
s)
Sam
ple
si
ze
Pro
sp/r
etro
Ro
utin
e/d
e no
vo
Dat
aCo
ll m
etho
d
Sam
plin
g F
ram
e
Sta
rtin
g p
oin
t: T
TD
End
ing
po
int:
TT
D
Find
ings
and
ke
y co
nclu
sion
s
Bes
t K
ate
2012
Hirs
chsp
rung
’s d
isea
se in
the
Nor
th
of E
ngla
nd: p
reva
lenc
e, a
ssoc
iate
dan
omal
ies,
and
sur
viva
l
Eng
land
Hir
schs
pru
ng’s
D
isea
se
100
Pro
spec
tive
Rou
tine
Sur
veilla
nce
unit
Sur
veilla
nce
data
base
Birt
h
Dia
gnos
is
The
med
ian
time
of d
iagn
osis
w
as 5
day
s af
ter b
irth,
but
rang
ed
from
birt
h un
til th
e ag
e of
5 y
ears
.
Cru
ysb
erg
199
6
Del
ay in
dia
gnos
is o
f ho
moc
ystin
uria
: ret
rosp
ectiv
e st
udy
of c
onse
cutiv
e pa
tient
s
Net
herla
nds
Ho
mo
cyst
einu
ria
34R
etro
spec
tive
De
novo
Clin
ical
cas
e no
te re
view
Hos
pita
l rec
ords
Firs
t maj
or s
ign
ofth
e di
seas
e
Dia
gnos
is
Mea
n de
lay
of 1
1 (0
-43)
yea
rs
betw
een
the
first
maj
or s
igns
of
the
dise
ase
(at m
ean
age
13
(1-4
0) y
ears
) and
the
ultim
ate
diag
nosi
s of
hom
ocys
tinur
ia.
Gla
ss 2
006
A s
tudy
on
the
natu
re o
f gen
etic
met
abol
ic p
ract
ice
at a
maj
or
paed
iatr
ic re
ferr
al c
entr
e
Can
ada
Inb
orn
err
ors
of
met
abo
lism
220
Ret
rosp
ectiv
e
De
novo
Clin
ical
cas
e no
te re
view
Hos
pita
l rec
ords
Pre
sent
atio
n to
met
abol
ic s
peci
alis
t
Dat
e of
pres
umpt
ive
diag
nosi
s
Mos
t pat
ient
s se
en b
y th
e m
etab
olic
ser
vice
wer
e no
t di
agno
sed
with
a m
etab
olic
di
seas
e. O
f the
42
in w
hom
adi
agno
sis
of g
enet
ic m
etab
olic
di
seas
e w
as c
onfir
med
, 34
(81%
) wer
e di
agno
sed
with
in
one
mon
th o
f pre
sent
ing
to a
m
etab
olic
spe
cial
ist;
in a
noth
er
five
case
s (1
2%),
the
diag
nosi
s w
as e
stab
lishe
d w
ithin
1–3
m
onth
s an
d in
one
cas
e (2
%),
it w
as e
stab
lishe
d in
3–6
mon
ths.
In
two
case
s (5
%),
diag
nosi
s w
as
esta
blis
hed
over
6 m
onth
s af
ter
pres
enta
tion.
Whe
n a
diag
nosi
swas
act
ually
po
ssib
le, i
t was
gen
eral
ly m
ade
with
in o
ne m
onth
of b
eing
se
en b
y th
e ge
netic
met
abol
ic
cons
ulta
nt. I
n th
ose
case
sw
here
test
ing
did
not r
evea
l adi
agno
sis
with
in 3
mon
ths,
a
diag
nosi
s w
as ra
rely
mad
e.

Diagnostic odyssey for rare diseases: exploration of potential indicators
48
Aut
hor-
Yr
Title
Cou
ntry
Rar
e d
isea
ses(
s)
Sam
ple
si
ze
Pro
sp/r
etro
Ro
utin
e/d
e no
vo
Dat
aCo
ll m
etho
d
Sam
plin
g F
ram
e
Sta
rtin
g p
oin
t: T
TD
End
ing
po
int:
TT
D
Find
ings
and
ke
y co
nclu
sion
s
Nap
uri 2
010
Fact
ors
asso
ciat
ed w
ith tr
eatm
ent
lag
in in
fant
ile s
pasm
s
Fran
ce
Infa
ntile
Sp
asm
s
156
Ret
rosp
ectiv
e
De
novo
Clin
ical
cas
e no
te re
view
,P
atie
nt/f
amily
que
stio
nnai
re
or s
truc
ture
d in
terv
iew
Hos
pita
l rec
ords
Tim
e of
firs
t sy
mpt
om/T
ime
offir
st p
rese
ntat
ion
to h
ealth
car
e
Tim
e of
trea
tmen
t
The
med
ian
time
lag
from
firs
tsy
mpt
om to
firs
t vis
it to
a m
edic
alpr
actit
ione
r was
2 w
eeks
(ran
ge0–
24w
ks; m
ean
3.7w
ks; S
D
3.8w
ks).
It w
as s
hort
er fo
r tho
se
who
had
pre
viou
sly
exhi
bite
d no
rmal
dev
elop
men
t tha
n fo
r th
ose
with
psy
chom
otor
del
ay
(p=
0.02
8). T
he ti
me
lag
from
firs
t vi
sit t
o di
agno
sis
and
initi
atio
n of
tre
atm
ent (
med
ian
2wks
; mea
n 4.
8wks
, SD
7.3
wks
; ran
ge0–
36w
ks) w
as s
hort
er fo
r tho
sepr
esen
ting
to p
aedi
atric
ians
(3
.7w
ks) t
han
for t
hose
pres
entin
g to
gen
eral
pr
actit
ione
rs (6
.5w
ks; p
=0.
002)
. Th
e to
tal t
ime
lag
from
firs
t sy
mpt
om to
dia
gnos
is a
ndin
itiat
ion
of tr
eatm
ent r
ange
d fro
m
a fe
w d
ays
to 4
4 w
eeks
with
a
peak
at 4
wee
ks (F
ig. 2
). Th
e di
agno
sis
was
est
ablis
hed
with
in a
mon
th o
f the
firs
t sy
mpt
oms
in 7
8 in
fant
s (4
9%)
and
with
in th
e 2
mon
ths
in 3
8 in
fant
s (3
4%).
Pat
war
dha
n 20
12
Is ju
veni
le d
erm
atom
yosi
tis a
di
ffere
nt d
isea
se in
chi
ldre
n up
to
thre
e ye
ars
of a
ge a
t ons
et th
an in
ch
ildre
n ab
ove
thre
e ye
ars
at o
nset
? A
retr
ospe
ctiv
e re
view
of 2
3 ye
ars
of
a si
ngle
cen
ter’s
exp
erie
nce
US
A
Juve
nile
d
erm
ato
myo
siti
s
78R
etro
spec
tive
De
novo
Clin
ical
cas
e no
te re
view
Adm
inis
trat
ive
data
base
Ons
et o
f sym
ptom
s
Dia
gnos
is
The
mea
n tim
es b
etw
een
onse
t of
sym
ptom
s to
dia
gnos
is in
th
e yo
unge
r an
d ol
der
age
grou
ps w
as 5
.6 m
onth
s an
d 4.
5 m
onth
s, re
spec
tivel
y, n
ot a
stat
istic
ally
sig
nific
ant d
iffer
ence
.

Diagnostic odyssey for rare diseases: exploration of potential indicators
49
Aut
hor-
Yr
Title
Cou
ntry
Rar
e d
isea
ses(
s)
Sam
ple
si
ze
Pro
sp/r
etro
Ro
utin
e/d
e no
vo
Dat
aCo
ll m
etho
d
Sam
plin
g F
ram
e
Sta
rtin
g p
oin
t: T
TD
End
ing
po
int:
TT
D
Find
ings
and
ke
y co
nclu
sion
s
Mac
Co
rmic
k Ju
dit
h 20
09
Mis
diag
nosi
s of
long
QT
synd
rom
e as
epi
leps
y at
firs
t pre
sent
atio
n
New
Zea
land
Long
QT
sy
ndro
me
31R
etro
spec
tive
De
novo
Clin
ical
cas
e no
te re
view
Dis
ease
regi
stry
Firs
t pre
sent
atio
nw
ith lo
ss o
fco
nsci
ousn
ess
Dia
gnos
is
Thirt
een
patie
nts
(39%
) ex
perie
nced
dia
gnos
tic d
elay
af
ter p
rese
ntat
ion
with
syn
cope
or
sei
zure
: med
ian
dela
y 2.
4 ye
ars
(2 m
onth
s to
23
year
s). F
orth
ose
labe
led
epile
ptic
, dia
gnos
ticde
lay
was
sig
nific
antly
long
er
than
with
oth
er m
isdi
agno
ses:
es
timat
ed m
edia
n di
ffere
nce
9.75
ye
ars
(95%
con
fiden
ce in
terv
al
7.6
to 2
0.7
year
s).
Op
resc
u 20
13
Clin
ical
pre
dict
ors
of m
orta
lity
and
caus
e of
dea
th in
ly
mph
angi
olei
omyo
mat
osis
: A
pop
ulat
ion-
base
d re
gist
ry
US
A
Lym
pha
ngio
leio
-m
yom
ato
sis
410
Pro
spec
tive
Rou
tine
Reg
istr
y
Dis
ease
regi
stry
Firs
t lun
g-re
late
dsy
mpt
om
Phy
sici
an d
iagn
osis
The
med
ian
time
betw
een
sym
ptom
ons
et a
nd d
iagn
osis
w
as 2
yea
rs (I
QR
0.3
3, 6
).
Ro
ll 20
12
The
influ
ence
of r
egio
nal h
ealth
car
est
ruct
ures
on
dela
y in
dia
gnos
is o
f ra
re d
isea
ses:
the
case
of M
arfa
n S
yndr
ome
Ger
man
y
Mar
fan
Syn
dro
me
447
Pro
spec
tive
Rou
tine
Adm
inis
trat
ive
data
base
Adm
inis
trat
ive
data
base
Ons
et o
f dis
ease
Dia
gnos
is
174
insu
rers
(44.
7%)
expe
rienc
ed a
n im
med
iate
di
agno
sis
(TtD
= 0
) of M
arfa
n S
yndr
ome
and
the
rem
aini
ng21
5 in
sure
rs (5
5.3%
) wer
e di
agno
sed
afte
r a
time
perio
d gr
eate
r th
an 0
day
s, w
ith a
n av
erag
e tim
e to
dia
gnos
is o
f60
7 da
ys, a
med
ian
of 6
41 d
ays,
an
d a
max
imum
of 1
095
days
.Th
e qu
antit
y of
phy
sici
ans
and
the
near
est a
vaila
ble
heal
th c
are
cent
er d
o no
t pla
y an
impo
rtan
t ro
le in
det
erm
inin
g th
e pr
obab
ility
of a
n im
med
iate
dia
gnos
is fo
r M
arfa
n S
yndr
ome.

Diagnostic odyssey for rare diseases: exploration of potential indicators
50
Aut
hor-
Yr
Title
Cou
ntry
Rar
e d
isea
ses(
s)
Sam
ple
si
ze
Pro
sp/r
etro
Ro
utin
e/d
e no
vo
Dat
aCo
ll m
etho
d
Sam
plin
g F
ram
e
Sta
rtin
g p
oin
t: T
TD
End
ing
po
int:
TT
D
Find
ings
and
ke
y co
nclu
sion
s
Oo
pik
200
8
Clin
ical
and
labo
rato
ry-r
econ
firm
edm
yast
heni
a gr
avis
: a p
opul
atio
n-ba
sed
stud
y
Est
onia
Mya
sthe
nia
gra
vis
70R
etro
spec
tive
De
novo
Pat
ient
/fam
ily q
uest
ionn
aire
or
str
uctu
red
inte
rvie
w
Hos
pita
l rec
ords
Age
at o
nset
, age
at
refe
rral
to th
edo
ctor
for
spec
ific
mya
sthe
nic
sym
ptom
s
Age
at o
rigin
aldi
agno
sis
Ther
e w
as re
lativ
ely
mor
e m
en
(n =
12;
92%
) tha
n w
omen
(n =
36
; 68%
) who
se d
iagn
osis
was
es
tabl
ishe
d w
ithin
1 y
ear f
rom
the
time
of re
ferr
al to
the
phys
icia
n (|z
| =
2.49
, P =
0.0
13).
In a
ll wom
en
with
non
-con
firm
ed M
G th
edi
agno
sis
was
est
ablis
hed
with
in 1
ye
ar fr
om re
ferr
al to
the
phys
icia
n,
whe
reas
68%
of w
omen
with
co
nfirm
ed M
G re
ceiv
ed th
e di
agno
sis
with
in 1
yea
r (|z
| = 5
.00,
P
< 0
.000
1). R
elat
ivel
y m
ore
wom
en w
ith n
onco
nfirm
ed M
G
(n =
11;
92%
) had
an
esta
blis
hed
diag
nosi
s w
ithin
1 y
ear a
fter o
nset
of
sym
ptom
s th
an w
omen
with
con
firm
ed M
G (n
= 2
9; 5
5%)
(|z| =
3.5
2, P
< 0
.000
5). T
he
oppo
site
was
true
for m
en a
nd
the
diffe
renc
e be
cam
e si
gnifi
cant
at
18
mon
ths,
at a
tim
e w
hen
the
diag
nosi
s w
as e
stab
lishe
d in
11
men
with
con
firm
ed M
G (8
5%)
com
pare
d to
thre
e (4
3%) w
ith
non-
confi
rmed
MG
(|z|
= 1
.97,
P
= 0
.049
).
Hilb
ert
2013
Dia
gnos
tic o
dyss
ey o
f pat
ient
s w
ithm
yoto
nic
dyst
roph
y
US
A
Myo
toni
c d
ystr
op
hy
811
Ret
rosp
ectiv
e
De
novo
Reg
istr
y
Dis
ease
regi
stry
Tim
e fro
m o
nset
of
first
sym
ptom
Dia
gnos
is
Ave
rage
age
of o
nset
of
sym
ptom
s w
as s
igni
fican
tly
grea
ter
in D
M2
mem
bers
(34.
0 ±
14.
1 ye
ars)
com
pare
d to
DM
1 m
embe
rs (2
6.1
± 1
3.2
year
s; p
<0.
0001
). D
M m
embe
rs
with
initi
al s
ympt
oms
repo
rted
be
fore
age
18
year
s ha
d gr
eate
rdi
agno
stic
del
ay (1
3.0
± 1
1.3
year
s) c
ompa
red
to m
embe
rsw
ith o
nset
afte
r ag
e 18
yea
rs
(del
ays
of 6
.9 ±
8.2
yea
rs;
p<0.
0001
).

Diagnostic odyssey for rare diseases: exploration of potential indicators
51
Aut
hor-
Yr
Title
Cou
ntry
Rar
e d
isea
ses(
s)
Sam
ple
si
ze
Pro
sp/r
etro
Ro
utin
e/d
e no
vo
Dat
aCo
ll m
etho
d
Sam
plin
g F
ram
e
Sta
rtin
g p
oin
t: T
TD
End
ing
po
int:
TT
D
Find
ings
and
ke
y co
nclu
sion
s
Pat
ters
on
Mar
c 20
13
Dis
ease
and
pat
ient
cha
ract
eris
tics
in N
PC
pat
ient
s: fi
ndin
gs fr
om a
n in
tern
atio
nal d
isea
se re
gist
ry
14 E
urop
ean
coun
trie
s, A
ustr
alia
, B
razi
l and
Can
ada
Nie
man
n-P
ick
dis
ease
typ
e C
163
Pro
spec
tive
Rou
tine
Clin
ical
cas
e no
te re
view
,D
irect
clin
ical
exa
min
atio
n/hi
stor
y, R
egis
try
Neu
rolo
gica
l ons
et
Dia
gnos
is
In g
ener
al th
ere
was
a lo
ng la
g tim
e be
twee
n th
e m
ean
(SD
) age
at
neu
rolo
gica
l ons
et (1
0.9
(9.8
) ye
ars)
and
age
at d
iagn
osis
(15.
0 (1
2.2)
yea
rs).
Del
ayed
dia
gnos
is
can
have
a c
onsi
dera
ble
impa
ct
on q
ualit
y of
life
for p
atie
nts
and/
or th
eir f
amily
and
prim
ary
care
give
rs. I
n ad
ditio
n, it
has
been
reco
mm
ende
d th
at
dise
ases
peci
fic th
erap
y w
ith
mig
lust
at s
houl
d be
sta
rted
as
early
as
poss
ible
in th
e co
urse
of
neur
olog
ical
dis
ease
in o
rder
to s
tabi
lise
neur
olog
ical
func
tion.
Sta
mp
fer
2013
Nie
man
n-P
ick
dise
ase
type
C
clin
ical
dat
abas
e: C
ogni
tive
and
coor
dina
tion
defic
its a
re e
arly
di
seas
e in
dica
tors
Sw
itzer
land
, G
erm
any
Nie
man
n-P
ick
dis
ease
typ
e C
42P
rosp
ectiv
e
De
novo
Clin
ical
cas
e no
te re
view
,P
atie
nt/f
amily
que
stio
nnai
reFi
rst n
euro
logi
cal
sym
ptom
Dia
gnos
is
Mea
n de
lay
from
firs
t ne
urol
ogic
al s
ympt
om to
di
agno
sis
was
5.7
yea
rs.
Myk
letu
n 20
13
Por
phyr
ias
in N
orw
ay
Nor
way
Po
rphy
ria
680
Pro
spec
tive
Rou
tine
Reg
istr
y
Dis
ease
regi
stry
Ons
et o
f dis
ease
Dia
gnos
is
Med
ian
diag
nost
ic d
elay
was
one
ye
ar fo
r por
phyr
ia c
utan
ea ta
rda,
4y
for a
cute
inte
rmitt
ent p
orph
yria
an
d 17
y fo
r ery
thro
poie
tic
prot
opor
phyr
ia. 1
3% w
ith A
IP a
nd
36%
with
EP
P h
ad a
dia
gnos
itic
dela
y >
20 y
ears
.
Gho
sh 2
013
Prim
ary
myo
clon
us-d
ysto
nia:
A
diag
nosi
s of
ten
mis
sed
in c
hild
ren
US
A
Pri
mar
y m
yocl
onu
s-d
ysto
nia
9R
etro
spec
tive
De
novo
Clin
ical
cas
e no
te re
view
Hos
pita
l rec
ords
Age
of o
nset
of
sym
ptom
s, a
ge a
tpr
esen
tatio
n to
clin
ic
Age
at t
ime
ofdi
agno
sis
Ther
e w
as a
mea
n tim
e la
g of
4.
5 ye
ars
betw
een
the
onse
t of
sym
ptom
s an
d di
agno
sis.
The
de
lay
in a
rriv
ing
at a
defi
nitiv
e di
agno
sis
(som
etim
es s
pann
ing
mor
e th
an a
dec
ade)
resu
lted
in p
atie
nt a
nd p
aren
tal a
nxie
ty fo
rpr
olon
ged
perio
ds, p
oor m
otor
deve
lopm
ent,
unne
cess
ary
inve
stig
atio
ns, u
se o
f ina
ppro
pria
te
ther
apy
with
pot
entia
l sid
e ef
fect
s,
and
incr
ease
in h
ealth
car
e co
sts.

Diagnostic odyssey for rare diseases: exploration of potential indicators
52
Aut
hor-
Yr
Title
Cou
ntry
Rar
e d
isea
ses(
s)
Sam
ple
si
ze
Pro
sp/r
etro
Ro
utin
e/d
e no
vo
Dat
aCo
ll m
etho
d
Sam
plin
g F
ram
e
Sta
rtin
g p
oin
t: T
TD
End
ing
po
int:
TT
D
Find
ings
and
ke
y co
nclu
sion
s
Bas
ura
Gre
go
ry 2
009
Clin
ical
feat
ures
and
th
e m
anag
emen
t of
pyrid
oxin
e-de
pend
ent a
nd
pyrid
oxin
eres
pons
ive
seiz
ures
: re
view
of 6
3 N
orth
Am
eric
an c
ases
su
bmitt
ed to
a p
atie
nt re
gist
ry
US
A, C
anad
a
Pyr
ido
xine
d
epen
den
t se
izur
es
63P
rosp
ectiv
e
Rou
tine
Pat
ient
/fam
ily q
uest
ionn
aire
or
str
uctu
red
inte
rvie
w,
Reg
istr
y, S
peci
alis
t qu
estio
nnai
re
Dis
ease
regi
stry
Age
of p
rese
ntat
ion
Age
at i
nitia
tion
ofpy
ridox
ine
ther
apy
A d
elay
in d
iagn
osis
and
py
ridox
ine
treat
men
t was
not
un
com
mon
, with
the
lag
in th
e di
agno
sis
for t
he e
ntire
gro
up
aver
agin
g 31
1 da
ys (r
ange
0 d
ays
to 8
.5 y
ears
). Th
is d
elay
was
subs
tant
ially
redu
ced
to 3
9 da
ys (r
ange
0 to
145
day
s)
for t
he te
n ki
ndre
ds w
here
an
olde
r reg
iste
red
child
had
bee
n pr
evio
usly
dia
gnos
ed w
ith P
DS
..
Kar
ageo
rgak
i 200
9
Taka
yasu
art
eriti
s: E
pide
mio
logi
cal,
clin
ical
, and
imm
unog
enet
ic fe
atur
es
in G
reec
e
Gre
ece
Taka
yasu
art
erit
is
42R
etro
spec
tive
De
novo
Clin
ical
cas
e no
te re
view
Hos
pita
l rec
ords
Dat
e of
dis
ease
onse
t
Dat
e of
dia
gnos
is
Med
ian
dela
y in
dia
gnos
is w
as
24 m
onth
s. F
atig
ue a
t the
tim
e of
diag
nosi
s w
as a
ssoc
iate
d w
ithin
crea
sed
risk
for
dela
y in
di
agno
sis
(odd
s ra
tio=
11.7
; 95%
C
I: 1.
5–89
.1, p
=0.
018)
.
Vano
li 20
05
Taka
yasu
’s a
rter
itis:
A s
tudy
of 1
04
Italia
n pa
tient
s
Italy
Taka
yasu
’s
arte
riti
s
104
Ret
rosp
ectiv
e
De
novo
Spe
cial
ist q
uest
ionn
aire
Adm
inis
trat
ive
data
base
,C
linic
al d
atab
ase,
Dis
ease
regi
stry
Sym
ptom
ons
et
Dia
gnos
is
Med
ian
diag
nost
ic d
elay
was
15
.5 m
onth
s (ra
nge
0–32
5 m
onth
s). W
ith th
e lo
gist
ic
regr
essi
on m
odel
, we
wer
eab
le to
iden
tify
only
2 v
aria
bles
as
pre
dict
ors
of d
iagn
ostic
de
lay:
age
at o
nset
<15
yea
rs,
asso
ciat
ed w
ith a
hig
her
prob
abilit
y of
a d
elay
>=
2 ye
ars
(OR
3.9
, 95%
CI 1
.2–1
2.8)
, an
d E
SR
at o
nset
>30
mm
/ho
ur, a
ssoc
iate
d w
ith a
low
er
prob
abilit
y of
del
ay (O
R 0
.35,
95%
CI 0
.15–
0.82
).

Diagnostic odyssey for rare diseases: exploration of potential indicators
53
Aut
hor-
Yr
Title
Cou
ntry
Rar
e d
isea
ses(
s)
Sam
ple
si
ze
Pro
sp/r
etro
Ro
utin
e/d
e no
vo
Dat
aCo
ll m
etho
d
Sam
plin
g F
ram
e
Sta
rtin
g p
oin
t: T
TD
End
ing
po
int:
TT
D
Find
ings
and
ke
y co
nclu
sion
s
Hea
th 2
011
Dia
gnos
ing
varia
nt C
reut
zfel
dt
- Ja
kob
dise
ase:
A
retr
ospe
ctiv
e an
alys
is o
f the
fir
st 1
50 c
ases
in
the
UK
UK
Vari
ant
Cre
utzf
eld
t-Ja
kob
Dis
ease
150
Pro
spec
tive
Rou
tine
Sur
veilla
nce
unit
Sur
veilla
nce
data
base
Age
at o
nset
, firs
tpo
int o
f med
ical
cont
act,
poin
t of
neur
olog
ical
refe
rral
, poi
nt o
fne
urol
ogic
al re
view
Dia
gnos
is o
fde
finite
or
prob
able
vC
JD
Med
ian
time
from
ons
et to
the
first
poi
nt o
f med
ical
co
ntac
t was
2.5
mon
ths
(mea
n 3.
4; ra
nge
0-12
m
onth
s). T
he ti
me
to p
rese
ntat
ion
to a
med
ical
pr
actit
ione
r was
dep
ende
nt o
n th
e na
ture
of t
he e
arly
cl
inic
al fe
atur
es. T
hose
pre
sent
ing
with
neu
rolo
gica
l fe
atur
es (i
e ca
ses
with
isol
ated
neu
rolo
gica
l sy
mpt
oms
or a
com
bina
tion
of n
euro
logi
cal a
nd
psyc
hiat
ric s
ympt
oms)
pre
sent
ed e
arlie
r to
a m
edic
al
prac
titio
ner i
n co
mpa
rison
with
thos
e w
ith is
olat
ed
psyc
hiat
ric fe
atur
es (n
euro
logi
cal o
nset
, 2 m
onth
s;
psyc
hiat
ric o
nset
, 3.3
mon
ths;
com
bine
d, 1
.7
mon
ths;
p=0
.04)
. Mea
n tim
e fro
m o
nset
to re
ferr
al
to a
neu
rolo
gist
was
7.4
mon
ths
(95%
CI 6
.5 to
8).
Mea
n tim
e fro
m n
euro
logi
cal r
efer
ral t
o re
view
was
on
ly 1
6 da
ys. M
ean
time
for v
CJD
to b
e co
nsid
ered
th
e m
ost l
ikel
y di
agno
sis
in lif
e (o
r in
10 c
ases
pa
thol
ogic
ally
pro
ven
follo
win
g co
rtica
l bio
psy)
was
10
.5 m
onth
s (9
5% C
I 9.8
to 1
1.2
mon
ths)
.
Sig
nific
ant i
nter
val b
etw
een
illnes
s on
set a
nd
pres
enta
tion
to a
prim
ary
care
phy
sici
an, w
hich
is
influ
ence
d by
the
natu
re o
f the
initi
al c
linic
al fe
atur
es.
Neu
rolo
gica
l rev
iew
is in
varia
bly
soug
ht fo
llow
ing
the
deve
lopm
ent o
f clin
ical
sig
ns a
nd a
dia
gnos
is is
then
es
tabl
ishe
d re
lativ
ely
quic
kly.
Des
pite
the
prog
ress
ive
clin
ical
cou
rse,
a c
onfid
ent c
linic
al d
iagn
osis
is n
ot
usua
lly a
chie
ved
until
a re
lativ
ely
adva
nced
sta
ge o
f illn
ess
(mea
n tim
e to
dia
gnos
is 1
0.5
mon
ths)
with
a
mor
e ra
pid
clin
ical
pro
gres
sion
acc
ount
ing.
Auv
in 2
012
Dia
gnos
is d
elay
in
Wes
t syn
drom
e:m
isdi
agno
sis
and
cons
eque
nces
Fran
ce, I
taly,
US
A
Wes
t sy
ndro
me
83R
etro
spec
tive
De
novo
Clin
ical
cas
e no
te re
view
Clin
ical
dat
abas
e
Firs
t sym
ptom
s
Dia
gnos
is o
fin
fant
ile s
pasm
s
Twen
ty-e
ight
infa
nts
(34
%) w
ere
diag
nose
d m
ore
than
30
days
afte
r in
itial
pre
sent
atio
n. T
he
med
ian
time
from
the
begi
nnin
g of
spa
sms
to th
e di
agno
sis
of IS
was
10
days
(Q1–
Q3,
4–3
2; F
ig. 1
). A
dia
gnos
tic d
elay
of m
ore
than
30
days
was
a r
isk
fact
or fo
r po
or o
utco
me
(RR
, 31.
70 [2
.30–
437.
68]
on m
ultiv
aria
ble
anal
ysis
)

Diagnostic odyssey for rare diseases: exploration of potential indicators
54
Ap
pen
dix
3 R
evie
w o
f rar
e d
isea
se d
atab
ases
Eng
lish
lab
el o
f th
e ac
tivi
ty
Co
vera
ge
Affi
liati
on
Incl
uded
/
excl
uded
Wo
rkin
g
web
site
Web
site
w
ith
pri
vate
ar
ea
Web
site
pr
ovid
ing
in
form
atio
n ab
out d
ata
Web
site
p
rovi
din
g
det
aile
d
list
of
dat
a
Tim
e o
f o
nset
of
sym
pto
ms
Tim
e o
f d
iag
nosi
s
AO
MIC
: adu
lt on
set m
yosi
tis im
mun
ogen
etic
co
llabo
ratio
n N
atio
nal
Pub
lic
Incl
uded
YE
S
Bat
ten
Dis
ease
Neu
rona
l Cer
oid
Lipo
fusc
inos
is
(NC
L) P
atie
nt R
egis
try
Nat
iona
l P
ublic
In
clud
ed
BIN
OC
AR
: Brit
ish
Isle
s ne
twor
k of
con
geni
tal
anom
aly
regi
strie
s N
atio
nal
Not
defi
ned
Incl
uded
YE
SY
ES
YE
S
BP
OLD
: Brit
ish
Pae
diat
ric O
rpha
n Lu
ng D
isea
se
Reg
istr
y N
atio
nal
Pub
lic
Incl
uded
YE
SY
ES
CA
RIS
- W
elsh
regi
stry
of c
onge
nita
l ano
mal
ies
- pa
rt o
f BIN
OC
AR
and
EU
RO
CAT
net
wor
k R
egio
nal
Pub
lic
Exc
lude
d (re
gion
al)
CA
RO
BB
- c
onge
nita
l ano
mal
ies
regi
stry
for
Oxf
ords
hire
, Ber
kshi
re &
Buc
king
ham
shire
-
part
of t
he B
INO
CA
R a
nd E
UR
OC
AT n
etw
ork
Reg
iona
l P
ublic
E
xclu
ded
(regi
onal
)
CR
AN
E: p
atie
nts
regi
stry
with
cle
ft lip
and
/or
clef
t pal
ate
in E
ngla
nd a
nd W
ales
N
atio
nal
Pub
lic
Exc
lude
d (o
bvio
us o
r sc
reen
ed
for)
DR
N 3
77: C
linic
al R
egis
ter
for
Tran
sien
t N
eona
tal D
iabe
tes
Nat
iona
l P
ublic
In
clud
edY
ES
DY
SC
ER
NE
's d
ysm
orph
olog
y di
agno
stic
sy
stem
(DD
S)
Eur
opea
n P
ublic
E
xclu
ded
(obv
ious
or
scre
ened
fo
r)
EB
V a
ssoc
iate
d N
K/T
cel
l mal
igna
ncie
s re
gist
ry
Nat
iona
l P
ublic
E
xclu
ded
(acu
te o
r ca
ncer
)
EC
AR
UC
A: E
urop
ean
Cyt
ogen
etic
ists
A
ssoc
iatio
n R
egis
ter
of U
nbal
ance
d C
hrom
osom
e A
berr
atio
ns
Eur
opea
n P
ublic
E
xclu
ded
(acu
te o
r ca
ncer
)
EC
FS: E
urop
ean
Cys
tic F
ibro
sis
Soc
iety
pat
ient
re
gist
ry
Glo
bal
Priv
ate
non-
for-
profi
t E
xclu
ded
(obv
ious
or
scre
ened
fo
r)
EHD
N: r
egis
try o
f juv
enile
Hun
tingt
on's
dis
ease
DG
loba
l P
ublic
In
clud
ed
EH
R: E
urop
ean
Hae
mog
lobi
nopa
thy
Reg
istr
y E
urop
ean
Pub
lic
Incl
uded
YE
SY
ES
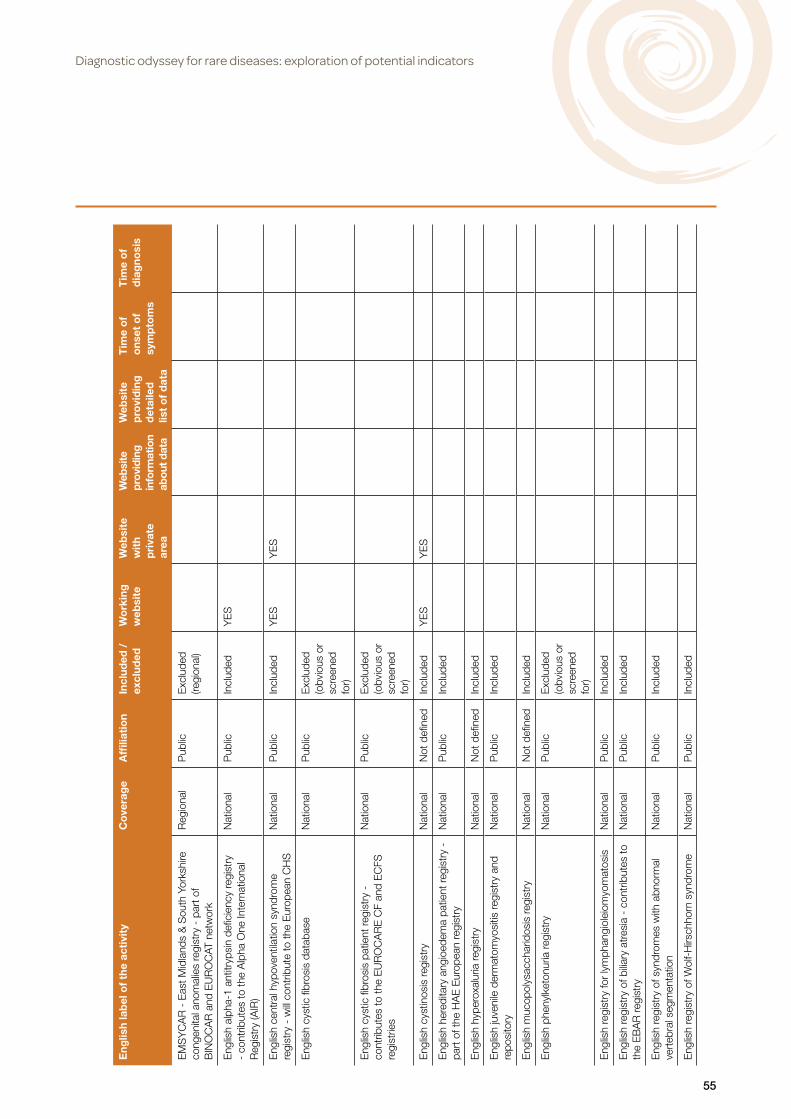
Diagnostic odyssey for rare diseases: exploration of potential indicators
55
Eng
lish
lab
el o
f th
e ac
tivi
ty
Co
vera
ge
Affi
liati
on
Incl
uded
/
excl
uded
Wo
rkin
g
web
site
Web
site
w
ith
pri
vate
ar
ea
Web
site
pr
ovid
ing
in
form
atio
n ab
out d
ata
Web
site
p
rovi
din
g
det
aile
d
list
of
dat
a
Tim
e o
f o
nset
of
sym
pto
ms
Tim
e o
f d
iag
nosi
s
EM
SY
CA
R -
Eas
t Mid
land
s &
Sou
th Y
orks
hire
co
ngen
ital a
nom
alie
s re
gist
ry -
par
t of
BIN
OC
AR
and
EU
RO
CAT
net
wor
k
Reg
iona
l P
ublic
E
xclu
ded
(regi
onal
)
Eng
lish
alph
a-1
antit
ryps
in d
efici
ency
regi
stry
-
cont
ribut
es to
the
Alp
ha O
ne In
tern
atio
nal
Reg
istr
y (A
IR)
Nat
iona
l P
ublic
In
clud
edY
ES
Eng
lish
cent
ral h
ypov
entil
atio
n sy
ndro
me
regi
stry
- w
ill co
ntrib
ute
to th
e E
urop
ean
CH
S
Nat
iona
l P
ublic
In
clud
edY
ES
YE
S
Eng
lish
cyst
ic fi
bros
is d
atab
ase
Nat
iona
l P
ublic
E
xclu
ded
(obv
ious
or
scre
ened
fo
r)
Eng
lish
cyst
ic fi
bros
is p
atie
nt re
gist
ry -
co
ntrib
utes
to th
e E
UR
OC
AR
E C
F an
d E
CFS
re
gist
ries
Nat
iona
l P
ublic
E
xclu
ded
(obv
ious
or
scre
ened
fo
r)
Eng
lish
cyst
inos
is re
gist
ry
Nat
iona
l N
ot d
efine
d In
clud
edY
ES
YE
S
Eng
lish
here
dita
ry a
ngio
edem
a pa
tient
regi
stry
-
part
of t
he H
AE
Eur
opea
n re
gist
ry
Nat
iona
l P
ublic
In
clud
ed
Eng
lish
hype
roxa
luria
regi
stry
N
atio
nal
Not
defi
ned
Incl
uded
Eng
lish
juve
nile
der
mat
omyo
sitis
regi
stry
and
re
posi
tory
N
atio
nal
Pub
lic
Incl
uded
Eng
lish
muc
opol
ysac
char
idos
is re
gist
ry
Nat
iona
l N
ot d
efine
d In
clud
ed
Eng
lish
phen
ylke
tonu
ria re
gist
ry
Nat
iona
l P
ublic
E
xclu
ded
(obv
ious
or
scre
ened
fo
r)
Eng
lish
regi
stry
for
lym
phan
giol
eiom
yom
atos
is
Nat
iona
l P
ublic
In
clud
ed
Eng
lish
regi
stry
of b
iliary
atr
esia
- c
ontr
ibut
es to
th
e E
BA
R re
gist
ry
Nat
iona
l P
ublic
In
clud
ed
Eng
lish
regi
stry
of s
yndr
omes
with
abn
orm
al
vert
ebra
l seg
men
tatio
n N
atio
nal
Pub
lic
Incl
uded
Eng
lish
regi
stry
of W
olf-
Hirs
chho
rn s
yndr
ome
Nat
iona
l P
ublic
In
clud
ed

Diagnostic odyssey for rare diseases: exploration of potential indicators
56
Eng
lish
lab
el o
f th
e ac
tivi
ty
Co
vera
ge
Affi
liati
on
Incl
uded
/
excl
uded
Wo
rkin
g
web
site
Web
site
w
ith
pri
vate
ar
ea
Web
site
pr
ovid
ing
in
form
atio
n ab
out d
ata
Web
site
p
rovi
din
g
det
aile
d
list
of
dat
a
Tim
e o
f o
nset
of
sym
pto
ms
Tim
e o
f d
iag
nosi
s
Eng
lish
seve
re c
hron
ic n
eutr
open
ia re
gist
ry -
co
ntrib
utes
to th
e S
CN
inte
rnat
iona
l reg
istr
y (S
CN
IR)
Nat
iona
l P
ublic
Incl
uded
YE
SY
ES
YE
SY
ES
YE
S
EU
MD
S: E
urop
ean
Reg
istr
y fo
r M
yelo
dysp
last
ic
Syn
drom
es -
par
t of E
uroL
euke
mia
Net
(ELN
) E
urop
ean
Pub
lic
Incl
uded
YE
SY
ES
YE
SY
ES
EU
RO
CA
RE
CF:
Eur
opea
n cy
stic
fibr
osis
re
gist
ry (F
INIS
HE
D)
Glo
bal
Pub
lic
Exc
lude
d (o
bvio
us o
r sc
reen
ed
for)
EU
RO
med
iCAT
: Saf
ety
of M
edic
atio
n us
e in
P
regn
ancy
in R
elat
ion
to R
isk
of C
onge
nita
l M
alfo
rmat
ions
Eur
opea
n N
ot d
efine
d E
xclu
ded
(obv
ious
or
scre
ened
fo
r)
EU
RO
PAC
: the
Eur
opea
n re
gist
ry o
f her
edita
ry
panc
reat
itis
and
fam
ilial p
ancr
eatic
can
cer
Eur
opea
n P
ublic
In
clud
edY
ES
YE
SY
ES
Eur
opea
n P
rade
r-W
illi s
yndr
ome
data
base
E
urop
ean
Pub
lic
Incl
uded
EU
RO
-WA
BB
: An
EU
Rar
e D
isea
ses
Reg
istr
y fo
r W
olfra
m s
yndr
ome,
Als
tröm
syn
drom
e,
Bar
det-
Bie
dl s
yndr
ome
and
othe
r ra
re d
iabe
tes
synd
rom
es
Eur
opea
n P
ublic
In
clud
edY
ES
YE
SY
ES
YE
SY
ES
EU
RO
WIL
SO
N: E
urop
ean
netw
ork
on W
ilson
di
seas
e (re
gist
ries)
E
urop
ean
Not
defi
ned
Incl
uded
YE
S
Fam
ilial O
varia
n C
ance
r R
egis
ter
(FO
CR
)N
atio
nal
Pub
licE
xclu
ded
(acu
te o
r ca
ncer
)
Gla
sgow
regi
stry
of c
onge
nita
l ano
mal
ies
- pa
rt
of B
INO
CA
R a
nd E
UR
OC
AT n
etw
ork
Reg
iona
l P
ublic
E
xclu
ded
(regi
onal
)
Glo
bal F
KR
P (F
ukut
in-R
elat
ed P
rote
in) d
efec
ts
regi
stry
- p
art o
f TR
EAT
-NM
D A
llianc
e G
loba
l P
ublic
In
clud
edY
ES
YE
SY
ES
Gre
at O
rmon
d S
tree
t Hos
pita
l Con
geni
tal
Mel
anoc
ytic
Nae
vus
Reg
istr
yN
atio
nal
Pub
licE
xclu
ded
(obv
ious
or
scre
ened
fo
r)
Hun
ter
Out
com
e S
urve
y (H
OS
): pa
tient
regi
stry
Glo
bal
Pub
licIn
clud
ed

Diagnostic odyssey for rare diseases: exploration of potential indicators
57
Eng
lish
lab
el o
f th
e ac
tivi
ty
Co
vera
ge
Affi
liati
on
Incl
uded
/
excl
uded
Wo
rkin
g
web
site
Web
site
w
ith
pri
vate
ar
ea
Web
site
pr
ovid
ing
in
form
atio
n ab
out d
ata
Web
site
p
rovi
din
g
det
aile
d
list
of
dat
a
Tim
e o
f o
nset
of
sym
pto
ms
Tim
e o
f d
iag
nosi
s
I-D
SD
: Dis
orde
rs o
f sex
ual d
evel
opm
ent r
egis
try
Glo
bal
Pub
lic
Incl
uded
YE
SY
ES
YE
S
LCH
: Eng
lish
Lang
erha
ns c
ell h
istio
cyto
sis
regi
stry
N
atio
nal
Pub
lic
Incl
uded
Mer
seys
ide
and
Che
shire
regi
stry
of c
onge
nita
l an
omal
ies
-par
t of B
INO
CA
R a
nd E
UR
OC
AT
netw
ork
Reg
iona
l P
ublic
E
xclu
ded
(regi
onal
)
Myo
toni
c dy
stro
phy
patie
nt re
gist
ry in
Uni
ted
Kin
gdom
- p
art o
f the
TR
EAT
-NM
D n
etw
ork
Nat
iona
l P
ublic
In
clud
edY
ES
YE
SY
ES
YE
S
Nat
iona
l Con
geni
tal A
nom
aly
Sys
tem
(NC
AS
) -
part
of B
INO
CA
R a
nd E
UR
OC
AT n
etw
ork
Reg
iona
l P
ublic
E
xclu
ded
(regi
onal
)
ND
SC
R -
Nat
iona
l Dow
n sy
ndro
me
cyto
gene
tic
regi
stry
- p
art o
f BIN
OC
AR
and
EU
RO
CAT
ne
twor
k
Nat
iona
l P
ublic
E
xclu
ded
(regi
onal
)
NH
D: t
he n
atio
nal h
aem
ophi
lia d
atab
ase
Nat
iona
l N
ot d
efine
d In
clud
edY
ES
YE
SY
ES
YE
SY
ES
NH
R: N
atio
nal H
aem
oglo
bino
path
y R
egis
try
Nat
iona
l P
ublic
In
clud
edY
ES
YE
SY
ES
YE
S
Nor
CA
S -
Nor
ther
n re
gist
ry o
f con
geni
tal
anom
alie
s -
part
of B
INO
CA
R a
nd E
UR
OC
AT
netw
ork
Reg
iona
l P
ublic
E
xclu
ded
(regi
onal
)
Reg
iona
l spi
noce
rebe
llar
atax
ia re
gist
ry
Reg
iona
l P
ublic
E
xclu
ded
(regi
onal
)
SW
CA
R -
Sou
th W
est c
onge
nita
l ano
mal
ies
regi
stry
- p
art o
f BIN
OC
AR
and
EU
RO
CAT
ne
twor
k
Reg
iona
l P
ublic
E
xclu
ded
(regi
onal
)
The
Als
tröm
syn
drom
e U
K (A
SU
K) C
linic
al
Res
earc
h D
atab
ase
Nat
iona
l P
ublic
In
clud
edY
ES
The
MTM
and
CN
M R
egis
try
- Th
e M
yotu
bula
r an
d C
entr
onuc
lear
Myo
path
y P
atie
nt R
egis
try
Nat
iona
l P
ublic
In
clud
edY
ES
YE
SY
ES
The
Nat
iona
l Chr
onic
Gra
nulo
mat
ous
Dis
ease
R
egis
try
Nat
iona
l P
ublic
In
clud
edY
ES
The
regi
onal
pae
diat
ric c
ardi
olog
y da
taba
seR
egio
nal
Pub
lic
Exc
lude
d (re
gion
al)
TRE
AT-N
MD
: Acc
eler
atin
g Tr
eatm
ents
for
Neu
rom
uscu
lar
Dis
ease
s (re
gist
ries)
G
loba
l P
ublic
In
clud
edY
ES
UK
& Ir
elan
d Fa
ncon
i Ana
emia
Reg
istr
y N
atio
nal
Pub
lic
Incl
uded
YE
S

Diagnostic odyssey for rare diseases: exploration of potential indicators
58
Eng
lish
lab
el o
f th
e ac
tivi
ty
Co
vera
ge
Affi
liati
on
Incl
uded
/
excl
uded
Wo
rkin
g
web
site
Web
site
w
ith
pri
vate
ar
ea
Web
site
pr
ovid
ing
in
form
atio
n ab
out d
ata
Web
site
p
rovi
din
g
det
aile
d
list
of
dat
a
Tim
e o
f o
nset
of
sym
pto
ms
Tim
e o
f d
iag
nosi
s
UK
and
Irel
and
Duc
henn
e an
d B
ecke
r m
uscu
lar
dyst
roph
y pa
tient
regi
stry
(par
t of t
he T
RE
AT-
NM
D n
etw
ork)
Nat
iona
l N
ot d
efine
d In
clud
edY
ES
YE
SY
ES
UK
and
Irel
and
Spi
nal m
uscu
lar
atro
phy
(SM
A) p
atie
nt re
gist
ry (p
art o
f the
TR
EAT
-NM
D
netw
ork)
Nat
iona
l P
ublic
In
clud
edY
ES
YE
SY
ES
UK
Dys
kera
tosi
s C
onge
nita
(DC
) reg
istr
y N
atio
nal
Pub
lic
Incl
uded
UK
Hun
tingt
on d
isea
se re
gist
ry (c
olla
bora
ting
with
the
EH
DN
/Eur
o H
D R
egis
try)
N
atio
nal
Pub
lic
Incl
uded
YE
SY
ES
UK
Neu
rofib
rom
atos
is 2
(NF2
) Pat
ient
Reg
istr
y N
atio
nal
Pub
lic
Incl
uded
UK
Pae
diat
ric IT
P (I
mm
une
Thro
mbo
cyto
peni
c P
urpu
ra) R
egis
try
Nat
iona
l P
ublic
In
clud
edY
ES
YE
SY
ES
UK
rena
l rar
e di
seas
e re
gist
ry
Nat
iona
l P
rivat
e fo
r-pr
ofit
Incl
uded
YE
SY
ES
YE
S
UK
Thr
ombo
tic T
hrom
bocy
tope
nia
Pur
pura
(U
KTT
P) R
egis
try
Nat
iona
l P
ublic
In
clud
edY
ES
YE
SY
ES
YE
SY
ES
UK
AIT
PR
: Uni
ted
Kin
gdom
adu
lt id
iopa
thic
th
rom
bocy
tope
nic
purp
ura
regi
stry
N
atio
nal
Pub
lic
Incl
uded
YE
SY
ES
YE
SY
ES
YE
S
UK
CC
CR
: Eng
lish
fam
ilial o
varia
n ca
ncer
pa
tient
regi
stry
N
atio
nal
Not
defi
ned
Exc
lude
d (a
cute
or
canc
er)
UK
ES
R: U
nite
d K
ingd
om E
vans
Syn
drom
e R
egis
try
Nat
iona
l P
ublic
In
clud
edY
ES
YE
SY
ES
YE
S
UK
FITP
R: U
nite
d K
ingd
om fa
milia
l idi
opat
hic
thro
mbo
cyto
peni
c pu
rpur
a (IT
P) R
egis
try
Nat
iona
l P
ublic
In
clud
edY
ES
YE
SY
ES
Uni
ted
Kin
gdom
neu
rom
yelit
is o
ptic
a re
gist
ry
Nat
iona
l P
ublic
In
clud
ed
WA
ND
A -
Wes
sex
regi
stry
of a
nten
atal
ly
dete
cted
ano
mal
ies
- pa
rt o
f BIN
OC
AR
and
E
UR
OC
AT n
etw
ork
Reg
iona
l P
ublic
E
xclu
ded
(Reg
iona
l)
Wes
t Mid
land
s re
gist
ry o
f con
geni
tal a
nom
alie
s -
part
of B
INO
CA
R a
nd E
UR
OC
AT n
etw
ork
Reg
iona
l P
ublic
Exc
lude
d (R
egio
nal)

Diagnostic odyssey for rare diseases: exploration of potential indicators
59
Appendix 4 Interview participants
Name Position Organisation
Robin Lachmann Consultant in Metabolic Medicine Univeristy College London Hospital
Hywel Williams Senior Research Associate, Centre for Translational Research, Genetics and Genomic Medicine
Institute of Child Health, London
Jim Bonham Clinical Director of Diagnostics, Pharmacy & Genetics
Sheffield Children's NHS Foundation Trust
Fiona Stewart Consultant in Genetic Medicine Belfast City Hospital
Liam Smeeth Professor of Clinical Epidemiology/General Practitioner
London School of Hygiene and Tropical Medicine
Mark Bale
Colin Pavelin
Melanie Peffer
Deputy Director of Health Science & BioethicsHead of Genomics and Rare Diseases ProgrammePolicy Manager Genomics, Science and Emerging Technologies
Department of Health
Health Education England
Department of Health
Iain Mellis Accountable commissioner – Metabolic Diseases
NHS England
Edmund Jessop Specialist Commissioner NHS England
Jacquie WestwoodJane Deller
DirectorProgramme Manager
UK Genetic Testing Network
Lara Bloom Chief Operations Officer Ehlers-Danlos Syndrome UK
Tess Harris Chief Executive Polycystic Kidney Disease Charity
Jayne Spink Chief Executive Officer Tuberous Sclerosis Association
Graham Lipkin Consultant Nephrologist/Lead at Rare Diseases Centre
Institute for Translational Medicine, Queen Elizabeth Hospital Birmingham
David Goldblatt Director of Clinical Research and Innovation, Academic Lead for future Centre for Rare Diseases
Institute of Child Health, London
Sarah Stevens Public Health ConsultantNational Disease Registration
Public Health England
Dirk DemuthPaola NasutiLara Lucchese
Clinical Project DirectorSenior ConsultantSenior Consultant
IMS Health
Willie Hamilton Professor of Primary Care Diagnostics University of Exeter Medical School

Diagnostic odyssey for rare diseases: exploration of potential indicators
60
Appendix 5 Interview topic guideAdapted to suit each interviewee and in response to themes emerging from previous interviews.
Start of interview: Thanks, consent, introduction and presentation of study aim
Topic questions (to be adapted to the particular interviewee and in response to the flow of discussion during the interview):
• What is your day to day interaction/experience with people with rare diseases?
• What for you are the key issues around diagnostic odysseys/delayed diagnosis in rare diseases?
• What are the key causes/contributors to these delays?
• When do you consider to be the start of a diagnostic odyssey?
• When do you consider a diagnostic odyssey to have ended?
• What would be the best way of capturing data on time to diagnosis in rare diseases? Do you know of any existing data?
• What rare diseases would it be reasonable to generalise across in terms of changes to time to diagnosis? Are there any particular categories of rare disease that we should consider?
• Given the impossibility of analysing all 6000 rare diseases, we have considered selecting a small number of tracer conditions to focus on. Are there any conditions that you feel would be particularly important to include or exclude? What criteria would be sensible to use to select tracer conditions?
• How meaningful would it be to collect data on all patients with rare diseases that are admitted/seen at/tested at a particular facility that commonly manages people with rare diseases?
End of interview: is there anything else you think I should know about diagnostic odysseys in rare diseases? Thank you for your time and insights.

Diagnostic odyssey for rare diseases: exploration of potential indicators
61
Appendix 6 References for systematic review
1. Anwar GA, McDonnell MJ, Worthy SA, Bourke SC, Afolabi G, Lordan J et al. Phenotyping adults with non-cystic fibrosis bronchiectasis: A prospective observational cohort study. Respiratory Medicine. 2013;107(7):1001-7.
2. Spencer DA, Venkataraman M, Higgins S, Stevenson K, Weller PH. Cystic fibrosis in children from ethnic minorities in the West Midlands. Respiratory Medicine. 1994;88(9):671-5.
3. Lim MTC, Wallis C, Price JF, Carr SB, Chavasse RJ, Shankar A et al. Diagnosis of cystic fibrosis in London and South East England before and after the introduction of newborn screening. Archives of Disease in Childhood. 2014;99(3):197-202.
4. Mohamed K, Appleton R, Nicolaides P. Delayed diagnosis of Duchenne muscular dystrophy. European journal of paediatric neurology : EJPN : official journal of the European Paediatric Neurology Society. 2000;4(5):219-23.
5. Van Ruiten HJA, Straub V, Bushby K, Guglieri M. Improving the diagnosis of duchenne muscular dystrophy. 14th Meeting of the Italian Association of Myology Sirmione Italy Conference Start: 20140508 Conference End: 20140510. 2014;33(1):77-8.
6. Best KE, Glinianaia SV, Bythell M, Rankin J. Hirschsprung’s disease in the North of England: prevalence, associated anomalies, and survival. Birth defects research Part A, Clinical and molecular teratology. 2012;94(6):477-80.
7. Crow YJ, Tolmie JL, Howatson AG, Patrick WJ, Stephenson JB. Batten disease in the west of Scotland 1974-1995 including five cases of the juvenile form with granular osmiophilic deposits. Neuropediatrics. 1997;28(3):140-4.
8. Smith NJ, Winstone AM, Stellitano L, Cox TM, Verity CM. GM2 gangliosidosis in a UK study of children with progressive neurodegeneration: 73 cases reviewed. Developmental medicine and child neurology. 2012;54(2):176-82.
9. Heath CA, Cooper SA, Murray K, Lowman A, Henry C, MacLeod MA, et al. Diagnosing variant Creutzfeldt - Jakob disease: A retrospective analysis of the first 150 cases in the UK. Journal of Neurology, Neurosurgery and Psychiatry. 2011;82(6):646-51.
10. Minhas HL, Giangrande PL. Presentation of severe haemophilia--a role for accident and emergency doctors? Emergency medicine journal : EMJ. 2001;18(4):246-9.
11. Jankovic J, Adler CH, Charles PD, Comella C, Stacy M, Schwartz M, et al. Rationale and design of a prospective study: Cervical Dystonia Patient Registry for Observation of OnaBotulinumtoxinA Efficacy (CD PROBE). BMC Neurology. 2011;11.
12. Kapoor P, Greipp PT, Schaefer EW, Mandrekar SJ, Kamal AH, Gonzalez-Paz NC et al. Idiopathic systemic capillary leak syndrome (Clarkson’s disease): the Mayo clinic experience. Mayo Clinic proceedings Mayo Clinic. 2010;85(10):905-12.
13. Prapphal N, Fitzpatrick SB, Getson P, Fink R, O’Donnell R, Chaney H. Cystic fibrosis in blacks in Washington, DC: fifteen years’ experience. Journal of the National Medical Association. 1989;81(3):263-7.
14. Farrell PM, Li Z, Kosorok MR, Laxova A, Green CG, Collins J, et al. Bronchopulmonary disease in children with cystic fibrosis after early or delayed diagnosis. American journal of respiratory and critical care medicine. 2003;168(9):1100-8.
15. Nick JA, Chacon CS, Brayshaw SJ, Jones MC, Barboa CM et al. Effects of gender and age at diagnosis on disease progression in long-term survivors of cystic fibrosis. American journal of respiratory and critical care medicine. 2010;182(5):614-26.
16. 16. Lai HJ, Cheng Y, Farrell PM. The survival advantage of patients with cystic fibrosis diagnosed through neonatal screening: Evidence from the United States cystic fibrosis Foundation Registry data. Journal of Pediatrics. 2005;147(3 SUPPL.):S57-S63.
17. Sanders DB, Lai HJ, Rock MJ, Farrell PM. Comparing age of cystic fibrosis diagnosis and treatment initiation after newborn screening with two common strategies. Journal of Cystic Fibrosis. 2012;11(2):150-3.

Diagnostic odyssey for rare diseases: exploration of potential indicators
62
18. Bailey DB, Skinner D, Hatton D, Roberts J. Family experiences and factors associated with the diagnosis of fragile X syndrome. Journal of Developmental and Behavioral Pediatrics. 2000;21(5):315-21.
19. Bailey DB, Raspa M, Bishop E, Holiday D. No change in the age of diagnosis for fragile X syndrome: Findings from a national parent survey. Pediatrics. 2009;124(2):527-33.
20. Centers for Disease C, Prevention. Delayed diagnosis of fragile X syndrome--United States, 1990-1999. MMWR Morbidity and mortality weekly report. 2002;51(33):740-2.
21. Patwardhan A, Rennebohm R, Dvorchik I, Spencer CH. Is juvenile dermatomyositis a different disease in children up to three years of age at onset than in children above three years at onset? A retrospective review of 23 years of a single center’s experience. Pediatric Rheumatology. 2012;10.
22. Oprescu N, McCormack FX, Byrnes S, Kinder BW. Clinical predictors of mortality and cause of death in lymphangioleiomyomatosis: A population-based registry. Lung. 2013;191(1):35-42.
23. Hilbert JE, Ashizawa T, Day JW, Luebbe EA, Martens WB, McDermott MP, et al. Diagnostic odyssey of patients with myotonic dystrophy. Journal of Neurology. 2013;260(10):2497-504.
24. Ghosh D, Indulkar S. Primary myoclonus-dystonia: A diagnosis often missed in children. Journal of Child Neurology. 2013;28(11):1418-22.
25. Basura GJ, Hagland Shawn P, Wiltse Anna M, Gospe Sidney M, Jr. Clinical features and the management of pyridoxine-dependent and pyridoxine-responsive seizures: review of 63 North American cases submitted to a patient registry. European journal of pediatrics. 2009;168(6):697-704.
26. Bygum A. Hereditary angio-oedema in Denmark: a nationwide survey. The British journal of dermatology. 2009;161(5):1153-8.
27. Bygum A, Vestergaard H. Acquired angioedema--occurrence, clinical features and associated disorders in a Danish nationwide patient cohort. International archives of allergy and immunology. 2013;162(2):149-55.
28. Evensen KJ, Nossent HC. Epidemiology and outcome of adult-onset Still’s disease in Northern Norway. Scandinavian Journal of Rheumatology. 2006;35(1):48-51.
29. Mykletun M, Aarsand AK, Stole E, Villanger JH, Tollanes MC, Baravelli C, et al. Porphyrias in Norway. Annual Assembly of the Swiss Society of Clinical Chemistry and International Congress of Porphyrins and Porphyrias and International Meeting of Porphyria Patients: Personalized Medicine and Rare Diseases 2013 Lucerne Switzerland Conference Start: 20130516 Conference End: 20130518. 2013;51(5):eA47-eA8.
30. Huber F, Schmid-Scherzer K, Wantke F, Frantal S, Kneussl M. [Alpha1-antitrypsin deficiency in Austria: analysis of the Austrian Alpha1-international-registry database]. Alpha1-Antitrypsin-Mangel in Osterreich: Auswertung der osterreichischen Datenbank des internationalen Alpha1-Antitrypsin Registers. 2010;122(13-14):390-6.
31. Tadic V, Kasten M, Bruggemann N, Stiller S, Hagenah J, Klein C. Dopa-responsive dystonia revisited: Diagnostic delay, residual signs, and nonmotor signs. AMA Archives of Neurology, JAMA Neurology. 2012;69(12):1558-62.
32. Blankart CR. Does healthcare infrastructure have an impact on delay in diagnosis and survival? Health Policy. 2012;105(2-3):128-37.
33. Roll K. The influence of regional health care structures on delay in diagnosis of rare diseases: the case of Marfan Syndrome. Health policy (Amsterdam, Netherlands). 2012;105(2-3):119-27.
34. Greulich T, Ottaviani S, Bals R, Lepper Philipp M, Vogelmeier C, Luisetti M, et al. Alpha1-antitrypsin deficiency - diagnostic testing and disease awareness in Germany and Italy. Respiratory medicine. 2013;107(9):1400-8.

Diagnostic odyssey for rare diseases: exploration of potential indicators
63
35. Stampfer M, Theiss S, Amraoui Y, Jiang X, Keller S, Ory DS, et al. Niemann-Pick disease type C clinical database: Cognitive and coordination deficits are early disease indicators. Orphanet Journal of Rare Diseases. 2013;8(1).
36. Gathmann B, Goldacker S, Klima M, Belohradsky BH, Notheis G, Ehl S, et al. The German national registry for primary immunodeficiencies (PID). Clinical and Experimental Immunology. 2013;173(2):372-80.
37. Karageorgaki ZT, Bertsias GK, Mavragani CP, Kritikos HD, Spyropoulou-Vlachou M, Drosos AA, et al. Takayasu arteritis: Epidemiological, clinical, and immunogenetic features in Greece. Clinical and Experimental Rheumatology. 2009;27(1 SUPPL. 52):S33-S9.
38. Andrikos E, Iatrou C, Boletis JN, Diamandopoulos A, Katsinas C, Kalaitzidis K, et al. Evolution of Fabry disease in male patients: the Greek experience. Clinical nephrology. 2010;73(1):58-63.
39. Rocchetti I, Taruscio D, Pierannunzio D. Modeling delay to diagnosis for Amyotrophic lateral sclerosis: Under reporting and incidence estimates. BMC Neurology. 2012;12.
40. Luigetti M, Conte A, Del Grande A, Bisogni G, Romano A, Marcaccio A, et al. Ttr-related amyloid neuropathy: Clinical, electrophysiological and pathological findings in fifteen unrelated patients. Meeting of the Associazione Italiana Sistema Nervoso Periferico and Gruppo Neuroscienze e Dolore della Societa Italiana di Neurologia 2012 Pisa Italy Conference Start: 20120412 Conference End: 20120414. 2012;17:S33-S4.
41. Vanoli M, Daina E, Salvarani C, Sabbadini MG, Rossi C, Bacchiani G, et al. Takayasu’s arteritis: A study of 104 Italian patients. Arthritis and rheumatism. 2005;53(1):100-7.
42. Pilo-de-la-Fuente B, Jimenez-Escrig A, Lorenzo JR, Pardo J, Arias M, Ares-Luque A, et al. Cerebrotendinous xanthomatosis in Spain: clinical, prognostic, and genetic survey. European journal of neurology : the official journal of the European Federation of Neurological Societies. 2011;18(10):1203-11.
43. Barba-Romero MA, Rivera-Gallego A, Pintos-Morell G, Spanish FOSSG. Fabry disease in Spain: description of Spanish patients and a comparison with other European countries using data from the Fabry Outcome Survey (FOS). International journal of clinical practice. 2011;65(8):903-10.
44. Twiss J, Metcalfe R, Edwards E, Byrnes C. New Zealand national incidence of bronchiectasis “too high” for a developed country. Archives of disease in childhood. 2005;90(7):737-40.
45. MacCormick JM, McAlister H, Crawford J, French John K, Crozier I, Shelling Andrew N, et al. Misdiagnosis of long QT syndrome as epilepsy at first presentation. Annals of emergency medicine. 2009;54(1):26-32.
46. Bader-Meunier B, Leverger G, Tchernia G, Schischmanoff O, Cynober T, Bernaudin F, et al. Clinical and laboratory manifestations of congenital dyserythropoietic anemia type I in a cohort of French children. Journal of Pediatric Hematology/Oncology. 2005;27(8):416-9.
47. Napuri S, Gall LE, Edouard, Dulac O, Chaperon J, Riou F. Factors associated with treatment lag in infantile spasms. Developmental medicine and child neurology. 2010;52(12):1164-6.
48. Peretti N, Roy CC, Sassolas A, Deslandres C, Drouin E, Rasquin A, et al. Chylomicron retention disease: A long term study of two cohorts. Molecular Genetics and Metabolism. 2009;97(2):136-42.
49. Auvin S, Hartman Adam L, Desnous B, Moreau A-C, Alberti C, Delanoe C, et al. Diagnosis delay in West syndrome: misdiagnosis and consequences. European journal of pediatrics. 2012;171(11):1695-701.
50. Chambost H, Gaboulaud V, Coatmelec B, Rafowicz A, Schneider P, Calvez T. What factors influence the age at diagnosis of hemophilia? Results of the French hemophilia cohort. Journal of Pediatrics. 2002;141(4):548-52.

Diagnostic odyssey for rare diseases: exploration of potential indicators
64
51. Chong MY, Hamilton DC, Cole DE. Retrospective estimation of the birth prevalence for delayed onset disorders: application to cystic fibrosis in Nova Scotia. Statistics in medicine. 2000;19(5):743-51.
52. Steinraths M, Vallance HD, Davidson AGF. Delays in diagnosing cystic fibrosis: can we find ways to diagnose it earlier? Canadian family physician Medecin de famille canadien. 2008;54(6):877-83.
53. Jog M, Chouinard S, Hobson D, Grimes D, Chen R, Bhogal M, et al. Causes for treatment delays in dystonia and hemifacial spasm: A Canadian survey. The Canadian Journal of Neurological Sciences / Le Journal Canadien Des Sciences Neurologiques. 2011;38(5):704-11.
54. Glass HC, Feigenbaum A, Clarke JTR. A study on the nature of genetic metabolic practice at a major paediatric referral centre. Journal of Inherited Metabolic Disease. 2006;29(1):175-8.
55. Kachko L, Efrat R, Ben Ami S, Mukamel M, Katz J. Complex regional pain syndromes in children and adolescents. Pediatrics International. 2008;50(4):523-7.
56. Alm J, Larsson A, Zetterstrom R. Congenital hypothyroidism in Sweden. Incidence and age at diagnosis. Acta paediatrica Scandinavica. 1978;67(1):1-3.
57. Alhadad A, Wollmer P, Svensson A, Eriksson KF. Erythromelalgia: Incidence and clinical experience in a single centre in Sweden. Erythromelalgie: Inzidenz und klinische erfahrung in einem Zentrum in Schweden. 2012;41(1):43-8.
58. Balnaves ME, Bonacquisto L, Francis I, Glazner J, Forrest S. The impact of newborn screening on cystic fibrosis testing in Victoria, Australia. Journal of medical genetics. 1995;32(7):537-42.
59. Wilcken B, Towns SJ, Mellis CM. Diagnostic delay in cystic fibrosis: Lessons from newborn screening. Archives of Disease in Childhood. 1983;58(11):863-6.
60. Farrell PM, Joffe S, Foley L, Canny GJ, Mayne P, Rosenberg M. Diagnosis of cystic fibrosis in the Republic of Ireland: Epidemiology and costs. Irish Medical Journal. 2007;100(8).
61. Jackson A, Foley L, Daly L, Fitzpatrick P, Harrington M, Zhou S, et al. Delayed cystic fibrosis presentation in children in the absence of newborn screening. Irish Medical Journal. 2010;103(4).
62. Cruysberg JR, Boers GH, Trijbels JM, Deutman AF. Delay in diagnosis of homocystinuria: retrospective study of consecutive patients. BMJ (Clinical research ed). 1996;313(7064):1037-40.
63. Oopik M, Puksa L, Luus SM, Kaasik AE, Jakobsen J. Clinical and laboratory-reconfirmed myasthenia gravis: a population-based study. European Journal of Neurology. 2008;15(3):246-52.
64. Ramaswami U, Whybra C, Parini R, Pintos-Morell G, Mehta A, Sunder-Plassmann G, et al. Clinical manifestations of Fabry disease in children: Data from the Fabry Outcome Survey. Acta Paediatrica, International Journal of Paediatrics. 2006;95(1):86-92.
65. Mehta A, Ricci R, Widmer U, Dehout F, Garcia De Lorenzo A, Kampmann C, et al. Fabry disease defined: Baseline clinical manifestations of 366 patients in the Fabry Outcome Survey. European Journal of Clinical Investigation. 2004;34(3):236-42.
66. Patterson MC, Mengel E, Wijburg Frits A, Muller A, Schwierin B, Drevon H, et al. Disease and patient characteristics in NP-C patients: findings from an international disease registry. [Erratum appears in Orphanet J Rare Dis 2013;8:73]. 2013;8:12.

Diagnostic odyssey for rare diseases: exploration of potential indicators
65
Appendix 7 Presenting symptoms for rare diseases previously used to measure time to diagnosis
Disease Presenting symptoms indicative of start of diagnostic odyssey
Alpha1-antitrypsin deficiency1 Age at onset of respiratory complaints: Mostly dyspnoea and non-productive cough, also cough with sputum, dyspnoea at rest and paroxysmal dyspnoea.
Batten Disease/neuronal ceroid lipofuscinosis2
Motor deterioration, visual deterioration, first seizure noted
Bronchiectasis3 Age at onset of cough
Cerebrotendinous xanthomatosis4
Age at first neurological symptom/presenting symptom: Symptoms found at presentation generally neurological (mental retardation most common), also a history of chronic diarrhoea or juvenile cataracts
Congenital Dyserythropoietic Anemia Type5
Onset of anaemia
Congenital Hypothyroidism6 Most frequent symptoms found were obstructive constipation, lethargy and feeding difficulties
Duchenne muscular dystrophy7
First parental concerns: most common symptoms waddling gait, difficulty with steps, falls, delayed motor development, speech delay
Dystonia or hemifacial spasm8 Age at onset of movement disorders
Fabry disease9, 10 Ramaswami et al (2006): Clinical manifestions categorised into neurological, gastrointestinal, ophthalmological, auditory, dermatological and 'various'Andrikos et al (2010): presenting symptoms included Angiokeratomas,Abdominal pain-Diarrhea, Hypohidrosis, Lymphedema, Pain crises, Acroparesthesias, Hypohidrosis, Hearing loss, Cold-Heat Intolerance, Arthritis, Lymphedema
Fragile X11 Initial concern about development expressed by someone/diagnosis of developmental delay made: ascertained during interview by asking ‘How did you first learn about fragile X syndrome?’
Gastric Cancer12 Named codes for gastric cancer-related symptoms: benign neoplasm of other and ill-defined parts of digestive system (stomach); neoplasm of uncertain or unknown behaviour of oral cavity and digestive organs (stomach); oesophagitis; special screening
GM2 gangliosidosis13 Symptoms cited included developmental delay or regression, strabismus or perceived visual impairment and hyperacusis
Haemophilia14 Attendance to a doctor with bleeding, bruising or joint pain
Lymphangioleiomyomatosis15 First lung-related symptom: included dyspnoea, cough, pneumothorax, pleural effusions.
Marfan Syndrome16 Named symptom codes: constitutional tall stature, other disorders of lens, astigmatism, floppy mitral valve syndrome, non-rheumatic aortic valve disorders, endocarditis
Myotonic dystrophy17 6 symptoms based on 'core manifestations' of MD and 'high impact on quality of life': mytonia, weakness, cataracts, pain, fatigue, sleep disturbances
Niemann-Pick type C18 First neurological symptom: questionnaire with 270 questions on medical history
Primary myoclonus-dystonia19 myoclonus or dystonia
Takayasu arteritis20 Onset of first symptom, categorised as: vascular, cardiac, CNS, Musculoskeletal, Constitutional and Laboratory.
West syndrome21 Beginning of spasms. Identification on structural lesions of the brain or a genetic disorder was considered a ‘symptom’.

The Policy Innovation Research Unit (PIRU) brings together leading healthand social care expertise to improve evidence-based policy-making andits implementation across the National Health Service, social care andpublic health.
We strengthen early policy development by exploiting the best routine dataand by subjecting initiatives to speedy, thorough evaluation. We also helpto optimise policy implementation across the Department of Health’sresponsibilities.
Our partnersPIRU is a novel collaboration between the London School of Hygiene & TropicalMedicine (LSHTM), the Personal Social Services Research Unit (PSSRU) at theLondon School of Economics and Political Science (LSE), and the Health andCare Infrastructure Research and Innovation Centre (HaCIRIC) at Imperial CollegeLondon Business School plus RAND Europe and the Nuffield Trust.
The Unit is funded by the Policy Research Programme of the Department of Health.
Policy Innovation Research UnitDepartment of Health Services Research & PolicyLondon School of Hygiene & Tropical Medicine15–17 Tavistock Place, London WC1H 9SH
Tel: +44 (0)20 7927 2784www.piru.ac.uk