dhayalini ramamoorthy january 2014 master’s thesis in ...703813/fulltext01.pdf · dhayalini...
TRANSCRIPT

FACULTY OF ENGINEERING AND SUSTAINABLE DEVELOPMENT .
Impact of Mutual Coupling among Antenna Arrays on the Performance of the
Multipath Simulator System
Dhayalini Ramamoorthy
January 2014
Master’s Thesis in Electronics
Master’s Program in Electronics/Telecommunications
Examiner: Dr. Kjell Prytz
Supervisor: Dr. Jose Chilo


Dhayalini Ramamoorthy Impact of Mutual Coupling among Antenna Arrays on the Performance of the Multipath Simulator System
i
Preface
First and foremost, I am thankful to God for his blessings, without which I may not have been able to
complete this thesis.
I would like to express my gratitude to Prof. Jose Chilo and Dr. Sathyaveer Prasad, for their guidance
and supervision as well as for their valuable encouragement and support during the thesis period.
I also would like to thank all my friends and the staff at Högskolan i Gävle, especially in the
Department of Electronics, Mathematics and Natural sciences, for their support and effort during my
entire study period here.
I specially dedicate this Master thesis work to my beloved husband, Praveen Rajaperumal. For his
unconditional love and support that made me withstand all the difficulties during my studies.
And last but not the least, I would also like to dedicate this thesis to my entire family who have loved
and supported me all my life.

Dhayalini Ramamoorthy Impact of Mutual Coupling among Antenna Arrays on the Performance of the Multipath Simulator System
ii
Dhayalini Ramamoorthy Impact of Mutual Coupling among Antenna Arrays on the Performance of the Multipath Simulator System
iii
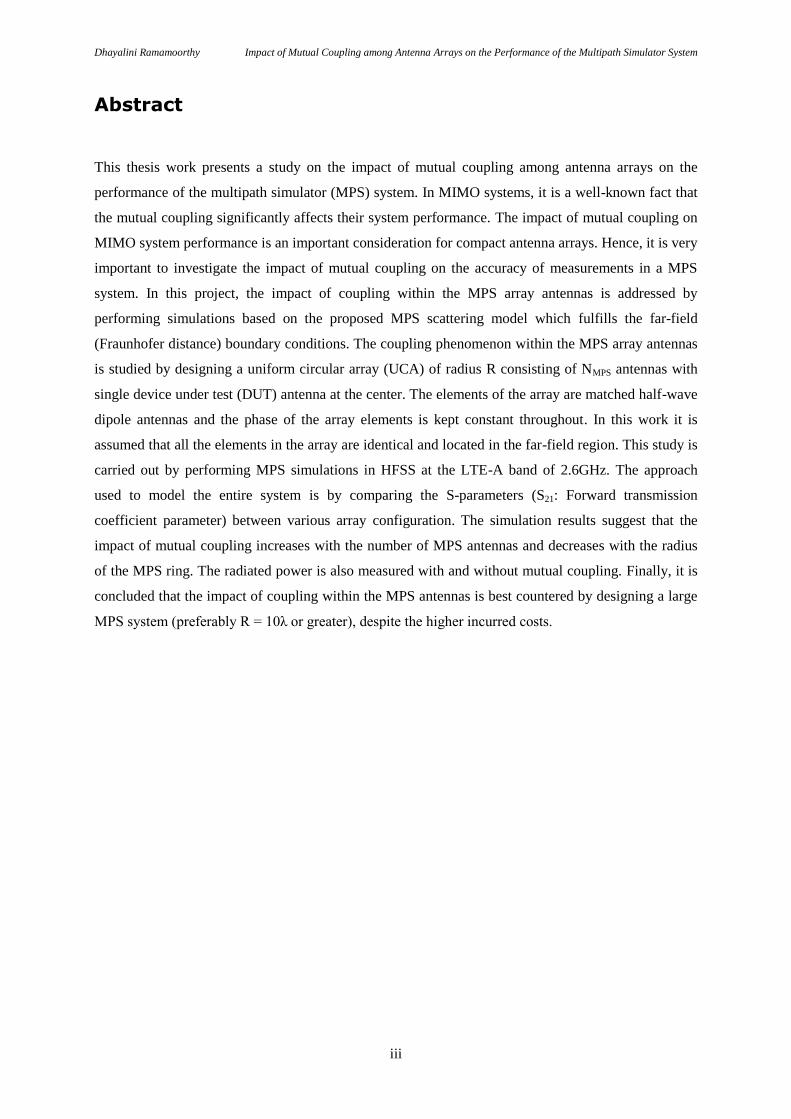
Abstract
This thesis work presents a study on the impact of mutual coupling among antenna arrays on the
performance of the multipath simulator (MPS) system. In MIMO systems, it is a well-known fact that
the mutual coupling significantly affects their system performance. The impact of mutual coupling on
MIMO system performance is an important consideration for compact antenna arrays. Hence, it is very
important to investigate the impact of mutual coupling on the accuracy of measurements in a MPS
system. In this project, the impact of coupling within the MPS array antennas is addressed by
performing simulations based on the proposed MPS scattering model which fulfills the far-field
(Fraunhofer distance) boundary conditions. The coupling phenomenon within the MPS array antennas
is studied by designing a uniform circular array (UCA) of radius R consisting of NMPS antennas with
single device under test (DUT) antenna at the center. The elements of the array are matched half-wave
dipole antennas and the phase of the array elements is kept constant throughout. In this work it is
assumed that all the elements in the array are identical and located in the far-field region. This study is
carried out by performing MPS simulations in HFSS at the LTE-A band of 2.6GHz. The approach
used to model the entire system is by comparing the S-parameters (S21: Forward transmission
coefficient parameter) between various array configuration. The simulation results suggest that the
impact of mutual coupling increases with the number of MPS antennas and decreases with the radius
of the MPS ring. The radiated power is also measured with and without mutual coupling. Finally, it is
concluded that the impact of coupling within the MPS antennas is best countered by designing a large
MPS system (preferably R = 10λ or greater), despite the higher incurred costs.

Dhayalini Ramamoorthy Impact of Mutual Coupling among Antenna Arrays on the Performance of the Multipath Simulator System
iv
Dhayalini Ramamoorthy Impact of Mutual Coupling among Antenna Arrays on the Performance of the Multipath Simulator System
v
Table of contents
Preface ...................................................................................................................................................... i
Abstract .................................................................................................................................................. iii
Table of contents ..................................................................................................................................... v
List of abbreviations .............................................................................................................................. vii
Notations .............................................................................................................................................. viii
List of Figures ......................................................................................................................................... x
List of Tables ........................................................................................................................................ xiii
1 Introduction ..................................................................................................................................... 1
1.1 Background ............................................................................................................................. 1
1.2 Motivation of the thesis ........................................................................................................... 2
1.3 Objective of the thesis ............................................................................................................. 2
2 Theory ............................................................................................................................................. 4
2.1 Basic Antenna Concepts .......................................................................................................... 4
2.1.1 Radiation Pattern ............................................................................................................. 4
2.1.2 Directivity ........................................................................................................................ 5
2.1.3 Gain ................................................................................................................................. 6
2.1.4 Scattering parameters ...................................................................................................... 6
2.1.5 Polarization ...................................................................................................................... 6
2.2 Field Regions ........................................................................................................................... 7
2.2.1 Far-field region ................................................................................................................ 8
2.3 Half wave dipole antenna ........................................................................................................ 8
2.4 Uniform circular antenna array ............................................................................................. 10
2.4.1 Antenna Arrays .............................................................................................................. 10
2.4.2 Circular array ................................................................................................................. 11
2.5 Mutual Coupling.................................................................................................................... 11
2.5.1 Mutual coupling on circular array ................................................................................. 12
2.6 Multipath Simulators ............................................................................................................. 14
Dhayalini Ramamoorthy Impact of Mutual Coupling among Antenna Arrays on the Performance of the Multipath Simulator System
vi
2.6.1 MPS Scattering model ................................................................................................... 15
3 HFSS simulations and results ........................................................................................................ 16
3.1 Theoretical Design ................................................................................................................ 16
3.2 Two Dipole Antenna case ..................................................................................................... 18
3.3 Impact of MC by increasing Array radius for NMPS = 8 ........................................................ 19
3.3.1 Case-(I) Array radius of 2λ ............................................................................................ 19
3.3.2 Case-(II) Array radius of 3.5λ ....................................................................................... 22
3.3.3 Case-(III) Array radius of 6λ ......................................................................................... 24
3.3.4 Case-(IV) Array radius of 10λ ....................................................................................... 26
3.3.5 Field Diagrams with increasing R and NMPS = 8 ........................................................... 28
3.4 Impact of MC by increasing no. of elements, NMPS for Array radius of 10λ ......................... 31
3.4.1 Case-(I) NMPS = 4 ........................................................................................................... 32
3.4.2 Case-(II) NMPS = 8 ......................................................................................................... 34
3.4.3 Case-(III) NMPS = 16 ...................................................................................................... 34
3.4.4 Field Diagrams with increasing NMPS and R = 10λ ....................................................... 37
3.5 Impact of MC by increasing both the no. of elements, NMPS and array radius, R ................. 40
3.6 Radiated power measurement................................................................................................ 44
4 Discussion and Conclusions .......................................................................................................... 45
References ............................................................................................................................................. 46
Dhayalini Ramamoorthy Impact of Mutual Coupling among Antenna Arrays on the Performance of the Multipath Simulator System
vii
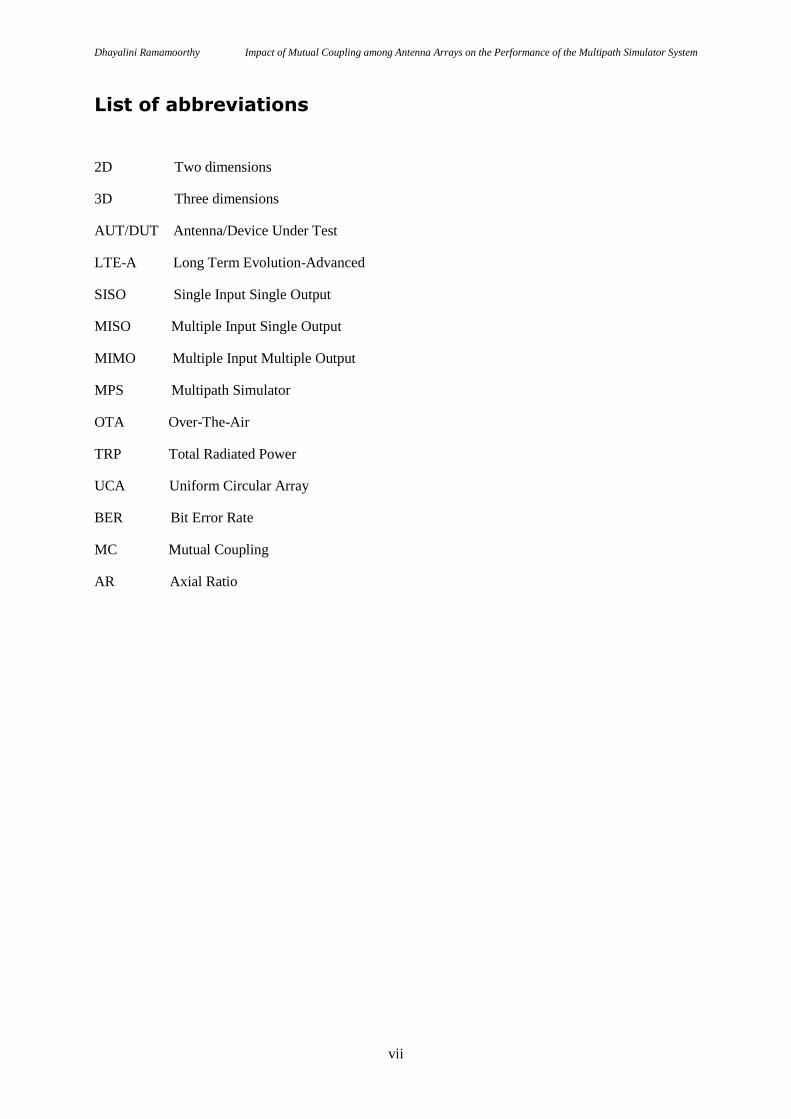
List of abbreviations
2D Two dimensions
3D Three dimensions
AUT/DUT Antenna/Device Under Test
LTE-A Long Term Evolution-Advanced
SISO Single Input Single Output
MISO Multiple Input Single Output
MIMO Multiple Input Multiple Output
MPS Multipath Simulator
OTA Over-The-Air
TRP Total Radiated Power
UCA Uniform Circular Array
BER Bit Error Rate
MC Mutual Coupling
AR Axial Ratio

Dhayalini Ramamoorthy Impact of Mutual Coupling among Antenna Arrays on the Performance of the Multipath Simulator System
viii
Notations
Magnetic flux density
Electric flux density
Magnetic field vector
Electric field vector
Current density
c Velocity of light
f Frequency
k Wavenumber
r Distance from the center of the antenna to the observation point
Prad Radiated power
Paccepted Net accepted power by the antenna
D Maximum dimension of the antenna
R1 Maximum reactive near-field distance of an antenna
R Minimum far-field distance of an antenna
S21 Forward transmission scattering parameter
D(θ,ϕ) Directivity
G(θ,ϕ) Gain of the antenna
P(r,θ,ϕ) Observation point in the field region of an antenna
U(θ,ϕ) Radiation intensity
AF Array factor
ρ Electric charge density
Del vector differential operator
Cross-product vector operator
Dot-product vector operator
λ Wavelength
dΩ Solid angle
θ Elevation angle
ϕ Azimuth angle
η Free space wave impedance
NMPS Number of MPS antennas
τ Tilt angle
Cin Cosine integral
Aem Maximum effective area
Dhayalini Ramamoorthy Impact of Mutual Coupling among Antenna Arrays on the Performance of the Multipath Simulator System
ix
Rr Radiation resistance
Zin Input impedance
Eθ Electric field component
Hϕ Magnetic field component
D0 Directivity
dBi Decibel (isotropic)
dBd Decibel(dipole)
Dhayalini Ramamoorthy Impact of Mutual Coupling among Antenna Arrays on the Performance of the Multipath Simulator System
x
List of Figures
Fig. 1. Simulated 3D radiation pattern of a half-wave dipole antenna at 2.6GHz using HFSS software 5
Fig. 2. Field regions of a thin dipole antenna 7
Fig. 3. A basic dipole antenna 8
Fig. 4. Geometry of N element Dipole Uniform Circular array 11
Fig. 5. Coupling in receiving mode 12
Fig. 6. Arrangement of antennas in a single DUT MPS system 14
Fig. 7. HFSS model design with array radius of 10λ and NMPS = 4 17
Fig. 8. Design and Radiation pattern of two dipole antennas 18
Fig. 9. Measured S21 parameter for two dipole antenna case 18
Fig. 10. Integrated radiation pattern with array radius of 2λ in [dB] and [mV] respectively 20
Fig. 11. Isolated element pattern of dipole placed with radius of 2λ in [dB] and [mV] respectively 20
Fig. 12. Measured integrated S21 parameter of the MPS with array radius of 2λ (with MC) 21
Fig. 13. Measured isolated S21 parameter of the MPS with array radius of 2λ (without MC) 21
Fig. 14. Integrated radiation pattern with array radius of 3.5λ in [dB] and [mV] respectively 21
Fig. 15. Isolated element pattern of dipole placed with radius of 3.5 in [dB] and [mV] respectively 22
Fig. 16. Measured integrated S21 parameter of the MPS with array radius of 3.5λ (with MC) 23
Fig. 17. Measured isolated S21 parameter of the MPS with array radius of 3.5λ (without MC) 23
Fig. 18. Integrated radiation pattern with array radius of 6λ in [dB] and [mV] respectively 24
Fig. 19. Isolated element pattern of dipole placed with radius of 6λ in [dB] and [mV] respectively 24
Fig. 20. Measured integrated S21 parameter of the MPS with array radius of 6λ (with MC) 25
Fig. 21. Measured isolated S21 parameter of the MPS with array radius of 6λ (without MC) 25
Fig. 22. Integrated radiation pattern with array radius of 10λ in [dB] and [mV] respectively 26
Fig. 23. Isolated element pattern of dipole placed with radius of 10λ in [dB] and [mV] respectively 26
Fig. 24. Measured integrated S21 parameter of the MPS with array radius of 10λ (with MC) 27
Fig. 25. Measured isolated S21 parameter of the MPS with array radius of 10λ (without MC) 27
Fig. 26. Field diagrams for increasing array radius, R for NMPS = 8 29

Dhayalini Ramamoorthy Impact of Mutual Coupling among Antenna Arrays on the Performance of the Multipath Simulator System
xi
Fig. 27. Plot between MC and number of elements in UCA for array radius of 10λ 30
Fig. 28. HFSS design with array radius of 10λ and NMPS = 4 32
Fig. 29. Integrated radiation pattern with array radius of 10λ and NMPS = 4 in [dB] and [mV] respectively 32
Fig. 30. Isolated element pattern with array radius of10λ and NMPS = 4 in [dB] and [mV] respectively 32
Fig. 31. Measured integrated S21 parameter of the MPS with array radius of 10λ and NMPS = 4 (with MC) 33
Fig. 32. Measured isolated S21 parameter of the MPS with array radius of 10λ and NMPS = 4 (without MC) 33
Fig. 33. HFSS design with array radius of 10λ and NMPS = 8 34
Fig. 34. HFSS design with array radius of 10λ and NMPS = 16 35
Fig. 35. Integrated radiation pattern with array radius of 10λ and NMPS = 16 in [dB] and [mV] respectively 35
Fig. 36. Isolated element pattern with array radius of10λ and NMPS = 16 in [dB] and [mV] respectively 35
Fig. 37. Measured integrated S21 parameter of the MPS with array radius of 10λ and NMPS = 16 (with MC) 36
Fig. 38. Measured isolated S21 parameter of the MPS with array radius of 10λ and NMPS = 16 (without MC) 36
Fig. 39. Field diagrams with increasing number of elements, NMPS for R = 10λ 38
Fig. 40. Plot between MC and varying array radius for N = 8 39
Fig. 41. Integrated radiation pattern with array radius of 3.5λ, 6λ and 10λ for NMPS = 8 respectively 41
Fig. 42. Isolated radiation pattern with array radius of 3.5λ, 6λ and 10λ for NMPS = 8 respectively 41
Fig. 43. Integrated radiation pattern with array radius of 3.5λ, 6λ and 10λ for NMPS = 16 respectively 41
Fig. 44. Isolated radiation pattern with array radius of 3.5λ, 6λ and 10λ for NMPS = 16 respectively 41
Fig. 45. Integrated and isolated radiation pattern with array radius of 2λ with NMPS = 8 42
Fig. 46. Integrated and isolated radiation pattern with array radius of 10λ with NMPS = 4 42

Dhayalini Ramamoorthy Impact of Mutual Coupling among Antenna Arrays on the Performance of the Multipath Simulator System
xii

Dhayalini Ramamoorthy Impact of Mutual Coupling among Antenna Arrays on the Performance of the Multipath Simulator System
xiii
List of Tables
Table 1. Simulated results for increasing array radius with NMPS = 8 19
Table 2. Simulated results for increasing no of elements with array radius = 10λ 28
Table 3. Simulated results for varying array radius with NMPS = 8 and NMPS = 16 35
Table 4. Simulated results for array radius of 2λ and NMPS = 8 and NMPS = 16 38
Table 5. Measured results for radiated power with and without mutual coupling 43

Dhayalini Ramamoorthy Impact of Mutual Coupling among Antenna Arrays on the Performance of the Multipath Simulator System
xiv
Dhayalini Ramamoorthy Impact of Mutual Coupling among Antenna Arrays on the Performance of the Multipath Simulator System
1
1 Introduction
An introduction including background and objectives of this project is given here. Background
provides an overview of the multipath simulator systems.
1.1 Background
Antennas play a major role in the wireless communication systems. The performance of antenna
systems can significantly enhance the performance of wireless communication systems. For some
applications, the single element antenna is unsuitable because it does not meet the required gain and
radiation patterns. Alternatively, we therefore combine the multiple element antennas to improve the
overall performance and spectral efficiency of the wireless systems. There are many techniques
implemented to increase the antenna performance such as SISO (Single Input Single Output), MISO
(Multiple Input Multiple Output), SIMO (Single Input Multiple Output) and MIMO (Multiple Input
Multiple Output). The topic of Multiple Input Multiple Output (MIMO) have become popular in the
recent years as they have shown improved results on spectral efficiency and capacity than the single
antenna systems. MIMO plays a phenomenal role in the field of wireless communications by
employing antennas with multiple elements at both sides of the communication link. It is a well-
known fact that the mutual coupling significantly affects their system performance.
A multipath simulator (MPS) consists of an array of antennas, arranged in circular manner encircling a
device under test (DUT) at a distance of few wavelengths and a feed network which distributes the
signal over the array [1]. The MPS simulates the multipath environment by applying realistic signals
to the array antennas and by sweeping the phase of the array antennas. In an MPS system when the
array antennas are fed in order to generate a Rayleigh faded signal, by sweeping their phases, then the
other array antennas produces unwanted disturbance at the DUT due to mutual coupling among them
thus, contributing to the measurement uncertainty in a MPS system.
Mutual coupling refers to the electromagnetic interactions between the elements of an antenna array.
Some of the energy transmitted by a transmit antenna element is transferred to the other elements.
Correspondingly, a portion of the energy in the incident field of a receive antenna element is
transferred to the nearby elements. Another way of describing the effect of mutual coupling is that the
electric field generated by one element alters the current distribution, as well as distorts the
radiation/reception pattern of the other elements as compared to their isolated radiation/reception
patterns [3]. Moreover, the mutual coupling among array antennas depends on their radiation

Dhayalini Ramamoorthy Impact of Mutual Coupling among Antenna Arrays on the Performance of the Multipath Simulator System
2
characteristics, relative separation and orientation [2]. Hence, it is very important to investigate the
impact of mutual coupling on the accuracy of measurements in a MPS system.
1.2 Motivation of the thesis
Antenna arrays are widely employed in both commercial and military applications. Consequently,
there are many research topics devoted to enhance the performance of the various array configurations
used. In particular, mutual coupling between the antenna elements in an antenna array is a potential
source of performance degradation. Depending on the application, errors due to mutual coupling can
be significant. Mutual coupling variations between the elements are a source of amplitude and phase
errors [15].
Why is a study on mutual coupling important?
The presence of mutual coupling distorts phase vectors of radiation sources [15]. This can cause
severe degradation of the performance in radar as well as increasing the bit error rate (BER) in
communication antennas, if it is not properly compensated. The study of MIMO systems is more
advantageous and also it is seen that the MIMO performances are linked to the mutual coupling and
diversity of the systems. In order to incorporate the best advantages of MIMO systems, the element
antennas need to be sufficiently spaced in the mobile systems. However, large sized antennas cannot
be implemented in the mobile terminals. The existence of mutual coupling has to be taken in account
in small size arrays and it affects the MIMO performances [4]. Mutual coupling increases with the
reduced antenna spacing which causes problems in achieving high capacity of the system.
Performance degradation in the MIMO systems due to the mutual coupling effect of antenna arrays is
a well-known phenomenon and there are many compensation methods proposed throughout the years.
In particular, the spacing between the array antennas is analyzed by many researchers to have low
coupling effect in the system. In this thesis work, various antenna array configurations has been
modelled using HFSS to see the impact of coupling within the array and a MPS system is finally
suggested which has low coupling effects.
1.3 Objective of the thesis
The main objective of this thesis work is to study the impact of mutual coupling among various array
antenna configurations in a MPS system by performing numerical simulations in High Frequency
Structure Simulator (HFSS). As a test case, a two dipole antenna configuration is simulated and its
radiation pattern and mutual coupling between them is studied. In this present thesis, a uniform

Dhayalini Ramamoorthy Impact of Mutual Coupling among Antenna Arrays on the Performance of the Multipath Simulator System
3
circular array (UCA) with NMPS vertical dipole antennas is built with array radius of R x (Lamda)
along with the test object (DUT) at the center, which satisfies the far-field boundary conditions and
covers all the frequency bands for mobile phones. HFSS simulations are performed to analyze and
compare the S-parameters (S21: Forward transmission coefficient parameter) and their radiation
patterns of different array antenna configurations. Here, the radius of the MPS array antennas and the
number of elements in the UCA are varied to understand the effects on the mutual coupling between
the array elements and the DUT.
Dhayalini Ramamoorthy Impact of Mutual Coupling among Antenna Arrays on the Performance of the Multipath Simulator System
4
2 Theory
In this chapter, basic antenna concepts, half wave dipole antenna, uniform circular array and mutual
coupling is briefly discussed.
2.1 Basic Antenna Concepts
An antenna is defined as “a usually metallic device (as a rod or wire) for radiating or receiving radio
waves” [2]. Electromagnetic waves are often referred to as radio waves. Antennas are widely used in
radio communication system. There are different types of antennas depending on their electrical
characteristics, shape and size such as monopole, dipole, parabolic, micro strip, dielectric resonators,
PIFA, Yagi-uda etc. Most antennas are resonant devices, which operate efficiently over a relatively
narrow frequency band. An antenna must be tuned (matched) to the same frequency band as the radio
system to which it is connected, otherwise reception and/or transmission will be impaired. The
electromagnetic behavior and the operation of antennas can be described by Maxwell’s equations [5,
6].
(1)
(2)
(3)
(4)
The electric and magnetic fields dominate the field regions of the antenna. The effect of these
fields can be characterized by the magnetic and the electric flux density vectors. The regions
surrounding the antenna are referred to as the “reactive near-field”, “radiating near-field” and “far-
field”, or Fraunhofer region of an antenna [2].
2.1.1 Radiation Pattern
An antenna radiation pattern or antenna pattern is defined as “mathematical function or a graphical
representation of the radiation properties of the antenna as a function of space coordinates. In most
cases, the radiation pattern is determined in the far-field region and is represented as s function of the
directional coordinates [2]. Based on the standard coordinate system, two geometrical principal planes
can be defined: azimuth and elevation plane. The azimuth plane is defined as the plane in which the
radiation pattern varies as a function of ϕ when θ = π/2; the elevation plane is defined as the plane in
which the radiation pattern varies as a function of θ, when ϕ is constant. Typically, a two dimensional
(2D) radiation pattern shows the variation of amplitude/power as a function of either θ or ϕ, whereas a

Dhayalini Ramamoorthy Impact of Mutual Coupling among Antenna Arrays on the Performance of the Multipath Simulator System
5
three dimensional (3D) radiation pattern shows the variation of amplitude/power as a function of both
θ and ϕ at a given frequency [7].
The different radiation patterns can be defined as in [2] as follows:
Isotropic radiation pattern: An isotropic radiation pattern is obtained from a hypothetical lossless
antenna having equal radiation in all directions. Isotropic patterns are not physically realizable.
Directional radiation pattern: A directional radiation pattern is obtained from a directional antenna
by radiating or receiving electromagnetic waves more effectively in some directions than in others.
Omnidirectional radiation pattern: An omnidirectional radiation pattern is defined as the pattern
having a non-directional radiation pattern in a given plane and a directional pattern in any orthogonal
plane. A dipole antenna exhibits omnidirectional pattern.
Fig. 1. Simulated 3D radiation pattern of a half-wave dipole antenna at 2.6GHz using HFSS software.
An example of three dimensional (3D) radiation patterns showing the variation of power as a function
of both θ and ϕ at 2.6GHz frequency is shown in Fig. 1. In this case, along the z-axis there is very little
power transmitted. In the x-y plane (perpendicular to z-axis), the radiation of the antenna is maximum.
These plots are helpful for determining how the antenna radiates and in which direction it radiates.
2.1.2 Directivity
The directivity D(θ,ϕ) of an antenna is a measure that describes how well the antenna directs the
radiated energy. The directivity of an antenna depends on the shape of the radiation pattern. According
to [2], the directivity of an antenna is defined as: “the ratio of the radiation intensity in a given
direction from the antenna to the radiation intensity averaged over all directions”.
Mathematically, directivity can be measured by using the following equation [2]:
(5)

Dhayalini Ramamoorthy Impact of Mutual Coupling among Antenna Arrays on the Performance of the Multipath Simulator System
6
where, U(θ,ϕ) is the radiation intensity, TRP = ∮ is the total radiated power (obtained by
integrating the radiation intensity over the entire space) and Ω = sinθdθdϕ is the solid angle. Usually,
directivity refers to the maximum directivity and it is dimensionless. Generally, it is denoted in dB.
2.1.3 Gain
The gain G(θ,ϕ) of an antenna takes into consideration both the losses in the antenna and its
directivity. It can be defined as [2]: “the ratio of the intensity, in a given direction, to the radiation
intensity that would be obtained if the power accepted by the antenna were radiated isotropically.”
Mathematically, gain can be computed as follows [2]:
(6)
where, is the net accepted power by the antenna. Usually, the gain refers to the maximum
gain. Depending on the type of reference antenna used (e.g., dipole or an isotropic antenna), the gain is
measured in dBi or -2.15 dBd.
2.1.4 Scattering parameters
To analyze and compare the performance of the designed antenna, one of the most important
parameter to be considered is scattering parameter (S-parameter). S-parameters describe the input-
output relationship between the ports in an electrical system. It provides information such as power
transmitted, power reflected, gain, impedance match, resonant frequency and coupling between the
ports. For a two port device, S21 represents the power transferred from port 1 to port 2. In the thesis
work presented, the most important S-parameter discussed is S21 which gives the coupling between the
elements of an antenna array. S21 is called scattering transmission parameter which occurs due to
coupling.
2.1.5 Polarization
The polarization defines [11] the plane of oscillation of the tip of the electrical field vector of an
electromagnetic wave. Polarization of the transmitted wave is defined as [2]: “that property of an
electromagnetic wave describing the time varying direction and relative magnitude of the electric field
vector, specifically, the figure traced as a function of time by the extremity of the vector at a fixed
location in space, and the sense in which it is traced, as observed along the direction of propagation.”
The polarization of an antenna in any given direction is defined as the polarization of the wave
radiated by the antenna. The polarization of an antenna is characterized by its axial ratio (AR), sense
of rotation and the tilt angle τ. The polarization of an antenna depends on the shape of the curve. The
different types of polarization are: linear, circular and elliptical. Linear (vertical or horizontal) and
circular polarizations (left or right hand polarization) are special cases of elliptical polarization. Right

Dhayalini Ramamoorthy Impact of Mutual Coupling among Antenna Arrays on the Performance of the Multipath Simulator System
7
hand polarization is achieved by clockwise rotation of the electric field vector whereas left hand
polarization by counterclockwise rotation of the electric field vector.
2.2 Field Regions
The space surrounding an antenna is usually subdivided into three regions: (a) reactive near-field, (b)
radiating near-field (Fresnel) and (c) far-field (Fraunhofer) regions as shown in Fig. 2.
Reactive near-field region is defined as “that portion of the near-field region immediately surrounding
the antenna wherein the reactive field predominates.” For a very short dipole, or equivalent radiator,
the outer boundary is commonly taken to exist at a distance λ/2π from the antenna surface [2].
Radiating near-field region is defined as “that region of the field of an antenna between the reactive
near-field region and the far-field region wherein radiation fields predominate and wherein the angular
field distribution is dependent upon the distance from the antenna. If the antenna has a maximum
dimension that is not large compared to the wavelength, this region may not exist [2].
Far-field or Fraunhofer region is defined as “that region of the field of an antenna where the angular
field distribution is essentially independent of the distance from the antenna”.
Fig. 2. Field regions of a thin dipole antenna [7].

Dhayalini Ramamoorthy Impact of Mutual Coupling among Antenna Arrays on the Performance of the Multipath Simulator System
8
2.2.1 Far-field region
The far-field region is the region where the Poynting vector is practically real. The fields in this region
decay with 1/r and the relative angular distribution of fields (the radiation pattern) is independent of r,
where r is the distance from the center of the source antenna. This region is also called the Fraunhofer
region. In practice, the most commonly used criterion for minimum distance of far-field observations
of an antenna with maximum dimension D and wavelength λ is R and is given by R = 2D2/λ. If the
antenna has a maximum overall dimension D, the far-field region is commonly taken to exist at
distances greater than 2D2/λ from the antenna, λ being the wavelength. The inner boundary is taken to
be the radial distance R = 2D2/λ and the outer one at infinity. Because infinite distances are not
realizable in practice, the most commonly used criterion for minimum distance of far-field
observations is 2D2/λ [2].
2.3 Half wave dipole antenna
A dipole is a very basic antenna structure consisting of two straight collinear wires as depicted in Fig.
3. One of the most commonly used antennas is the half-wavelength (l = λ/2) dipole. Because its
radiation resistance is 73 ohms, which is very near to the 75-ohm characteristic impedance of some
transmission lines, its matching to the line is simplified especially at resonance.
Fig. 3. A basic dipole antenna [8].
The electric and magnetic field components of a half-wavelength dipole can be obtained from [2] by
letting l = λ/2.
[
] (7)
[
] (8)
Dhayalini Ramamoorthy Impact of Mutual Coupling among Antenna Arrays on the Performance of the Multipath Simulator System
9
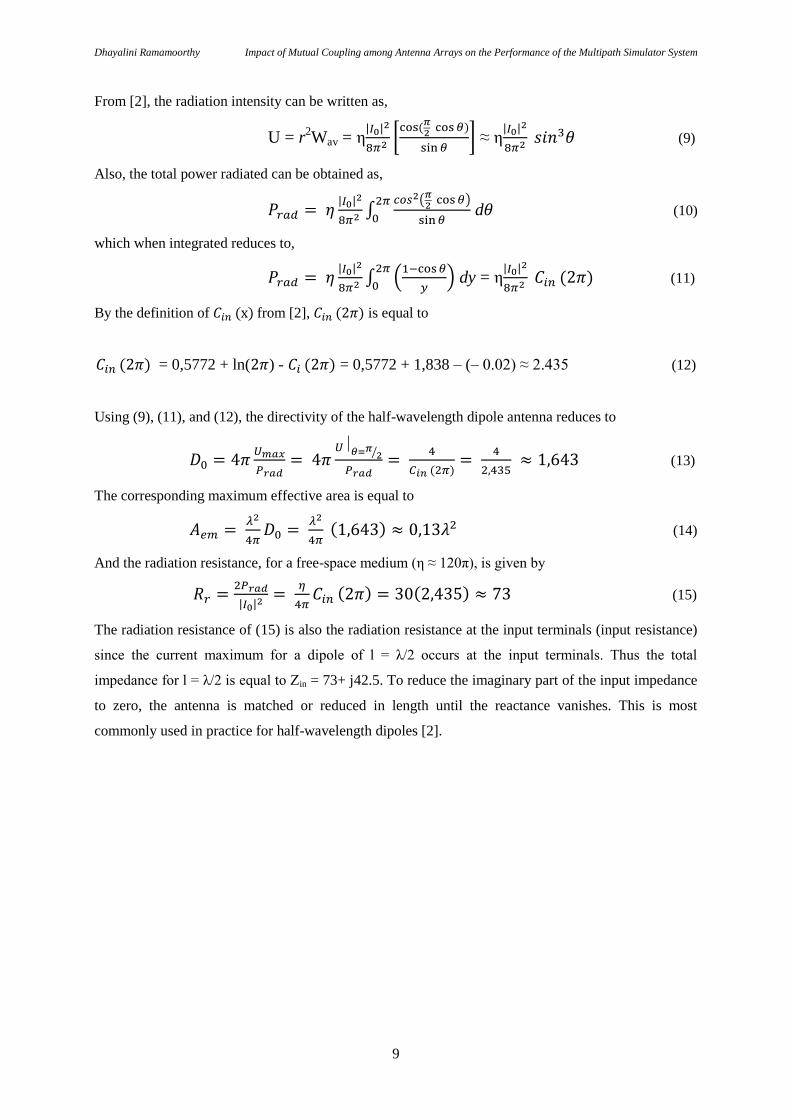
From [2], the radiation intensity can be written as,
U = r2Wav = η
| |
[
] ≈ η
| |
(9)
Also, the total power radiated can be obtained as,
| |
∫ (
)
d (10)
which when integrated reduces to,
| |
∫ (
)
dy = η
| |
(11)
By the definition of from [2], is equal to
= 0,5772 + ln( ) - = 0,5772 + 1,838 – (– 0.02) ≈ 2.435 (12)
Using (9), (11), and (12), the directivity of the half-wavelength dipole antenna reduces to
⁄
(13)
The corresponding maximum effective area is equal to
(14)
And the radiation resistance, for a free-space medium (η ≈ 120π), is given by
| |
(15)
The radiation resistance of (15) is also the radiation resistance at the input terminals (input resistance)
since the current maximum for a dipole of l = λ/2 occurs at the input terminals. Thus the total
impedance for l = λ/2 is equal to Zin = 73+ j42.5. To reduce the imaginary part of the input impedance
to zero, the antenna is matched or reduced in length until the reactance vanishes. This is most
commonly used in practice for half-wavelength dipoles [2].
Dhayalini Ramamoorthy Impact of Mutual Coupling among Antenna Arrays on the Performance of the Multipath Simulator System
10
2.4 Uniform circular antenna array
The dipole antenna is one of the simplest antennas and its radiation properties are well documented.
Since it is also widely used in wireless communications, we construct an N-element UCA with dipoles
as shown in Fig. 4 [10].
2.4.1 Antenna Arrays
The radiation characteristics of a single element antenna are relatively wide and each element provides
low values of directivity. But in many applications it is necessary to design antennas with very high
gain and directivity. Enlarging the dimensions of single elements without necessarily increasing the
size of the individual elements is to form an assembly of radiating elements in an electrical and
geometrical configuration. This new antenna, formed by multi-elements, is referred to as an array. In
most cases, the elements of an array are identical. The total field of the array is determined by the
vector addition of the fields radiated by the individual elements. This assumes that the current in each
element is the same as that of the isolated element [2]. Antennas exhibit a specific radiation pattern.
The overall radiation pattern changes when several antenna elements are combined in an array. This is
due to the so called array factor: this factor quantifies the effect of combining radiating elements in an
array without the element specific radiation pattern taken into account. The overall radiation pattern of
an array is determined by the array factor combined with the radiation pattern of the antenna element.
The overall radiation pattern results in a certain directivity and thus gain linked through the efficiency
with the directivity. Directivity and gain are equal if the efficiency is 100% [12]. In an array of
identical elements, there are five controls that can be used to shape the overall pattern of the antenna.
These are [2]:
the geometrical configuration of the overall array (linear, circular, rectangular, spherical, etc.)
the relative displacement between the elements
the excitation amplitude of the individual elements
the excitation phase of the individual elements
the relative pattern of the individual elements

Dhayalini Ramamoorthy Impact of Mutual Coupling among Antenna Arrays on the Performance of the Multipath Simulator System
11
2.4.2 Circular array
The circular array antenna is a prime candidate because of its ability to scan a beam electronically
through 3600, with a little change of either beam-width or side lobe level [9]. Also in a circular array
the elements are placed in a circular ring, is an array configuration of very practical interest.
Fig. 4. Geometry of N element Dipole Uniform Circular array [10].
The array factor of a UCA is ∑ , where = ,
k = 2π/λ, wn, θn and ϕn are the excitation and angular positions of the nth element respectively, and a is
the radius of the UCA.
Representation: The representation of an array consists of two parts namely array geometry and array
pattern. Array geometry defines the physical locations of the antenna elements in an array. Within
each geometry, array elements can be arranged uniformly or non-uniformly. Second part of array
configuration is the array pattern. In general, it is assumed that all elements in the array have isotropic
element patterns. When the combination of these elements is considered, they form the array pattern
which is a function of array geometry.
2.5 Mutual Coupling
It is intrinsic to the nature of antennas that when two antennas are in proximity and one is transmitting,
the second will receive some of the transmitted energy, with the amount dependent on their separation
and relative orientation. Even if both antennas are transmitting, they will simultaneously receive part
of each other's transmitted energy. Furthermore, antennas re-scatter a portion of any incident wave and
thus act like small transmitters even when they are nominally only receiving. The result is that energy

Dhayalini Ramamoorthy Impact of Mutual Coupling among Antenna Arrays on the Performance of the Multipath Simulator System
12
interchange between a particular element of an array and a remote point occurs not only by the direct
path, but also indirectly via scattering from the other antennas of the array. This effect is a
manifestation of the "mutual coupling" that exists between array antennas. It is not usually a negligible
effect and complicates the design of such antennas [16]. The amount of mutual coupling depends [2]
primarily on the
a) radiation characteristics of each
b) relative separation between them
c) relative orientation of each
Fig. 5. Coupling in receiving mode [2].
The mechanism of mutual coupling in receiving mode is shown in Fig. 5. Assume that a plane wave
(0) is incident, and it strikes antenna m first where it causes current flow. Part of the incident wave will
be re-scattered into space as (2), the other will be directed toward antenna n as (3) where it will add
vectorially with the incident wave (0), and part will travel into its feed as (1). It is then evident that the
amount of energy received by each element of an antenna array is the vector sum of the direct waves
and those that are coupled to it parasitically from the other elements [2].
2.5.1 Mutual coupling on circular array
The effects of the mutual coupling on the performance of an array depends [2] upon the
a) antenna type and its design parameters
b) relative positioning of the elements in the array
c) feed of the array elements
d) scan volume of the array

Dhayalini Ramamoorthy Impact of Mutual Coupling among Antenna Arrays on the Performance of the Multipath Simulator System
13
These design parameters influence the performance of the antenna array by varying its element
impedance, reflection coefficients, and overall antenna pattern. In a finite element array, the multipath
routes the energy follows because of mutual coupling will alter the pattern in the absence of these
interactions. However, for a very large regular array the relative shape of the pattern will be the same
with and without coupling interactions [2]. Mutual coupling is more complicated in small arrays since
each element have different pattern due to edge effects. On the other hand, in large arrays, each
element sees essentially the same environment, and mutual coupling can be taken into account by
modifying the element pattern, [17]. The array antennas receive signals from each other. All array
antennas are assumed to be terminated and matched so that the received power does not reflect back.
For simple resonant antenna types such as dipoles, the scattered power is equal in magnitude to the
received power. This inequality provides a relation between the mutual coupling and scattering within
the array [20].
If mutual coupling is neglected, radiation pattern of an antenna array, composed of identical elements,
is the product of element factor and array factor. The antenna element pattern, when antenna element
stands alone (means all environmental effects are ignored), is named as isolated element pattern.
Unfortunately in practice, environmental effects such as mutual coupling may cause major distortions
in element patterns. The element pattern in a real array environment is called as an active element
pattern. If the isolated element patterns are used instead of active element patterns, significant
degradation can be observed in array performance, [18].

Dhayalini Ramamoorthy Impact of Mutual Coupling among Antenna Arrays on the Performance of the Multipath Simulator System
14
2.6 Multipath Simulators
Multipath simulator (MPS) is an anechoic chamber MIMO over the air (OTA) technique, used for
testing mobile phone antennas. It is an UCA with device under test (DUT) centrally placed and it
emulates the multipath environment by applying realistic signals to the array antennas and by
sweeping the phase of the array antennas.
Fig. 6. Arrangement of antennas in a single DUT MPS system.
The MPS consists of an array of antennas (also called a multi-probe system), which encircle an AUT
at a distance of a few wavelengths, [1, 13, 14] and a feed network that distributes the signals over the
array to apply different amplitudes and varying phase shifts at the array antennas. Thus, several waves
are generated out of the MPS antennas, and upon superposition at the AUT, the waves simulate a
multipath fading environment. An arrangement of 8 array antennas with single DUT at the center of
the MPS is shown in Fig.6. There are many researches done on the MPS technique describing the
various parameters that influence the measurement uncertainty of the system. For instance, in [1], an
experimental UCA multipath simulator was built at frequencies from 2GHz-2.6GHz and concluded
that 16 MPS antennas should be used for better performance of the system. In this project work, the
scattering within the MPS array antennas is investigated in terms of mutual coupling (MC). The design
criteria for an MPS system in terms of the number of MPS array antennas and the radius of the MPS
array are also presented.

Dhayalini Ramamoorthy Impact of Mutual Coupling among Antenna Arrays on the Performance of the Multipath Simulator System
15
2.6.1 MPS Scattering model
The scattering within the MPS array antennas are studied by designing a uniform circular array (UCA)
of radius R consisting of NMPS antennas with single DUT antenna at the center. The elements of the
array are matched half-wave dipole antennas. In this work it is assumed that all the elements in the
array are identical and located in the far-field region. Hence, the distance between any two adjacent
MPS antennas in the array RMPS-MPS must satisfy the Fraunhofer distance criterion for the far-field
shown in section 2.2.1 [7] and can be written as follows:
(16)
where, LMPS be the largest dimension of the MPS antennas in the array.
Considering the geometry from Fig. 4, the distance between any two adjacent MPS array antennas can
be written as follows:
(
) (17)
By substituting (17) in (16) we get,
(
)
(18)
The inequalities (18) for λ/2-dipole MPS antennas can be written as follows:
(
) (19)
Hence, a MPS system can be designed such that all of its antennas are in the far-field region relative to
each other and it satisfies the above limitations.

Dhayalini Ramamoorthy Impact of Mutual Coupling among Antenna Arrays on the Performance of the Multipath Simulator System
16
3 HFSS simulations and results
The extent and nature of the effects of mutual coupling in different antennas array configurations are
investigated by varying the array radius and number of elements in UCA pattern systematically. In this
thesis work, ANSYS HFSS (High frequency structure simulator) software is used for simulating the
radiation patterns of antenna arrays and measuring the mutual coupling between the array elements
and DUT. In general, for designing and computing the results of the antenna pattern in higher
frequency, HFSS is an essential numerical tool used for predicting the trend of the coupling co-
efficient in an antenna array. To better understand the impact of mutual coupling in antenna arrays, the
active and isolated element patterns for all the different UCA configurations are compared and
analyzed. In other words, the integrated element pattern, with all ports excited and the average of all
the isolated element patterns (single port excited) are computed and their difference yields the
coupling coefficient of the system. In the subsequent sections, these coupling coefficients with and
without mutual coupling are computed, compared and analyzed in detail.
3.1 Theoretical Design
In this work, dipole antennas are modeled in HFSS at a frequency of 2.6 GHz, which gives rise to a
wavelength (λ= c/f) of 11.54 cm. The dipoles used are vertical wire dipole antennas of copper material
with air filled radiation box as shown in Fig. 8(a). In the simulation design, radius of antenna is 0.0577
cm (λ/200), total length of antenna is 5.77 cm (λ/2) and spacing between the antennas is (λ/2). Spacing
between the inter-element antennas can be different for different types of antennas depending upon the
antenna characteristics. However in this work, λ/2 is chosen so that it gives low coupling correlation
between the antennas in order to get a better diversity gain. The lumped ports used for the excitation of
the vertical dipoles are placed at a dipole gap height of 0.01334 cm. The radiation air box enclosure is
modelled in such a way that the far-field boundary condition (Fraunhofer distance) is satisfied. The
radius and the height of the outer radiation air box are (array radius+λ) and (dipole height+λ)
respectively. For all the simulations, the fast solver sweep scheme is used to sweep through a
frequency range of 1.6 GHz to 3.6 GHz. It is important to select a frequency sweep range for the fast
sweep scheme in such a way that the solution frequency (2.6 GHz) lies exactly in the middle for better
accuracy. The default values for the maximum number of passes and maximum delta S is maintained
for all the simulations performed in this project. The model outline for the array radius of 10 λ and 4
dipole element case is shown in Fig. 7.

Dhayalini Ramamoorthy Impact of Mutual Coupling among Antenna Arrays on the Performance of the Multipath Simulator System
17
Fig. 7. HFSS model design with array radius of 10λ and NMPS = 4.
DUT
Dipole 1
Lumped port

Dhayalini Ramamoorthy Impact of Mutual Coupling among Antenna Arrays on the Performance of the Multipath Simulator System
18
3.2 Two Dipole Antenna case
As a preliminary test, a two-dipole antenna case is designed in order to check the radiation pattern and
mutual coupling between them. The two dipole antenna case studied is configured as a linear array
with the dipole axis along the z-axis as shown in Fig. 8(a). The dipole antennas are wire antennas with
length 5.77 cm and radius 0.0577 cm. They are placed in an air filled radiation box of radius 2.94 cm
and are separated by a distance of 3.5λ (40.39 cm). The 3D radiation pattern of simulated two-dipole
antenna case is shown in Fig. 8(b). Also from Fig.(9), the mutual coupling between the two dipoles is
computed as -31.25 dB.
(a) HFSS Design (b) 3D-Radiation pattern
Fig. 8. Design and Radiation pattern of two dipole antennas.
Fig. 9. Measured S21 parameter for two dipole antenna case.
1.50 1.75 2.00 2.25 2.50 2.75 3.00 3.25 3.50 3.75Freq [GHz]
-55.00
-50.00
-45.00
-40.00
-35.00
-30.00
-25.00
dB
(S(2
,1))
HFSSDesign1Mutual Coupling between 2 dipoles ANSOFT
m1
Curve Info
dB(S(2,1))Setup1 : Sw eep
Name X Y
m1 2.6000 -31.2456
Dipole 1
Dipole 2

Dhayalini Ramamoorthy Impact of Mutual Coupling among Antenna Arrays on the Performance of the Multipath Simulator System
19
3.3 Impact of MC by increasing Array radius for NMPS = 8
A detailed analysis is performed for the uniform circular array (UCA) configuration of a typical MPS
system by increasing the array radius from 2λ to 10λ in order to understand the effect of their
respective mutual coupling among the array elements. It is noted that for all the simulation in this sub-
section, the number of elements in the array is kept constant (NMPS = 8). A coupling coefficient is
introduced to evaluate mutual coupling, which is defined as the difference between the averages of the
S21 between active and isolated element patterns.
Table 1. Simulated results for increasing array radius with NMPS = 8.
3.3.1 Case-(I) Array radius of 2λ
In this case, the UCA MPS arrangement is characterized by having eight λ/2-dipole array antennas
with the radius of 2λ, which is 23.08 cm. The integrated and isolated element pattern of this setup is
simulated. At the positions where the array elements are located, the shape and the color of the
Port no., Integrated S (dB) Isolated S (dB) Integrated S (dB) Isolated S (dB)
1 -20,8461 -24,6727 -26,8555 -27,8785
2 -20,8602 -25,013 -26,8212 -27,9542
3 -20,8643 -25,0621 -26,8227 -27,9182
4 -20,8809 -25,0129 -26,8167 -27,8953
5 -20,8442 -24,9458 -26,8156 -27,9852
6 -20,8557 -24,9186 -26,8605 -28,0721
7 -20,8553 -24,994 -26,7953 -27,9638
8 -20,8594 -24,8475 -26,8395 -27,9987
Avg (dB) -20,8582625 -24,933325 -26,828375 -27,95825
Diff (dB)
Port no., Integrated S (dB) Isolated S (dB) Integrated S (dB) Isolated S (dB)
1 -33,4143 -34,3472 -41,0273 -41,4742
2 -33,3751 -34,3066 -41,0154 -41,5144
3 -33,3777 -34,1905 -41,1273 -41,5435
4 -33,379 -34,3716 -41,2474 -41,5821
5 -33,3897 -34,3061 -41,1035 -41,5338
6 -33,3536 -34,3571 -41,0863 -41,4449
7 -33,3194 -34,2845 -41,148 -41,5091
8 -33,3784 -34,2326 -41,1183 -41,6245
Avg (dB) -33,3734 -34,299525 -41,1091875 -41,5283125
Diff (dB) 0,926125 0,419125
3.5 Lamda 8 elements2 Lamda 8 elements
4,0750625 1,129875
6 Lamda 8 elements 10 Lamda 8 elements

Dhayalini Ramamoorthy Impact of Mutual Coupling among Antenna Arrays on the Performance of the Multipath Simulator System
20
radiation contours between the integrated and isolated cases are distinctively different as shown in Fig.
10 and Fig. 11. Therefore, the coupling between the array elements is very high in the 2λ MPS system.
Fig. 10. Integrated radiation pattern with array radius of 2λ in [dB] and [mV] respectively.
Fig. 11. Isolated element pattern of dipole placed with radius of 2λ in [dB] and [mV] respectively.
The S-parameter, S21, the forward transmission parameter is measured when all ports are excited
including the DUT at the center of the MPS system. This gives the integrated S21 (array with mutual
coupling). From Table 1, the average of the measured S21 is found to be -20.85 dB. Now, when only
one port is excited (here port 1) having all the other ports as passive scatterers, S21 is calculated to be
-24.67 dB and is shown in Fig. 13. This gives the isolated value of S21 (without mutual coupling) for
port1.

Dhayalini Ramamoorthy Impact of Mutual Coupling among Antenna Arrays on the Performance of the Multipath Simulator System
21
Fig. 12. Measured integrated S21 parameter of the MPS with array radius of 2λ (with MC).
Fig. 13. Measured isolated S21 parameter of the MPS with array radius of 2λ (without MC).
By exciting each and every port separately, the average of all the isolated cases are taken and is found
to be -24.94 dB and is shown in Table 1. The difference between the averaged values of integrated and
isolated S21 parameters gives a measure of the extent of the mutual coupling in UCA. Thus the
1.50 1.75 2.00 2.25 2.50 2.75 3.00 3.25 3.50 3.75Freq [GHz]
-40.00
-30.00
-20.00
-42.50
-32.50
-22.50
-40.00
-30.00
-20.00
-37.50
-27.50
-38.00
-28.00
-36.00
-26.00
-38.00
-28.00
-37.50
-27.50
Curve Info
dB(S(AUT,1))Setup1 : Sw eep
dB(S(AUT,2))Setup1 : Sw eep
dB(S(AUT,3))Setup1 : Sw eep
dB(S(AUT,4))Setup1 : Sw eep
dB(S(AUT,5))Setup1 : Sw eep
dB(S(AUT,6))Setup1 : Sw eep
dB(S(AUT,7))Setup1 : Sw eep
dB(S(AUT,8))Setup1 : Sw eep
HFSSDesign1Integrated S-parameter (2 lamda & 8 elements) ANSOFTm1
m2
m3
m4
m5
m6
m7
m8
Name X Y
m1 2.6000 -20.8461
m2 2.6000 -20.8602
m3 2.6000 -20.8643
m4 2.6000 -20.8809
m5 2.6000 -20.8442
m6 2.6000 -20.8557
m7 2.6000 -20.8553
m8 2.6000 -20.8594
1.50 1.75 2.00 2.25 2.50 2.75 3.00 3.25 3.50 3.75Freq [GHz]
-42.50
-40.00
-37.50
-35.00
-32.50
-30.00
-27.50
-25.00
-22.50
dB
(S(A
UT
,1))
HFSSDesign1Isolated S-parameter for port1 (2 lamda & 8 elements) ANSOFT
m1
Curve Info
dB(S(AUT,1))Setup1 : Sw eep
Name X Y
m1 2.6000 -24.6727
Dhayalini Ramamoorthy Impact of Mutual Coupling among Antenna Arrays on the Performance of the Multipath Simulator System
22
coupling for 2λ with 8 elements MPS system is calculated as 4.07 dB. Hence, -4.07 dB can be added to
cancel the effect of coupling in-order to compensate for 2λ MPS system, thereby improving the
performance of the system.
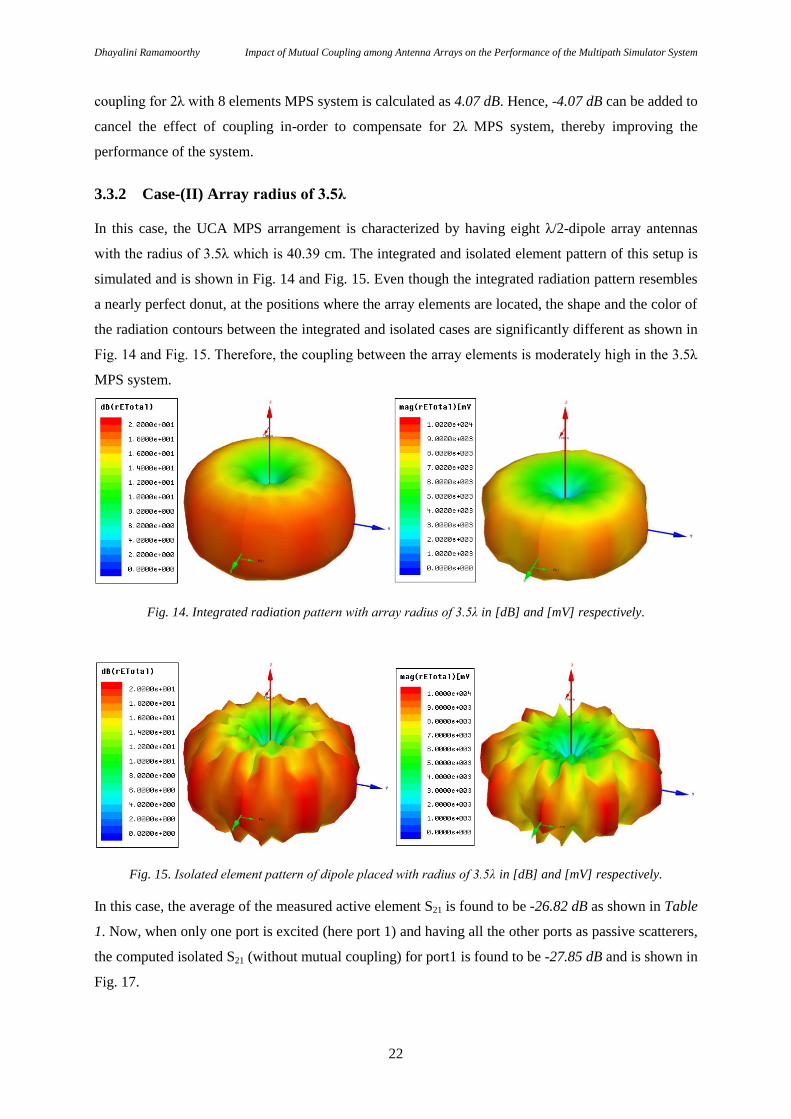
3.3.2 Case-(II) Array radius of 3.5λ
In this case, the UCA MPS arrangement is characterized by having eight λ/2-dipole array antennas
with the radius of 3.5λ which is 40.39 cm. The integrated and isolated element pattern of this setup is
simulated and is shown in Fig. 14 and Fig. 15. Even though the integrated radiation pattern resembles
a nearly perfect donut, at the positions where the array elements are located, the shape and the color of
the radiation contours between the integrated and isolated cases are significantly different as shown in
Fig. 14 and Fig. 15. Therefore, the coupling between the array elements is moderately high in the 3.5λ
MPS system.
Fig. 14. Integrated radiation pattern with array radius of 3.5λ in [dB] and [mV] respectively.
Fig. 15. Isolated element pattern of dipole placed with radius of 3.5λ in [dB] and [mV] respectively.
In this case, the average of the measured active element S21 is found to be -26.82 dB as shown in Table
1. Now, when only one port is excited (here port 1) and having all the other ports as passive scatterers,
the computed isolated S21 (without mutual coupling) for port1 is found to be -27.85 dB and is shown in
Fig. 17.

Dhayalini Ramamoorthy Impact of Mutual Coupling among Antenna Arrays on the Performance of the Multipath Simulator System
23
Fig. 16. Measured integrated S21 parameter of the MPS with array radius of 3.5λ (with MC).
Fig. 17. Measured isolated S21 parameter of the MPS with array radius of 3.5λ (without MC).
By exciting each and every port separately, the average of all the isolated cases are taken and is found
to be -27.95 dB and is shown in Table 1. The difference between the averaged values of integrated and
isolated S21 parameters gives a measure of the extent of the mutual coupling in UCA. Thus the
1.50 1.75 2.00 2.25 2.50 2.75 3.00 3.25 3.50 3.75Freq [GHz]
-38.00
-33.00
-28.00
-42.00
-32.00
-38.00
-33.00
-28.00
-40.00
-35.00
-30.00
-40.00
-35.00
-30.00
-42.00
-32.00
-40.00
-35.00
-30.00
-38.00
-33.00
-28.00
Curve Info
dB(S(AUT,1))Setup1 : Sw eep
dB(S(AUT,2))Setup1 : Sw eep
dB(S(AUT,3))Setup1 : Sw eep
dB(S(AUT,4))Setup1 : Sw eep
dB(S(AUT,5))Setup1 : Sw eep
dB(S(AUT,6))Setup1 : Sw eep
dB(S(AUT,7))Setup1 : Sw eep
dB(S(AUT,8))Setup1 : Sw eep
HFSSDesign1Integrated S-parameter (3.5 lamda & 8 elements) ANSOFTm1
m2
m3
m4
m5
m6
m7
m8
Name X Y
m1 2.6000 -26.8555
m2 2.6000 -26.8212
m3 2.6000 -26.8227
m4 2.6000 -26.8167
m5 2.6000 -26.8156
m6 2.6000 -26.8605
m7 2.6000 -26.7953
m8 2.6000 -26.8395
1.50 1.75 2.00 2.25 2.50 2.75 3.00 3.25 3.50 3.75Freq [GHz]
-60.00
-55.00
-50.00
-45.00
-40.00
-35.00
-30.00
-25.00
dB
(S(A
UT
,1))
HFSSDesign1Isolated S-parameter for port 1 (3.5 lamda & 8 elements) ANSOFT
m1
Curve Info
dB(S(AUT,1))Setup1 : Sw eep
Name X Y
m1 2.6000 -27.8785

Dhayalini Ramamoorthy Impact of Mutual Coupling among Antenna Arrays on the Performance of the Multipath Simulator System
24
coupling for 3.5λ with 8 elements MPS system is calculated as 1.12 dB. Hence, -1.12 dB can be added
to cancel the effect of coupling in-order to compensate for 3.5λ MPS system to improve the results.
3.3.3 Case-(III) Array radius of 6λ
In this case, by increasing the array radius from 3.5λ to 6λ (from 40.39 cm to 69.24 cm), the integrated
and isolated element patterns are simulated and are shown in Fig. 18 and Fig. 19 respectively. At the
positions where the array elements are located, the shape and the color of the radiation contours
between the integrated and isolated cases looks almost similar to the naked eye as shown in Fig. 16
and Fig. 17. Therefore, the coupling between the array elements is less significant in the 6λ MPS
system.
Fig. 18. Integrated radiation pattern with array radius of 6λ in [dB] and [mV] respectively.
Fig. 19. Isolated element pattern of dipole placed with radius of 6λ in [dB] and [mV] respectively.
In this case, the average of the measured active element S21 is found to be -33.37 dB as shown in Table
1. Now, when only port 1 is excited and having all the other ports as passive scatterers, the calculated
isolated S21 (without mutual coupling) for port1 is found to be -34.35 dB and is shown in Fig. 21.

Dhayalini Ramamoorthy Impact of Mutual Coupling among Antenna Arrays on the Performance of the Multipath Simulator System
25
Fig. 20. Measured integrated S21 parameter of the MPS with array radius of 6λ (with MC).
Fig. 21. Measured isolated S21 parameter of the MPS with array radius of 6λ (without MC).
By exciting each and every port separately, the average of all the isolated cases are taken and is found
to be -34.29 dB and is shown in Table 1. The difference between the averaged values of integrated and
isolated S21 parameters gives a measure of the extent of the mutual coupling in UCA. Thus the
1.50 1.75 2.00 2.25 2.50 2.75 3.00 3.25 3.50 3.75Freq [GHz]
-42.00
-32.00
-50.00
-40.00
-30.00
-46.00
-36.00
-42.50
-32.50
-50.00
-40.00
-30.00
-44.00
-34.00
-44.00
-39.00
-34.00
-55.00
-42.50
-30.00
Curve Info
dB(S(AUT,1))Setup1 : Sw eep
dB(S(AUT,2))Setup1 : Sw eep
dB(S(AUT,3))Setup1 : Sw eep
dB(S(AUT,4))Setup1 : Sw eep
dB(S(AUT,5))Setup1 : Sw eep
dB(S(AUT,6))Setup1 : Sw eep
dB(S(AUT,7))Setup1 : Sw eep
dB(S(AUT,8))Setup1 : Sw eep
HFSSDesign1Integrated S-parameter (6 lamda & 8 elements) ANSOFT
m1
m2
m3
m4
m5
m6
m7
m8
Name X Y
m1 2.6000 -33.4143
m2 2.6000 -33.3751
m3 2.6000 -33.3777
m4 2.6000 -33.3790
m5 2.6000 -33.3897
m6 2.6000 -33.3536
m7 2.6000 -33.3194
m8 2.6000 -33.3784
1.50 1.75 2.00 2.25 2.50 2.75 3.00 3.25 3.50 3.75Freq [GHz]
-70.00
-65.00
-60.00
-55.00
-50.00
-45.00
-40.00
-35.00
-30.00
dB
(S(A
UT
,1))
HFSSDesign1Isolated S-parameter for port1 (6 lamda & 8 elements) ANSOFT
m1
Curve Info
dB(S(AUT,1))Setup1 : Sw eep
Name X Y
m1 2.6000 -34.3472
Dhayalini Ramamoorthy Impact of Mutual Coupling among Antenna Arrays on the Performance of the Multipath Simulator System
26
coupling for 6λ with 8 elements MPS system is calculated as 0.92 dB. Hence, -0.92 dB can be added to
cancel the effect of coupling in-order to compensate for 6λ MPS system to improve the results.
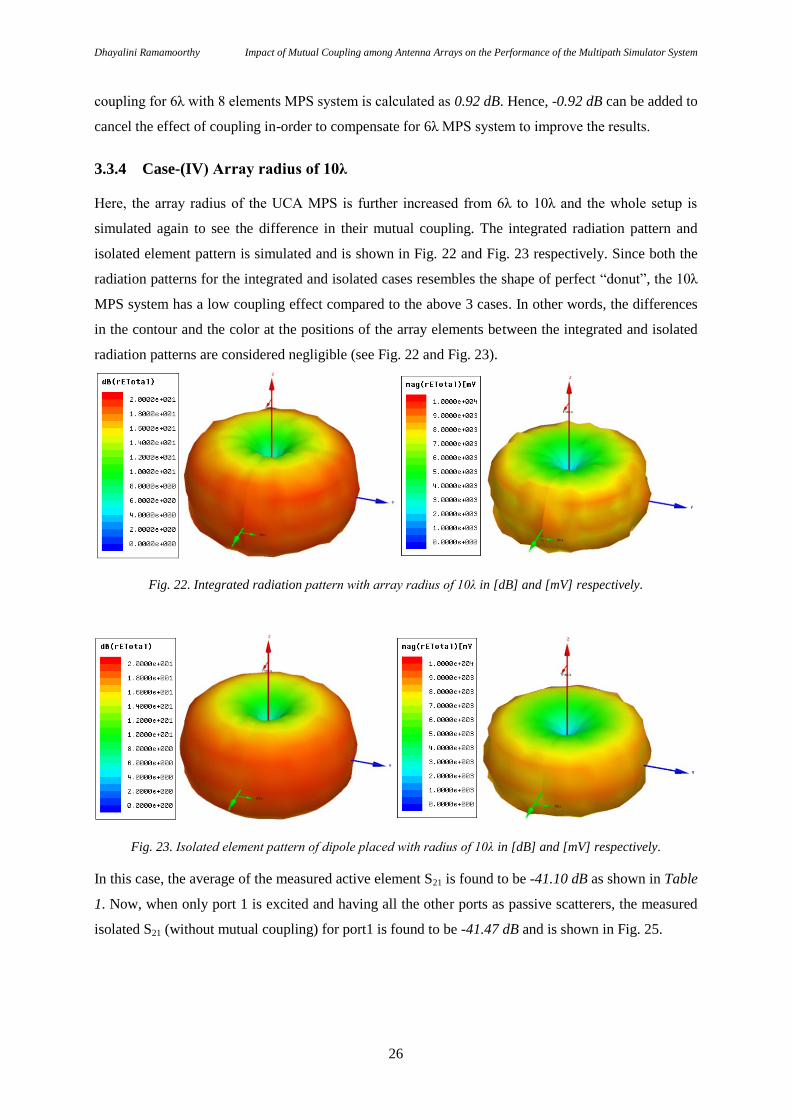
3.3.4 Case-(IV) Array radius of 10λ
Here, the array radius of the UCA MPS is further increased from 6λ to 10λ and the whole setup is
simulated again to see the difference in their mutual coupling. The integrated radiation pattern and
isolated element pattern is simulated and is shown in Fig. 22 and Fig. 23 respectively. Since both the
radiation patterns for the integrated and isolated cases resembles the shape of perfect “donut”, the 10λ
MPS system has a low coupling effect compared to the above 3 cases. In other words, the differences
in the contour and the color at the positions of the array elements between the integrated and isolated
radiation patterns are considered negligible (see Fig. 22 and Fig. 23).
Fig. 22. Integrated radiation pattern with array radius of 10λ in [dB] and [mV] respectively.
Fig. 23. Isolated element pattern of dipole placed with radius of 10λ in [dB] and [mV] respectively.
In this case, the average of the measured active element S21 is found to be -41.10 dB as shown in Table
1. Now, when only port 1 is excited and having all the other ports as passive scatterers, the measured
isolated S21 (without mutual coupling) for port1 is found to be -41.47 dB and is shown in Fig. 25.

Dhayalini Ramamoorthy Impact of Mutual Coupling among Antenna Arrays on the Performance of the Multipath Simulator System
27
Fig. 24. Measured integrated S21 parameter of the MPS with array radius of 10λ (with MC).
Fig. 25. Measured isolated S21 parameter of the MPS with array radius of 10λ (without MC).
By exciting each and every port separately, the average of all the isolated cases are taken and is found
to be -41.53 dB and is shown in Table 1. The difference between the averaged values of integrated and
isolated S21 parameters gives a measure of the extent of the mutual coupling in UCA. Thus the
1.50 1.75 2.00 2.25 2.50 2.75 3.00 3.25 3.50 3.75Freq [GHz]
-46.00
-36.00
-45.00
-35.00
-42.50
-32.50
-46.00
-36.00
-50.00
-40.00
-30.00
-45.00
-35.00
-45.00
-35.00
-50.00
-40.00
-30.00
Curve Info
dB(S(AUT,1))Setup1 : Sw eep
dB(S(AUT,2))Setup1 : Sw eep
dB(S(AUT,3))Setup1 : Sw eep
dB(S(AUT,4))Setup1 : Sw eep
dB(S(AUT,5))Setup1 : Sw eep
dB(S(AUT,6))Setup1 : Sw eep
dB(S(AUT,7))Setup1 : Sw eep
dB(S(AUT,8))Setup1 : Sw eep
HFSSDesign1Integrated S-parameter (10 lamda & 8 elements) ANSOFT
m1
m2
m3
m4
m5
m6
m7
m8
Name X Y
m1 2.6000 -41.0273
m2 2.6000 -41.0154
m3 2.6000 -41.1273
m4 2.6000 -41.2474
m5 2.6000 -41.1035
m6 2.6000 -41.0863
m7 2.6000 -41.1480
m8 2.6000 -41.1183
1.50 1.75 2.00 2.25 2.50 2.75 3.00 3.25 3.50 3.75Freq [GHz]
-80.00
-75.00
-70.00
-65.00
-60.00
-55.00
-50.00
-45.00
-40.00
dB
(S(A
UT
,1))
HFSSDesign1Isolated S-parameter for port1 (10 lamda and 8 elements) ANSOFT
m1
Curve Info
dB(S(AUT,1))Setup1 : Sw eep
Name X Y
m1 2.6000 -41.4742

Dhayalini Ramamoorthy Impact of Mutual Coupling among Antenna Arrays on the Performance of the Multipath Simulator System
28
coupling for 10λ with 8 elements MPS system is calculated as 0.419 dB. Hence, the MPS system with
array radius of 10λ and NMPS = 8 doesn’t need any compensation since it already gives better results
when compared to other cases.
From Case-(I), (II), (III) and Table 1, it is observed that the effect of mutual coupling decreases as the
array radius increases from R = 2λ to R = 10λ.
3.3.5 Field Diagrams with increasing R and NMPS = 8
The E-field diagrams for increasing array radius having the number of elements in the array to be
constant as 8 is plotted using HFSS and is shown below in Fig. 26.
R = 2λ
R = 3.5λ

Dhayalini Ramamoorthy Impact of Mutual Coupling among Antenna Arrays on the Performance of the Multipath Simulator System
29
Fig. 26. Field diagrams for increasing array radius, R for NMPS = 8
From above figures it is clear that the field strength decreases with increasing array radius, R. At the
positions where the array elements are located, the field strength discontinuities are more obvious for
R = 2λ when compared to the cases with larger array radius. The more discontinuities observed in the
field strength indicates more mutual coupling and therefore it is concluded that mutual coupling is
highest for R = 2λ case and lowest for R = 10λ.
R = 6λ
R = 10λ

Dhayalini Ramamoorthy Impact of Mutual Coupling among Antenna Arrays on the Performance of the Multipath Simulator System
30
Fig. 27. Plot between MC and varying array radius for NMPS = 8.
By varying the array radius (from R = 2λ to R = 10λ) in UCA MPS system, the coupling between the
array antennas are measured (shown in Table 1) and plotted in Fig. 27. Here, it is observed that the
coupling decreases with the increase in array radius.
0
0.5
1
1.5
2
2.5
3
3.5
4
4.5
0 2 4 6 8 10 12
Co
up
ling
(dB
)
Array Radius (x Lamda)
MC vs Array radius in UCA for No. of elements = 8

Dhayalini Ramamoorthy Impact of Mutual Coupling among Antenna Arrays on the Performance of the Multipath Simulator System
31
3.4 Impact of MC by increasing no. of elements, NMPS for Array
radius of 10λ
Another detailed analysis is performed for the uniform circular array (UCA) configuration of a typical
MPS system by increasing the number of elements in the array from NMPS = 4 to NMPS = 16 in order to
understand the effect of their respective mutual coupling among the array elements. It is noted that for
all the simulation in this sub-section, the array radius of 10λ in the UCA is kept constant (R = 10 λ).
Table 2. Simulated results for increasing no of elements with array radius = 10λ.
Port no., Integrated S (dB) Isolated S (dB) Integrated S (dB) Isolated S (dB) Integrated S (dB) Isolated S (dB)
1 -40,9298 -41,0488 -41,0273 -41,4742 -39,9327 -40,7023
2 -40,8755 -41,0567 -41,0154 -41,5144 -39,9478 -40,8083
3 -40,8454 -41,043 -41,1273 -41,5435 -39,9326 -40,6915
4 -40,9707 -41,0589 -41,2474 -41,5821 -39,9607 -40,6559
5 -41,1035 -41,5338 -39,9498 -40,9229
6 -41,0863 -41,4449 -39,9279 -40,6802
7 -41,148 -41,5091 -39,9377 -40,695
8 -41,1183 -41,6245 -39,9598 -40,7708
9 -39,9516 -40,7626
10 -39,9575 -40,6823
11 -39,9231 -40,6644
12 -39,9251 -40,7846
13 -39,9159 -40,5834
14 -39,9148 -40,7175
15 -39,8667 -40,7018
16 -40,0066 -40,7071
Avg (dB) -40,90535 -41,05185 -41,1091875 -41,5283125 -39,93814375 -40,7206625
Diff (dB)
10 Lamda 4 elements
0,1465 0,419125 0,78251875
10 Lamda 16 elements10 Lamda 8 elements

Dhayalini Ramamoorthy Impact of Mutual Coupling among Antenna Arrays on the Performance of the Multipath Simulator System
32
3.4.1 Case-(I) NMPS = 4
The UCA MPS arrangement is characterized by having four λ/2-dipole array antennas (NMPS = 4) with
the radius of 10λ. The HFSS design for the setup is shown in Fig. 28. Also the integrated and isolated
element pattern of the system is shown in Fig. 29 and Fig. 30 respectively.
Fig. 28. HFSS design with array radius of 10λ and NMPS = 4.
Fig. 29. Integrated radiation pattern with array radius of 10λ and NMPS = 4 in [dB] and [mV] respectively.
Fig. 30. Isolated element pattern with array radius of10λ and NMPS = 4 in [dB] and [mV] respectively.

Dhayalini Ramamoorthy Impact of Mutual Coupling among Antenna Arrays on the Performance of the Multipath Simulator System
33
Since both the radiation patterns for the integrated and isolated cases resembles the shape of perfect
“donut”, the 10λ with NMPS = 4 has the least coupling of all the cases simulated in this project. When
all ports are excited, the average of the integrated scattering transmission parameter S21 is found to be
-40.9 dB and is shown in Table 2. Now, when only port 1 is excited and having all the other three ports
to be passive scatterers, the isolated S-parameter is found to be -41.05 dB and is shown in Fig. 32.
From Table 2, the average of all the isolated S-parameter value is then given by -41.05 dB.
Fig. 31. Measured integrated S21 parameter of the MPS with array radius of 10λ and NMPS = 4 (with MC).
Fig. 32. Measured isolated S21 parameter of the MPS with array radius of 10λ and NMPS = 4 (without MC).
1.50 1.75 2.00 2.25 2.50 2.75 3.00 3.25 3.50 3.75Freq [GHz]
-48.75
-46.25
-43.75
-41.25
-50.00
-47.50
-45.00
-42.50
-40.00
-48.75
-46.25
-43.75
-41.25
-48.00
-46.00
-44.00
-42.00
-40.00
Curve Info
dB(S(AUT,1))Setup1 : Sw eep
dB(S(AUT,2))Setup1 : Sw eep
dB(S(AUT,3))Setup1 : Sw eep
dB(S(AUT,4))Setup1 : Sw eep
HFSSDesign1Integrated S-parameter (10 lamda & 4 elements) ANSOFT
m1
m2
m3
m4
Name X Y
m1 2.6000 -40.9298
m2 2.6000 -40.8755
m3 2.6000 -40.8454
m4 2.6000 -40.9707
1.50 1.75 2.00 2.25 2.50 2.75 3.00 3.25 3.50 3.75Freq [GHz]
-65.00
-60.00
-55.00
-50.00
-45.00
-40.00
dB
(S(A
UT
,1))
HFSSDesign1Isolated S-parameter for port1 (10 lamda and 4 elements) ANSOFT
m1 Curve Info
dB(S(AUT,1))Setup1 : Sw eep
Name X Y
m1 2.6000 -41.0488

Dhayalini Ramamoorthy Impact of Mutual Coupling among Antenna Arrays on the Performance of the Multipath Simulator System
34
The difference between the averaged values of integrated and isolated S21 parameters gives a measure
of the extent of the mutual coupling in UCA. Thus the coupling for 10λ with 4 elements MPS system
is calculated as 0.1465 dB. Hence, the MPS system with array radius of 10λ and NMPS = 4 doesn’t need
any compensation since it already gives better results when compared to other cases.
3.4.2 Case-(II) NMPS = 8
In this case, the UCA MPS arrangement is characterized by having eight λ/2-dipole array antennas
(NMPS = 8) with the radius of 10λ. The HFSS design for the setup is shown in Fig. 33. Also the
integrated and isolated element pattern of the system is previously shown in Fig. 22 and Fig. 23 resp.
Fig. 33. HFSS design with array radius of 10λ and NMPS = 8.
When all ports are excited, the average of the integrated scattering transmission parameter S21 is found
to be -41.10 dB and is shown previously in Fig. 23. Now, when only port 1 is excited having all the
other seven ports to be passive scatterers, the isolated S-parameter is found to be -41.47 dB and is
shown previously in Fig. 24. From Table 2, the average of all the isolated S-parameter value is then
given by -41.53 dB. The difference between the averaged values of integrated and isolated S21
parameters gives a measure of the extent of the mutual coupling in UCA. Thus the coupling for 10λ
with 8 elements MPS system is calculated as 0.419 dB. Hence, the MPS system with array radius of
10λ and NMPS = 8 doesn’t need any compensation since it already gives better results when compared
to other cases.
3.4.3 Case-(III) NMPS = 16
In this case, the UCA MPS arrangement is characterized by having sixteen λ/2-dipole array antennas
(NMPS = 16) with the radius of 10λ. The HFSS design for the setup is shown in Fig. 34. Also the
integrated and isolated element pattern of the system is shown in Fig. 35 and Fig. 36 respectively.

Dhayalini Ramamoorthy Impact of Mutual Coupling among Antenna Arrays on the Performance of the Multipath Simulator System
35
Fig. 34. HFSS design with array radius of 10λ and NMPS = 16.
Fig. 35. Integrated radiation pattern with array radius of 10λ and NMPS = 16 in [dB] and [mV] respectively.
Fig. 36. Isolated element pattern with array radius of10λ and NMPS = 16 in [dB] and [mV] respectively.
Compared to all the 10λ cases, it is obvious from both the integrated and isolated radiation patterns
that there are visible differences in the color contours at the array element positions (see Fig. 35 and
Fig. 36). Therefore, 10λ 16 elements case has more coupling effect compared to the other 10λ cases.

Dhayalini Ramamoorthy Impact of Mutual Coupling among Antenna Arrays on the Performance of the Multipath Simulator System
36
When all ports are excited, the average of the integrated scattering transmission parameter S21 is found
to be -39.94 dB and is shown in Table 2. Now, when only port 1 is excited having all the other three
ports to be passive scatterers, the isolated S-parameter is found to be -40.7 dB and is shown in Fig. 38.
From Table 2, the average of all the isolated S-parameter value is then given by -40.72 dB.
Fig. 37. Measured integrated S21 parameter of the MPS with array radius of 10λ and NMPS = 16 (with MC).
Fig. 38. Measured isolated S21 parameter of the MPS with array radius of 10λ and NMPS = 16 (without MC).
1.50 1.75 2.00 2.25 2.50 2.75 3.00 3.25 3.50 3.75Freq [GHz]
-45.00
-32.50
-45.00
-32.50
-46.00
-36.00
-45.00
-35.00
-44.00
-31.50
-44.00
-31.50
-44.00
-31.50
-45.00
-32.50
-45.00
-32.50
-45.00
-32.50
-44.00
-31.50
-45.00
-32.50
-46.00
-33.50
-46.00
-36.00
-44.00
-31.50
-45.00
-32.50
Curve Info
dB(S(AUT,1))Setup1 : Sw eep
dB(S(AUT,2))Setup1 : Sw eep
dB(S(AUT,3))Setup1 : Sw eep
dB(S(AUT,4))Setup1 : Sw eep
dB(S(AUT,5))Setup1 : Sw eep
dB(S(AUT,6))Setup1 : Sw eep
dB(S(AUT,7))Setup1 : Sw eep
dB(S(AUT,8))Setup1 : Sw eep
dB(S(AUT,9))Setup1 : Sw eep
dB(S(AUT,10))Setup1 : Sw eep
dB(S(AUT,11))Setup1 : Sw eep
dB(S(AUT,12))Setup1 : Sw eep
dB(S(AUT,13))Setup1 : Sw eep
dB(S(AUT,14))Setup1 : Sw eep
dB(S(AUT,15))Setup1 : Sw eep
dB(S(AUT,16))Setup1 : Sw eep
HFSSDesign1Integrated S-parameter (10 lamda & 16 elements) ANSOFT
m1
m2
m3
m4
m5
m6
m7
m8
m9
m10
m11
m12
m13
m14
m15
m16
Name X Y
m1 2.6000 -39.9327
m2 2.6000 -39.9478
m3 2.6000 -39.9326
m4 2.6000 -39.9607
m5 2.6000 -39.9498
m6 2.6000 -39.9279
m7 2.6000 -39.9377
m8 2.6000 -39.9598
m9 2.6000 -39.9516
m10 2.6000 -39.9575
m11 2.6000 -39.9231
m12 2.6000 -39.9251
m13 2.6000 -39.9159
m14 2.6000 -39.9148
m15 2.6000 -39.8667
m16 2.6000 -40.0066
1.50 1.75 2.00 2.25 2.50 2.75 3.00 3.25 3.50 3.75Freq [GHz]
-65.00
-60.00
-55.00
-50.00
-45.00
-40.00
-35.00
-30.00
-25.00
-20.00
dB
(S(A
UT
,1))
HFSSDesign1Isolated S-parameter for port1 (10 lamda & 16 elements) ANSOFT
m1
Curve Info
dB(S(AUT,1))Setup1 : Sw eep
Name X Y
m1 2.6000 -40.7023

Dhayalini Ramamoorthy Impact of Mutual Coupling among Antenna Arrays on the Performance of the Multipath Simulator System
37
The difference between the averaged values of integrated and isolated S21 parameters gives a measure
of the extent of the mutual coupling in UCA. Thus the coupling for 10λ with 16 elements MPS system
is calculated as 0.78 dB. Hence, -0.78 dB can be added to cancel the effect of coupling in-order to
compensate for 10λ-16 elements MPS system to have better performance.
From Case-(I), (II) and (III), it is observed that the effect of mutual coupling increases as the number
of elements in the array increases. In other words, the results from Table 2 suggest that the impact of
scattering within the MPS array increases with the number of MPS antennas, i.e., from NMPS = 4 to
NMPS = 16.
3.4.4 Field Diagrams with increasing NMPS and R = 10λ
The E-field diagrams for increasing number of elements having the array radius to be constant as 10λ
is plotted using HFSS and is shown below in Fig. 39. At the positions where the array elements are
located, the field strength discontinuities are more for NMPS = 16 when compared to the cases with less
number of elements. The more discontinuities observed in the field strength indicates more mutual
coupling and therefore it is concluded that mutual coupling is higher for NMPS = 16 case and lowest for
NMPS =4.
NMPS = 4

Dhayalini Ramamoorthy Impact of Mutual Coupling among Antenna Arrays on the Performance of the Multipath Simulator System
38
Fig. 39. Field diagrams with increasing number of elements, NMPS for R = 10λ
NMPS = 8
NMPS = 16

Dhayalini Ramamoorthy Impact of Mutual Coupling among Antenna Arrays on the Performance of the Multipath Simulator System
39
Fig. 40. Plot between MC and number of elements in UCA for array radius of 10λ.
The mutual coupling (MC) between array elements and the number of elements in UCA MPS is
plotted and is shown in Fig. 40. The values of coupling for this plot are taken from the simulated
results shown in Table 2. Here, it is seen that the coupling between the antenna array elements
increases with the increase in number of elements in UCA.
0
0.1
0.2
0.3
0.4
0.5
0.6
0.7
0.8
0.9
0 2 4 6 8 10 12 14 16 18
Co
up
ling
(dB
)
No of elements in UCA
MC vs No. of elements in UCA for Array radius = 10λ

Dhayalini Ramamoorthy Impact of Mutual Coupling among Antenna Arrays on the Performance of the Multipath Simulator System
40
3.5 Impact of MC by increasing both the no. of elements, NMPS
and array radius, R
By increasing both the array radius and number of elements in the UCA MPS system, the impact of
mutual coupling is analyzed in this section.
Table 3. Simulated results for varying array radius with NMPS = 8 and NMPS = 16.
From Table 3, it is seen that when the array radius is increased from 3.5λ to 10λ, the effect of mutual
coupling in the MPS system is decreased from 1.13 dB to 0.4 dB for NMPS = 8 and for NMPS = 16, the
mutual coupling (MC) is decreased from 2.75 dB to 0.78 dB.
Port no., Integrated S (dB) Isolated S (dB) Integrated S (dB) Isolated S (dB) Integrated S (dB) Isolated S (dB)
1 -26,8555 -27,8785 -33,4143 -34,3472 -41,0273 -41,4742
2 -26,8212 -27,9542 -33,3751 -34,3066 -41,0154 -41,5144
3 -26,8227 -27,9182 -33,3777 -34,1905 -41,1273 -41,5435
4 -26,8167 -27,8953 -33,379 -34,3716 -41,2474 -41,5821
5 -26,8156 -27,9852 -33,3897 -34,3061 -41,1035 -41,5338
6 -26,8605 -28,0721 -33,3536 -34,3571 -41,0863 -41,4449
7 -26,7953 -27,9638 -33,3194 -34,2845 -41,148 -41,5091
8 -26,8395 -27,9987 -33,3784 -34,2326 -41,1183 -41,6245
Avg (dB) -26,828375 -27,95825 -33,3734 -34,299525 -41,1091875 -41,5283125
Diff (dB)
Port no., Integrated S (dB) Isolated S (dB) Integrated S (dB) Isolated S (dB) Integrated S (dB) Isolated S (dB)
1 -26,2182 -28,8996 -34,2089 -35,546 -39,9327 -40,7023
2 -26,2329 -29,2377 -34,1993 -35,6457 -39,9478 -40,8083
3 -26,1836 -28,5928 -34,1267 -35,4935 -39,9326 -40,6915
4 -26,1891 -28,9044 -34,1582 -35,6282 -39,9607 -40,6559
5 -26,1925 -29,0084 -34,1658 -35,4427 -39,9498 -40,9229
6 -26,2252 -28,6756 -34,289 -35,424 -39,9279 -40,6802
7 -26,2195 -29,4187 -34,2336 -35,4729 -39,9377 -40,695
8 -26,2358 -28,9689 -34,2005 -35,553 -39,9598 -40,7708
9 -26,2305 -29,3365 -34,2994 -35,2974 -39,9516 -40,7626
10 -26,2169 -28,7359 -34,3092 -35,4262 -39,9575 -40,6823
11 -26,263 -28,8105 -34,2232 -35,6172 -39,9231 -40,6644
12 -26,1877 -29,1384 -34,2588 -35,4188 -39,9251 -40,7846
13 -26,2376 -28,9435 -34,173 -35,3468 -39,9159 -40,5834
14 -26,2091 -28,9345 -34,2023 -35,3106 -39,9148 -40,7175
15 -26,2332 -29,0058 -34,1503 -35,4968 -39,8667 -40,7018
16 -26,2067 -28,8676 -34,2278 -35,5683 -40,0066 -40,7071
Avg (dB) -26,21759375 -28,967425 -34,214125 -35,48050625 -39,93814375 -40,7206625
Diff (dB) 2,74983125 1,26638125 0,78251875
3.5 Lamda 8 elements 6 Lamda 8 elements 10 Lamda 8 elements
1,129875 0,926125 0,419125
3.5 Lamda 16 elements 6 Lamda 16 elements 10 Lamda 16 elements

Dhayalini Ramamoorthy Impact of Mutual Coupling among Antenna Arrays on the Performance of the Multipath Simulator System
41
Fig. 41. Integrated radiation pattern with array radius of 3.5λ, 6λ and 10λ for NMPS = 8 respectively.
Fig. 42. Isolated element pattern of with array radius of 3.5λ, 6λ and 10λ for NMPS = 8 respectively.
Fig. 43. Integrated radiation pattern with array radius of 3.5λ, 6λ and 10λ for NMPS = 16 respectively.
Fig. 44. Isolated element pattern with array radius of 3.5λ, 6λ and 10λ for NMPS = 16 respectively.
The differences in the contour and the color at the positions of the array elements between the
integrated and isolated radiation patterns with array radius of 3.5λ to 10λ for NMPS = 8 and NMPS = 16

Dhayalini Ramamoorthy Impact of Mutual Coupling among Antenna Arrays on the Performance of the Multipath Simulator System
42
are shown in Fig. 41 to Fig. 44. Thus, the impact of coupling decreases with the size of the MPS ring
radius, i.e., from R = 3.5λ to R = 10λ.
Fig. 45. Integrated and isolated radiation patterns with array radius of 2λ with NMPS = 8.
Fig. 46. Integrated and isolated radiation patterns with array radius of 10λ with NMPS = 4.
It is clearly observed in Fig. 45 and Fig. 46 that, the higher the difference between the shape and the
color of the radiation patterns between the integrated and isolated cases (at the positions of the array
elements), the higher the effect of coupling between them. In this project, the highest coupling
between the array elements is observed for R = 2λ and NMPS = 8 case and the lowest coupling is
observed for R = 10λ and NMPS = 4 case.

Dhayalini Ramamoorthy Impact of Mutual Coupling among Antenna Arrays on the Performance of the Multipath Simulator System
43
Table 4. Simulated results for array radius of 2λ and NMPS = 8 and NMPS = 16.
From Table 4, for array radius of 2λ with NMPS = 8 the effect of mutual coupling is computed as 4.07
dB and with NMPS = 16, the effect of mutual coupling is measured to be 2.21 dB. Employing the
proposed far-field conditions in the array for this case (2λ) at 2.6GHz frequency, the effect of mutual
coupling is increased unexpectedly from 2.21 dB to 4.07 dB. Hence, the impact of coupling for R = 2λ
doesn’t follow the expected trend using the proposed MPS scattering model. The reason behind this
might be the fact that the field interactions and the coupling are so high for the chosen R (2λ) and
hence it is not an optimum value to work with this frequency.
Port no., Integrated S (dB) Isolated S (dB) Integrated S (dB) Isolated S (dB)
1 -20,8461 -24,6727 -20,9919 -23,1678
2 -20,8602 -25,013 -20,963 -23,3919
3 -20,8643 -25,0621 -20,9774 -23,1687
4 -20,8809 -25,0129 -20,9533 -22,7751
5 -20,8442 -24,9458 -21,0051 -23,3102
6 -20,8557 -24,9186 -20,9906 -23,074
7 -20,8553 -24,994 -21,0092 -23,3671
8 -20,8594 -24,8475 -21,0252 -23,2356
9 -20,9933 -23,2973
10 -20,9746 -23,2597
11 -20,987 -23,2634
12 -20,9623 -23,2426
13 -20,9924 -23,2832
14 -21,0032 -23,0114
15 -21,0337 -23,1951
16 -21,0264 -23,3048
Avg (dB) -20,8582625 -24,933325 -20,9930375 -23,20924375
Diff (dB)
2 Lamda 8 elements 2 Lamda 16 elements
4,0750625 2,21620625
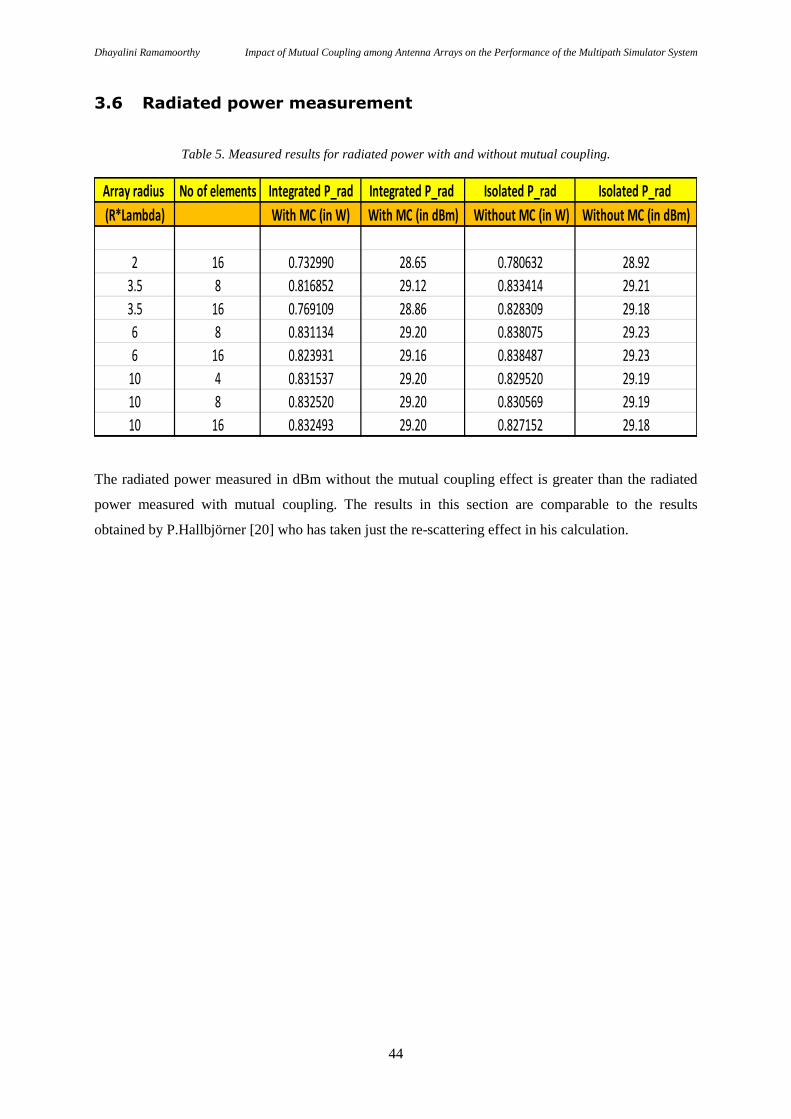
Dhayalini Ramamoorthy Impact of Mutual Coupling among Antenna Arrays on the Performance of the Multipath Simulator System
44
3.6 Radiated power measurement
Table 5. Measured results for radiated power with and without mutual coupling.
The radiated power measured in dBm without the mutual coupling effect is greater than the radiated
power measured with mutual coupling. The results in this section are comparable to the results
obtained by P.Hallbjörner [20] who has taken just the re-scattering effect in his calculation.
Array radius No of elements Integrated P_rad Integrated P_rad Isolated P_rad Isolated P_rad
(R*Lambda) With MC (in W) With MC (in dBm) Without MC (in W) Without MC (in dBm)
2 16 0.732990 28.65 0.780632 28.92
3.5 8 0.816852 29.12 0.833414 29.21
3.5 16 0.769109 28.86 0.828309 29.18
6 8 0.831134 29.20 0.838075 29.23
6 16 0.823931 29.16 0.838487 29.23
10 4 0.831537 29.20 0.829520 29.19
10 8 0.832520 29.20 0.830569 29.19
10 16 0.832493 29.20 0.827152 29.18

Dhayalini Ramamoorthy Impact of Mutual Coupling among Antenna Arrays on the Performance of the Multipath Simulator System
45
4 Discussion and Conclusions
In this thesis work, scattering within the MPS antenna array and its impact on mutual coupling is
studied and discussed. The studies are carried out by performing MPS simulations in HFSS at the
LTE-A band of 2.6GHz by analyzing the parameter S21 which critically influences the MPS system. A
MPS for mobile terminal operated at 2.6GHz for varying array radius (R = 2λ to R = 10λ) and number
of elements (NMPS = 4 to NMPS =16) is simulated to see the effect of mutual coupling in the antenna
arrays. The simulations were based on the proposed MPS scattering model and it lies in the far-field
boundary conditions. The simulated results suggest that the impact of mutual coupling increase with
the number of MPS antennas and decrease with the radius of the MPS ring. In other words, the higher
the difference between the shape and the color of the radiation patterns between the integrated and
isolated cases (at the positions of the array elements), the higher the effect of coupling between them.
In this project, the highest coupling between the array elements is observed for R = 2λ and NMPS = 8
case and the lowest coupling is observed for R = 10λ and NMPS = 4 case. However, for R = 2λ and
NMPS =16, the HFSS simulation does not predict the expected trend for the given frequency (2.6GHz).
The radiated power is also measured with and without mutual coupling effect and the results obtained
are more comparable with the results obtained by P. Hallbjörner [20] who has just taken the effect of
re-scattering into account. It is concluded that the impact of coupling within the MPS antennas is best
countered by designing a large MPS system (preferably R = 10λ or greater), despite the higher
incurred costs. Moreover, it is recommended that reducing the number of elements to 8 or less would
significantly minimize the effect of mutual coupling in the MPS system, without compromising on the
required multipath environment.

Dhayalini Ramamoorthy Impact of Mutual Coupling among Antenna Arrays on the Performance of the Multipath Simulator System
46
References
[1] P. Hallbjörner, Z. Ying, M. Håkansson, C. Wingqvist, T. Anttila and J. Welinder, “Multipath
simulator for mobile terminal antenna characterization,” Microw., Antennas Propag., vol. 4, no.
6, pp. 743-750, 2010.
[2] C. A. Balanis, Antenna Theory, Analysis and Design, Second Edition: John Wiley and Sons,
Inc., New York, 1997.
[3] Serene Ow, “Impact of Mutual Coupling on compact MIMO Systems,” February 2005, Lund
Institute of Technology.
[4] Van Phuong TRAN and Alain SIBILLE, “MIMO Channel Capacity and Mutual Coupling in
Circular Arrays of Monopoles,” COST 273 TD (03) 099, 2003/May/22-23.
[5] J. C. Maxwell, A Treatise on Electricity and Magnetism, Dover, New York, 1954.
[6] D. M. Pozar, Microwave Engineering, Second Edition, John Wiley and Sons, Inc., New York,
1998.
[7] S. Prasad, “Over-The-Air Performance Estimation of Wireless Device Antennas,” Ph.D. Thesis,
Dept. Signal Processing, KTH Univ., Stockholm, Sweden, 2013.
[8] Basic antenna theory [Online]. Available:
http://www.qsl.net/g3yrc/basic%20antenna%20theory.htm
[9] J. Qian, K. L. Wu and J. Litva, “Impedance of A Circular Array of Vertical Dipoles Above A
Lossy Ground,” IEEE Trans. Antennas Propagat., vol. 2, pp. 686–689, 7-11 May 1990.
[10] Z. Huang, C. A. Balanis and C. R. Britcher, “Mutual coupling in beamforming in UCAs:
Simulations and experiment,” IEEE Trans. On Antennas Propag., vol. 54, No. 11, pp. 3082-
3086, November 2006.
[11] A. C. Ludwig, “The definition of cross polarization,” IEEE Trans. Antennas Propagat., vol.21,
no.1, Jan. 1973, pp. 116-119.
[12] The Basics of Antenna Arrays. [Online]. Available: http://www.orbanmicrowave.com/antennas
[13] T. Sakata, A. Yamamoto, H. Iwai, K. Ogawa, J.-I. Takada, K. Sakaguchi, and K. Araki, “BER
evaluation system for a handset antenna in a multipath environment using a spatial fading
emulator,” in Proc. ISAP, Seoul, Korea, 2005, pp. 351-354.
[14] W. A. T. Kotterman, M. Landmann, A. Heuberger and R. S. Thoma, “New laboratory for Over-
The-Air testing and Wave Fields Synthesis,” General Assembly and Scientific Symposium,
XXXth URSI, Aug. 13-20, 2011.
[15] Robert. C. Hansen, Microwave Scanning Antennas: Array Theory and Practice: Vol. II,
Peninsula Publishing, 1985.
[16] J.L Allen and B.L. Diamond, “Mutual Coupling in Array Antenna,” Technical Report EDS-66-
443, Lincoln Lab., MIT, October 4, 1966.

Dhayalini Ramamoorthy Impact of Mutual Coupling among Antenna Arrays on the Performance of the Multipath Simulator System
47
[17] Steyskal H. and Herd J.S., “Mutual coupling compensation in small array antennas,” IEEE
Trans. Antennas Propagat., P-38, no. 12, pp. 1971-1975, 1990.
[18] Tao Su and Hao Ling, “On modeling mutual coupling in antenna arrays using coupling matrix,”
Microwave and Optical Technology Letters, vol. 28, No. 4, pp. 231-237, February 2001.
[19] L. Rade, B. Westergren, Mathematics Handbook for Science and Engineering, Fifth edition,
Studentlitteratur, 2004.
[20] P. Hallbjörner, “Measurement Uncertainty in Multipath Simulators Due to Scattering Within the
Antenna Array- Theoretical Model Based on Mutual Coupling”, IEEE Trans. On Antennas
Propag., vol. 9, pp. 1103–1106, 2010.
[21] A. A. Glazunov, S. Prasad, P. Händel, T. Bolin and K.Prytz, “A study of the Impact of
Scattering within an MPS Antenna Array on the Rician Fading Statistics in OTA Testing, ”
IEEE Trans. Antennas Propagat., Nov 2012.