dfg research unit 756 collecting data for vulnerability measurements: some initial findings from...
Post on 22-Dec-2015
219 views
TRANSCRIPT
DFG Research Unit 756
Collecting Data for Vulnerability Measurements:
some initial findings from Thailandand Vietnam
Hermann Waibel
Seminar at Thailand Development and Research Institute, September 25, 2009

Seminar at TDRI, Bangkok, Thailand, 25 September 2009 13:41 2
Outline
Project Objectives
Why Vulnerability Research?
Data Collection to Measure Vulnerability
Results of 1st Phase: Some Examples
Plan for 2nd Phase (2010-2012)
Seminar at TDRI, Bangkok, Thailand, 25 September 2009 13:41 3
Overall objective of the Project
“to advance the concept and the measurement of
vulnerability to poverty and assess the sources of
vulnerability through interdisciplinary economic
research in Thailand and Vietnam”

Seminar at TDRI, Bangkok, Thailand, 25 September 2009 13:41 4
Expected Results
1. A comprehensive conceptual and empirical basis for the assessment of vulnerability to poverty in Thailand and Vietnam
2. The relative importance of the sectoral and regional determinants of vulnerability
3. Strategies for more timely, better targeted and more cost effective social risk management

Seminar at TDRI, Bangkok, Thailand, 25 September 2009 13:41 5
Project Components
Agricultural Economics
Financial Institutions
EconomicGeography
Vulnerability +HH- dynamics
Vulnerability database
Agricultural Economics
Financial Institutions
EconomicGeography
Vulnerability +HH- dynamics
Vulnerability database
Seminar at TDRI, Bangkok, Thailand, 25 September 2009 13:41 6
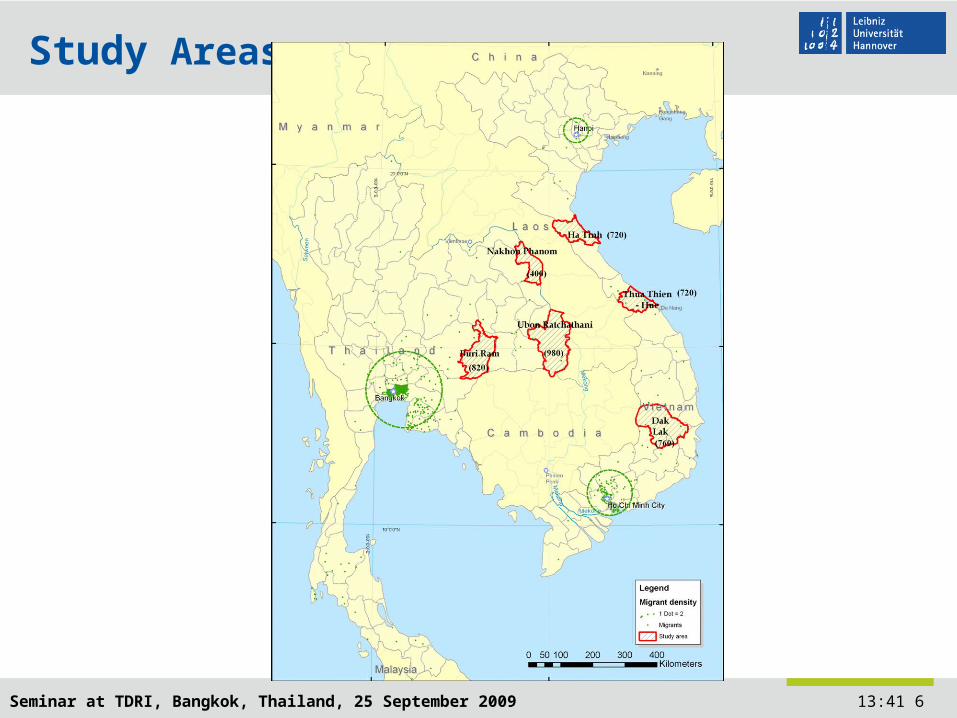
Study Areas

Seminar at TDRI, Bangkok, Thailand, 25 September 2009 13:41 7
I. Development Policy:
“Pockets" of poverty in emerging market economies
Poverty is a dynamic issue
Shocks make people vulnerable
How efficient do HH cope with shocks?
What policy interventions are appropriate?
Motivation for the project
Seminar at TDRI, Bangkok, Thailand, 25 September 2009 13:41 8
II. Research:
Collection of data specifically for measuring vulnerability
Explore the “black box” (risks and shocks) Comparative study of vulnerability concepts Understand Household decision processes (e.g.
dynamics, multi-location) Risk matters: From fate to fear!
Motivation for the project

Seminar at TDRI, Bangkok, Thailand, 25 September 2009 13:41 9
(1) Reducing vulnerability has an intrinsic value
Well-being: having good prospects now to have enough in the future
(2) Reducing vulnerability has an instrumental value
Poverty trap: ex ante risk mitigating prevents adoption of high average return portfolios
Why vulnerability Research?
Seminar at TDRI, Bangkok, Thailand, 25 September 2009 13:41 10
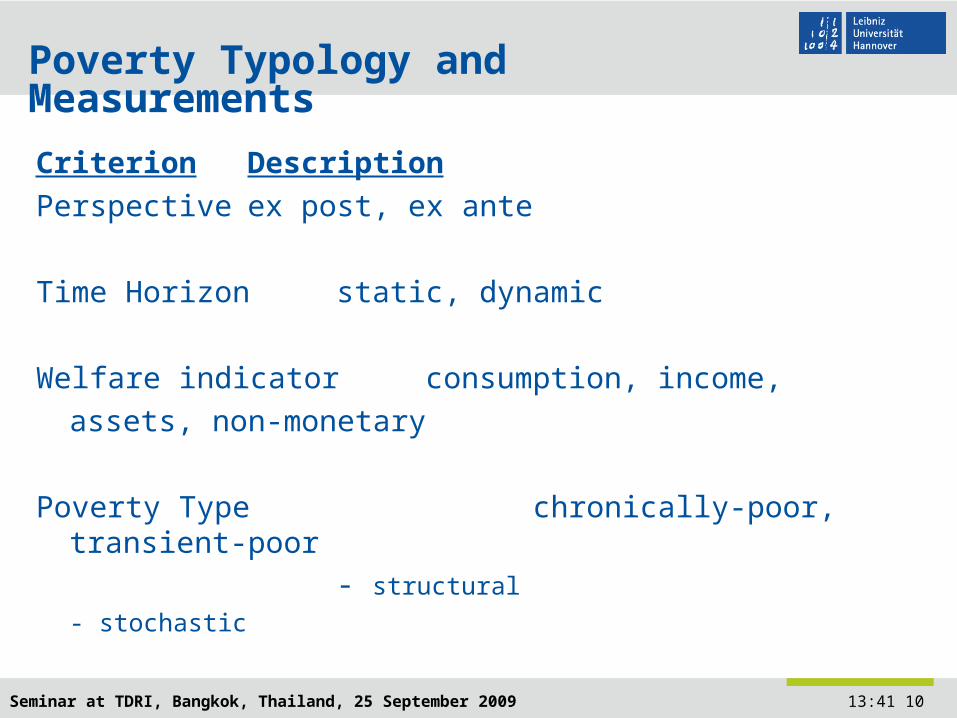
Poverty Typology and Measurements
Criterion Description
Perspective ex post, ex ante
Time Horizon static, dynamic
Welfare indicator consumption, income,
assets, non-monetary
Poverty Type chronically-poor, transient-poor
- structural
- stochastic

Seminar at TDRI, Bangkok, Thailand, 25 September 2009 13:41 11
Assets
Income (I)
Poverty line
Transient poverty
0<VTP<1
No poverty
VTP=0
Asset poverty lineVTP=0.5
Probability to be poor
Chronic poverty
VTP=1
Structural poverty Stochastic poverty
Asset based Vulnerability

Seminar at TDRI, Bangkok, Thailand, 25 September 2009 13:41 12
Four prominent definitions of vulnerability
1. Uninsured exposure to risk and shocks (e.g. Jalan
and Ravallion, 1999)
2. Expected Poverty (e.g. Pritchett et al., 2000)
3. Low level of expected utility (Ligon and Schechter,
2003)
4. Expected deprivation or individual vulnerability to
poverty (Calvo and Dercon 2005)

Seminar at TDRI, Bangkok, Thailand, 25 September 2009 13:41 13
Vulnerability as Expected Poverty (VEP)
Vh: vulnerability
ch: consumption of HH
z: poverty line
p: probability
EP: expected poverty
, , 1( )h t
EPh tV P c z
Seminar at TDRI, Bangkok, Thailand, 25 September 2009 13:41 14
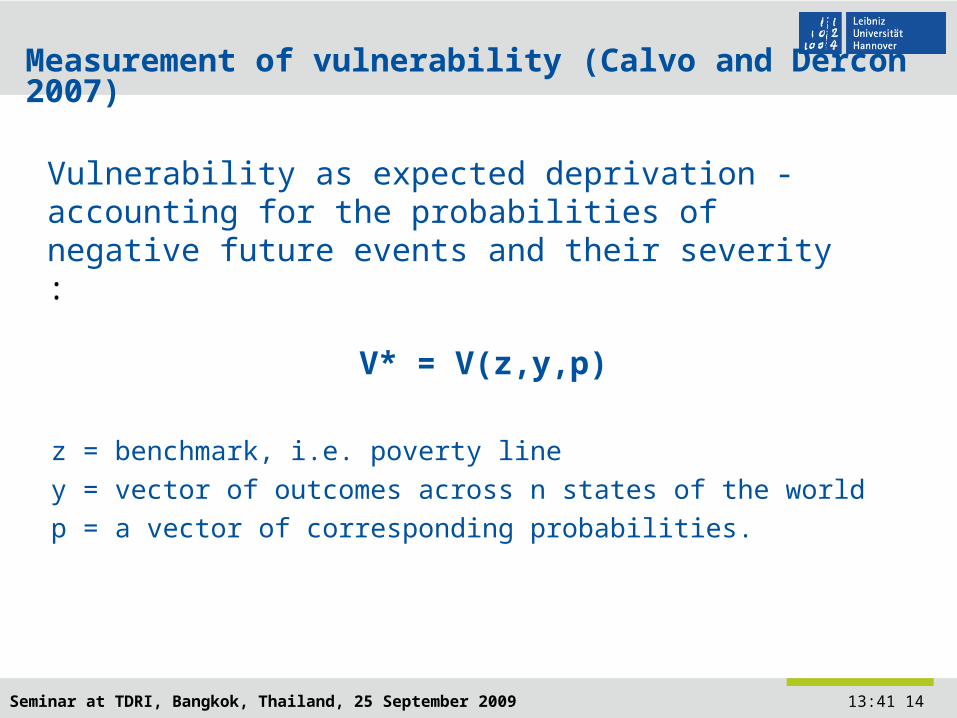
Measurement of vulnerability (Calvo and Dercon 2007)
V* = V(z,y,p)
z = benchmark, i.e. poverty line
y = vector of outcomes across n states of the world
p = a vector of corresponding probabilities.
Vulnerability as expected deprivation - accounting for the probabilities of negative future events and their severity :
Seminar at TDRI, Bangkok, Thailand, 25 September 2009 13:41 15
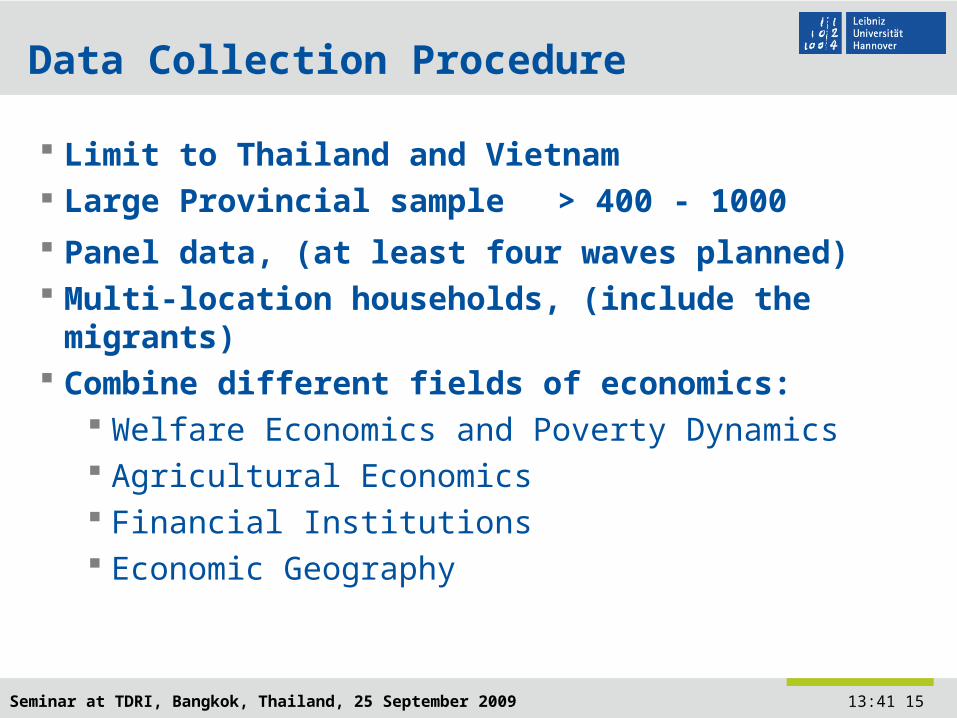
Data Collection Procedure
Limit to Thailand and Vietnam Large Provincial sample > 400 - 1000 Panel data, (at least four waves planned) Multi-location households, (include the
migrants) Combine different fields of economics:
Welfare Economics and Poverty Dynamics Agricultural Economics Financial Institutions Economic Geography
Seminar at TDRI, Bangkok, Thailand, 25 September 2009 13:41 16
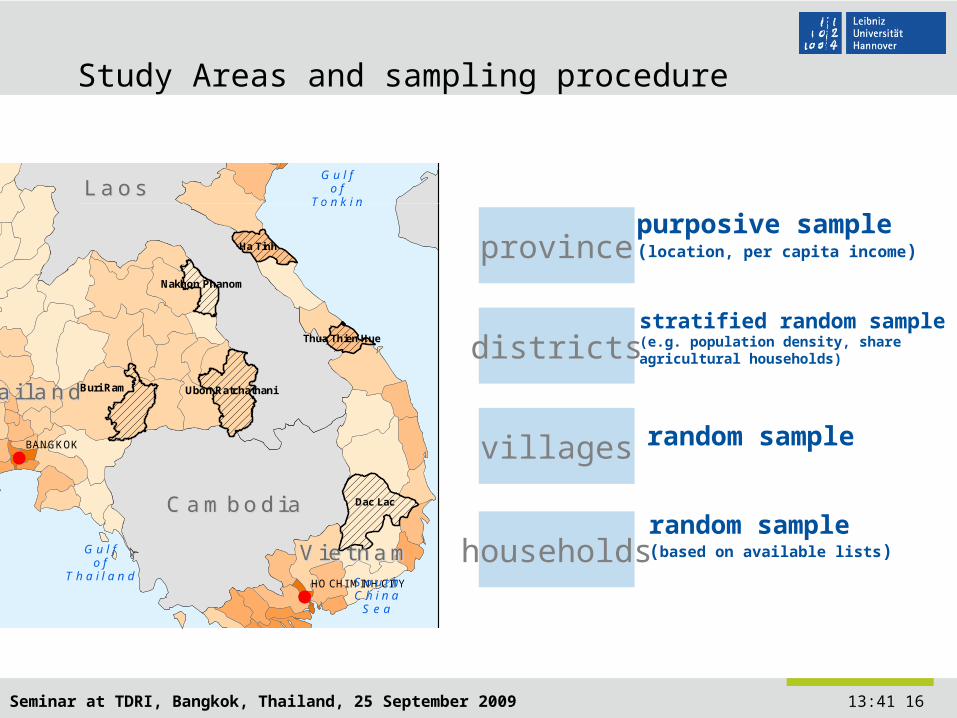
Sampling procedure
T h a i l a n dT h a i l a n d
L a o sL a o s
V i e t n a mV i e t n a m
C h i n aC h i n a
M y a n m a rM y a n m a r
C a m b o d i aC a m b o d i a
M a l a y s i aM a l a y s i a
Dac Lac
Ha Tinh
Thua Thien Hue
Buri Ram Ubon Ratchathani
Nakhon Phanom
HANOI
BANGKOK
HO CHI MINH CITY
G u l fo f
T h a i l a n d
A n d a m a nS e a
S o u t hC h i n a
S e a
G u l fo f
T o n k i n
0 250 500125km
province
districts
villages
households
purposive sample(location, per capita income)
stratified random sample(e.g. population density, share agricultural households)
random sample
random sample (based on available lists)
2 surveys à 4,400 respondents
Study Areas and sampling procedure
Seminar at TDRI, Bangkok, Thailand, 25 September 2009 13:41 17
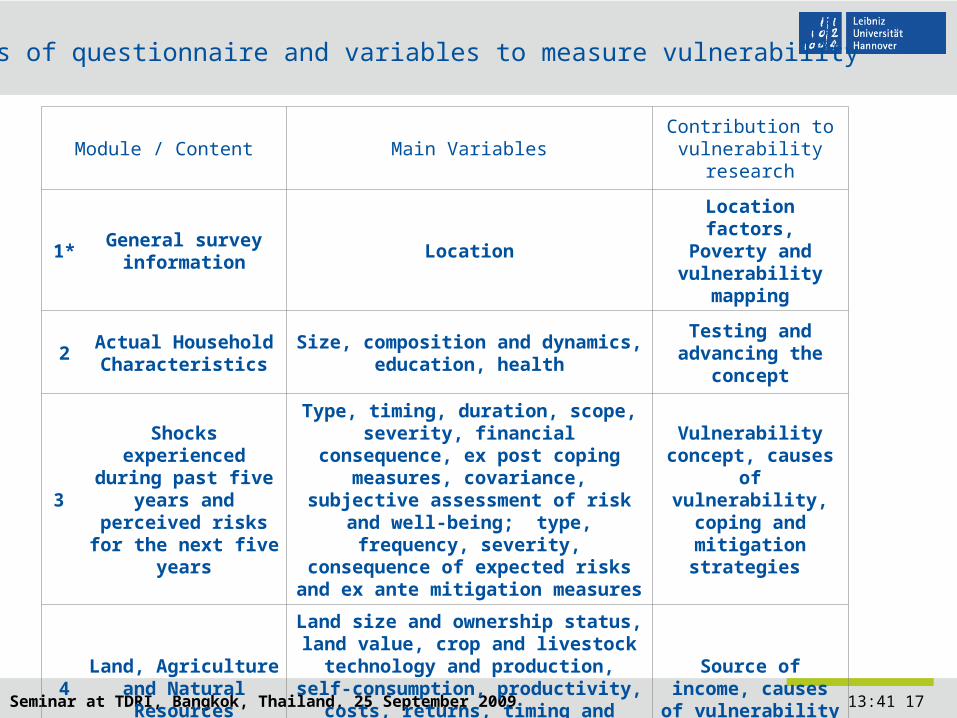
Module / Content Main VariablesContribution to
vulnerability research
1*General survey
informationLocation
Location factors,Poverty and vulnerability
mapping
2Actual Household
CharacteristicsSize, composition and dynamics,
education, health
Testing and advancing the
concept
3
Shocks experienced during past five years and perceived risks
for the next five years
Type, timing, duration, scope, severity, financial consequence, ex post coping
measures, covariance, subjective assessment of risk and well-being;
type, frequency, severity, consequence of expected risks and ex
ante mitigation measures
Vulnerability concept, causes of
vulnerability, coping and mitigation
strategies
4Land, Agriculture and
Natural Resources
Land size and ownership status, land value, crop and livestock technology and production, self-consumption,
productivity, costs, returns, timing and extent of natural resource extraction
Source of income, causes of
vulnerability
Modules of questionnaire and variables to measure vulnerability

Seminar at TDRI, Bangkok, Thailand, 25 September 2009 13:41 18
Module / Content Main VariablesContribution to
vulnerability research
5Off-farm employment including wage labour
Type, contractual arrangements, location, travel costs, job
acquisition costs, duration of work, wage and fringe benefits
Source of income, causes of vulnerability
6Non-farm self-
employment including cottage industries
Type, investment, costs and returns
Source of income, causes of vulnerability
7Borrowing, Lending,
Public and other transfers and insurance
Type, sources, contractual arrangements, conditions
amounts, payment frequencies
Source of income, causes of vulnerability
8Household
ConsumptionFood and non food items, other
expenditures Consumption
9 Assets including housePurchase value depreciation and
service life Coping capacity
Modules of questionnaire and variables to measure vulnerability

Seminar at TDRI, Bangkok, Thailand, 25 September 2009 13:41 19
“Shock” module
Seminar at TDRI, Bangkok, Thailand, 25 September 2009 13:41 20
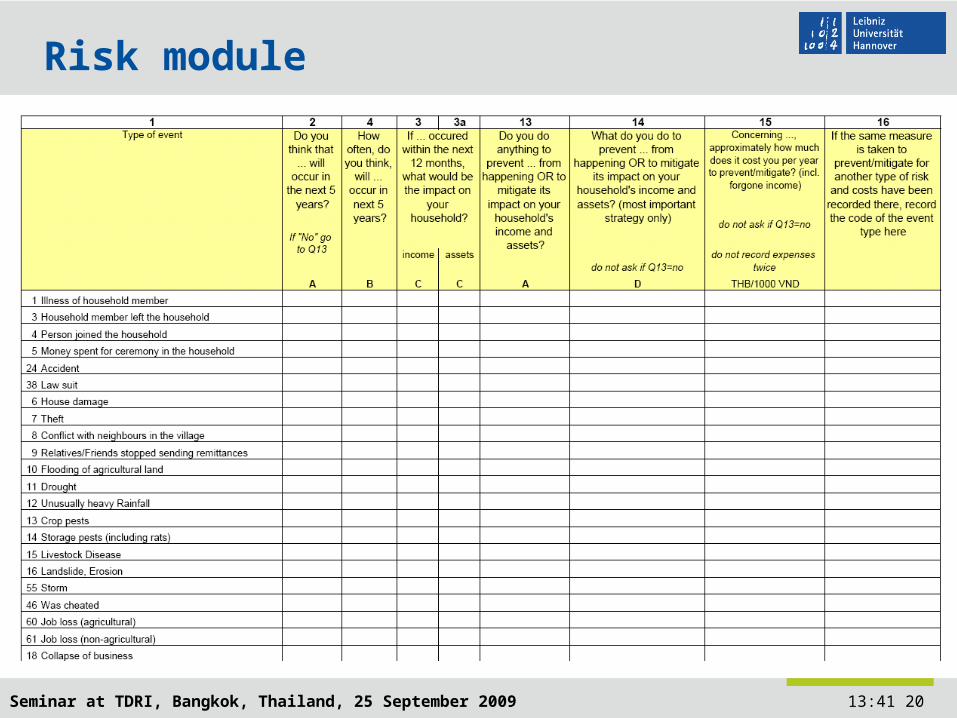
Risk module
Seminar at TDRI, Bangkok, Thailand, 25 September 2009 13:41 21
Selected Results
Descriptive Statistics
Income Composition
Demographic Characteristics
Pattern of shocks
Data Robustness Test and Aggregate Vulnerability
Risk Perception and Risk Attitude
Key messages of 1st project phase

Seminar at TDRI, Bangkok, Thailand, 25 September 2009 13:41 22
Indicators of Data Quality
Total sample in 2007: 4,381
Missing cases 2007 ( ~ 2 %)
Total sample in 2008: 4,284
Attrition: ~ 2 %
Replacement rates : ~ 20 %
Standard Errors are acceptable
Initial assumptions confirmed
New issues emerged
Seminar at TDRI, Bangkok, Thailand, 25 September 2009 13:41 23
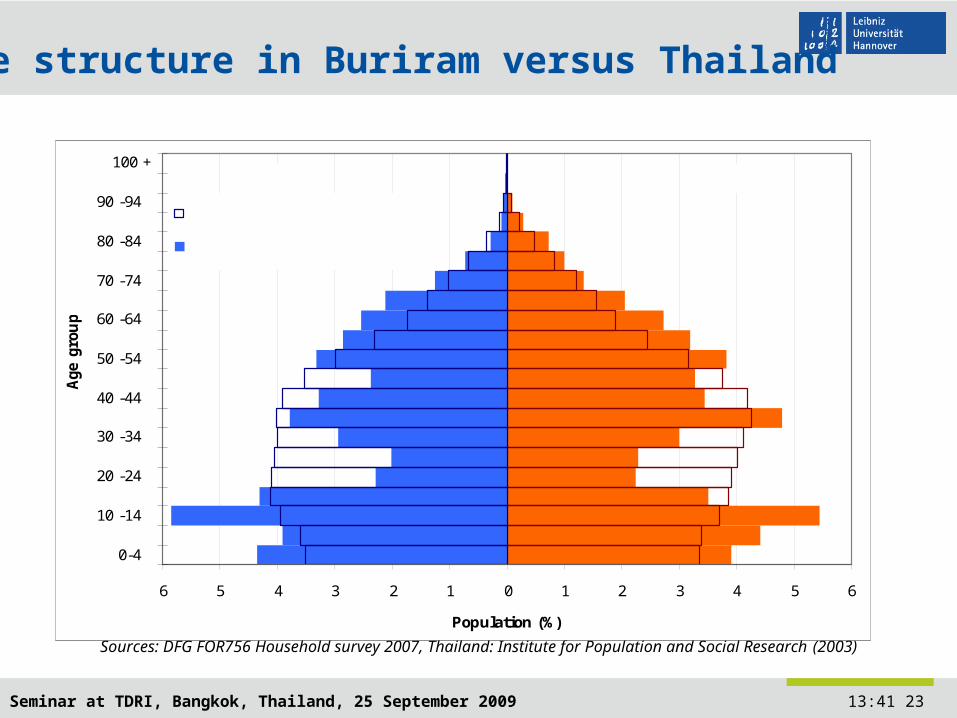
Age structure in Buriram versus Thailand
Sources: DFG FOR756 Household survey 2007, Thailand: Institute for Population and Social Research (2003)
6 5 4 3 2 1 0 1 2 3 4 5 6
Age
gro
up
Population (%)
0-4
10 -14
20 -24
30 -34
40 -44
50 -54
60 -64
70 -74
80 -84
90 -94
100 +
Series5
Males Females
Thailand (Projection 2007)
Buriram (Survey 2007, n=3194)
Seminar at TDRI, Bangkok, Thailand, 25 September 2009 13:41 24
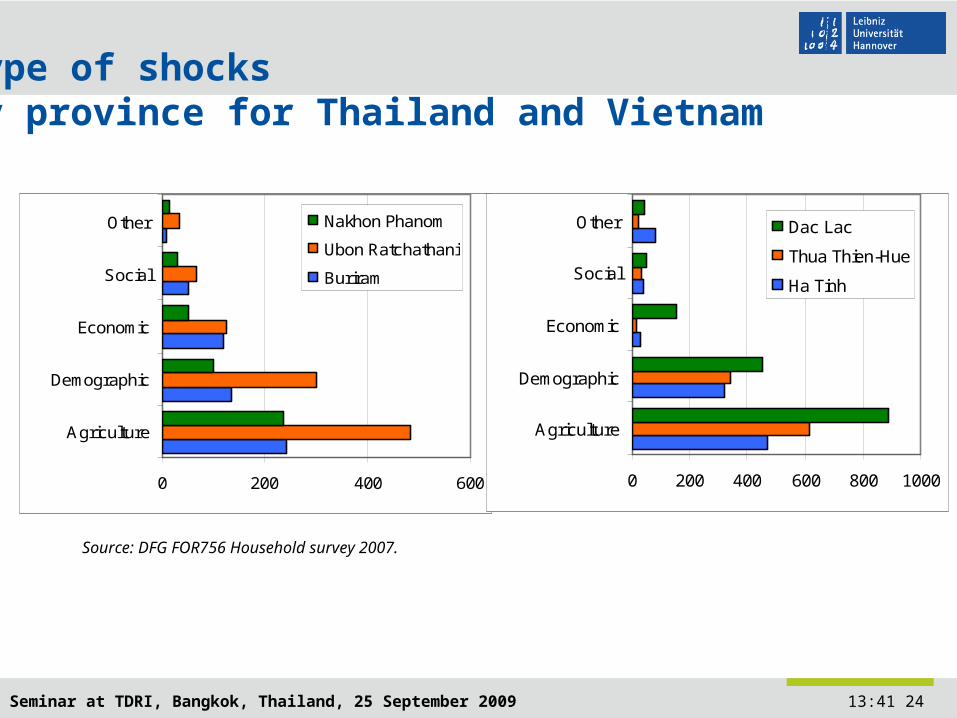
Type of shocks by province for Thailand and Vietnam
0 200 400 600
Agriculture
Demographic
Economic
Social
Other Nakhon Phanom
Ubon Ratchathani
Buriram
0 200 400 600 800 1000
Agriculture
Demographic
Economic
Social
Other Dac Lac
Thua Thien-Hue
Ha Tinh
Source: DFG FOR756 Household survey 2007.

Seminar at TDRI, Bangkok, Thailand, 25 September 2009 13:41 25
Educational Attainment of Household members
0
10
20
30
40
50
60
70
80
90
100
BR UR NP HT TH DLProvince
Perc
ent of
pop
ula
tion
> 1
5 y
ear
s
> secondary
secondary
intermediate
primary
< primary
Source: DFG FOR756 Household survey 2007.
Seminar at TDRI, Bangkok, Thailand, 25 September 2009 13:41 26
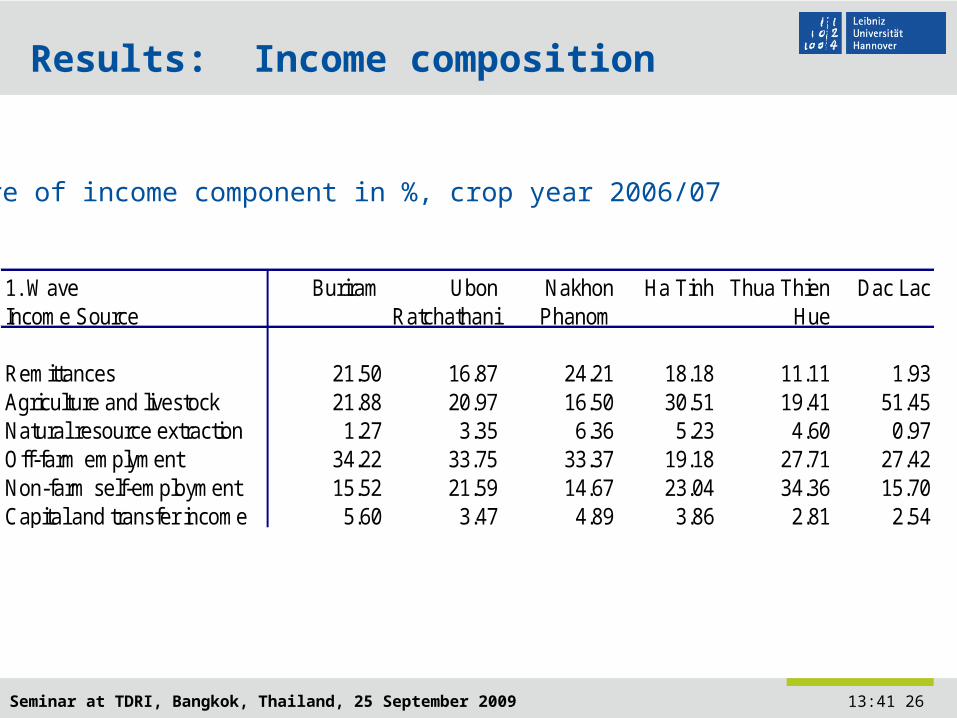
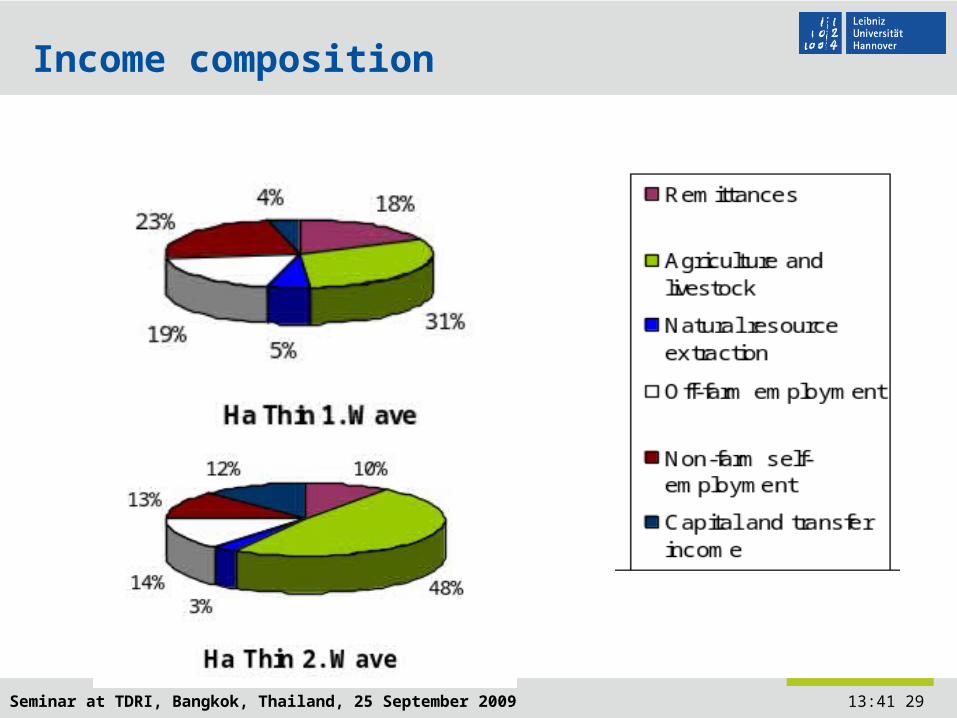
Results: Income composition
Share of income component in %, crop year 2006/07
Buriram Ubon Nakhon Ha Tinh Thua Thien Dac LacIncome Source Ratchathani Phanom Hue
Remittances 21.50 16.87 24.21 18.18 11.11 1.93Agriculture and livestock 21.88 20.97 16.50 30.51 19.41 51.45Natural resource extraction 1.27 3.35 6.36 5.23 4.60 0.97Off-farm emplyment 34.22 33.75 33.37 19.18 27.71 27.42Non-farm self-employment 15.52 21.59 14.67 23.04 34.36 15.70Capital and transfer income 5.60 3.47 4.89 3.86 2.81 2.54
1. Wave
Seminar at TDRI, Bangkok, Thailand, 25 September 2009 13:41 27
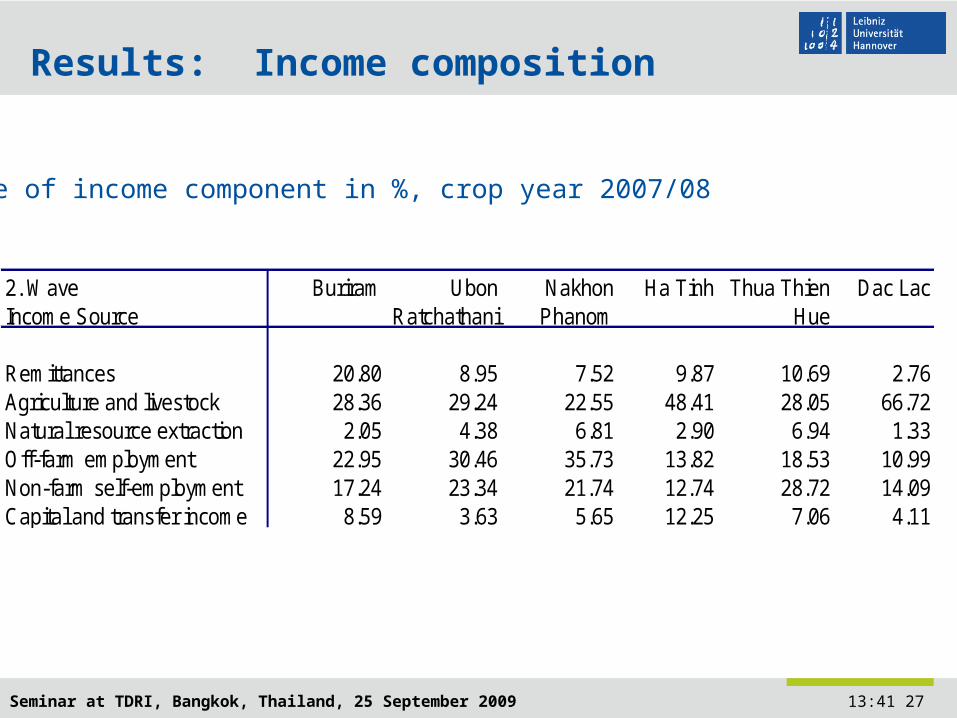
Results: Income composition
Share of income component in %, crop year 2007/08
2. Wave Buriram Ubon Nakhon Ha Tinh Thua Thien Dac LacIncome Source Ratchathani Phanom Hue
Remittances 20.80 8.95 7.52 9.87 10.69 2.76Agriculture and livestock 28.36 29.24 22.55 48.41 28.05 66.72Natural resource extraction 2.05 4.38 6.81 2.90 6.94 1.33Off-farm employment 22.95 30.46 35.73 13.82 18.53 10.99Non-farm self-employment 17.24 23.34 21.74 12.74 28.72 14.09Capital and transfer income 8.59 3.63 5.65 12.25 7.06 4.11
Seminar at TDRI, Bangkok, Thailand, 25 September 2009 13:41 28
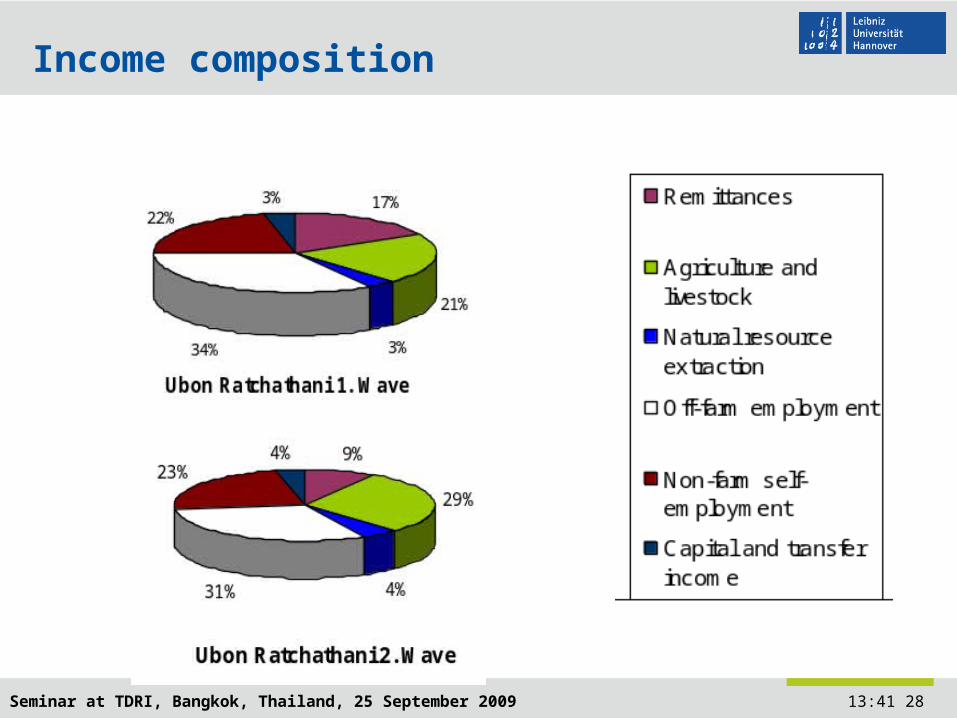
Income composition
Seminar at TDRI, Bangkok, Thailand, 25 September 2009 13:41 29
Income composition

Seminar at TDRI, Bangkok, Thailand, 25 September 2009 13:41 30
Change in crop prices - Vietnam

Seminar at TDRI, Bangkok, Thailand, 25 September 2009 13:41 31
Change in crop prices - Thailand
Seminar at TDRI, Bangkok, Thailand, 25 September 2009 13:41 32
Robustness Tests: Stochastic Dominance Relations
Are conclusions on vulnerability driven by the choice of
the measure ?
Compare cumulative distributions of income and
consumption at provincial level and search for stochastic
dominance relations between these distributions
Search for stochastic dominance relations (FSD,
SSD,TSD) below the threshold income
Comparisons should allow for robust conclusions on
welfare with non censured data
Provide a benchmark for various vulnerability measures

Seminar at TDRI, Bangkok, Thailand, 25 September 2009 13:41 33
Distribution of per capita income in Thai provinces
Source: DFG FOR756 Household survey 2007.
0.2
.4.6
.81
Cu
mu
lativ
e r
ela
tive
fre
qu
en
cy
-10.00 0.00 10.00 20.00 30.00 40.00Per capita income per day in $ (PPP)
Buriram Ubon Ratchathani
Nakhon Phanom
Distribution of per capita income

Seminar at TDRI, Bangkok, Thailand, 25 September 2009 13:41 34
Dominance relations for provincial distributions and critical values: Per capita consumption
Source: DFG FOR756 Household surveys 2007.
Thailand Vietnam Cross-country
Buriram - Ubon'
Buriram - N’
Phanom
Ubon' - N’
Phanom
Ha Tinh - Hue
Ha Tinh - Dak Lak
Hue - Dak Lak
Ubon' - Dak Lak
N’ Phanom - Ha Tinh
> < < < > > > FSD 0.83 0.73 0.74 9.18 1.53 2.51 0.74
> < < > > SSD 1.72 0.75 1.90 1.97 5.11
> < < > > TSD
2.34 0.78 2.29 2.51 8.32

Seminar at TDRI, Bangkok, Thailand, 25 September 2009 13:41 35
Consumption distributions – cross-country comparison
Source: DFG FOR756 Household surveys 2007, 2008.
0.2
.4.6
.81
F(X
)
0 2 4 6 8 10Consumption per capita and day
Ubon Ratchathani Dak Lak
Source: DFG FOR756 Household survey 2007.
Seminar at TDRI, Bangkok, Thailand, 25 September 2009 13:41 36
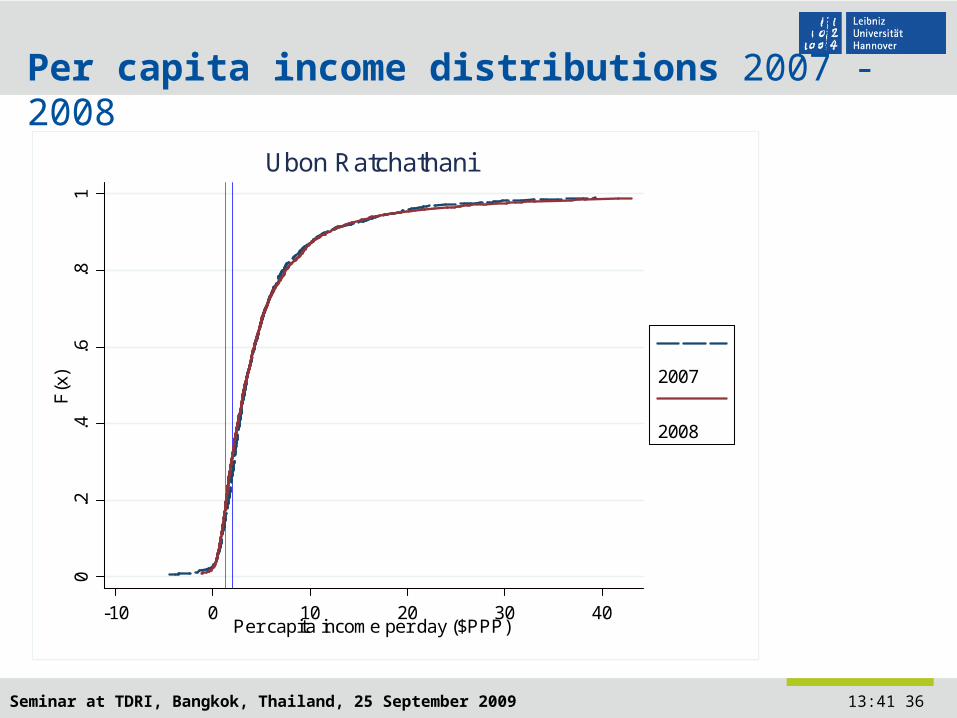
Per capita income distributions 2007 - 2008
Source: DFG FOR756 Household surveys 2007, 2008.
0.2
.4.6
.81
F(x
)
-10 0 10 20 30 40Per capita income per day ($PPP)
2007
2008
Ubon Ratchathani
Seminar at TDRI, Bangkok, Thailand, 25 September 2009 13:41 37
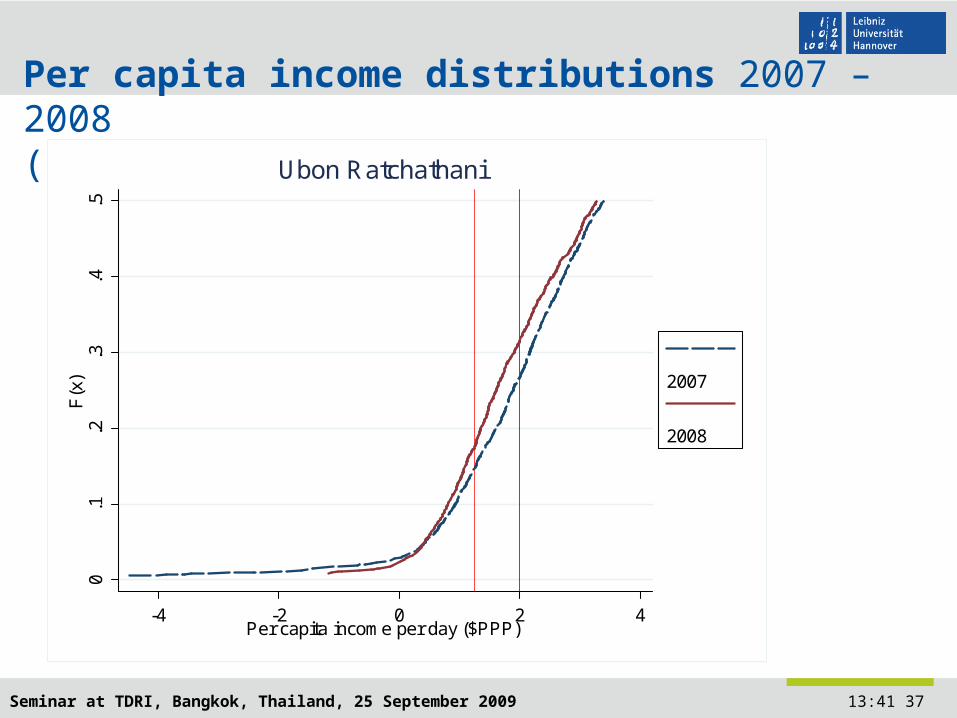
Per capita income distributions 2007 – 2008 (lower part)
Source: DFG FOR756 Household surveys 2007, 2008.
0.1
.2.3
.4.5
F(x
)
-4 -2 0 2 4Per capita income per day ($PPP)
2007
2008
Ubon Ratchathani
Seminar at TDRI, Bangkok, Thailand, 25 September 2009 13:41 38
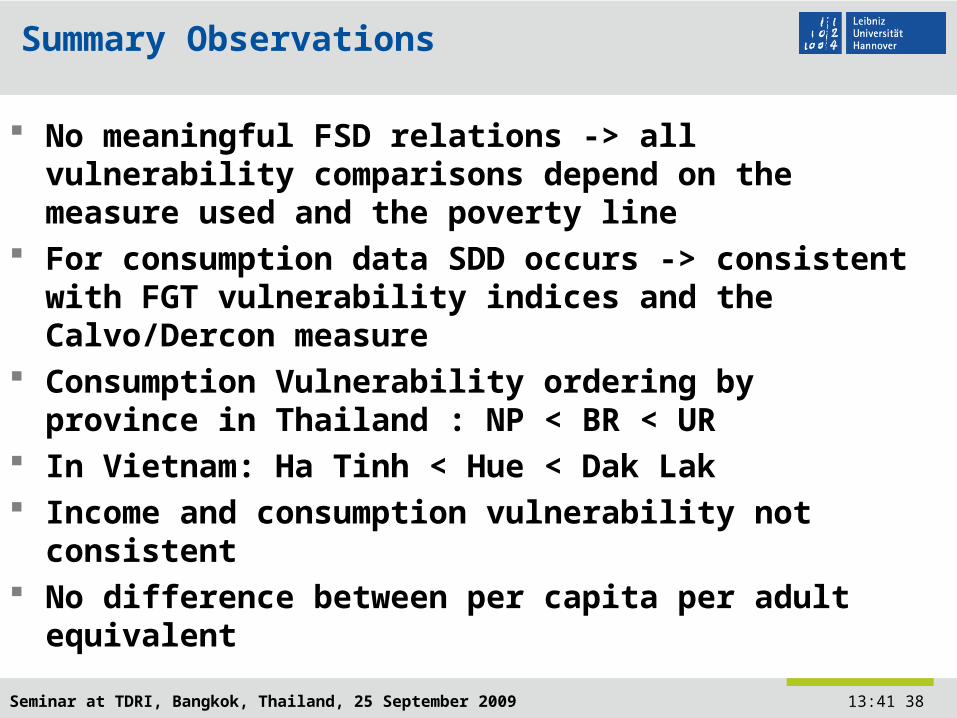
Summary Observations
No meaningful FSD relations -> all vulnerability comparisons depend on the measure used and the poverty line
For consumption data SDD occurs -> consistent with FGT vulnerability indices and the Calvo/Dercon measure
Consumption Vulnerability ordering by province in Thailand : NP < BR < UR
In Vietnam: Ha Tinh < Hue < Dak Lak Income and consumption vulnerability not
consistent No difference between per capita per adult
equivalent
Seminar at TDRI, Bangkok, Thailand, 25 September 2009 13:41 39
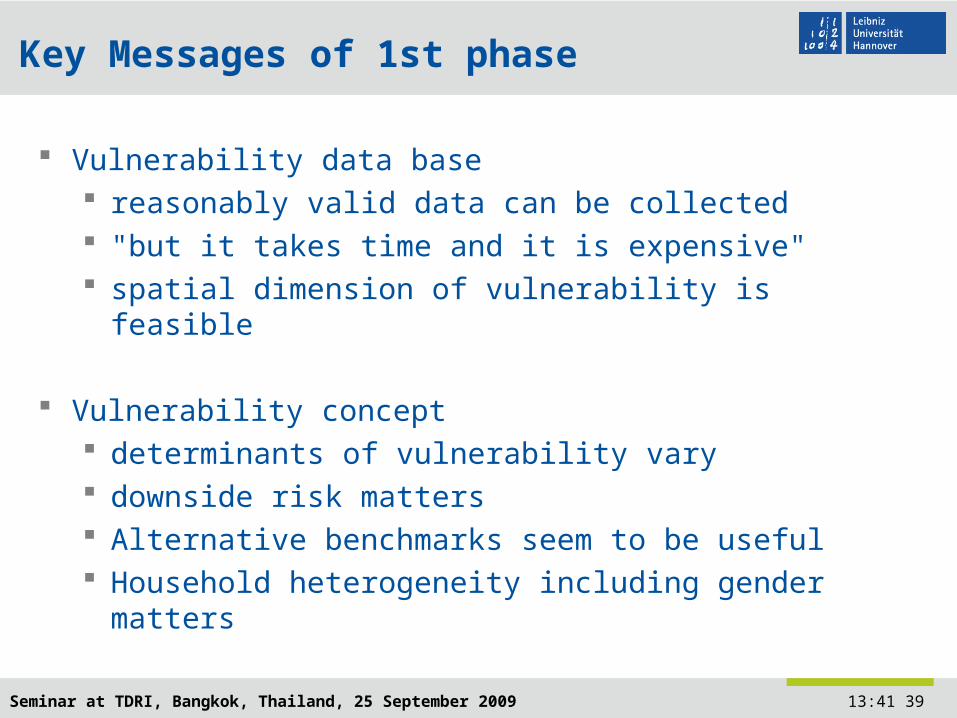
Key Messages of 1st phase
Vulnerability data base reasonably valid data can be collected "but it takes time and it is expensive" spatial dimension of vulnerability is feasible
Vulnerability concept determinants of vulnerability vary downside risk matters Alternative benchmarks seem to be useful Household heterogeneity including gender matters
Seminar at TDRI, Bangkok, Thailand, 25 September 2009 13:41 40
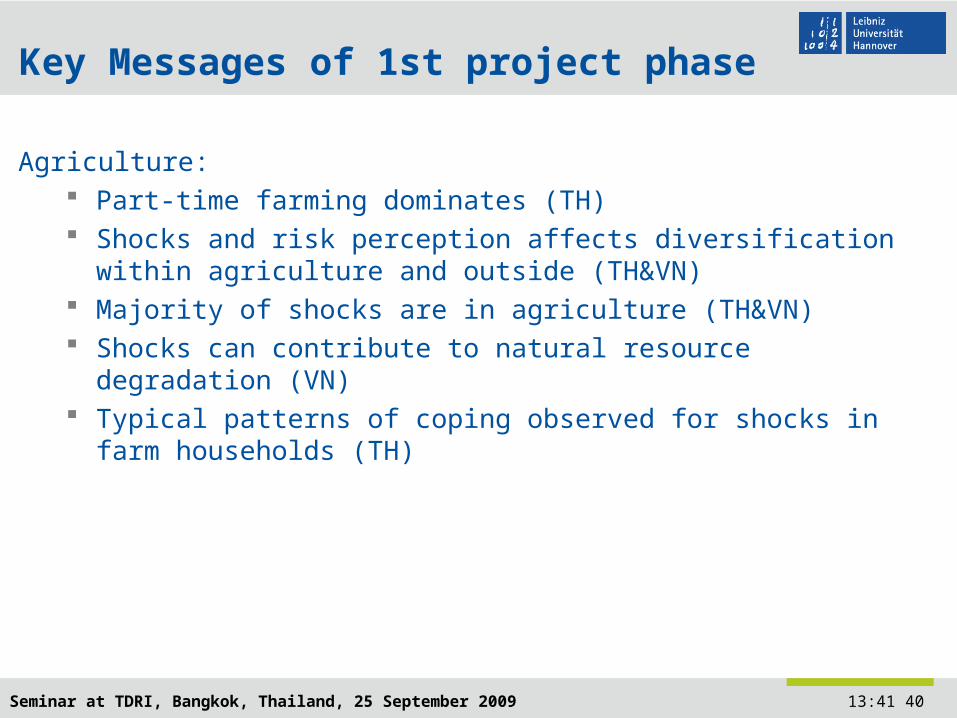
Agriculture: Part-time farming dominates (TH) Shocks and risk perception affects diversification within agriculture
and outside (TH&VN) Majority of shocks are in agriculture (TH&VN) Shocks can contribute to natural resource degradation (VN) Typical patterns of coping observed for shocks in farm households
(TH)
Key Messages of 1st project phase
Seminar at TDRI, Bangkok, Thailand, 25 September 2009 13:41 41
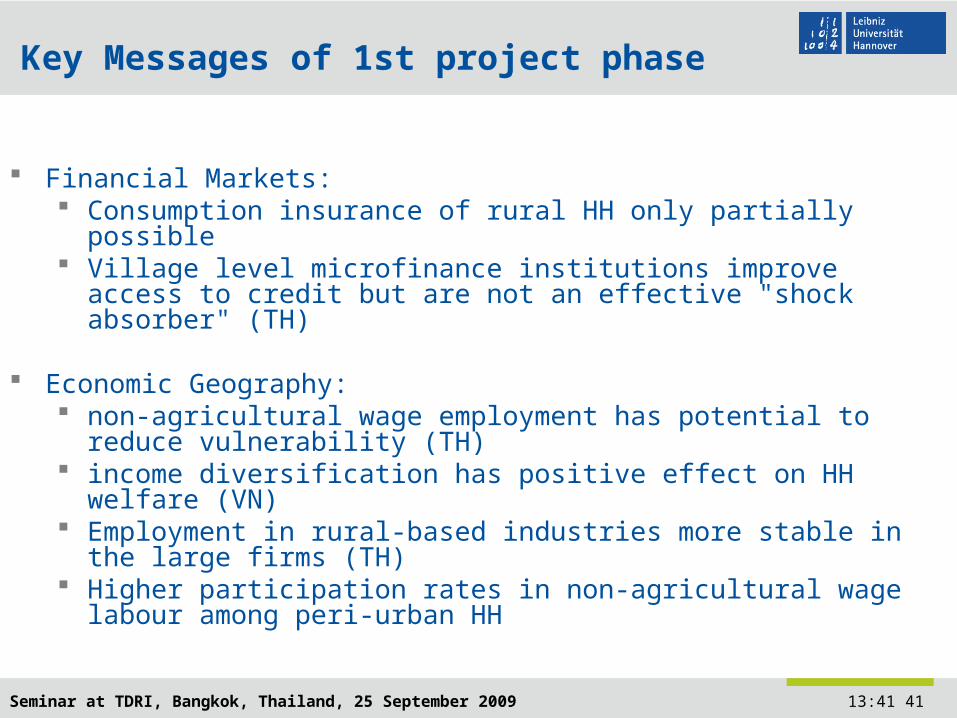
Financial Markets: Consumption insurance of rural HH only partially possible Village level microfinance institutions improve access to credit but are
not an effective "shock absorber" (TH)
Economic Geography: non-agricultural wage employment has potential to reduce vulnerability
(TH) income diversification has positive effect on HH welfare (VN) Employment in rural-based industries more stable in the large firms (TH) Higher participation rates in non-agricultural wage labour among peri-
urban HH
Key Messages of 1st project phase
Seminar at TDRI, Bangkok, Thailand, 25 September 2009 13:41 42
Project plan for next phase
Add another two panel waves in 2010 and 2011
Refine risk module and risk experiment
Add investment module
Add village business survey
Interview domestic migrants once (in 2010)

Seminar at TDRI, Bangkok, Thailand, 25 September 2009 13:41 43
Economic Geography
- Vulnerability by region, HH types- Nature of off-farm employment by region
- Regional differences of crisis and vulnerability
- Differences in responses to shocks between agricultural and non-agricultural households
- Demand for skills of rural-based industries vs. human capital of rural households
Financial Institutions
-Finance as a shockabsorber?
-Issues of ruraldevelopment finance
-Risk attitudes, gender and cultural differences
Agriculture
-Economic crisis and de-velopment of agriculture in peripheral areas
-Economic crisis and natural environment
-Risk perceptions and decision making
Vulnerability and
HH dynamics
Managementof Vulnerability
Database
Risk preferences and perceptions
Non-agricultural
income
Thailand
Vietnam
Finan
cial
inst
itutio
ns
and e
mplo
ymen
t
Research Topics 2nd Project Phase

Seminar at TDRI, Bangkok, Thailand, 25 September 2009 13:41 44
Thank you very much for your attention!
Seminar at TDRI, Bangkok, Thailand, 25 September 2009 13:41 45
Risk attitudes
Risk is a major variable in vulnerability
assessments
Combining risk experiments with risk questions
in surveys
Simple self-assessment is validated by survey
evidence
Risk experiment may need to be adjusted to
cultural context and level of education
Gender does not seem to matter
More testing is needed !

Seminar at TDRI, Bangkok, Thailand, 25 September 2009 13:41 46
Results: Risk attitudes, survey based
0.2
.4
0 5 10 0 5 10
Thailand Vietnam
De
nsi
ty
General willingness to take riskGraphs by Vietnam dummy

Seminar at TDRI, Bangkok, Thailand, 25 September 2009 13:41 47
Results: Risk attitudes, experiment
0.0
05.0
1.0
15.0
2.0
25D
ensi
ty
0 50 100 150 200Certain payoff at switchpoint
Seminar at TDRI, Bangkok, Thailand, 25 September 2009 13:41 48
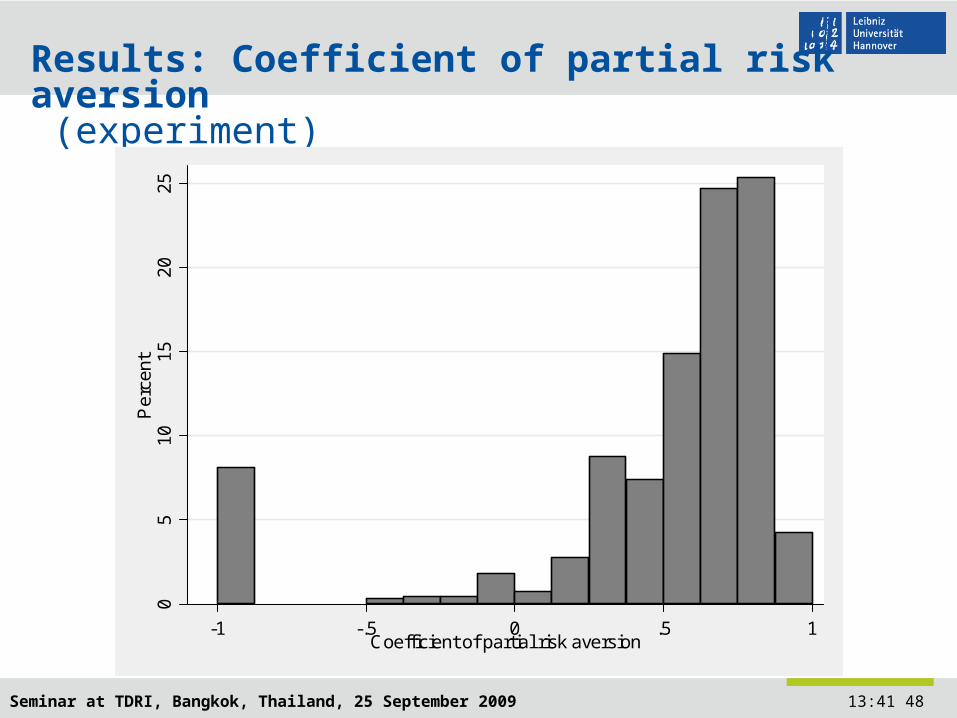
Results: Coefficient of partial risk aversion (experiment)
05
1015
2025
Per
cent
-1 -.5 0 .5 1Coefficient of partial risk aversion