devon education and learning education and learning...
TRANSCRIPT

CS/18/13
Children’s Scrutiny 20 March 2018
Devon Education and Learning
Education and Learning
Performance Report
Quarter 3 - 2017/18
Update to previous results and discussion
Brief

2

3
1 Closing the Gap: Early Years Take up of Early Years Funding for 2-year olds The take up of funding for two-year olds has increased in the Autumn Term 2017 to 93%. This is in line with the take up for the same period last year (92.9%). Devon continues to perform significantly better than latest national (71%) and regional (80%) take up rates. Take up of two-year-old places is a parental choice. Therefore, we would not expect all 2-year olds to be accessing a place, as some parents will prefer to wait until their child is older. Data sources: Devon take up: Early Years Team, DCC, Feb 2018, national and regional benchmarks DfE LAIT at 05/10/17
30 hours Free Childcare From September 2017 3 and 4-year olds may be entitled to 30 hours free childcare a week compared to 15 hours previously. To gain the additional 15 hours parents make an application and if eligible are given an eligibility code. To take up the 30 hours free childcare parents must then have their code validated by the childcare provider/LA. Initial information released by the Department for Education indicates that the percentage of eligibility codes validated (parents taking up the 30 funded hours) in Devon is higher than nationally and regionally. 97% of codes were validated in Devon in the Autumn term compared to 94% nationally and 96% in the South West. This take up continues in the Spring term where 97% of codes were validated in Devon compared to 92% nationally and 95% regionally.
Data source: Early Years Team, DCC, February 2018, DfE LAIT 05/10/17

4
1 Closing the Gap: Key Stage 4 pupil characteristics results 2016/17
Attainment Outcomes – Disadvantaged* Pupils
Recently published information indicates that the performance of Devon’s disadvantaged pupils has significantly improved in English and Maths and Devon is now in line with nationally (44.5%). Whilst performance has improved slightly in the EBACC measure, Devon’s disadvantaged pupils do not perform as well as nationally. Devon is not performing slightly below the National Average in the Attainment 8 measure. The Department for Education have advised that the decrease in Attainment 8 in the last year is as expected following the changes to the 2017 point scores assigned to grades due to the introduction of 9-1 GCSEs. Please note that due to these changes comparison with previous years should be treated with caution. Devon’s average Progress 8 score per disadvantaged pupil is -0.53 which indicates that Devon pupils are making less progress than average for all pupils. This is also reflected nationally where the progress 8 score is -0.40. The attainment gap between Devon’s disadvantaged pupils and their counterparts has improved in all three measures. The attainment gap in English and Maths has seen the greatest improvement, reducing down from 30.4 percentage points last year to 25.3 percentage points this year. Devon’s attainment gap is now better than nationally in all three measures.
* those registered as eligible for free school meals at any point in the last six years, children looked after by the LA and children who left care through adoption or via a Special Guardianship or Child Arrangements Order.

5
1 Closing the Gap: Key Stage 4 pupil characteristics results 2016/17
Attainment Outcomes – Free School Meal Pupils The performance of Devon pupils in receipt of Free School Meals has improved significantly in the last year in English and Maths, rising from 36.6% to 41.6% in 2016/17. Devon FSM pupils continue to perform better than nationally in the English and Maths and Attainment 8 measures. Whilst the performance of Devon pupils has remained stable in EBACC (7.2%), they do not perform as well as nationally. Devon’s average Progress 8 score per Free School Meal pupil is -0.59 which indicates that Devon pupils are making less progress than the average for all pupils. This is also reflected nationally where the Progress 8 score is -0.48. The attainment gap between Devon’s FSM pupils and their non FSM peers has improved, with the gap reducing in each of the three key performance measures. The attainment gap in English and Maths and Attainment 8 is now narrower in Devon than nationally. Note: the DfE have advised that the decrease in Attainment 8 is as expected
following the changes to the 2017 point scores assigned to grades due to the introduction of 9-1 GCSEs. Please note that due to these changes comparison with previous years should be treated with caution.

6
1 Closing the Gap: Key Stage 4 pupil characteristics results 2016/17
Attainment Outcomes – Special Educational Need Pupils Devon pupils with SEN continue to perform better than nationally in both English & Maths and Attainment 8. The performance of SEN pupils with Statements/EHCPs and pupils with SEN Support has improved in English and Maths in the last year. No information is available in relation to the EBACC grades 9 to 4 (standard pass), as the Department for Education have suppressed these figures to ensure confidentiality (due to low number of pupils). However, information is available for the EBACC grades 9 to 5 (strong pass) which indicates that Devon pupils with a Statement/EHCP are performing better than nationally (2.4% in Devon compared to 1.4% nationally). Devon’s average Progress 8 score for Statemented/EHCP pupils is -0.91 which indicates that Devon pupils are making less progress than average for all pupils. However, they are making more progress than seen Nationally for this cohort where the average Progress 8 score is -1.04. Devon pupils with SEN Support are making better progress than their Statemented/EHCP peers, with an average score of -0.40. This is also reflected nationally where pupils with SEN Support have an average Progress 8 score of -0.43. Note: the DfE have advised that the decrease in Attainment 8 is as expected
following the changes to the 2017 point scores assigned to grades due to the introduction of 9-1 GCSEs. Please note that due to these changes comparison with previous years should be treated with caution.
7
1 Closing the Gap: Key Stage 4 pupil characteristics results 2016/17
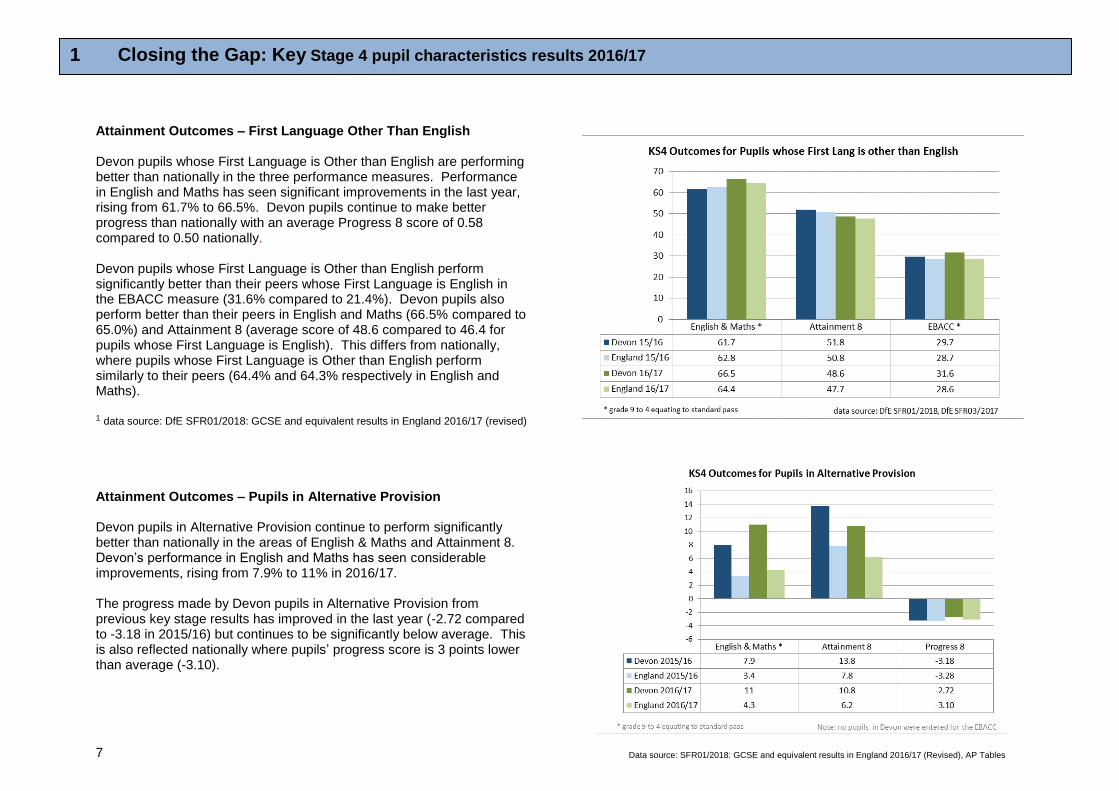
Attainment Outcomes – First Language Other Than English Devon pupils whose First Language is Other than English are performing better than nationally in the three performance measures. Performance in English and Maths has seen significant improvements in the last year, rising from 61.7% to 66.5%. Devon pupils continue to make better progress than nationally with an average Progress 8 score of 0.58 compared to 0.50 nationally. Devon pupils whose First Language is Other than English perform significantly better than their peers whose First Language is English in the EBACC measure (31.6% compared to 21.4%). Devon pupils also perform better than their peers in English and Maths (66.5% compared to 65.0%) and Attainment 8 (average score of 48.6 compared to 46.4 for pupils whose First Language is English). This differs from nationally, where pupils whose First Language is Other than English perform similarly to their peers (64.4% and 64.3% respectively in English and Maths). 1 data source: DfE SFR01/2018: GCSE and equivalent results in England 2016/17 (revised)
Attainment Outcomes – Pupils in Alternative Provision Devon pupils in Alternative Provision continue to perform significantly better than nationally in the areas of English & Maths and Attainment 8. Devon’s performance in English and Maths has seen considerable improvements, rising from 7.9% to 11% in 2016/17. The progress made by Devon pupils in Alternative Provision from previous key stage results has improved in the last year (-2.72 compared to -3.18 in 2015/16) but continues to be significantly below average. This is also reflected nationally where pupils’ progress score is 3 points lower than average (-3.10).
Data source: SFR01/2018: GCSE and equivalent results in England 2016/17 (Revised), AP Tables
8
2 Inclusion: SEND
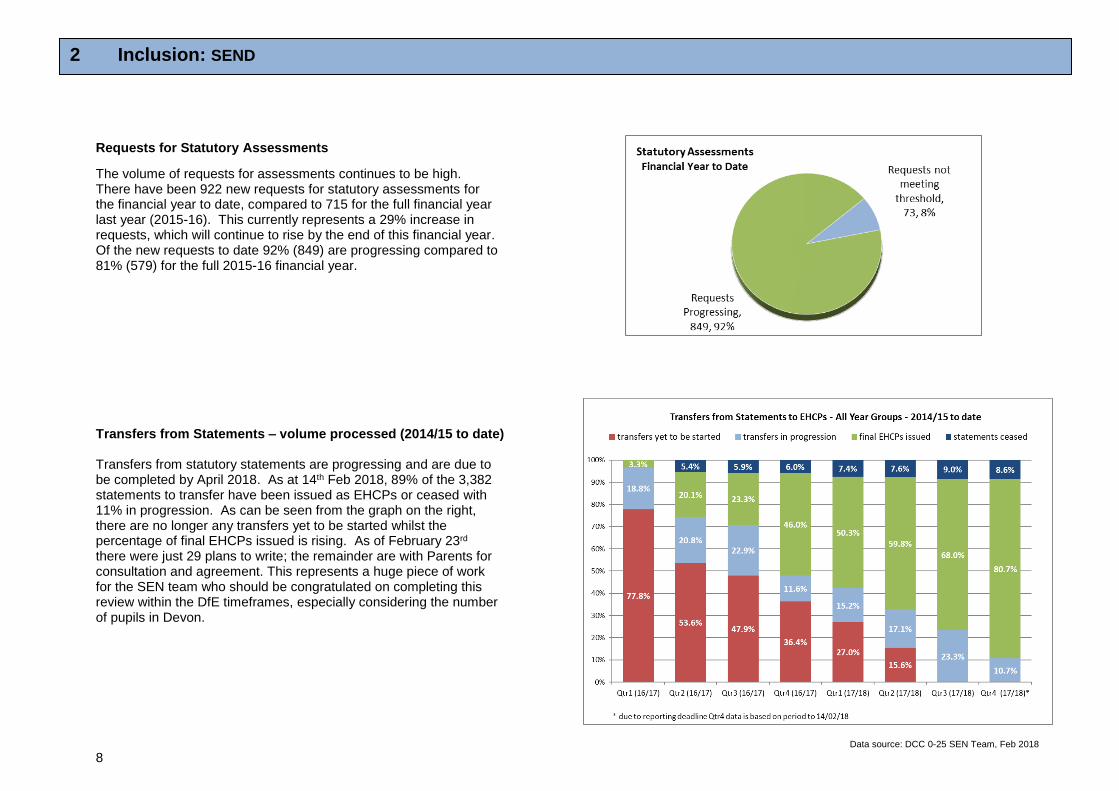
Requests for Statutory Assessments
The volume of requests for assessments continues to be high. There have been 922 new requests for statutory assessments for the financial year to date, compared to 715 for the full financial year last year (2015-16). This currently represents a 29% increase in requests, which will continue to rise by the end of this financial year. Of the new requests to date 92% (849) are progressing compared to 81% (579) for the full 2015-16 financial year. Transfers from Statements – volume processed (2014/15 to date) Transfers from statutory statements are progressing and are due to be completed by April 2018. As at 14th Feb 2018, 89% of the 3,382 statements to transfer have been issued as EHCPs or ceased with 11% in progression. As can be seen from the graph on the right, there are no longer any transfers yet to be started whilst the percentage of final EHCPs issued is rising. As of February 23rd there were just 29 plans to write; the remainder are with Parents for consultation and agreement. This represents a huge piece of work for the SEN team who should be congratulated on completing this review within the DfE timeframes, especially considering the number of pupils in Devon.
Data source: DCC 0-25 SEN Team, Feb 2018
9
2 Inclusion: Not in Employment, Education or Training
Not in Employment Education or Training (NEET) Overview (16 and 17 year olds1) Dec 2017
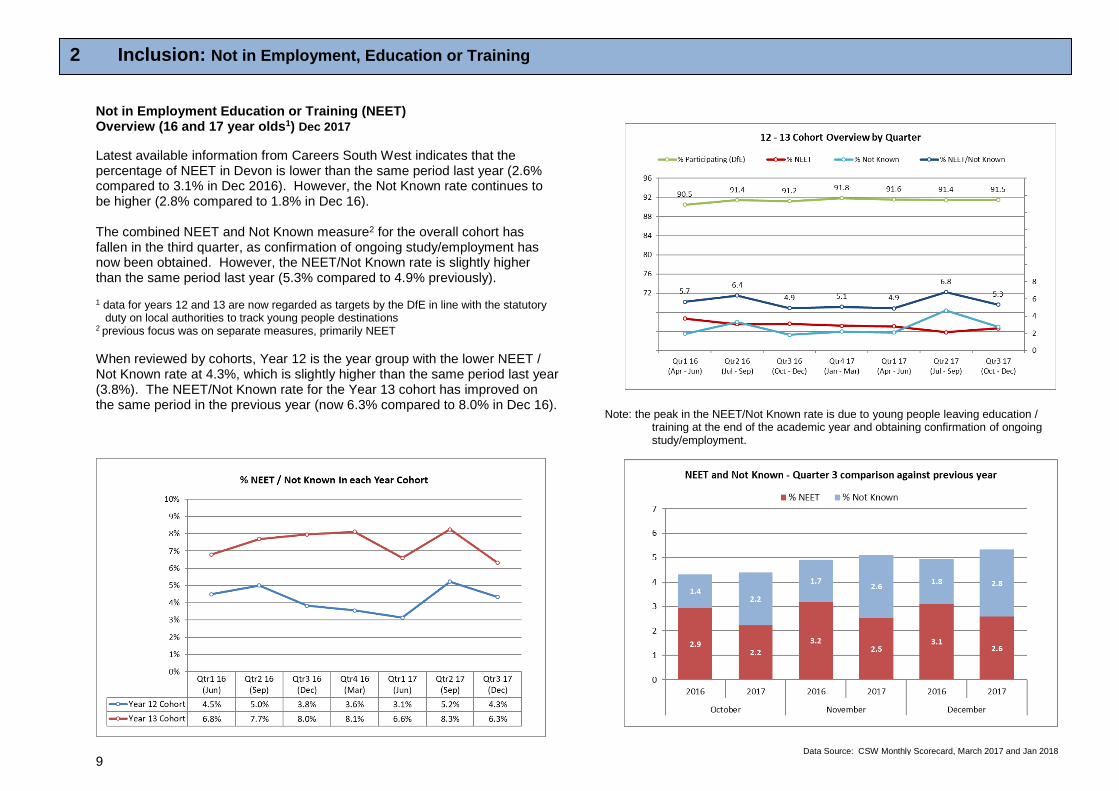
Latest available information from Careers South West indicates that the percentage of NEET in Devon is lower than the same period last year (2.6% compared to 3.1% in Dec 2016). However, the Not Known rate continues to be higher (2.8% compared to 1.8% in Dec 16). The combined NEET and Not Known measure2 for the overall cohort has fallen in the third quarter, as confirmation of ongoing study/employment has now been obtained. However, the NEET/Not Known rate is slightly higher than the same period last year (5.3% compared to 4.9% previously). 1 data for years 12 and 13 are now regarded as targets by the DfE in line with the statutory
duty on local authorities to track young people destinations 2 previous focus was on separate measures, primarily NEET
When reviewed by cohorts, Year 12 is the year group with the lower NEET / Not Known rate at 4.3%, which is slightly higher than the same period last year (3.8%). The NEET/Not Known rate for the Year 13 cohort has improved on the same period in the previous year (now 6.3% compared to 8.0% in Dec 16).
Note: the peak in the NEET/Not Known rate is due to young people leaving education / training at the end of the academic year and obtaining confirmation of ongoing study/employment.
Data Source: CSW Monthly Scorecard, March 2017 and Jan 2018

10
2 Inclusion: Not in Employment, Education or Training
NEET by Vulnerable Groups (Years 12 and 13) Young people from vulnerable groups are significantly more likely to be NEET than the overall cohort of young people. However, the level of NEET has improved this year, with the majority of vulnerable groups seeing a decline in their NEET numbers compared to the same period last year.
▪ Whilst Teenage Parents continue to be the vulnerable group with
the highest NEET rate (85.7% of teenage parents) their cohort numbers are low (21 in Dec 17 and 48 in June 17). Additionally, mothers often want to spend time with their new babies and return to education at a later date.
▪ Youth Offending (YOS) has the second highest NEET rate for a
vulnerable group (32.1% of young offenders) but also has consistently low cohorts (28 in Dec 17 and 36 in June 17).
▪ SEND is the vulnerable group with the largest cohort and has
consistently low NEET rates. The percentage NEET has fallen in the last year, dropping from 11.4% in Dec 16 to 7.7% NEET in Dec 17 (SEND cohort sizes of 766 and 750 respectively).
▪ Young Carers also have consistently low NEET rates with
substantial sized cohorts. In Dec 17, 4.6% of young carers were NEET (cohort of 197). This is an improvement on the same period last year which had 6.5% NEET (cohort of 214).
▪ The percentage of Children in Care classified as NEET has fallen in the last term, with 14.9% NEET in Dec 17 (27 from a cohort of 181) compared to 25% in June 17 (29 from a cohort of 116). Its recognised that information for Children in Care would be known and therefore we are working to ensure there is information sharing between Social Services and Careers South West.
▪ The level of NEET for Care Leavers has remained relativey stable
across the periods with a slight fall in the latest period (25% NEET in Dec 17 compared to 26.5% in June 17 and 25.9% in Dec 16).
Data Source: CSW Monthly Scorecard, Mar 2017 (2016/17 months), Jan 2018 (2017/18 months)

11
3 Quality: Ofsted Outcomes
Devon Primary, Secondary and Special Schools The overall percentage of Devon Primary, Secondary and Special Schools, judged by Ofsted as Good or Outstanding has fallen slightly in this last reporting period. However Devon continues to perform better than the national and regional picture, with 89.9% of Devon schools currently good or outstanding compared to 88.9% of schools nationally and 88.5% of schools regionally. Data source: Monthly Management Information: Ofsted's school inspections outcomes,
Management Information – Schools – 31st Dec 2017.
Devon Primary schools are slightly better than nationally, with 90.6% judged as good or outstanding compared to 90.4% nationally. Devon Secondary schools are also performing better than nationally, with judged as good or outstanding compared to 80% nationally. There has been no change in the performance of Devon Maintained Special Schools as, at the time of writing, no school inspections had been published since the last reporting period. In order to arrest the downward decline the school improvement programme is being refreshed to bring it more in line with revised ofsted criteria. The programme will also be made bespoke to each phase of education. The new programmes will be known as Early Excellence, Primary Excellence and Secondary Excellence. The programme will be part of our standard delivery for maintined schools but also available to Academies. Devon Pupils in Primary, Secondary and Special Schools
88.23% (82,362) of Devon pupils1 are attending schools that have been judged as Good or Outstanding. This is better than the national and regional figures (87.2% and 87.7% respectively). 86.26% (16,431) of disadvantaged children2 in Devon are attending Good or Outstanding schools. These are pupils who are Free School Meal children, children currently in care, adopted from care or service children.
89.89% (2,357) of pupils with statements of special educational needs or education, health and care plans3 are attending Good or Outstanding Schools. Note: no national benchmarks are available for these groups of pupils.
Data Source: DfE Monthly Management Information: Ofsted School Inspection Outcomes, 31 Dec 2017
Data Source: DfE Monthly Management Information: Ofsted School Inspection Outcomes, 31 Dec 2017
1 Ofsted MI Report uses Spring 2017 pupil cohorts 2 Pupil Numbers from DfE Pupil Premium July 2017 3 Pupil Numbers as at Spring Census 2017
Children with Special Educational Needs Annual Report 2016/17
1
Children with Special Educational Needs attending Devon Schools – Part A
This section of the report provides information on pupils with Special Educational Needs attending Devon schools. A later section covers pupils with Special Educational Needs whose Statements/Education Health and Care Plans are maintained by Devon LA. The cohort in this section of the report is based on pupils’ Special Educational Needs status as at the time of the Spring School Census in January 2017 and taking exams in Summer 17. There are two sets of pupil cohorts within this section, i) pupils who have a Statement of SEN or an Education, Health and Care Plan (EHCP) and ii) pupils recognised as having Special Educational Needs and receive support in school (SEN Support) but do not have a Statement or EHCP.
Special Educational Needs Pupil Cohorts Attending Devon Schools
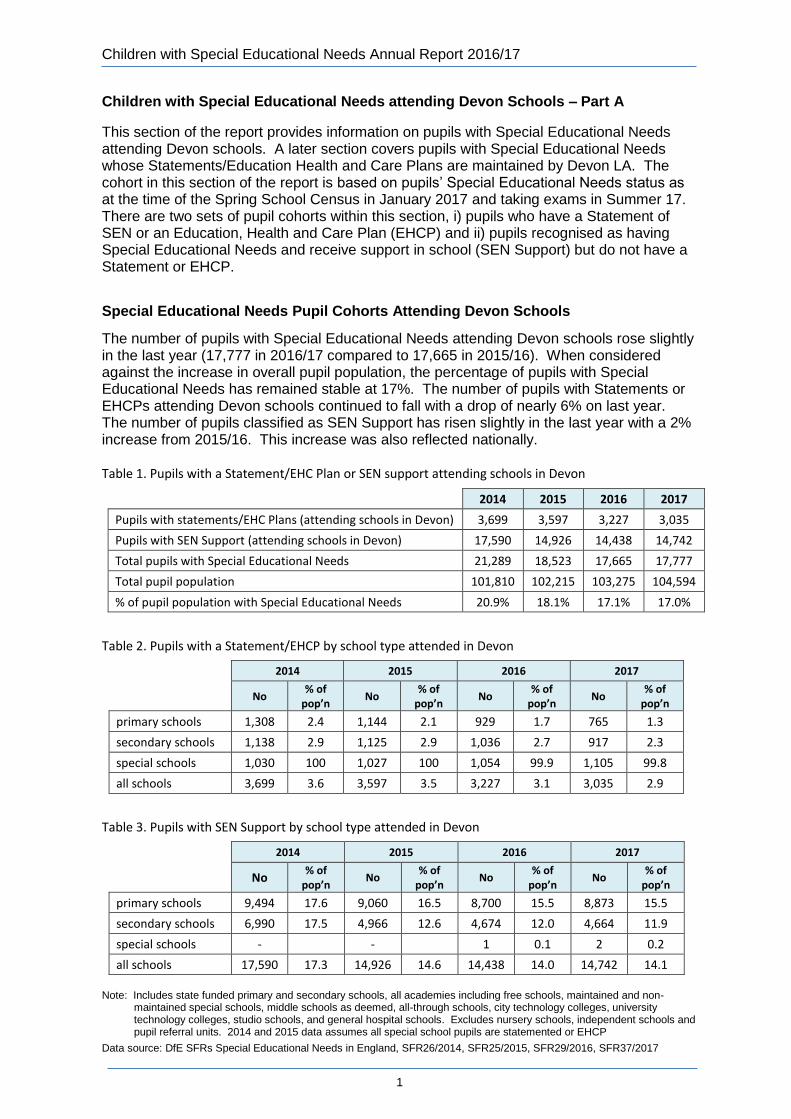
The number of pupils with Special Educational Needs attending Devon schools rose slightly in the last year (17,777 in 2016/17 compared to 17,665 in 2015/16). When considered against the increase in overall pupil population, the percentage of pupils with Special Educational Needs has remained stable at 17%. The number of pupils with Statements or EHCPs attending Devon schools continued to fall with a drop of nearly 6% on last year. The number of pupils classified as SEN Support has risen slightly in the last year with a 2% increase from 2015/16. This increase was also reflected nationally. Table 1. Pupils with a Statement/EHC Plan or SEN support attending schools in Devon
2014 2015 2016 2017
Pupils with statements/EHC Plans (attending schools in Devon) 3,699 3,597 3,227 3,035
Pupils with SEN Support (attending schools in Devon) 17,590 14,926 14,438 14,742
Total pupils with Special Educational Needs 21,289 18,523 17,665 17,777
Total pupil population 101,810 102,215 103,275 104,594
% of pupil population with Special Educational Needs 20.9% 18.1% 17.1% 17.0%
Table 2. Pupils with a Statement/EHCP by school type attended in Devon
2014 2015 2016 2017
No % of pop’n
No % of pop’n
No % of pop’n
No % of pop’n
primary schools 1,308 2.4 1,144 2.1 929 1.7 765 1.3
secondary schools 1,138 2.9 1,125 2.9 1,036 2.7 917 2.3
special schools 1,030 100 1,027 100 1,054 99.9 1,105 99.8
all schools 3,699 3.6 3,597 3.5 3,227 3.1 3,035 2.9
Table 3. Pupils with SEN Support by school type attended in Devon
2014 2015 2016 2017
No % of pop’n
No % of pop’n
No % of pop’n
No % of pop’n
primary schools 9,494 17.6 9,060 16.5 8,700 15.5 8,873 15.5
secondary schools 6,990 17.5 4,966 12.6 4,674 12.0 4,664 11.9
special schools - - 1 0.1 2 0.2
all schools 17,590 17.3 14,926 14.6 14,438 14.0 14,742 14.1
Note: Includes state funded primary and secondary schools, all academies including free schools, maintained and non-
maintained special schools, middle schools as deemed, all-through schools, city technology colleges, university technology colleges, studio schools, and general hospital schools. Excludes nursery schools, independent schools and pupil referral units. 2014 and 2015 data assumes all special school pupils are statemented or EHCP
Data source: DfE SFRs Special Educational Needs in England, SFR26/2014, SFR25/2015, SFR29/2016, SFR37/2017
Children with Special Educational Needs Annual Report 2016/17
2
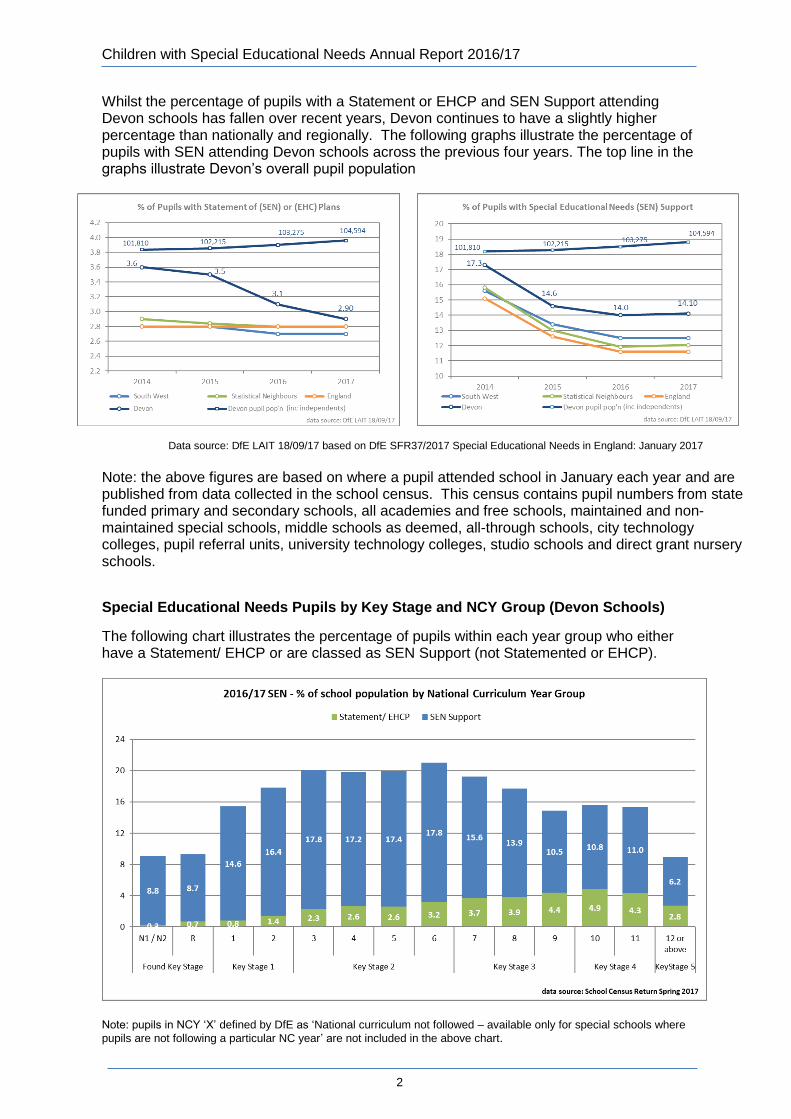
Whilst the percentage of pupils with a Statement or EHCP and SEN Support attending Devon schools has fallen over recent years, Devon continues to have a slightly higher percentage than nationally and regionally. The following graphs illustrate the percentage of pupils with SEN attending Devon schools across the previous four years. The top line in the graphs illustrate Devon’s overall pupil population
Data source: DfE LAIT 18/09/17 based on DfE SFR37/2017 Special Educational Needs in England: January 2017
Note: the above figures are based on where a pupil attended school in January each year and are published from data collected in the school census. This census contains pupil numbers from state funded primary and secondary schools, all academies and free schools, maintained and non-maintained special schools, middle schools as deemed, all-through schools, city technology colleges, pupil referral units, university technology colleges, studio schools and direct grant nursery schools.
Special Educational Needs Pupils by Key Stage and NCY Group (Devon Schools)
The following chart illustrates the percentage of pupils within each year group who either have a Statement/ EHCP or are classed as SEN Support (not Statemented or EHCP).
Note: pupils in NCY ‘X’ defined by DfE as ‘National curriculum not followed – available only for special schools where
pupils are not following a particular NC year’ are not included in the above chart.

Children with Special Educational Needs Annual Report 2016/17
3
As can be seen from the chart, Key Stage 2 year groups have the greatest percentage of pupils with SEN Support (5,498 pupils) with 17.8% of pupils in NCY 6 classified as SEN Support (1,370 pupils). This is higher than the national picture where 14.5% of NCY 6 pupils are SEN Support.
Key Stage 3 and Key Stage 4 year groups have the greatest percentage of pupils with a Statement or EHCP (total of 1,469 pupils). This is also reflected nationally. 4.9% of Devon pupils in NCY 10 (327 pupils) and 4.3% of pupils in NCY 11 (295 pupils) have a Statement or EHCP. This is slightly higher than nationally with 3.8% in NCY 10 and 11 having a Statement/EHCP. When compared against the previous year, NCY 3 has seen the greatest increase in pupils with SEN Support at primary phase, rising from 16.5% in 2015/16 to 17.8% in 2016/17 (141 pupils). At secondary phase, NCY 8 has seen the greatest increase in pupils with SEN Support, rising from 12.2% to 13.9% (129 pupils). The percentage of pupils with Statements or EHCPs in each NCY has, in the majority of NCY groups, fallen over the last year. NCY 10 has seen the greatest increase, rising from 4.6% to 4.9% in 2016/17 (8 pupils). Special Educational Needs Pupils by Gender (Devon Schools)
A greater percentage of boys in Devon have Special Educational Needs than girls. 4% of boys in Devon have a Statement or EHCP which is the same as the national average. 17.5% of boys and 10% of girls in Devon have SEN Support, which is considerably higher than the national picture.
Data source: England: SFR37_2017 Special Educational needs in England: January 2017, National Tables, Devon: January School Census 2017
2015/16 Attendance Rates in Devon Compulsory Schools1 (2016/17 due to be published March 18)
The information in this section is currently based on 2015/16 attendance as 2016/17 information is not due to be published until March 2018. 2015/16 attendance rates for Special Educational Needs pupils attending state funded primary, secondary and special schools remains relatively unchanged in Devon from the previous year. 1 includes state-funded primary, secondary schools, all-through schools, city technology colleges, where state-funded schools
include all academies and free schools. Also includes special schools (maintained special schools, non-maintained special schools and special academies). Excludes general hospital schools, independent special schools and independent schools approved for SEN.

Children with Special Educational Needs Annual Report 2016/17
4
Pupils with Special Educational Needs have higher absence rates than their peers who have no SEN. Devon pupils with a Statement/EHCP had an overall absence rate of 6.7% compared to 4% for Devon pupils with no identified SEN. This is also reflected nationally and is often linked to medical absence.
Overall absence rates for Special Educational Needs cohorts attending Devon primary, secondary and special schools are lower than national averages. Devon pupils with a Statement or EHCP have an overall absence rate of 6.7% compared to 7.6% nationally, whilst Devon pupils with SEN Support have an overall absence rate of 5.5% compared to 6.2% nationally.
2015/16 absence rates are lowest in primary schools and generally highest in secondary schools. However, the overall absence rates for pupils with statements/EHCPs is highest in special schools (7.4% absence rate), followed by secondary schools (7.1%). This is due to higher authorised absence rates which include absence reasons of other and holiday (see absence reasons table below). These are being investigated for further clarification. The chart below illustrates the absence rates across special, primary and secondary schools.

Children with Special Educational Needs Annual Report 2016/17
5
Information on absence reasons for 2016/17 will be reported later in the year when data is available nationally. The chart below illustrates absence reasons for the 2015/16 academic year.
Latest published data for 2015/16 indicates that the percentage of Statement/EHCP pupils attending Devon schools that are persistent absentees is 20.09% which is lower than the national rate of 22.57%. The persistent absentee rates for pupils with Statements/EHCPs and SEN Support are higher than those for pupils with no identified SEN.
Note: pupils are classed as persistent absentees if their attendance falls below 90%.
Children with Special Educational Needs Annual Report 2016/17
6
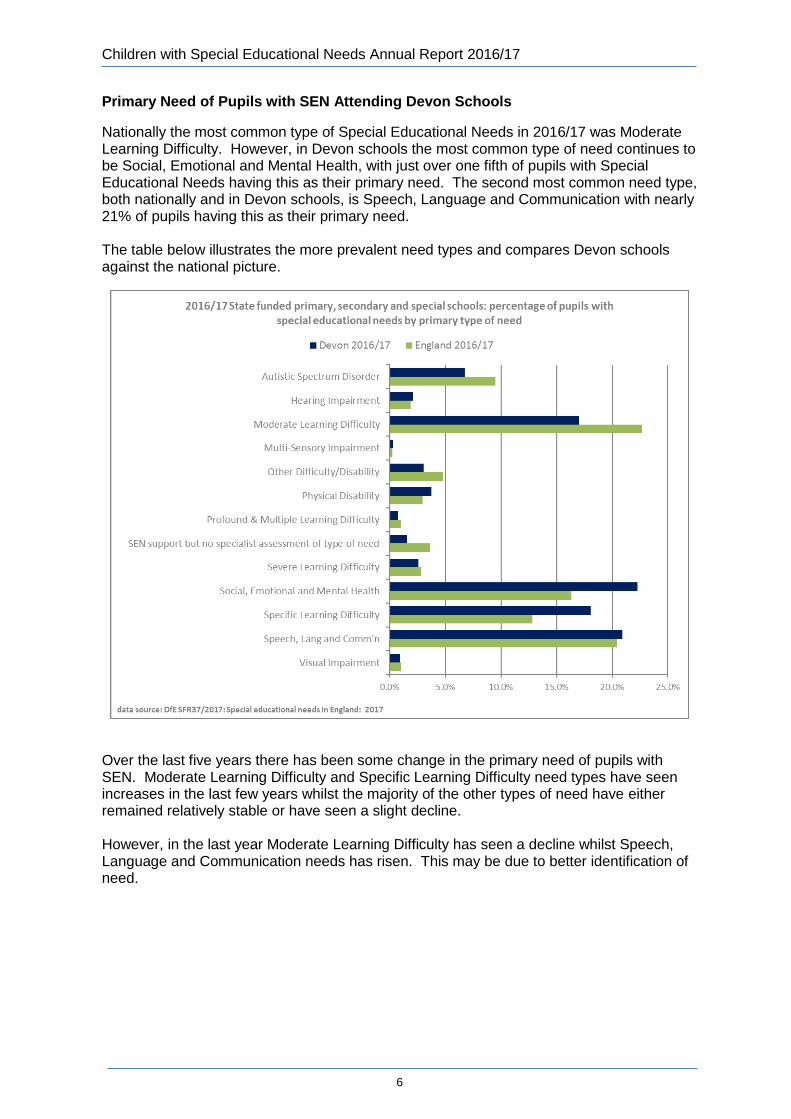
Primary Need of Pupils with SEN Attending Devon Schools
Nationally the most common type of Special Educational Needs in 2016/17 was Moderate Learning Difficulty. However, in Devon schools the most common type of need continues to be Social, Emotional and Mental Health, with just over one fifth of pupils with Special Educational Needs having this as their primary need. The second most common need type, both nationally and in Devon schools, is Speech, Language and Communication with nearly 21% of pupils having this as their primary need. The table below illustrates the more prevalent need types and compares Devon schools against the national picture.
Over the last five years there has been some change in the primary need of pupils with SEN. Moderate Learning Difficulty and Specific Learning Difficulty need types have seen increases in the last few years whilst the majority of the other types of need have either remained relatively stable or have seen a slight decline. However, in the last year Moderate Learning Difficulty has seen a decline whilst Speech, Language and Communication needs has risen. This may be due to better identification of need.

Children with Special Educational Needs Annual Report 2016/17
7
When reviewed at school type, the most common category of need in primary schools is Speech, Language and Communication (27.1%) closely followed by Social, Emotional and Mental Health (22.9%). The picture varies at secondary schools, where the most common need is Specific Learning Difficulty (28.8%) followed by Social, Emotional and Mental Health (22.5%). As can be seen from the chart overleaf, Social, Emotional and Mental Health is prevalent across all three school types. In special schools the most common categories of need are Severe Learning Difficulty (27.7%) and Autistic Spectrum Disorder (25.2%) which reflects the specialisms of the schools.

Children with Special Educational Needs Annual Report 2016/17
8
Attainment Gap across all Key Stages The 2016/17 outcomes of pupils attending Devon schools with Special Educational Needs is based on information provided by National assessment criteria (KS1, KS2) and awarding bodies information (KS4). The pupils’ special educational needs status is based on the national pupil database which is informed by the school census returns. In Devon and nationally pupils with SEN generally achieve less well than their peers with no SEN. This is because children with complex and significant Special Educational Needs face greater difficulties than their peers with no SEN. Devon pupils for the most part achieve well compared to National comparators on attainment and progress.
Early Years Foundation Stage (EYFS) 2016/17
The percentage of pupils in Devon with an SEN Statement/EHCP achieving a good level of development at EYFS is higher than nationally. 6% of children with a Statement/EHCP achieved a good level of development in Devon compared to 4% nationally and regionally. Previous year’s data for Devon children with a Statement/EHCP is not available and therefore comparisons cannot be made. The percentage of children with SEN but without a statement achieving a good level of development has dropped slightly in the last year (27% compared to 30% previously). Devon is in line with both the national and regional picture (also 27%).

Children with Special Educational Needs Annual Report 2016/17
9
Year 1 Phonics 2016/17
Recently published information indicates that the percentage of pupils in Devon with an SEN Statement/EHCP who met the expected standard in Year 1 has dropped (13%) and is now below the national picture (18%) and statistical neighbours (16%). Whilst the number or pupils is small (67) meaning each child makes a 1.5% difference this is a concerning trend and so a new early excellence programme is being developed as part of our school improvement work to further improve practice in this phase.
Half of pupils in Devon with SEN Support continue to meet the expected standard in Year 1. Devon continues to perform better than both the national picture (47%) and its statistical neighbours (45%).
No information has been published on Year 2 Phonics.

Children with Special Educational Needs Annual Report 2016/17
10
Key Stage 1 2016/17
In 2016 pupils were assessed against the new more challenging national curriculum for the first time. Results are no longer reported as levels: interim frameworks for teacher assessment have been used to assess if a pupil has met the new, higher expected standard. Because of these assessment changes, figures for 2015/16 are not comparable to those for earlier years. The expectations for pupils at the end of key stage 1 have been raised.
The percentage of pupils with Statements/EHCPs in Devon meeting the expected standard in Writing has improved in the last year and has remained stable in Reading. Whilst Devon’s performance in Science and Mathematics has fallen, it remains above the national average in Science and is in line with national in Mathematics. Devon continues to perform better than nationally in Reading and Writing.
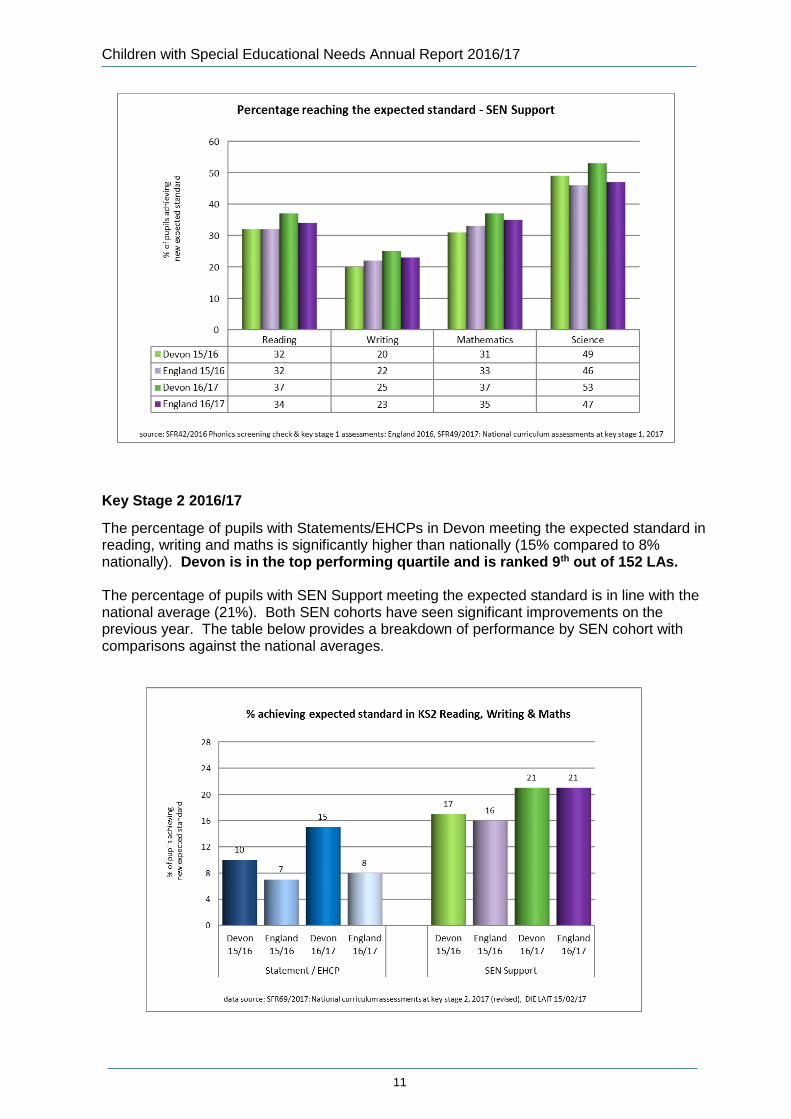
The percentage of pupils with SEN Support in Devon meeting the expected standard has improved across all subject areas in the last year. Mathematics has seen the greatest improvement (6 percentage points), followed by Reading and Writing. Devon is performing better than nationally across all subject areas and is performing significantly better in Science (53% compared to 47% nationally).
Children with Special Educational Needs Annual Report 2016/17
11
Key Stage 2 2016/17
The percentage of pupils with Statements/EHCPs in Devon meeting the expected standard in reading, writing and maths is significantly higher than nationally (15% compared to 8% nationally). Devon is in the top performing quartile and is ranked 9th out of 152 LAs. The percentage of pupils with SEN Support meeting the expected standard is in line with the national average (21%). Both SEN cohorts have seen significant improvements on the previous year. The table below provides a breakdown of performance by SEN cohort with comparisons against the national averages.

Children with Special Educational Needs Annual Report 2016/17
12
Performance in the individual subjects is also better than national. Pupils with Statements / EHCPs are performing significantly better than national averages, whilst pupils with SEN support are in line with national averages. The graphs below illustrate performance in each of the subjects.
Note: national rates are based on underlying data provided by the DfE in support of their Statistical First Release, to ensure consistency of datasets.
Children with Special Educational Needs Annual Report 2016/17
13
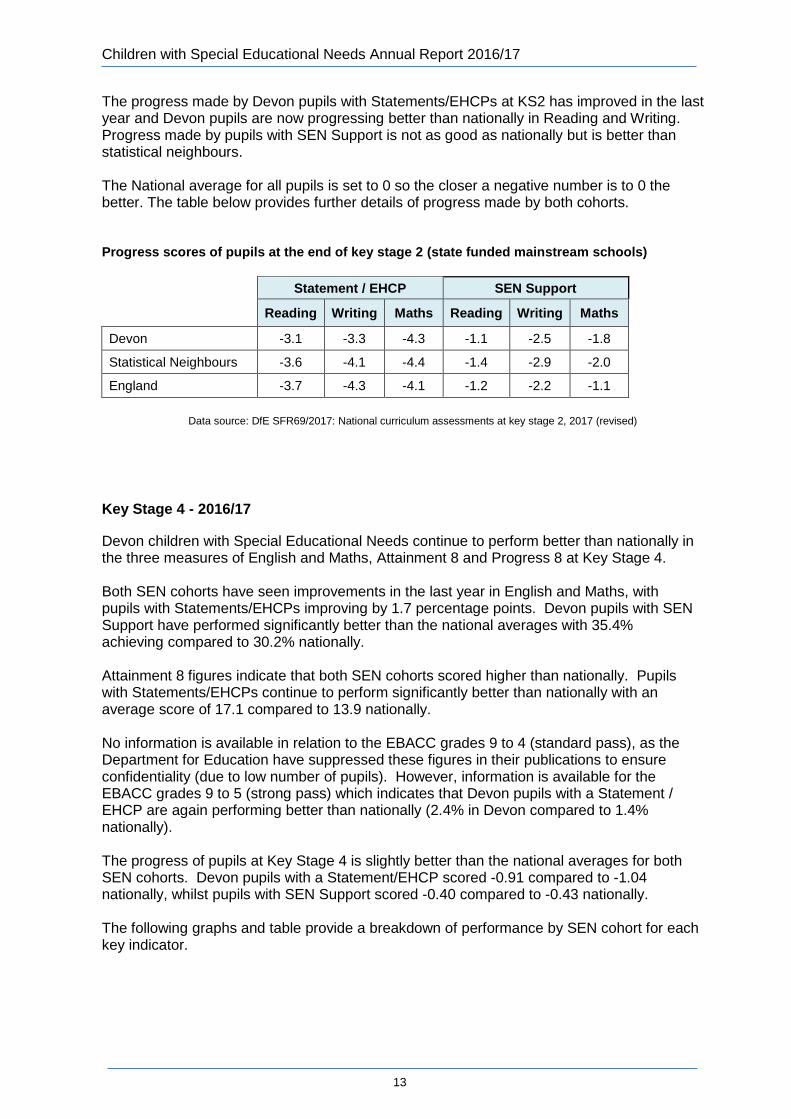
The progress made by Devon pupils with Statements/EHCPs at KS2 has improved in the last year and Devon pupils are now progressing better than nationally in Reading and Writing. Progress made by pupils with SEN Support is not as good as nationally but is better than statistical neighbours. The National average for all pupils is set to 0 so the closer a negative number is to 0 the better. The table below provides further details of progress made by both cohorts. Progress scores of pupils at the end of key stage 2 (state funded mainstream schools)
Statement / EHCP SEN Support
Reading Writing Maths Reading Writing Maths
Devon -3.1 -3.3 -4.3 -1.1 -2.5 -1.8
Statistical Neighbours -3.6 -4.1 -4.4 -1.4 -2.9 -2.0
England -3.7 -4.3 -4.1 -1.2 -2.2 -1.1
Data source: DfE SFR69/2017: National curriculum assessments at key stage 2, 2017 (revised)
Key Stage 4 - 2016/17
Devon children with Special Educational Needs continue to perform better than nationally in the three measures of English and Maths, Attainment 8 and Progress 8 at Key Stage 4. Both SEN cohorts have seen improvements in the last year in English and Maths, with pupils with Statements/EHCPs improving by 1.7 percentage points. Devon pupils with SEN Support have performed significantly better than the national averages with 35.4% achieving compared to 30.2% nationally. Attainment 8 figures indicate that both SEN cohorts scored higher than nationally. Pupils with Statements/EHCPs continue to perform significantly better than nationally with an average score of 17.1 compared to 13.9 nationally. No information is available in relation to the EBACC grades 9 to 4 (standard pass), as the Department for Education have suppressed these figures in their publications to ensure confidentiality (due to low number of pupils). However, information is available for the EBACC grades 9 to 5 (strong pass) which indicates that Devon pupils with a Statement / EHCP are again performing better than nationally (2.4% in Devon compared to 1.4% nationally). The progress of pupils at Key Stage 4 is slightly better than the national averages for both SEN cohorts. Devon pupils with a Statement/EHCP scored -0.91 compared to -1.04 nationally, whilst pupils with SEN Support scored -0.40 compared to -0.43 nationally. The following graphs and table provide a breakdown of performance by SEN cohort for each key indicator.

Children with Special Educational Needs Annual Report 2016/17
14
Note: the DfE have not published EBACC outcomes for Devon in order to protect pupil confidentiality due to low pupil cohort numbers.
Progress 8 score for SEN pupils
Statemented / EHCP SEN Support
Devon 16/17 -0.91 -0.40
England 16/17 -1.04 -0.43
Devon 15/16 -1.00 -0.35
England 15/16 -1.03 -0.38
data source: DfE SFR01/2018: revised GCSE and equivalent results in England 2016/17, DfE SFR03/2017
revised GCSE and equivalent results in England 2015/16
Children with Special Educational Needs Annual Report 2016/17
15
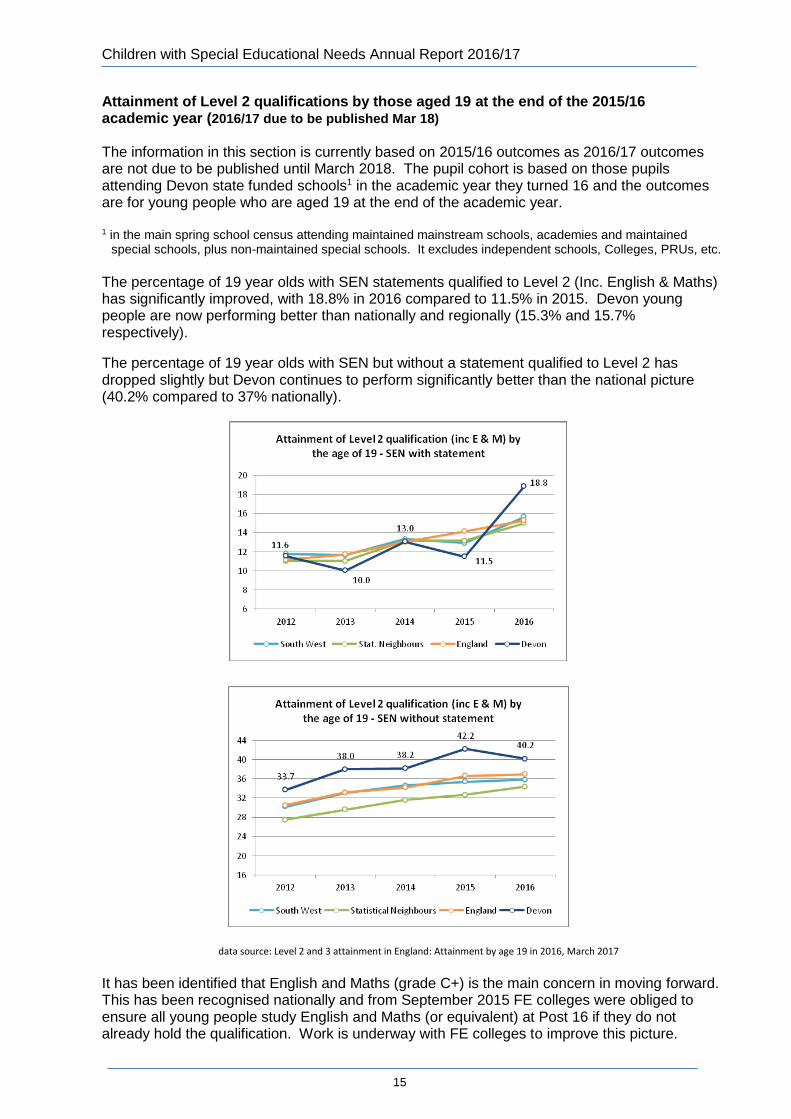
Attainment of Level 2 qualifications by those aged 19 at the end of the 2015/16 academic year (2016/17 due to be published Mar 18) The information in this section is currently based on 2015/16 outcomes as 2016/17 outcomes are not due to be published until March 2018. The pupil cohort is based on those pupils attending Devon state funded schools1 in the academic year they turned 16 and the outcomes are for young people who are aged 19 at the end of the academic year. 1 in the main spring school census attending maintained mainstream schools, academies and maintained
special schools, plus non-maintained special schools. It excludes independent schools, Colleges, PRUs, etc.
The percentage of 19 year olds with SEN statements qualified to Level 2 (Inc. English & Maths) has significantly improved, with 18.8% in 2016 compared to 11.5% in 2015. Devon young people are now performing better than nationally and regionally (15.3% and 15.7% respectively).
The percentage of 19 year olds with SEN but without a statement qualified to Level 2 has dropped slightly but Devon continues to perform significantly better than the national picture (40.2% compared to 37% nationally).
data source: Level 2 and 3 attainment in England: Attainment by age 19 in 2016, March 2017
It has been identified that English and Maths (grade C+) is the main concern in moving forward. This has been recognised nationally and from September 2015 FE colleges were obliged to ensure all young people study English and Maths (or equivalent) at Post 16 if they do not already hold the qualification. Work is underway with FE colleges to improve this picture.

Children with Special Educational Needs Annual Report 2016/17
16
Exclusions for Pupils with Special Educational Needs attending Devon Schools Exclusions information is collected via the school census (pupils attending Devon schools) for state-funded primary, secondary, special schools and pupil referral units. This covers LA maintained schools, academies, free schools and non-maintained special schools. It is not collected from independent and nursery schools. Whilst exclusions information relates to all exclusions across the full academic year, the pupil population used to inform exclusion rates is based on pupils on roll as at the January Census. The pupils’ SEN status is based on their status at the term of the exclusion, any missing characteristic is then based on the census term reporting the data (two terms after the exclusion term). Children with Special Educational Needs are more likely to be excluded than their non SEN peers. In 2015/16 nationally, pupils with identified Special Educational Needs (SEN) accounted for almost half of all permanent exclusions and fixed period exclusions1. Nearly 77% of children in schools for excluded pupils have recognised special educational needs or disability (SEND)2. Those with a recognised need are seven times more likely to be excluded than their peers without SEND2. 1 DfE SfR 35/2017 Permanent and fixed-period exclusions in England: 2015 to 2016. 2 CSN Policy Briefing ‘Alternative provision to social exclusions: IPPR – Making the Difference: Breaking
the link’, published 3 Nov 2017.
Permanent Exclusions 2016/17 in Devon Schools
The number of pupils with Special Educational Needs who have been permanently excluded has risen in the last year. This reflects the general increase in exclusions for all pupils. The percentage of pupils with Statements/EHCPs who have been permanently excluded has risen (0.55% compared to 0.43% previously). It should also be noted however that this is due partly to the number of children with an EHCP decreasing in 2016/17 rather than a large increase in exclusions. In fact, the percentage of excluded pupils who have an EHCP has reduced from 14.9% in 2015/16 to 10.34% in 2016/17. These figures may reduce when the Department for Education publish their national statistics, as they are currently only based on pupils in LA maintained schools and academies.
2014/15 2015/16 2016/17 DfE
2015/16 % SEN cohort
population
Permanent Exclusions against;
No's % of PEX
cohort
% of SEN
cohort pop’n
No's % of PEX
cohort
% of SEN
cohort pop’n
No's % of PEX
cohort
% of SEN
cohort pop’n
Children with Statements/EHCPs
8 12.7 0.24 13 14.9 0.43 15 10.34 0.55 0.17
Children with SEN Support 30 47.6 0.21 50 57.5 0.37 84 57.93 0.62 0.32
Children with No SEN 25 39.7 0.03 24 27.6 0.04 46 31.72 0.06 0.05
Data sources: 2016/17: ONE database, 2015/16 and earlier: DfE Statistical First Release SFR35/2017, Permanent and Fixed Period Exclusions from Schools in England: 2015 to 2016 academic year (Underlying Data: LA Characteristics), published July 2017

Children with Special Educational Needs Annual Report 2016/17
17
When reviewed at SEN cohort and NCY group level, permanent exclusions were highest in NCY3 for pupils with Statements / EHCPs and NCY8 and 9 for those with SEN Support. Permanent Exclusions were high in Key Stage 3 and 4 NCY groups for both SEN cohorts.
The most common reasons for the permanent exclusion of pupils with Statements/EHCPs in 2016/17 are persistent disruptive behaviour and physical assault against an adult. Whilst there is a significant increase in the percentage of exclusions due to assault against an adult the number of pupils involved is small (6 in 2016/17).
Data source: 2016/17: ONE database 21/08/17, 2015/16 and earlier: DfE School Census returns

Children with Special Educational Needs Annual Report 2016/17
18
The most common reason for the permanent exclusion of pupils with SEN Support is persistent disruptive behaviour. The next most common reasons are other, physical assault against an adult and verbal abuse against an adult.
Data source: 2016/17: ONE database 21/08/17, 2015/16 and earlier: DfE School Census returns Fixed Term Exclusions The number of fixed term exclusions against pupils with Statements/EHCPs continues to fall slightly, whilst the number of exclusions against pupils with SEN Support has remained relatively stable.
2014/15 2015/16 2016/17 DfE
2015/16 % of SEN
cohort pop'n
Fixed Term Exclusions against;
No's % of FTE
% of SEN
cohort pop'n
No's % of FTE
% of SEN
cohort pop'n
No's % of FTE
% of SEN
Cohort pop’n
Children with Statements/EHCPs
620 20.2 18.83 557 16.3 18.45 437 13.16 16.09 15.04
Children with SEN Support
1278 41.6 9.11 1515 44.2 11.33 1558 46.93 11.51 13.72
Children with No SEN 1174 38.2 1.51 1354 39.5 1.69 1325 39.91 1.63 2.67
data sources: 2016/17: ONE database, 2015/16 and earlier: DfE Statistical First Release SFR35/2017, Permanent and Fixed Period Exclusions from Schools in England: 2015 to 2016 academic year (Underlying Data: LA Characteristics), published July 2017
The percentage of pupils with Statements/EHCPs subject to a fixed term exclusion in 2015/16 has fallen (16.09% compared to 18.45% previously). The percentage of pupils with SEN Support subject to a fixed term exclusion has remained relatively stable (11.51% compared to 11.33% previously).

Children with Special Educational Needs Annual Report 2016/17
19
Data source: 2016/17: Education ONE database, 2015/16 and earlier: DfE Statistical First Release SFR35/2017
When reviewed at SEN cohort and NCY group level, fixed term exclusions were highest in Key Stage 3 and Key Stage 4 year groups for pupils with Statements / EHCPs and those with SEN Support. Fixed Term Exclusion rates were generally higher across Key Stage 3 and Key Stage 4 for both SEN cohorts.
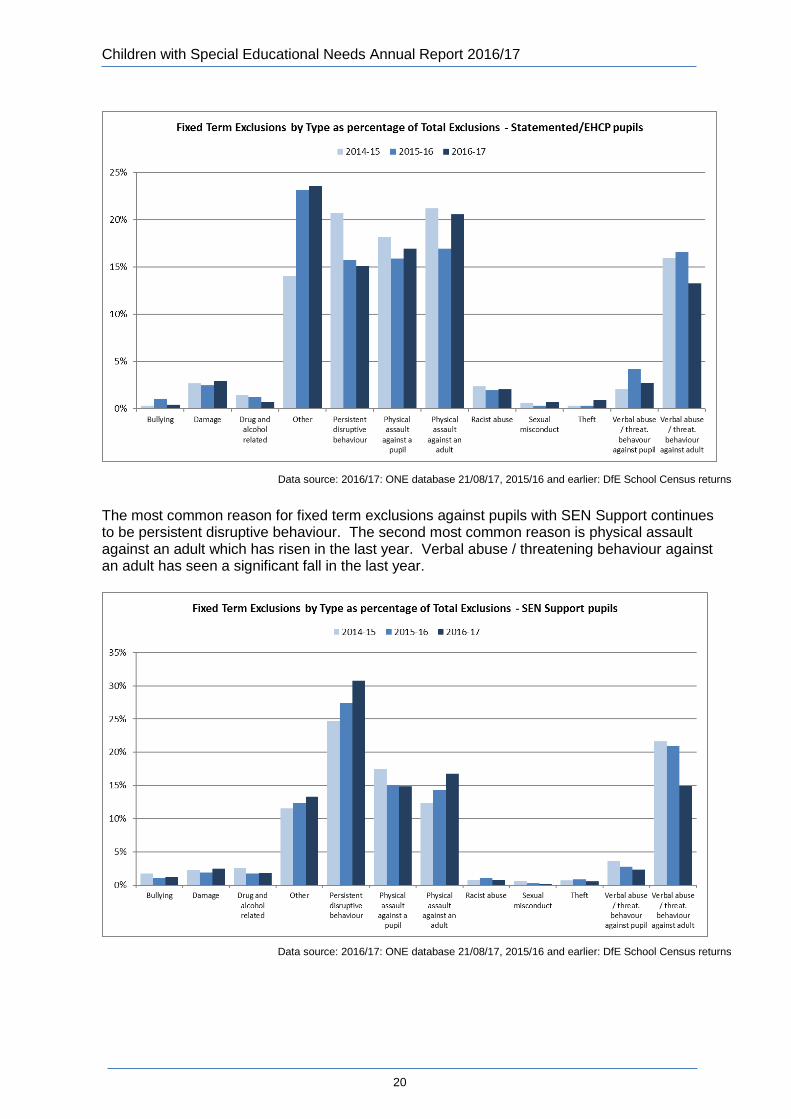
The most common reason for fixed term exclusions against pupils with Statements/EHCPs is Other (where reason does not fall within the available categories). Other common reasons for fixed term exclusions are physical assault against a pupil/adult, persistent disruptive behaviour and verbal abuse/threatening behaviour against an adult. Persistent disruptive behaviour has seen a slight fall in the last year whilst physical assaults against a pupil/adult have risen. The table below provides further details.
Children with Special Educational Needs Annual Report 2016/17
20
Data source: 2016/17: ONE database 21/08/17, 2015/16 and earlier: DfE School Census returns
The most common reason for fixed term exclusions against pupils with SEN Support continues to be persistent disruptive behaviour. The second most common reason is physical assault against an adult which has risen in the last year. Verbal abuse / threatening behaviour against an adult has seen a significant fall in the last year.
Data source: 2016/17: ONE database 21/08/17, 2015/16 and earlier: DfE School Census returns

Children with Special Educational Needs Annual Report 2016/17
21
Elective Home Education As can be seen from the table below the number of Elective Home Educated children with a Statement / EHCP has risen in the last year. However whilst the overall number of Elective Home Educated children has increased the percentage with a Statement / EHCP has remained stable at 3.5% (3.6% previously).
Academic Year
Number of EHE students with
statement
Number of registered EHE
students
% of students with Statements /
EHCPs
2016/17 44 1,275 3.5%
2015/16 37 1018 3.6%
2014/15 37 766 4.8%
2013/14 44 750 5.9%
2012/13 33 521 6.3%
2011/12 36 560 6.4%
Data Source: 2016/17 Elective Home Education Team, Babcock LDP Sept 17, Annual Report 2015/16, Babcock LDP
There are several reasons why children become home educated. 1.6% of students in 2016/17 cited “Problems with SEN Provision” as the reason for home education, an increase on the previous year (1.3%). In 2016/17, 7.1% were home educated due to medical reasons which is slightly higher than the previous year (6.9%). 3.9% of students cited “Emotional and Behavioural Difficulties” as their reason for home education which is also a significant increase on the previous year (1.6% in 2015/16). The SEN strategic review has included the increase in EHE and the reasons behind it as one of the areas that needs to be considered in further provision planning
Key Stage 4 (Year 11) Destination Information - 2015/16 data This section illustrates what young people with SEN move on to in the academic year after they complete key stage 4, and indicates whether they were in sustained education, employment or training for at least the first two terms. The pupil cohort is from state-funded mainstream schools only1. 1 academies, city technology colleges, community schools, voluntary aided schools, voluntary controlled schools, foundation schools, free schools, university technical colleges & studio schools, FE colleges with 14-16 provision.
Note: Independent mainstream schools have previously been included but the DfE advise that, due to ongoing concerns with data quality, they will no longer be publishing destination measures on independent schools at key stage 4. Independent special schools have always been excluded from the KS4 measures due to low matching of cohorts and awarding body data.
The latest available information is 2015/16 destinations for the 2014/15 Year 11 cohorts attending Devon schools or colleges. The SEN status is based on the pupils’ status as at year 11 as recorded in the January 2015 school census. Education destinations are based on information from colleges and FE providers, special post 16 institutions, state-funded schools, non-maintained special schools, alternative provision and higher education institutions.

Children with Special Educational Needs Annual Report 2016/17
22
The percentage of SEN pupils remaining in Education, Employment or Training at the age of 17 continues to rise in Devon. Devon is performing better than nationally (90% compared to 88% nationally) and is also performing better than regionally and its statistical neighbours.
When reviewing the percentage of pupils by SEN cohort there is little variation between the two cohorts. 92% of pupils with a Statement/EHCP remained in Education, Employment and Training compared to 90% of pupils with SEN (but not statemented). Devon is performing better than both the national and regional averages.
When comparing the SEN cohorts against their peers who have no SEN, fewer pupils with SEN remain in Education, Employment and Training in Devon and nationally. 91% of Devon pupils with SEN remained in Education or Employment in 2015/16 compared to 88% nationally. However, for pupils with no SEN this figure is 96%. A greater percentage of Devon pupils with SEN moved on to sustained employment and/or training than their non SEN counterparts (5% with SEN compared to 3% with no SEN). The chart overleaf provides a breakdown SEN and non SEN pupils’ destinations. Note: Sustained is defined as participation for the first two terms (October to March) 2015/16.

Children with Special Educational Needs Annual Report 2016/17
23
Data Source: SFR 56/2017 Destinations of KS4 and KS5 pupils: 2016 , SFR 01/2017: Destinations of Key Stage 4 and Key Stage 5 students in England 2014/15 (revised), SFR 05/2016: Key stage 4 destination measures 2013/14
As can be seen from the chart, the percentage of Devon SEN pupils in sustained education has improved and is now higher than nationally (86% compared to 83% nationally). The percentage of Devon SEN pupils moving on to employment destinations is in line with national averages (5%). The most common destination for Devon pupils with SEN continues to be Further Education (65% in 2015/16). This has seen a substantial rise in the last year and is higher than nationally (55%). School Sixth Form destinations have remained relatively stable (20%) and are line with national averages. Pupils with SEN, in Devon and nationally, are more likely to have a destination which is not sustained when compared to their peers with no SEN. 9% of Devon pupils with SEN did not have a sustained destination compared to 4% of Devon pupils with no SEN. The table overleaf provides a more detailed breakdown of destinations.

Children with Special Educational Needs Annual Report 2016/17
24
Table 5. Percentage of the KS4 cohorts going to, or remaining in, an education or employment destination
Special Educational Needs No Special Educational Needs
Devon England Devon England
13/14 14/15 15/16 13/14 14/15 15/16 13/14 14/15 15/16 13/14 14/15 15/16
Overall sustained education or employment /training destination
87 89 90 86 88 88 95 96 96 94 95 95
Apprenticeships 7 10 8 5 6 7 6 7 7 5 6 6
Any sustained education destination
85 83 86 82 84 83 93 94 93 92 92 92
Further education college or other FE provider, e.g. higher education institution with FE provision
64 61 65 54 54 55 54 55 58 34 34 35
School sixth form - state funded
20 21 20 22 22 20 36 37 33 43 43 42
Sixth form college x - - 7 7 7 2 2 1 14 14 14
Other education destinations, e.g. independent schools, alternative provision, special schools
x 1 - - 1 1 1 1 1 - 1 1
Sustained employment and/or training destination
3 6 5 3 5 5 1 2 3 2 3 3
Not Sustained, some participation between Aug and July but not sustained from Oct to Mar
12 10 9 13 11 10 5 3 4 5 4 4
Data Source: SFR 56/2017 Destinations of KS4 and KS5 pupils: 2016 , SFR 01/2017: Destinations of Key Stage 4 and Key Stage 5 students in England
2014/15 (revised), SFR 05/2016: Key stage 4 destination measures 2013/14
Key : x indicates DfE suppression due to low numbers. - indicates percentage is less than 0.5% but greater than 0%.
Note: ▪ To count as a ‘sustained’ destination, the young person has to be participating for ‘two terms’ or ‘six months’
the following academic year – the period considered is October to March. ▪ Individual lines may not add up to totals as a small number of pupils were identified in more than one
education destination

Children with Special Educational Needs Annual Report 2016/17 11 Jan 18
25
Quality of Provision
The graphs below show the percentage of children placed in each category of provision. The graphs on the left represent children attending Devon LA Maintained Schools and Academies (as this is sourced from Devon LA School Census). The graphs to the right represent children attending FE & Skills Colleges (Devon and other LAs), Independent establishments, including non-maintained special schools (Devon and other LAs) and non Devon LA Primary, Secondary and Special Schools (data sourced from DCC 0 to 25 SEN Team). Whilst there are overall more children in non Devon LA schools and other establishments Requiring Improvement, the importance of stability is recognised and so a young person is not automatically moved from a provider which becomes to Require Improvement. Any change in placement of a young person with an EHCP plan requires a review and parental agreement.
data source: Spring School Census 2017, Ofsted Outcomes at 31st Aug 2017 data source: SEN CSET report Jan 2017, Ofsted Outcome Reports - FE Colleges, Independents, Maintained Schools & Academies
The percentage breakdown in LA
Maintained Schools and Academies
remains similar to the previous year.
The percentage attending FE & Skills establishments
has increased (46% compared to 20%
previously), whilst the percentage attending
Independent establishments has fallen (29% compared to
42% previously).
The percentage attending good or outstanding
establishments (non Devon LA Maintained &
Academies) has increased (86% compared to 68%
previously).
This is due to the increased numbers attending FE and
Skills establishments.
The percentage attending good or
outstanding Devon LA Maintained Schools and
Academies has increased (91%
compared to 86% previously).

Children with Special Educational Needs Annual Report 2016/17 11 Jan 18
26
SEN Statements / EHCPs maintained by Devon – Part B This section of the report provides information for the SEN 0-25 service. The SEN 0-25 Service undertakes the statutory responsibilities of the Local Authority in assessment for and reviewing of Education Health and Care Plans. The data explained covers all children and young people with a statutory plan maintained by Devon including those placed out of Devon County. It does not include data for those in Devon schools who are maintained by other local authorities. The information is based on latest published national data taken from the statutory SEN2 data collection (annual Special Educational Needs survey). This is the Department for Education’s only source of data on all statements of SEN and EHCPs maintained by individual local authorities. The SEN2 return is not a pupil level return and therefore the Department for Education do not publish pupil cohort characteristics and outcomes as indicated in the earlier section of this report Total Statutory Plans managed by the Local Authority As of January 2018, the local authority managed a total of 4093 statutory plans (including both EHCPs and Statements) across the 0-25 age range. This is an increase of 10% from Jan 2017. Figures for previous years ae shown below Table 1. Number of pupils with a Statement/EHC Plan maintained by Devon LA
Jan 15 Jan 16 Jan 17
Pupils with Statement/EHCP maintained by Devon LA* 3,572 3,510 3,718
The majority of these plans are for children of compulsory school age, however following the extended responsibilities in the Code of Practice the numbers post 16 have significantly increased (by 55%) as plans are now maintained in the FE sector. The chart below shows how these plans are distributed across the age range and also provides information relating to the pupils primary SEN need. Table B1 Number of statutory plans maintained by Devon by primary need
Age at 31/8/17
ASD HI MLD
MSI PD PMLD SEMH SLCN SLD SpLD VI NIPN Total
Pre School 32 4 7
1 2 5 1 12 17 1 9 91
Primary 247 32 100
8 79 15 178 316 78 8 20 12 1093
Secondary 338 38 161
2 135 18 470 410 74 50 18 4 1718
16-19 217 25 122
1 94 9 285 171 63 45 13 4 1049
19+ 35 2 39
1 12 2 11 7 25 2 5 1 142
Total 869 101 429
13 322 49 945 916 257 106 56 30 4093
Data source: DCC SEN2 Data Return Jan 2018
* Note: includes non-maintained early years settings in the private and voluntary sector, mainstream schools (LA maintained schools,
academies, free schools, independent schools), special schools (LA maintained, academies, free schools, independent special schools, non-maintained special schools), hospital schools, alternative provision, pupil referral unit, post 16 institutions (general FE and tertiary colleges/HE, other FE, sixth form college, specialist post-16 institutions). Data source: DfE SFR22/2017 Statements of SEN and EHC plans: England 2017

Children with Special Educational Needs Annual Report 2016/17 11 Jan 18
27
The top three categories of need, making up two thirds of the cohort, are as follows.
• SEMH: Social, Emotional and Mental Health difficulties
• SLCN: Speech, Language and Communication needs
• ASD: Autistic Spectrum Disorder. These categories have remained the most prolific over the last four years, however ASD has seen the larger increase. There are 30 (less than 1%) young people for whom the data supplied is not sufficient to identify the primary need. Further assessment will be required for these young people. The Chart below shows the trend of over 4 years based on the primary need. Chart B2: Four-year breakdown of Primary Need of Statutory Plans
Data source: SEN2 Data Return Jan 2015, 2016, 2017and 20178
Statutory Plans issued in timescales within Calendar Year 2017 The statutory duty of the Local Authority is to complete first assessments within the 20-week timescale as directed by the Code of Practice. Currently this time scale is not being met for a significant number of pupils. This has been acknowledged as a significant concern and additional capacity has been funded from Devon County Council to address this issue. A larger SEN Team from April 2018 will begin to address this however, the backlog of cases under assessment means that there may be a delay in realising any impact.
-100
100
300
500
700
900
1100
ASD HI MLD MSI PD PMLD SEMH SLCN SLD SpLD VI Nodata
Nu
mb
er
of
Stu
de
nts
Primary Need
Total of EHCPs (Statements) Maintained by Devon LA by Primary Need
Jan-2015
Jan-2016
Jan-2017
Jan-2018

Children with Special Educational Needs Annual Report 2016/17 11 Jan 18
28
The chart below shows the most recent National information relating to the percentage of plans progressing to full assessment and which result in an EHCP plan being issued.
Local figures suggest that in 2017 the number plans being issued after full assessment reduced to 90.4%. This reflects a lowering of the 6-week threshold for assessment meaning more plans now proceed to full assessment. Not all of these additional assessments result in a EHCP being issued. SEN Placements Learners with statutory plans are mostly placed within mainstream schools and LA maintained special schools. This is in line with both the Code of Practice and the Devon SEND strategy which outlines the SEN funding priorities which are
• Ensure statutory provision is in place in mainstream schools
• Ensure there are sufficient special school places in Devon to meet demand
• Use of specialist independent providers only when the SEN of a child or young person requires that level of specific provision and it cannot be met in mainstream or special schools.
As of January 2018, the number of pupils with plans maintained in mainstream schools has again decreased, which causes pressure in both special school places and the High Needs Block due to increased use of the costlier independent sector. The SEND Code of Practice is clear in that Plans should not be ceased due to young person leaving education. The County Council have agreed with partners that we will work for two terms to try to reengage young people who do not engage with further education or training when leaving school; the data is collected at the end of the first term, so this will become a continuing annual statistic. It is the intention that close monitoring of this cohort will be incorporated into the monitoring of the work undertaken by Careers South West

Children with Special Educational Needs Annual Report 2016/17 11 Jan 18
29
The chart below shows the distribution of pupils between schools Chart B3: Three-year breakdown of SEN placements
Data source: SEN2 Data Return Jan 2016, 2017 and 2018
New placements following First Assessment In 2017 calendar year most new plans issued specified mainstream education. For the first time new plans were also issued in the FE Sector. The data below does not include those that have transferred from statements. A concern is the increase in first plans resulting on placement in the independent sector which is often either due to a lack of capacity or parental preference indicating a lack of confidence in the mainstream sector. Chart B4: Three-year breakdown of new SEN placements
0 500 1000 1500 2000
NEET - CSW
Education Elsewhere
Mainstream FE
Alternative (inc. Academies)
Independent
Special (inc. Academies)
Mainstream (inc. Academies)
SEN Units (inc. Academies)
Early Years
Statutory plans maintained by Devon by placement type
2015 Statutory Plans 2016 Statutory Plans 2017 Statutory Plans
0 50 100 150 200 250
NEET - CSW
Education Elsewhere
Mainstream FE
Alternative (inc. Academies)
Independent
Special (inc. Academies)
Mainstream (inc. Academies)
SEN Units
Early Years
New EHCPs issued by Placement TypeStatutory Plans issued 2015 Statutory Plans issued 2016 Statutory Plans issued 2017
Children with Special Educational Needs Annual Report 2016/17 11 Jan 18
30
Data source: SEN2 Data Return Jan 2016 and 2017
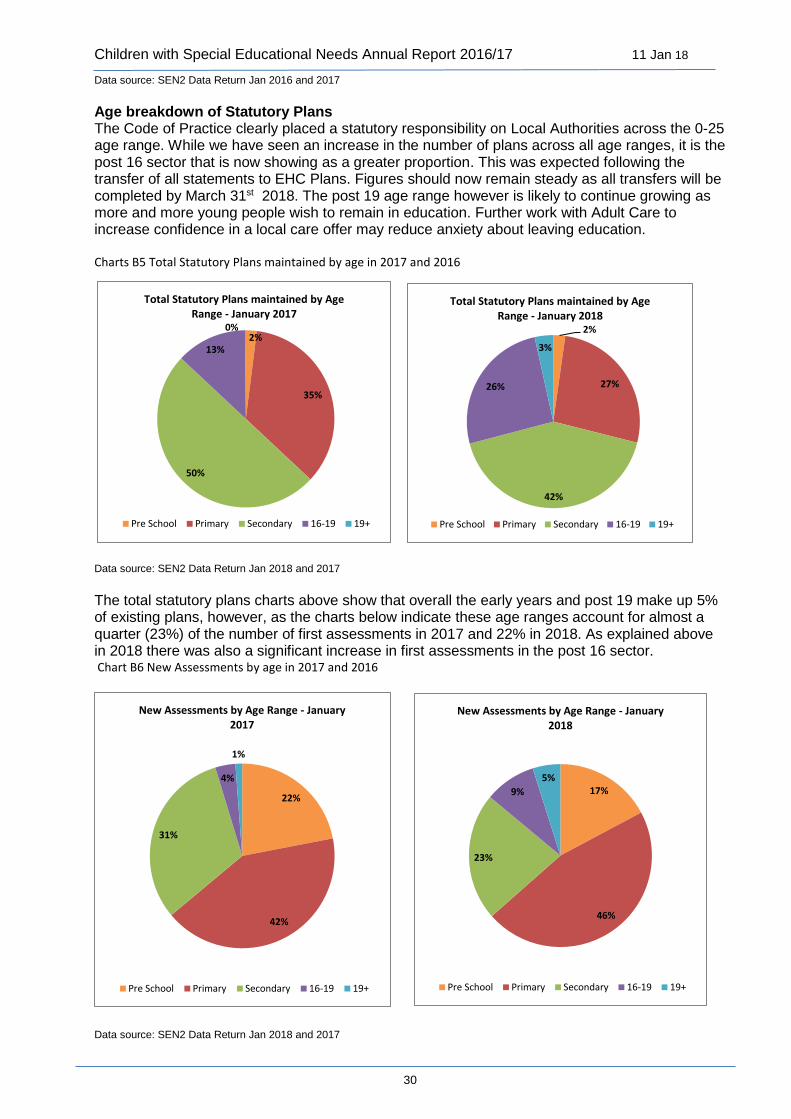
Age breakdown of Statutory Plans The Code of Practice clearly placed a statutory responsibility on Local Authorities across the 0-25 age range. While we have seen an increase in the number of plans across all age ranges, it is the post 16 sector that is now showing as a greater proportion. This was expected following the transfer of all statements to EHC Plans. Figures should now remain steady as all transfers will be completed by March 31st 2018. The post 19 age range however is likely to continue growing as more and more young people wish to remain in education. Further work with Adult Care to increase confidence in a local care offer may reduce anxiety about leaving education. Charts B5 Total Statutory Plans maintained by age in 2017 and 2016
Data source: SEN2 Data Return Jan 2018 and 2017
The total statutory plans charts above show that overall the early years and post 19 make up 5% of existing plans, however, as the charts below indicate these age ranges account for almost a quarter (23%) of the number of first assessments in 2017 and 22% in 2018. As explained above in 2018 there was also a significant increase in first assessments in the post 16 sector. Chart B6 New Assessments by age in 2017 and 2016
Data source: SEN2 Data Return Jan 2018 and 2017
2%
27%
42%
26%
3%
Total Statutory Plans maintained by Age Range - January 2018
Pre School Primary Secondary 16-19 19+
2%
35%
50%
13%
0%
Total Statutory Plans maintained by Age Range - January 2017
Pre School Primary Secondary 16-19 19+
22%
42%
31%
4%
1%
New Assessments by Age Range - January 2017
Pre School Primary Secondary 16-19 19+
17%
46%
23%
9%
5%
New Assessments by Age Range - January 2018
Pre School Primary Secondary 16-19 19+

Children with Special Educational Needs Annual Report 2016/17 11 Jan 18
31
Movement of children and young people with statutory plans from Mainstreams Sector by age There has been consistent movement over the last three years out of the mainstream sector. However, as the chart below shows, this number improved significantly in 2017 especially in the secondary sector. This may reflect an increased use of medical provision before specialist provision is considered and will therefore require further analysis. Chart B7: Four-year breakdown of movement from mainstream sector
Data source: SEN2 Data Return Jan 2015, 2016 and 2017
Cont.
0
10
20
30
40
50
60
70
80
90
Calendar Year 2014 Calendar Year 2015 Calendar Year 2016 Calendar Year 2017
Nu
mb
er
of
lear
ne
rs
Total movement of learners with statutory plans from Mainstream
Under age 5
Aged 5 to 10
Aged 11 to 15
Aged 16 to 19

Children with Special Educational Needs Annual Report 2016/17 11 Jan 18
32
Statements / EHCPs maintained by Devon - SEN Appeals
SEN Appeals can be registered against a number of different decisions made by a Local Authority. These include the refusal to assess a child with special educational needs, the refusal to issue a statement of SEN following that assessment or the contents of the statement once it has been finalised.
Whilst the rate of appeals registered has risen in Devon and nationally, Devon continues to be significantly lower than the national average and its statistical neighbours. As can be seen from the graph below the rise in the last year (including regionally and nationally) coincides with changes brought in under The Children and Families Act 20141. The Department for Education advise these increases should be treated with some caution.
1 The number of families who can appeal has increased as a result of the extension of EHC plans to those
aged 0-25 (with certain additional criteria attached to the upper age group) where previously statements of SEN covered only school aged children and those in the early years; the granting of appeal rights to young people themselves and those in custody; and because the transfer process from statements and LDAs to EHC plans has opened up new opportunities to appeal. (Tribunals and Gender Recognition Certificate Statistics Quarterly July to Sept 16-17).