development of soil microbial communities during tallgrass prairie restoration
TRANSCRIPT
lable at ScienceDirect
Soil Biology & Biochemistry 42 (2010) 302e312
Contents lists avai
Soil Biology & Biochemistry
journal homepage: www.elsevier .com/locate/soi lbio
Development of soil microbial communities during tallgrass prairie restoration
Kamlesh Jangid a,*, Mark A. Williams b, Alan J. Franzluebbers c, John M. Blair d,David C. Coleman e, William B. Whitman a
aDepartment of Microbiology, 1000 Cedar Street, 527 Biological Sciences, University of Georgia, Athens, GA 30602, USAbDepartment of Plant and Soil Sciences, 470 Dorman Hall, Mail Stop 9555, Mississippi State University, MS 39762, USAcUSDA-Agricultural Research Service, 1420 Experiment Station Road, Watkinsville, GA 30677, USAdDivision of Biology, 116 Ackert Hall, Kansas State University, Manhattan, KS 66506, USAeOdum School of Ecology, University of Georgia, Athens GA 30602, USA
a r t i c l e i n f o
Article history:Received 25 June 2009Received in revised form28 September 2009Accepted 5 November 2009Available online 20 November 2009
Keywords:16S rRNAPLFABacterial communityRestorationCroplandPrairie
* Corresponding author. Tel.: þ1 706 542 4692; faxE-mail addresses: [email protected], jangidk@gma
0038-0717/$ e see front matter � 2009 Elsevier Ltd.doi:10.1016/j.soilbio.2009.11.008
a b s t r a c t
Soilmicrobial communitieswere examined in a chronosequence of fourdifferent land-use treatments at theKonza Prairie Biological Station, Kansas. The time series comprised a conventionally tilled cropland (CTC)developed on former prairie soils, two restored grasslands thatwere initiated on former agricultural soils in1998 (RG98) and 1978 (RG78), and an annually burned native tallgrass prairie (BNP), all on similar soil types.In addition, an unburned native tallgrass prairie (UNP) and another grassland restored in 2000 (RG00) ona different soil type were studied to examine the effect of long-term fire exclusion vs. annual burning innative prairie and the influence of soil type on soil microbial communities in restored grasslands. Both 16SrRNA gene clone libraries and phospholipid fatty acid analyses indicated that the structure and compositionof bacterial communities in the CTC soil were significantly different from those in prairie soils. Within thetime series, soil physicochemical characteristics changedmonotonically. However, changes in themicrobialcommunities were not monotonic, and a transitional bacterial community formed during restorationthat differed from communities in either the highly disturbed cropland or the undisturbed original prairie.The microbial communities of RG98 and RG00 grasslands were also significantly different even thoughtheywere restored at approximately the same time andweremanaged similarly; a result attributable to thedifferences in soil type and associated soil chemistry such as pH and Ca. Burning and seasonal effects on soilmicrobial communities were small. Similarly, changing plot size from300m2 to 150m2 in area caused smalldifferences in the estimates of microbial community structure. In conclusion, microbial community struc-ture and biochemical properties of soil from the tallgrass prairie were strongly impacted by cultivation, andthe microbial community was not fully restored even after 30 years.
� 2009 Elsevier Ltd. All rights reserved.
1. Introduction
Extensive agriculture since the 1830s in North America has led to82e99% decline of the highly productive, floristically diverse andformerly extensive tallgrass prairie ecosystem (Samson and Knopf,1994). In addition, historically important disturbances, such as peri-odic fires and grazing, have further contributed to changes in thesoil microenvironment of remaining prairies (Knapp et al., 1998). Soilmicrobial communities respond to such changes in the soil microcli-mate (Killham, 1994), and compositional and evolutionary changescan lead to specialized communities adapted to such environmentalchanges. While land-use change often alters plant species andassociated soil properties, the responsible factors that shape the
: þ1 706 542 2674.il.com (K. Jangid).
All rights reserved.
underlying microbial communities are less well known, butnumerous. Changes in soil water content (Bossio and Scow,1998), pH(Fierer and Jackson, 2006), soil type and field properties (Wu et al.,2008), plant diversity and composition (Carney and Matson, 2006)have all been shown to influence the composition of soil microbialcommunities. Similarly, periodic fires in grasslands can cause largeN losses due to combustion of plant tissue and associated volatiliza-tion of N (Blair et al., 1998), resulting in reduced soil N availability andenhanced N limitation of plant productivity (Ojima et al., 1994; Fynnet al., 2003). In addition, fire frequency significantly alters root growthdynamics, root biomass, and root nutrient content with frequentlyburned tallgrass prairie having greater root biomass (Kitchenet al., 2009).
Grassland restoration has become of interest to restore nativeplant communities and associated wildlife habitat, preserve the soilecosystem and promote sustainable agriculture (Samson andKnopf,1994). Due to bacteriaeroot association and bacteria-clay particle
K. Jangid et al. / Soil Biology & Biochemistry 42 (2010) 302e312 303
adsorption, grassland pastures have been described as resilientsoils, although cultivation results in well-documented losses oforganic matter and loss of soil structure (Haas et al., 1957; Mann,1986). The establishment of grasslands on previously cultivatedsoils can result in recovery of some key soil properties (Baer et al.,2002) and might act positively on soil microbial communities. Ourrecent analysis of soilmicrobial communities in cropland, forest andpastures in Georgia found higher bacterial diversity in pastures ascompared to both highly disturbed croplands and less disturbedforest (Jangid et al., 2008). Unlike communities ofmacro-organisms,microbial communities did not respond linearly to the intensityof habitat intervention. In addition, microbial communities do notexhibit a clear linear transition in the conversion from conventionalto conservation tillage in cotton fields (Simmons and Coleman,2008). Altogether these results led to the hypothesis that thecomposition and structure of the microbial community of restoredgrasslands would become more like those in the native prairie soilsas the soil environment matures.
Whereas some research has been conducted on the responsesof soil microbial communities under grassland restoration, thesestudies have relied upon techniques that have limitations for an indepth analysis, such as DNA fingerprinting (Griffiths et al., 2003;Plassart et al., 2008) or fatty acid profiling (Hedlund, 2002; Hammanet al., 2007;Mubyana-John et al., 2007). The present study combined16S rRNA gene libraries and phospholipid fatty acid (PLFA) analysesto determine the specific soil microbial responses during this resto-ration. In addition, the effect of soil type and burning on microbialcommunities was also investigated in these grasslands.
2. Materials and methods
2.1. Sampling site
Field sites were located at the Long-Term Ecological Researchsite at the Konza Prairie Biological Station (KPBS) near Manhattan,Kansas, USA (39�050N and 96�350W). The KPBS encompasses3487ha in the Flint Hills, a region that includes the largest remainingtracts of native tallgrass prairie in North America. Native prairieplant communities at KPBS (w90% of the vegetation) are dominatedby warm-season C4 grasses, including big bluestem (Andropogongerardii), Indian grass (Sorghastrum nutans), switchgrass (Panicumvirgatum) and little bluestem (Andropogon scoparius). The climate iscontinental and characterized by warm, wet summers and dry,cold winters. Mean annual precipitation is 830 mm per year. Meanmonthly air temperature varies from�3 �C in January to 27 �C in July.Mean monthly soil temperature (5 cm depth) varies from 1.6 �C inJanuary to 29.3 �C in July.
Six land-use treatments including a chronosequence of restoredgrasslands were examined. The chronosequence compriseda conventionally tilled cropland (CTC) developed on former prairiesoils, two restored grasslands on former agricultural soils thatwere restored in 1998 (RG98) and1978 (RG78), and an annually burnednative tallgrass prairie (BNP). In addition, a grassland with a differentsoil type and restored in 2000 (RG00) andanunburnednative tallgrassprairie (UNP) on the same soil type as BNPwere also studied. The BNPand UNP treatments were part of the Belowground Plot Experiment,a long-term experiment initiated at KPBS in 1986 to determine thelong-term influences of different land management practices andnutrient manipulations on above- and belowground communitiesand processes (Rice et al., 1998). The CTC fields were cultivated for>50 yearswith soybean (Glycinemax), wheat (Triticumaestivum), andgrain sorghum (Sorghum bicolor). The native prairie sites (BNP andUNP) were never plowed and were not grazed for ca. 30 years. Fireswere historically common in these grasslands, and spring burning isa prevalent contemporary management practice (Knapp et al., 1998).
The BNP and three restored grassland sites were burned in the springevery 1e2 years. Field treatments and fertilizer rates for a particularcrop were similar for CTC and the three grasslands before restorationand were described previously (Rice et al., 1998). Native prairie siteswere not fertilized, and the three restored grassland sites did notreceive fertilizer inputs since restorations began.
All sites within the primary chronosequence were in close prox-imity and on comparable soils. Soil was a gently sloping (0e1%)Reading silt loam (mesic Typic Argiudoll) formed by colluvial andalluvial deposits (Ransom et al., 1998). One of the restored plots(RG00) was located on a Tully silty clay loam (Pachic Argiustoll).Organicmatter, clay contents and pH in these limestone derived soilstended to be greater than Reading soils. Mean size of the treatmentareas was 3.5 ha or greater. The experimental design was a random-ized complete block with three replicate plots for each treatment.Plot size for CTC, RG00, RG98, RG78 and BNP was 300 m2, but was150 m2 for UNP. Because sampling area size could influence thenumber of taxa sampled (Woodcock et al., 2006) and to have a perfectcomparison between the unburned and burned native prairie plots,burned plots were also sampled from three 150m2 plots fromwithinthe three 300 m2 plots. For clarification, these plots were referred toas UNP150 and BNP150.
2.2. Sample collection
Soil samples were collected in summer (24 July 2006) and inwinter (5 March 2007). The two sampling dates allowed a limitedseasonal comparison. For each plot,five coreswith a diameter of 5 cmwere collected from a depth of 1e10 cm with a metallic corer andcombined in 1.6 l Whirlpak� bags. The other sampling details weresimilar to those described earlier (Jangid et al., 2008).
2.3. Physicochemical analysis of soils
Physicochemical analysis was performed only on the summersamples. A portion of soilwas air dried overnight and passed througha 2 mm sieve. pH measurements were carried out after 20 minequilibrations on a 1:4 soil:water dilution. Electrical conductivitywasdetermined on a 1:4 soil:water mixture following equilibration for1 h and filtering through Whatman 42 filter paper. For soil texturalclassification, because of the high organic matter content, 5 g of soilwas treated with 30% H2O2 for about 3 days, followed by dryingat 60 �C in a forced air oven. The dried samples were then used todetermine the sand, silt and clay content using the micro-pipettemethod (Miller and Miller, 1987). Extractable nutrients, C minerali-zation, soil microbial biomass C, potential N mineralization, partic-ulate organic C and N were determined as described earlier (Jangidet al., 2008) except that 30-g subsamples were packed to a density of1 Mg m�3 during incubations.
The correlations between soil physicochemical properties andthe age of grassland restoration were carried out using the CORRprocedure in SAS� software v9.1, and the r2 values were obtainedfrom linear regression analysis. For correlations, the time betweensampling and establishment of grasslands was considered to be0 year for CTC, 8 years for RG98, 28 years for RG78 and 75 years forBNP. Earlier studies by Baer et al. (2002) and McLauchlan et al.(2006) suggested that the recovery of some key soil parameters,such as soil C storage could occurwithin 50e75 years of restoration.Hence, 75 years for BNP was a conservative timeline.
2.4. Phospholipid fatty acid analysis of soil communities
Phospholipid fatty acids (PLFAs) were analyzed to infer relat-edness of microbial communities, microbial biomass and the rela-tive ratio of fungal to bacterial biomass. Microbial lipids were

K. Jangid et al. / Soil Biology & Biochemistry 42 (2010) 302e312304
extracted from 15 g wet weight of soil by the modified one-phaseBligh and Dyer method (White et al., 1996). Phospholipids werepurified and methylated to fatty acid methyl esters for analysis asdescribed previously (Butler et al., 2003). Mol % of dominant fattyacids was used for non-metric multidimensional scaling (NMS)analysis, a non-parametric method for graphical ordination ofexperimental data (Williams et al., 2006).
2.5. DNA extraction and preparation of 16S rRNA genelibraries, sequencing and editing
For each soil sample, DNA was extracted from 5 g of soil usingthe PowerMax� Soil DNA isolation kit (MoBio Laboratories Inc.).The extracted DNA was concentrated by precipitation as per theinstructions provided in the kit and then dissolved in 400 ml ofnuclease-free water. The concentration of extracted DNA wasdetermined by gel electrophoresis with appropriate standards. Thebacterial 16S rRNA genes were amplified in a 15-cycle PCR. Each25 ml PCR reaction contained 20e50 ng of DNA, 10 pmol each of 27F(50-AGA GTT TGA TCM TGG CTC AG-30) and 1492R (50-GGT TACCTT GTT ACG ACT T-30) primers, and a single PuReTaq� Ready-To-Go� PCR bead (Amersham Biosciences). PCR conditions, cloningand transformation, library preparation and screening followed theprocedures as described earlier (Jangid et al., 2008).
2.6. Sequencing and editing
Sequencing was performed at the Sequencing and SynthesisFacility at the University of Georgia. Partial sequencing of the 16SrRNA gene clones was done using the primer 27F, whereas completesequencing for selected cloneswas performed using the primer 1492Ras well. Sequence chromatogram files were viewed for quality inSequence Scanner v1 (AppliedBiosystems Inc.) andmanuallyedited toinsure quality using CodonCode Aligner v1.6.3 (CodonCode Corpora-tion). Sequences that were less than 400 base pairs were not analyzedfurther. All sequences were checked for artificial chimeras usingMallard v1.02 (Ashelford et al., 2006) and Pintail v1.1 (Ashelford et al.,2005). Sequence alignments were carried out using the GreengenesNAST aligner (DeSantis et al., 2006), while alignment format conver-sions were carried out using GenDoc v2.7 (http://www.nrbsc.org/downloads/). The sequences were submitted to GenBank with acces-sion numbers EU296931eEU300636 (Supplementary Table S1).
2.7. Taxonomic assignment and phylogenetic analysis
Taxonomic assignment of sequences was made on 21 November2007 using the RDP taxonomic nomenclature in GreengenesClassifier (DeSantis et al., 2006). The program first compares each ofthe submitted sequences to the in-house prokaryotic multiplesequence alignment to find near-neighbors using Simrank and thencalculates the sequence divergence from near-neighbors usingthe Lane mask (Lane, 1991) and DNAML option of DNADIST in thePHYLIP package (Felsenstein, 2004).
2.8. Library comparisons, diversity estimatesand statistical analyses
The differences in phylogenetic composition of libraries weredetermined using distance matrices and LIBSHUFF comparisons(Singleton et al., 2001), carried out according to Jangid et al. (2008).Diversity measurements such as, Shannon diversity index (H),Chao1 estimate, and the reciprocal of Simpson's index (1/D) wereused to compare the clone libraries independent of their phyloge-netic composition. The number of operational taxonomic units(OTUs) was determined at an evolutionary distance (D) of 0.03
using the average neighbor algorithm in DOTUR (Schloss andHandelsman, 2005).
The relative abundance of each OTU in a treatment was calcu-lated and used for NMS analysis. Because the differences betweenseasons were relatively small compared to treatment differences,the two seasonal measurements were averaged. Biplots and vectorswere also calculated to assess the relationship between each ordi-nation axis to that of each OTU and environmental variable. Becausewe were interested in the relationships of the environmentalvariables to the NMS ordination of the OTUs and treatments, envi-ronmental variables were not relativized before analysis by NMS.“Indicator species” analysis and correlations with the main matrixwere also presentedwhen appropriate to facilitate the identificationof variables that were important descriptors of the differencesbetween the seven main treatments (McCune and Grace, 2002).These analyses were carried out using PC-ORD v4 (MJM Software).
A hierarchy of log-linearmodels was used to examine differencesin the taxonomic composition among rRNA gene libraries. Fordetermining the association between each taxonomic group and theyear of grassland restoration, the sites CTC (most recent cropland),RG98, RG78, and BNP (native prairie-never cropland), were studiedusing a hierarchy of 5 log-linear models aimed at explaining theoccurrence as a function of year of restoration and season, that wererun separately using the GENMOD procedure in SAS� software. Theresponse variable, i.e., separate counts for each taxon from replicatelibraries, was assumed to approximate a Poisson distribution. Thenull model for each taxon assumed that the distribution of all clonesacross all experimental conditions was the same, subject to statis-tical variability. A general model for the analysis was:
ln�lij� ¼ mþ ai þ bj þ dij
where, ai and bj represented the ith and jth level of year of restora-tion and season variables, respectively, and dij indicated an interac-tion term. The l term on the left-hand side of themodel representedthe true mean number of counts of a taxon under conditions (i,j) onthe natural log scale. Parameter estimates for the intercept (m), threelevels of year of restoration, and one level of seasonwere calculatedwith thewinter sampling of BNP set as the baseline.Model selection,and calculation and correction for overdispersionwere carried out asdescribed earlier (Jangid et al., 2008).
3. Results
3.1. Description of the 16S rRNA data set
Libraries of 16S rRNA genes were prepared from DNA extractedfrom triplicate soil samples collected in winter and summer. Ofthe 96 clones sequenced for each library, between 72 and 95 clonesyielded good quality sequences. From a total of 3752 clonesequences, 22 sequences were from the cloning vector, three moresequences were of non-16S rRNA origin, and 21 sequences wereconfirmed chimeras. Hence, a total of 3706 sequences (w88 perlibrary) were used for further analyses. For most of the replicates, nosignificant differences were detected by LIBSHUFF analysis, indi-cating that the experimental strategy used for sampling, extractingDNA and preparing clone libraries was reproducible. However,winter replicate 1 and 3 from both the BNP and RG98 plots andsummer replicate 2 and 3 from RG98 plots differed from each other.Similarly, summer replicate 1 from RG78 plots differed from bothreplicates 2 and 3. These results suggested that small differencesexisted between the bacterial communities in some of the plots.Because the effect of seasons was relatively small, libraries werepooled in some analyses to investigate the broader impact of landmanagement regimes.

K. Jangid et al. / Soil Biology & Biochemistry 42 (2010) 302e312 305
3.2. Physicochemical changes in soil properties duringgrassland restoration
The soil physicochemical characteristics changed monotonicallywith age of restoration, suggesting that CTC, RG98, RG78 andBNP indeed represented a chronosequence (Fig. 1, Table 1, andSupplementary Table S2). Within the chronosequence, the differentmeasures of C content showed a consistent increase with age ofrestoration and high r2 value (in parentheses) by linear regression:total C (0.96), three-day CO2eC (0.87), mineralizable C (0.69), andparticulate organic C (0.89). For N content, there was an increase intotal,mineralizable andparticulate organic Nwith age of restoration,while inorganic N concentrations remained the same. The r2 valuesfor these measures were: total N (0.98), mineralizable N (0.83),particulate organic N (0.99), and inorganic N (0.07). However, usingthe best fitting regression model in SAS�, the inorganic N decreased(r2 ¼ 0.50). In contrast, soil texture did not differ within the chro-nosequence (Supplementary Table S3). Strong correlations between
Fig. 1. Response of soil biochemical properties to grassland restoration. Time betweensampling and establishment of grasslands was 0 years for conventionally tilled crop-land (CTC), 8 years for restored grassland in 1998 (RG98), 28 years for restored grass-land in 1978 (RG78), and 75 years for burned native prairie (BNP).
grassland age and the various soil C and N fractions confirmed thatthese soils represented an authentic restoration chronosequence.
3.3. Microbial changes during grassland restoration
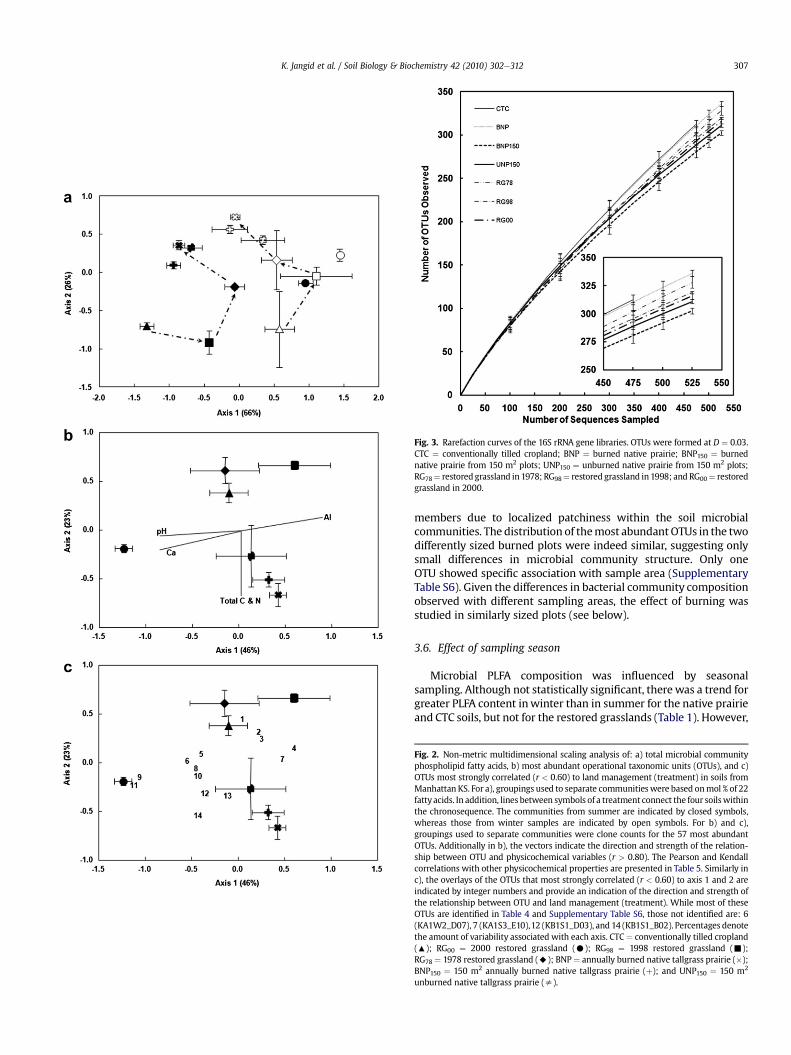
The microbial communities in all of the chronosequence soilswere significantly different from each other, and variedwith season.The total microbial PLFAs and soil microbial biomass C increasedconsistentlywith the age of restoration (Table 1 and Fig.1). However,bacterial and fungal PLFAs increased at different rates, resulting invarying ratios (Table 1).While bacterial PLFAs increased consistentlywith restoration age in both seasons, fungal PLFAs increased onlyin winter (data not shown). During summer, the amount of fungalspecific-PLFAs was highest in RG78 soils. The composition of micro-bial PLFAs also changed within the chronosequence soils (Fig. 2a).Axis 1 in the NMS analysis was strongly and negatively correlated toPLFA biomarkers for Gram-positive bacteria, suggesting a reductionin abundance in winter compared to summer.
Althoughmicrobial biomass increased, bacterial diversity did notchange significantly in the chronosequence. The different measuresof bacterial diversity, such as the reciprocal of the Simpson's index,Shannon index and the Chao1 estimate, were similar among allsites (Supplementary Table S4). Likewise, the rarefaction curvesoverlapped for these soils (Fig. 3). In addition, these curves failed toplateau for any of the treatments, indicating that the diversity wasnot fully sampled. Our results agree with those from a turfgrasschronosequence (Yao et al., 2006) and restored grasslands in France(Plassart et al., 2008), where despite differences in the land use andage, the microbial biodiversity was generally similar.
Similarly, the relative abundances of most bacterial phyla didnot differ significantly within the chronosequence. Of the thirteenbacterial taxa examined, abundances of only two taxa changedsignificantly with restoration age (Table 2). The most likely modelwithin the hierarchy of potential log-linear models indicateda significant increase in the abundance of Verrucomicrobia anda decrease in b-Proteobacteria in the BNP as compared to the CTC,RG98 and RG78 (Supplementary Table S5). These two taxa accountedfor 14% of all clones in the restoration chronosequence.
In contrast, LIBSHUFF analysis indicated significant differencesin the composition of bacterial communities within the chronose-quence. Group-specific LIBSHUFF identified those phylogenetic taxathat differed between these soils. Thus, while the relative abundanceof Acidobacteria was similar within the chronosequence soils, itscomposition differed significantly among all soils (Table 3). Other taxawhose compositions changed significantly included the Bacteroidetes,the b-Proteobacteria, and the Verrucomicrobia. Because, the sensitivityof LIBSHUFF is greatly affected by sample size (Whitman, personalobservation), it is also possible that differences in the smaller taxawere not detected because of size.
The distributions of abundant OTUs further illustrated changes incommunity structure upon restoration. Among the 57most abundantOTUs (N � 10), which represented w35% of the total clones, threepatterns were observed (Table 4). First, some OTUs, such as the twomost abundant OTUs represented by the GASP (Georgia Survey ofProkaryotes) clones KA1S1_G02 (N ¼ 166) and KA1S1_E10 (N ¼ 71),were detected throughout the chronosequence. However, abundanceof the former OTU decreased with restoration age whereas that ofthe latter did not change greatly. In the second pattern, some OTUspredominated at the endpoints (CTC or BNP) of the chronosequence(Supplementary Table S6). For instance, two OTUs represented byclonesKA1S3_B12andKB1S1_C08were abundant in theBNP soils, butwere either much less abundant or completely absent in the restoredgrasslands (RG98 þ RG78) and CTC soils. In the last pattern, someOTUs either increased or decreased in restored grasslands relative toeither endpoint. For instance, the three OTUs represented by clones
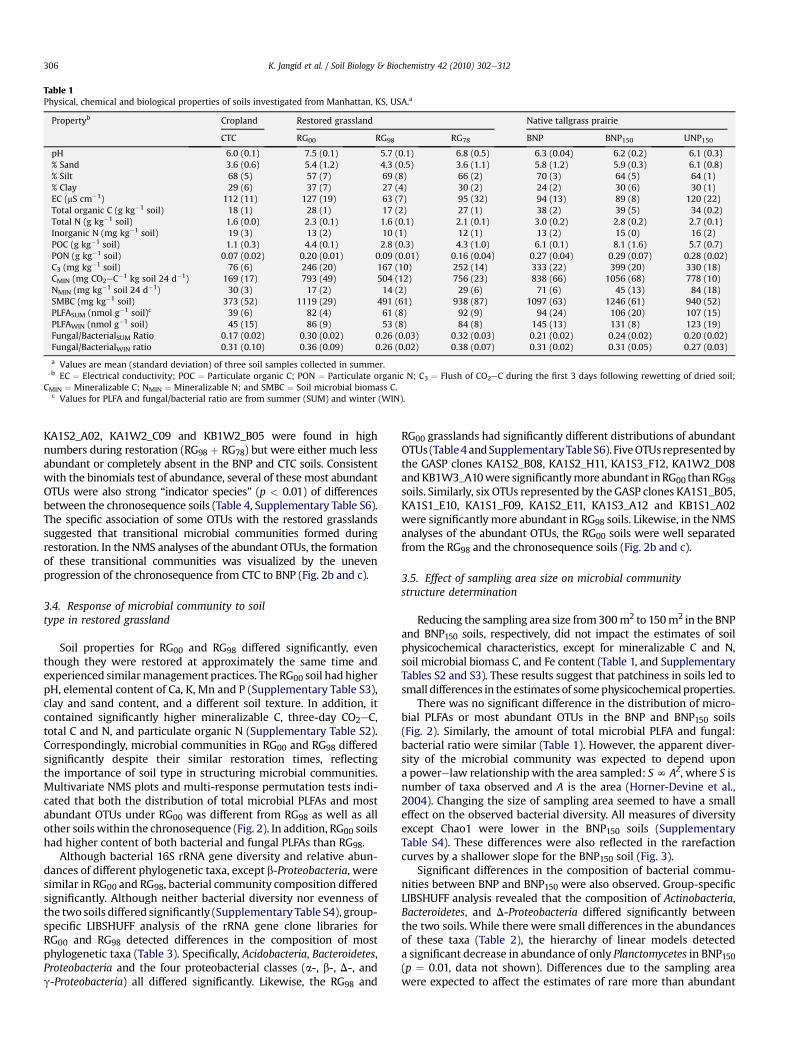
Table 1Physical, chemical and biological properties of soils investigated from Manhattan, KS, USA.a
Propertyb Cropland Restored grassland Native tallgrass prairie
CTC RG00 RG98 RG78 BNP BNP150 UNP150
pH 6.0 (0.1) 7.5 (0.1) 5.7 (0.1) 6.8 (0.5) 6.3 (0.04) 6.2 (0.2) 6.1 (0.3)% Sand 3.6 (0.6) 5.4 (1.2) 4.3 (0.5) 3.6 (1.1) 5.8 (1.2) 5.9 (0.3) 6.1 (0.8)% Silt 68 (5) 57 (7) 69 (8) 66 (2) 70 (3) 64 (5) 64 (1)% Clay 29 (6) 37 (7) 27 (4) 30 (2) 24 (2) 30 (6) 30 (1)EC (mS cm�1) 112 (11) 127 (19) 63 (7) 95 (32) 94 (13) 89 (8) 120 (22)Total organic C (g kg�1 soil) 18 (1) 28 (1) 17 (2) 27 (1) 38 (2) 39 (5) 34 (0.2)Total N (g kg�1 soil) 1.6 (0.0) 2.3 (0.1) 1.6 (0.1) 2.1 (0.1) 3.0 (0.2) 2.8 (0.2) 2.7 (0.1)Inorganic N (mg kg�1 soil) 19 (3) 13 (2) 10 (1) 12 (1) 13 (2) 15 (0) 16 (2)POC (g kg�1 soil) 1.1 (0.3) 4.4 (0.1) 2.8 (0.3) 4.3 (1.0) 6.1 (0.1) 8.1 (1.6) 5.7 (0.7)PON (g kg�1 soil) 0.07 (0.02) 0.20 (0.01) 0.09 (0.01) 0.16 (0.04) 0.27 (0.04) 0.29 (0.07) 0.28 (0.02)C3 (mg kg�1 soil) 76 (6) 246 (20) 167 (10) 252 (14) 333 (22) 399 (20) 330 (18)CMIN (mg CO2eC�1 kg soil 24 d�1) 169 (17) 793 (49) 504 (12) 756 (23) 838 (66) 1056 (68) 778 (10)NMIN (mg kg�1 soil 24 d�1) 30 (3) 17 (2) 14 (2) 29 (6) 71 (6) 45 (13) 84 (18)SMBC (mg kg�1 soil) 373 (52) 1119 (29) 491 (61) 938 (87) 1097 (63) 1246 (61) 940 (52)PLFASUM (nmol g�1 soil)c 39 (6) 82 (4) 61 (8) 92 (9) 94 (24) 106 (20) 107 (15)PLFAWIN (nmol g�1 soil) 45 (15) 86 (9) 53 (8) 84 (8) 145 (13) 131 (8) 123 (19)Fungal/BacterialSUM Ratio 0.17 (0.02) 0.30 (0.02) 0.26 (0.03) 0.32 (0.03) 0.21 (0.02) 0.24 (0.02) 0.20 (0.02)Fungal/BacterialWIN ratio 0.31 (0.10) 0.36 (0.09) 0.26 (0.02) 0.38 (0.07) 0.31 (0.02) 0.31 (0.05) 0.27 (0.03)
a Values are mean (standard deviation) of three soil samples collected in summer.b EC ¼ Electrical conductivity; POC ¼ Particulate organic C; PON ¼ Particulate organic N; C3 ¼ Flush of CO2eC during the first 3 days following rewetting of dried soil;
CMIN ¼ Mineralizable C; NMIN ¼ Mineralizable N; and SMBC ¼ Soil microbial biomass C.c Values for PLFA and fungal/bacterial ratio are from summer (SUM) and winter (WIN).
K. Jangid et al. / Soil Biology & Biochemistry 42 (2010) 302e312306
KA1S2_A02, KA1W2_C09 and KB1W2_B05 were found in highnumbers during restoration (RG98 þ RG78) but were either much lessabundant or completely absent in the BNP and CTC soils. Consistentwith the binomials test of abundance, several of these most abundantOTUs were also strong “indicator species” (p < 0.01) of differencesbetween the chronosequence soils (Table 4, Supplementary Table S6).The specific association of some OTUs with the restored grasslandssuggested that transitional microbial communities formed duringrestoration. In the NMS analyses of the abundant OTUs, the formationof these transitional communities was visualized by the unevenprogression of the chronosequence from CTC to BNP (Fig. 2b and c).
3.4. Response of microbial community to soiltype in restored grassland
Soil properties for RG00 and RG98 differed significantly, eventhough they were restored at approximately the same time andexperienced similarmanagement practices. The RG00 soil had higherpH, elemental content of Ca, K, Mn and P (Supplementary Table S3),clay and sand content, and a different soil texture. In addition, itcontained significantly higher mineralizable C, three-day CO2eC,total C and N, and particulate organic N (Supplementary Table S2).Correspondingly, microbial communities in RG00 and RG98 differedsignificantly despite their similar restoration times, reflectingthe importance of soil type in structuring microbial communities.Multivariate NMS plots and multi-response permutation tests indi-cated that both the distribution of total microbial PLFAs and mostabundant OTUs under RG00 was different from RG98 as well as allother soils within the chronosequence (Fig. 2). In addition, RG00 soilshad higher content of both bacterial and fungal PLFAs than RG98.
Although bacterial 16S rRNA gene diversity and relative abun-dances of different phylogenetic taxa, except b-Proteobacteria, weresimilar in RG00 and RG98, bacterial community composition differedsignificantly. Although neither bacterial diversity nor evenness ofthe two soils differed significantly (Supplementary Table S4), group-specific LIBSHUFF analysis of the rRNA gene clone libraries forRG00 and RG98 detected differences in the composition of mostphylogenetic taxa (Table 3). Specifically, Acidobacteria, Bacteroidetes,Proteobacteria and the four proteobacterial classes (a-, b-, D-, andg-Proteobacteria) all differed significantly. Likewise, the RG98 and
RG00 grasslands had significantly different distributions of abundantOTUs(Table4andSupplementaryTableS6). FiveOTUsrepresentedbythe GASP clones KA1S2_B08, KA1S2_H11, KA1S3_F12, KA1W2_D08andKB1W3_A10were significantlymore abundant inRG00 thanRG98soils. Similarly, six OTUs represented by the GASP clones KA1S1_B05,KA1S1_E10, KA1S1_F09, KA1S2_E11, KA1S3_A12 and KB1S1_A02were significantly more abundant in RG98 soils. Likewise, in the NMSanalyses of the abundant OTUs, the RG00 soils were well separatedfrom the RG98 and the chronosequence soils (Fig. 2b and c).
3.5. Effect of sampling area size on microbial communitystructure determination
Reducing the sampling area size from 300m2 to 150m2 in the BNPand BNP150 soils, respectively, did not impact the estimates of soilphysicochemical characteristics, except for mineralizable C and N,soil microbial biomass C, and Fe content (Table 1, and SupplementaryTables S2 and S3). These results suggest that patchiness in soils led tosmall differences in the estimates of somephysicochemical properties.
There was no significant difference in the distribution of micro-bial PLFAs or most abundant OTUs in the BNP and BNP150 soils(Fig. 2). Similarly, the amount of total microbial PLFA and fungal:bacterial ratio were similar (Table 1). However, the apparent diver-sity of the microbial community was expected to depend upona powerelaw relationship with the area sampled: SN AZ, where S isnumber of taxa observed and A is the area (Horner-Devine et al.,2004). Changing the size of sampling area seemed to have a smalleffect on the observed bacterial diversity. All measures of diversityexcept Chao1 were lower in the BNP150 soils (SupplementaryTable S4). These differences were also reflected in the rarefactioncurves by a shallower slope for the BNP150 soil (Fig. 3).
Significant differences in the composition of bacterial commu-nities between BNP and BNP150 were also observed. Group-specificLIBSHUFF analysis revealed that the composition of Actinobacteria,Bacteroidetes, and D-Proteobacteria differed significantly betweenthe two soils. While there were small differences in the abundancesof these taxa (Table 2), the hierarchy of linear models detecteda significant decrease in abundance of only Planctomycetes in BNP150(p ¼ 0.01, data not shown). Differences due to the sampling areawere expected to affect the estimates of rare more than abundant
K. Jangid et al. / Soil Biology & Biochemistry 42 (2010) 302e312 307
Fig. 2. Non-metric multidimensional scaling analysis of: a) total microbial communityphospholipid fatty acids, b) most abundant operational taxonomic units (OTUs), and c)OTUs most strongly correlated (r < 0.60) to land management (treatment) in soils fromManhattan KS. For a), groupings used to separate communities were based onmol % of 22fattyacids. In addition, lines between symbols of a treatment connect the four soilswithinthe chronosequence. The communities from summer are indicated by closed symbols,whereas those from winter samples are indicated by open symbols. For b) and c),groupings used to separate communities were clone counts for the 57 most abundantOTUs. Additionally in b), the vectors indicate the direction and strength of the relation-ship between OTU and physicochemical variables (r > 0.80). The Pearson and Kendallcorrelations with other physicochemical properties are presented in Table 5. Similarly inc), the overlays of the OTUs that most strongly correlated (r < 0.60) to axis 1 and 2 areindicated by integer numbers and provide an indication of the direction and strength ofthe relationship between OTU and land management (treatment). While most of theseOTUs are identified in Table 4 and Supplementary Table S6, those not identified are: 6(KA1W2_D07), 7 (KA1S3_E10),12 (KB1S1_D03), and 14 (KB1S1_B02). Percentages denotethe amount of variability associated with each axis. CTC¼ conventionally tilled cropland(:); RG00 ¼ 2000 restored grassland (C); RG98 ¼ 1998 restored grassland (-);RG78 ¼ 1978 restored grassland (A); BNP¼ annually burned native tallgrass prairie (�);BNP150 ¼ 150 m2 annually burned native tallgrass prairie (þ); and UNP150 ¼ 150 m2
unburned native tallgrass prairie (s).
Fig. 3. Rarefaction curves of the 16S rRNA gene libraries. OTUs were formed at D ¼ 0.03.CTC ¼ conventionally tilled cropland; BNP ¼ burned native prairie; BNP150 ¼ burnednative prairie from 150 m2 plots; UNP150 ¼ unburned native prairie from 150 m2 plots;RG78¼ restored grassland in 1978; RG98¼ restored grassland in 1998; and RG00¼ restoredgrassland in 2000.
members due to localized patchiness within the soil microbialcommunities. The distribution of themost abundantOTUs in the twodifferently sized burned plots were indeed similar, suggesting onlysmall differences in microbial community structure. Only oneOTU showed specific association with sample area (SupplementaryTable S6). Given the differences in bacterial community compositionobserved with different sampling areas, the effect of burning wasstudied in similarly sized plots (see below).
3.6. Effect of sampling season
Microbial PLFA composition was influenced by seasonalsampling. Although not statistically significant, there was a trend forgreater PLFA content inwinter than in summer for the native prairieand CTC soils, but not for the restored grasslands (Table 1). However,
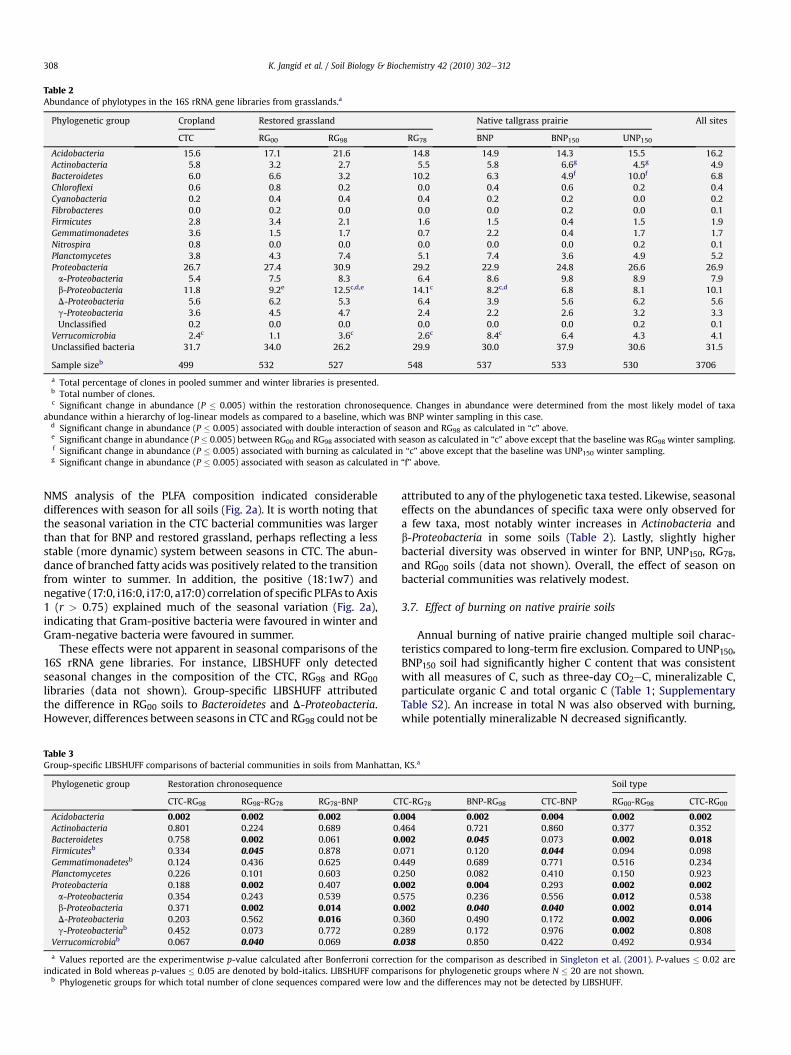
Table 2Abundance of phylotypes in the 16S rRNA gene libraries from grasslands.a
Phylogenetic group Cropland Restored grassland Native tallgrass prairie All sites
CTC RG00 RG98 RG78 BNP BNP150 UNP150
Acidobacteria 15.6 17.1 21.6 14.8 14.9 14.3 15.5 16.2Actinobacteria 5.8 3.2 2.7 5.5 5.8 6.6g 4.5g 4.9Bacteroidetes 6.0 6.6 3.2 10.2 6.3 4.9f 10.0f 6.8Chloroflexi 0.6 0.8 0.2 0.0 0.4 0.6 0.2 0.4Cyanobacteria 0.2 0.4 0.4 0.4 0.2 0.2 0.0 0.2Fibrobacteres 0.0 0.2 0.0 0.0 0.0 0.2 0.0 0.1Firmicutes 2.8 3.4 2.1 1.6 1.5 0.4 1.5 1.9Gemmatimonadetes 3.6 1.5 1.7 0.7 2.2 0.4 1.7 1.7Nitrospira 0.8 0.0 0.0 0.0 0.0 0.0 0.2 0.1Planctomycetes 3.8 4.3 7.4 5.1 7.4 3.6 4.9 5.2Proteobacteria 26.7 27.4 30.9 29.2 22.9 24.8 26.6 26.9a-Proteobacteria 5.4 7.5 8.3 6.4 8.6 9.8 8.9 7.9b-Proteobacteria 11.8 9.2e 12.5c,d,e 14.1c 8.2c,d 6.8 8.1 10.1D-Proteobacteria 5.6 6.2 5.3 6.4 3.9 5.6 6.2 5.6g-Proteobacteria 3.6 4.5 4.7 2.4 2.2 2.6 3.2 3.3Unclassified 0.2 0.0 0.0 0.0 0.0 0.0 0.2 0.1
Verrucomicrobia 2.4c 1.1 3.6c 2.6c 8.4c 6.4 4.3 4.1Unclassified bacteria 31.7 34.0 26.2 29.9 30.0 37.9 30.6 31.5
Sample sizeb 499 532 527 548 537 533 530 3706
a Total percentage of clones in pooled summer and winter libraries is presented.b Total number of clones.c Significant change in abundance (P � 0.005) within the restoration chronosequence. Changes in abundance were determined from the most likely model of taxa
abundance within a hierarchy of log-linear models as compared to a baseline, which was BNP winter sampling in this case.d Significant change in abundance (P � 0.005) associated with double interaction of season and RG98 as calculated in “c” above.e Significant change in abundance (P � 0.005) between RG00 and RG98 associated with season as calculated in “c” above except that the baseline was RG98 winter sampling.f Significant change in abundance (P � 0.005) associated with burning as calculated in “c” above except that the baseline was UNP150 winter sampling.g Significant change in abundance (P � 0.005) associated with season as calculated in “f” above.
K. Jangid et al. / Soil Biology & Biochemistry 42 (2010) 302e312308
NMS analysis of the PLFA composition indicated considerabledifferences with season for all soils (Fig. 2a). It is worth noting thatthe seasonal variation in the CTC bacterial communities was largerthan that for BNP and restored grassland, perhaps reflecting a lessstable (more dynamic) system between seasons in CTC. The abun-dance of branched fatty acids was positively related to the transitionfrom winter to summer. In addition, the positive (18:1w7) andnegative (17:0, i16:0, i17:0, a17:0) correlation of specific PLFAs to Axis1 (r > 0.75) explained much of the seasonal variation (Fig. 2a),indicating that Gram-positive bacteria were favoured in winter andGram-negative bacteria were favoured in summer.
These effects were not apparent in seasonal comparisons of the16S rRNA gene libraries. For instance, LIBSHUFF only detectedseasonal changes in the composition of the CTC, RG98 and RG00
libraries (data not shown). Group-specific LIBSHUFF attributedthe difference in RG00 soils to Bacteroidetes and D-Proteobacteria.However, differences between seasons in CTC and RG98 could not be
Table 3Group-specific LIBSHUFF comparisons of bacterial communities in soils from Manhattan
Phylogenetic group Restoration chronosequence
CTC-RG98 RG98-RG78 RG78-BNP C
Acidobacteria 0.002 0.002 0.002 0Actinobacteria 0.801 0.224 0.689 0Bacteroidetes 0.758 0.002 0.061 0Firmicutesb 0.334 0.045 0.878 0Gemmatimonadetesb 0.124 0.436 0.625 0Planctomycetes 0.226 0.101 0.603 0Proteobacteria 0.188 0.002 0.407 0a-Proteobacteria 0.354 0.243 0.539 0b-Proteobacteria 0.371 0.002 0.014 0D-Proteobacteria 0.203 0.562 0.016 0g-Proteobacteriab 0.452 0.073 0.772 0
Verrucomicrobiab 0.067 0.040 0.069 0
a Values reported are the experimentwise p-value calculated after Bonferroni correctindicated in Bold whereas p-values � 0.05 are denoted by bold-italics. LIBSHUFF compa
b Phylogenetic groups for which total number of clone sequences compared were low
attributed to any of the phylogenetic taxa tested. Likewise, seasonaleffects on the abundances of specific taxa were only observed fora few taxa, most notably winter increases in Actinobacteria andb-Proteobacteria in some soils (Table 2). Lastly, slightly higherbacterial diversity was observed in winter for BNP, UNP150, RG78,and RG00 soils (data not shown). Overall, the effect of season onbacterial communities was relatively modest.
3.7. Effect of burning on native prairie soils
Annual burning of native prairie changed multiple soil charac-teristics compared to long-term fire exclusion. Compared to UNP150,BNP150 soil had significantly higher C content that was consistentwith all measures of C, such as three-day CO2eC, mineralizable C,particulate organic C and total organic C (Table 1; SupplementaryTable S2). An increase in total N was also observed with burning,while potentially mineralizable N decreased significantly.
, KS.a
Soil type
TC-RG78 BNP-RG98 CTC-BNP RG00-RG98 CTC-RG00
.004 0.002 0.004 0.002 0.002
.464 0.721 0.860 0.377 0.352
.002 0.045 0.073 0.002 0.018
.071 0.120 0.044 0.094 0.098
.449 0.689 0.771 0.516 0.234
.250 0.082 0.410 0.150 0.923
.002 0.004 0.293 0.002 0.002
.575 0.236 0.556 0.012 0.538
.002 0.040 0.040 0.002 0.014
.360 0.490 0.172 0.002 0.006
.289 0.172 0.976 0.002 0.808
.038 0.850 0.422 0.492 0.934
ion for the comparison as described in Singleton et al. (2001). P-values � 0.02 arerisons for phylogenetic groups where N � 20 are not shown.and the differences may not be detected by LIBSHUFF.
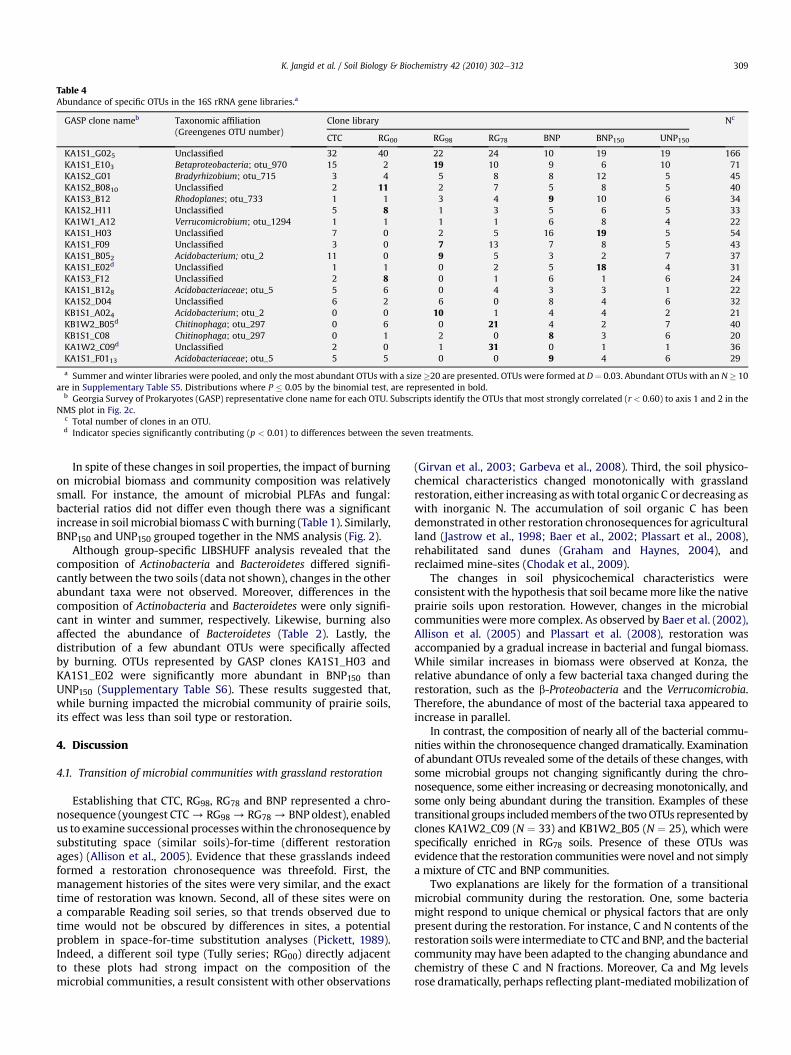
Table 4Abundance of specific OTUs in the 16S rRNA gene libraries.a
GASP clone nameb Taxonomic affiliation(Greengenes OTU number)
Clone library Nc
CTC RG00 RG98 RG78 BNP BNP150 UNP150
KA1S1_G025 Unclassified 32 40 22 24 10 19 19 166KA1S1_E103 Betaproteobacteria; otu_970 15 2 19 10 9 6 10 71KA1S2_G01 Bradyrhizobium; otu_715 3 4 5 8 8 12 5 45KA1S2_B0810 Unclassified 2 11 2 7 5 8 5 40KA1S3_B12 Rhodoplanes; otu_733 1 1 3 4 9 10 6 34KA1S2_H11 Unclassified 5 8 1 3 5 6 5 33KA1W1_A12 Verrucomicrobium; otu_1294 1 1 1 1 6 8 4 22KA1S1_H03 Unclassified 7 0 2 5 16 19 5 54KA1S1_F09 Unclassified 3 0 7 13 7 8 5 43KA1S1_B052 Acidobacterium; otu_2 11 0 9 5 3 2 7 37KA1S1_E02d Unclassified 1 1 0 2 5 18 4 31KA1S3_F12 Unclassified 2 8 0 1 6 1 6 24KA1S1_B128 Acidobacteriaceae; otu_5 5 6 0 4 3 3 1 22KA1S2_D04 Unclassified 6 2 6 0 8 4 6 32KB1S1_A024 Acidobacterium; otu_2 0 0 10 1 4 4 2 21KB1W2_B05d Chitinophaga; otu_297 0 6 0 21 4 2 7 40KB1S1_C08 Chitinophaga; otu_297 0 1 2 0 8 3 6 20KA1W2_C09d Unclassified 2 0 1 31 0 1 1 36KA1S1_F0113 Acidobacteriaceae; otu_5 5 5 0 0 9 4 6 29
a Summer andwinter libraries were pooled, and only themost abundant OTUs with a size�20 are presented. OTUs were formed at D¼ 0.03. Abundant OTUs with an N� 10are in Supplementary Table S5. Distributions where P � 0.05 by the binomial test, are represented in bold.
b Georgia Survey of Prokaryotes (GASP) representative clone name for each OTU. Subscripts identify the OTUs that most strongly correlated (r < 0.60) to axis 1 and 2 in theNMS plot in Fig. 2c.
c Total number of clones in an OTU.d Indicator species significantly contributing (p < 0.01) to differences between the seven treatments.
K. Jangid et al. / Soil Biology & Biochemistry 42 (2010) 302e312 309
In spite of these changes in soil properties, the impact of burningon microbial biomass and community composition was relativelysmall. For instance, the amount of microbial PLFAs and fungal:bacterial ratios did not differ even though there was a significantincrease in soilmicrobial biomass Cwith burning (Table 1). Similarly,BNP150 and UNP150 grouped together in the NMS analysis (Fig. 2).
Although group-specific LIBSHUFF analysis revealed that thecomposition of Actinobacteria and Bacteroidetes differed signifi-cantly between the two soils (data not shown), changes in the otherabundant taxa were not observed. Moreover, differences in thecomposition of Actinobacteria and Bacteroidetes were only signifi-cant in winter and summer, respectively. Likewise, burning alsoaffected the abundance of Bacteroidetes (Table 2). Lastly, thedistribution of a few abundant OTUs were specifically affectedby burning. OTUs represented by GASP clones KA1S1_H03 andKA1S1_E02 were significantly more abundant in BNP150 thanUNP150 (Supplementary Table S6). These results suggested that,while burning impacted the microbial community of prairie soils,its effect was less than soil type or restoration.
4. Discussion
4.1. Transition of microbial communities with grassland restoration
Establishing that CTC, RG98, RG78 and BNP represented a chro-nosequence (youngest CTC/ RG98/ RG78/ BNP oldest), enabledus to examine successional processeswithin the chronosequence bysubstituting space (similar soils)-for-time (different restorationages) (Allison et al., 2005). Evidence that these grasslands indeedformed a restoration chronosequence was threefold. First, themanagement histories of the sites were very similar, and the exacttime of restoration was known. Second, all of these sites were ona comparable Reading soil series, so that trends observed due totime would not be obscured by differences in sites, a potentialproblem in space-for-time substitution analyses (Pickett, 1989).Indeed, a different soil type (Tully series; RG00) directly adjacentto these plots had strong impact on the composition of themicrobial communities, a result consistent with other observations
(Girvan et al., 2003; Garbeva et al., 2008). Third, the soil physico-chemical characteristics changed monotonically with grasslandrestoration, either increasing aswith total organic C or decreasing aswith inorganic N. The accumulation of soil organic C has beendemonstrated in other restoration chronosequences for agriculturalland (Jastrow et al., 1998; Baer et al., 2002; Plassart et al., 2008),rehabilitated sand dunes (Graham and Haynes, 2004), andreclaimed mine-sites (Chodak et al., 2009).
The changes in soil physicochemical characteristics wereconsistent with the hypothesis that soil becamemore like the nativeprairie soils upon restoration. However, changes in the microbialcommunities were more complex. As observed by Baer et al. (2002),Allison et al. (2005) and Plassart et al. (2008), restoration wasaccompanied by a gradual increase in bacterial and fungal biomass.While similar increases in biomass were observed at Konza, therelative abundance of only a few bacterial taxa changed during therestoration, such as the b-Proteobacteria and the Verrucomicrobia.Therefore, the abundance of most of the bacterial taxa appeared toincrease in parallel.
In contrast, the composition of nearly all of the bacterial commu-nities within the chronosequence changed dramatically. Examinationof abundant OTUs revealed some of the details of these changes, withsome microbial groups not changing significantly during the chro-nosequence, some either increasing or decreasing monotonically, andsome only being abundant during the transition. Examples of thesetransitional groups includedmembers of the twoOTUs representedbyclones KA1W2_C09 (N ¼ 33) and KB1W2_B05 (N ¼ 25), which werespecifically enriched in RG78 soils. Presence of these OTUs wasevidence that the restoration communitieswere novel and not simplya mixture of CTC and BNP communities.
Two explanations are likely for the formation of a transitionalmicrobial community during the restoration. One, some bacteriamight respond to unique chemical or physical factors that are onlypresent during the restoration. For instance, C and N contents of therestoration soils were intermediate to CTC and BNP, and the bacterialcommunity may have been adapted to the changing abundance andchemistry of these C and N fractions. Moreover, Ca and Mg levelsrose dramatically, perhaps reflecting plant-mediatedmobilization of
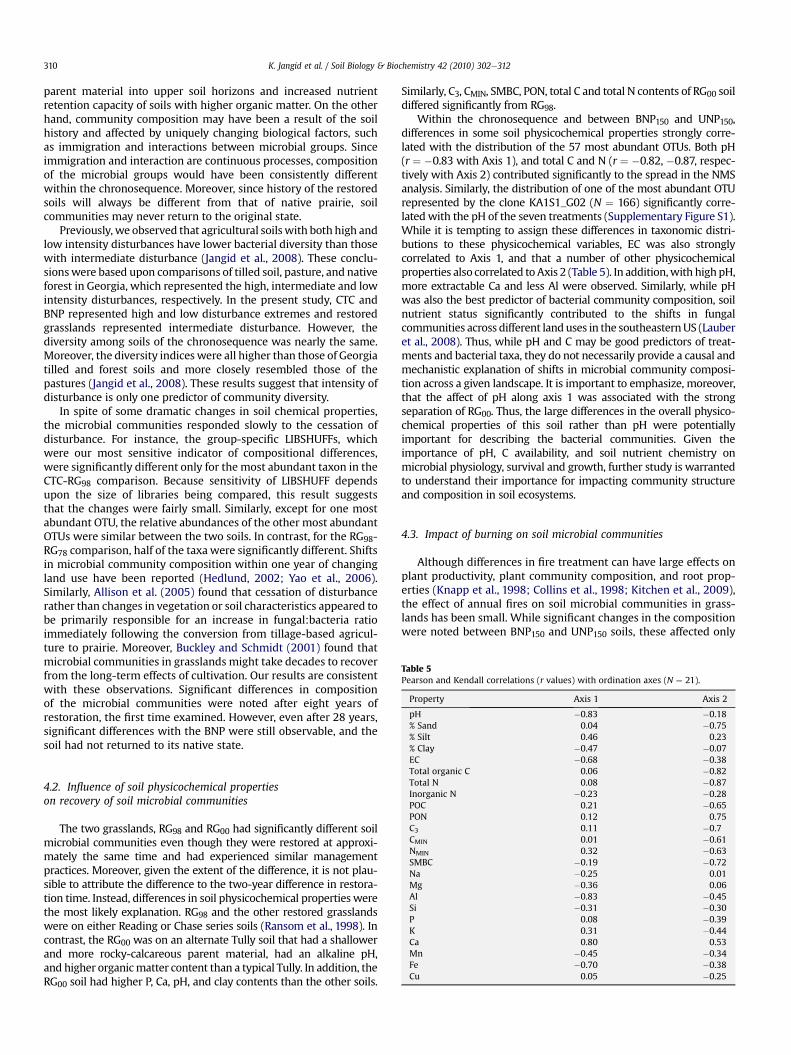
Table 5Pearson and Kendall correlations (r values) with ordination axes (N ¼ 21).
Property Axis 1 Axis 2
pH �0.83 �0.18% Sand 0.04 �0.75% Silt 0.46 0.23% Clay �0.47 �0.07
K. Jangid et al. / Soil Biology & Biochemistry 42 (2010) 302e312310
parent material into upper soil horizons and increased nutrientretention capacity of soils with higher organic matter. On the otherhand, community composition may have been a result of the soilhistory and affected by uniquely changing biological factors, suchas immigration and interactions between microbial groups. Sinceimmigration and interaction are continuous processes, compositionof the microbial groups would have been consistently differentwithin the chronosequence. Moreover, since history of the restoredsoils will always be different from that of native prairie, soilcommunities may never return to the original state.
Previously, we observed that agricultural soilswith both high andlow intensity disturbances have lower bacterial diversity than thosewith intermediate disturbance (Jangid et al., 2008). These conclu-sionswere based upon comparisons of tilled soil, pasture, and nativeforest in Georgia, which represented the high, intermediate and lowintensity disturbances, respectively. In the present study, CTC andBNP represented high and low disturbance extremes and restoredgrasslands represented intermediate disturbance. However, thediversity among soils of the chronosequence was nearly the same.Moreover, the diversity indices were all higher than those of Georgiatilled and forest soils and more closely resembled those of thepastures (Jangid et al., 2008). These results suggest that intensity ofdisturbance is only one predictor of community diversity.
In spite of some dramatic changes in soil chemical properties,the microbial communities responded slowly to the cessation ofdisturbance. For instance, the group-specific LIBSHUFFs, whichwere our most sensitive indicator of compositional differences,were significantly different only for the most abundant taxon in theCTC-RG98 comparison. Because sensitivity of LIBSHUFF dependsupon the size of libraries being compared, this result suggeststhat the changes were fairly small. Similarly, except for one mostabundant OTU, the relative abundances of the other most abundantOTUs were similar between the two soils. In contrast, for the RG98-RG78 comparison, half of the taxa were significantly different. Shiftsin microbial community composition within one year of changingland use have been reported (Hedlund, 2002; Yao et al., 2006).Similarly, Allison et al. (2005) found that cessation of disturbancerather than changes in vegetation or soil characteristics appeared tobe primarily responsible for an increase in fungal:bacteria ratioimmediately following the conversion from tillage-based agricul-ture to prairie. Moreover, Buckley and Schmidt (2001) found thatmicrobial communities in grasslands might take decades to recoverfrom the long-term effects of cultivation. Our results are consistentwith these observations. Significant differences in compositionof the microbial communities were noted after eight years ofrestoration, the first time examined. However, even after 28 years,significant differences with the BNP were still observable, and thesoil had not returned to its native state.
EC �0.68 �0.38Total organic C 0.06 �0.82Total N 0.08 �0.87Inorganic N �0.23 �0.28POC 0.21 �0.65PON 0.12 0.75C3 0.11 �0.7CMIN 0.01 �0.61NMIN 0.32 �0.63SMBC �0.19 �0.72Na �0.25 0.01Mg �0.36 0.06Al �0.83 �0.45Si �0.31 �0.30P 0.08 �0.39K 0.31 �0.44Ca 0.80 0.53Mn �0.45 �0.34Fe �0.70 �0.38Cu 0.05 �0.25
4.2. Influence of soil physicochemical propertieson recovery of soil microbial communities
The two grasslands, RG98 and RG00 had significantly different soilmicrobial communities even though they were restored at approxi-mately the same time and had experienced similar managementpractices. Moreover, given the extent of the difference, it is not plau-sible to attribute the difference to the two-year difference in restora-tion time. Instead, differences in soil physicochemical properties werethe most likely explanation. RG98 and the other restored grasslandswere on either Reading or Chase series soils (Ransom et al., 1998). Incontrast, the RG00 was on an alternate Tully soil that had a shallowerand more rocky-calcareous parent material, had an alkaline pH,and higher organicmatter content than a typical Tully. In addition, theRG00 soil had higher P, Ca, pH, and clay contents than the other soils.
Similarly, C3, CMIN, SMBC, PON, total C and total N contents of RG00 soildiffered significantly from RG98.
Within the chronosequence and between BNP150 and UNP150,differences in some soil physicochemical properties strongly corre-lated with the distribution of the 57 most abundant OTUs. Both pH(r ¼ �0.83 with Axis 1), and total C and N (r ¼ �0.82, �0.87, respec-tively with Axis 2) contributed significantly to the spread in the NMSanalysis. Similarly, the distribution of one of the most abundant OTUrepresented by the clone KA1S1_G02 (N ¼ 166) significantly corre-lated with the pH of the seven treatments (Supplementary Figure S1).While it is tempting to assign these differences in taxonomic distri-butions to these physicochemical variables, EC was also stronglycorrelated to Axis 1, and that a number of other physicochemicalproperties also correlated toAxis 2 (Table 5). In addition,with highpH,more extractable Ca and less Al were observed. Similarly, while pHwas also the best predictor of bacterial community composition, soilnutrient status significantly contributed to the shifts in fungalcommunities across different land uses in the southeasternUS (Lauberet al., 2008). Thus, while pH and C may be good predictors of treat-ments and bacterial taxa, they do not necessarily provide a causal andmechanistic explanation of shifts in microbial community composi-tion across a given landscape. It is important to emphasize, moreover,that the affect of pH along axis 1 was associated with the strongseparation of RG00. Thus, the large differences in the overall physico-chemical properties of this soil rather than pH were potentiallyimportant for describing the bacterial communities. Given theimportance of pH, C availability, and soil nutrient chemistry onmicrobial physiology, survival and growth, further study is warrantedto understand their importance for impacting community structureand composition in soil ecosystems.
4.3. Impact of burning on soil microbial communities
Although differences in fire treatment can have large effects onplant productivity, plant community composition, and root prop-erties (Knapp et al., 1998; Collins et al., 1998; Kitchen et al., 2009),the effect of annual fires on soil microbial communities in grass-lands has been small. While significant changes in the compositionwere noted between BNP150 and UNP150 soils, these affected only
K. Jangid et al. / Soil Biology & Biochemistry 42 (2010) 302e312 311
a few microbial groups. The bacterial diversity and abundances ofmost of the OTUs were also unchanged. Because most studies onthe effect of fires on soil microbial communities in grasslands havefocused only on changes in microbial biomass and soil properties(Michelsen et al., 2004; Ross et al., 1997), the only availablecomparisons of changes in community composition are fromburning in forests (Hamman et al., 2007; Smith et al., 2008). Suchstudies also observed significant changes in the composition ofmicrobial communities upon burning.
The effect of burning on the composition of microbial commu-nities is complex and varies with the microbial groups. Rice andParenti (1978) reported that burning increased fungal population,whereas Hamman et al. (2007) reported a significant decrease infungalmethyl-ester linked fatty acid biomarkerswith burning.Whilebacteria are a more abundant portion of the microbial communitythan fungi in Konza soils, microbial activity is dominated by fungi(Garcia,1992). However, frequent burning does not affect the relativecontributions of bacteria and fungi to microbial activity. Long-termburning alters the rate of organic matter turnover and, therefore,affects microbial biomass and the production of enzymes. Burningsignificantly increases activities of urease and acid phosphatase, butdecreases activities of b-glucosidase, deaminase and alkaline phos-phatase (Ajwa et al., 1999). The relatively small impact of burning onthe composition of microbial communities was consistent with thesmall changes in soil physicochemical properties, which weregenerallymuch lower inmagnitude than occurred due to restoration.However, we detected a significant increase in soil C fractions due toburning, which was likely driven by a 50% increase in belowgroundfine root biomass (Kitchen et al., 2009). Burning of grasslands inSouth Africa also resulted in greater soil microbial C and root density(Fynn et al., 2003). However, it is not straightforward to understandthe impacts of fire on soil microbial communities, because burninginfluences all of the major water, C and nutrient cycles that arecritical to the ecology of the prairie. While the changes in microbialcommunity composition seem small compared to the effects ofrestoration, the potential impact that these community changes haveon nutrient cycling in burned prairie are not known.
4.4. Conclusions
Soilmicrobial communitystructureandsoil biochemicalpropertieswere significantly altered by cultivation of original tallgrass prairie.While soil physicochemical properties changed monotonically withgrassland restoration, the transition of soil microbial communitiesexhibited an intermediate transitional stage decades after the cessa-tion of cultivation. Thus, the microbial response to restoration wasmore complex than originally hypothesized. While somemembers ofthe microbial community of restored grasslands closely resembledthose of the native prairie soils as the soil environmentmatured, othermemberswereunique totherestorationcommunity. Inaddition, shiftsin the soil microbial community were apparent soon after the resto-ration of cultivated land. Soil type had a major impact on the compo-sitionof themicrobial communityso that soil typesundergoing similarmanagement had very different microbial populations. Althoughburning of grassland changed multiple soil properties, it only hada small but important effect on the composition of bacterial commu-nities as compared to the lasting legacy of cultivation. These findingssignificantly advanced our understanding of microbial communitysuccession and dynamics in restored grasslands.
Acknowledgements
This project was supported by National Research Initiative grantfrom the USDA National Institute of Food and Agriculture. Fire andrestoration treatments at the Konza Prairie Biological Station were
supported by the Konza Prairie Long-Term Ecological Researchprogram.
Appendix. Supplementary material
Supplementary data associated with this article can be found inthe online version at doi:10.1016/j.soilbio.2009.11.008.
References
Ajwa, H.A., Dell, C.J., Rice, C.W., 1999. Changes in enzyme activities and microbialbiomass of tallgrass prairie soil as related to burning and nitrogen fertilization.Soil Biology and Biochemistry 31, 769e777.
Allison, V.J., Miller, R.M., Jastrow, J.D., Matamala, R., Zak, D.R., 2005. Changes in soilmicrobial community structure in a tallgrass prairie chronosequence. SoilScience Society of America Journal 69, 1412e1421.
Ashelford, K.E., Chuzhanova, N.A., Fry, J.C., Jones, A.J., Weightman, A.J., 2005. At leastone in twenty 16S rRNA sequence records currently held in public repositoriesestimated to contain substantial anomalies. Applied and EnvironmentalMicrobiology 71, 7724e7736.
Ashelford, K.E., Chuzhanova, N.A., Fry, J.C., Jones, A.J., Weightman, A.J., 2006. NewScreening software shows that most recent large 16S rRNA gene clone librariescontain chimeras. Applied and Environmental Microbiology 72, 5734e5741.
Baer, S.G., Kitchen, D.J., Blair, J.M., Rice, C.W., 2002. Changes in ecosystem structureand function along a chronosequence of restored grasslands. Ecological Appli-cations 12, 1688e1701.
Blair, J.M., Seastedt, T.R., Rice, C.W., Ramundo, R.A., 1998. Terrestrial nutrient cyclingin tallgrass prairie. In: Knapp, A.K., Briggs, J.M., Hartnett, D.C., Collins, S.L. (Eds.),Grassland Dynamics: Long-term Ecological Research in Tallgrass Prairie. OxfordUniversity Press, New York, pp. 222e243.
Bossio, D.A., Scow, K.M., 1998. Impacts of carbon and flooding on soil microbialcommunities: phospholipid fatty acid profiles and substrate utilizationpatterns. Microbial Ecology 35, 265e278.
Buckley, D.H., Schmidt, T.M., 2001. The structure of microbial communities in soiland the lasting impact of cultivation. Microbial Ecology 42, 11e21.
Butler, J.L., Williams, M.A., Bottomley, P.J., Myrold, D.D., 2003. Microbial communitydynamics associated with rhizosphere C flow. Applied and EnvironmentalMicrobiology 69, 6793e6800.
Carney, K.M., Matson, P.A., 2006. The influence of tropical plant diversity andcomposition on soil microbial communities. Microbial Ecology 52, 226e238.
Chodak, M., Pietrzykowski, M., Nikli�nska, M., 2009. Development of microbial prop-erties in a chronosequence of sandymine soils. Applied Soil Ecology 41, 259e268.
Collins, S.L., Knapp, A.K., Briggs, J.M., Blair, J.M., Steinauer, E.M., 1998. Modulation ofdiversity by grazing and mowing in tallgrass prairie. Science 280, 745e747.
DeSantis, T.Z., Hugenholtz, P., Larsen, N., Rojas, M., Brodie, E.L., Keller, K., Huber, T.,Dalevi, D., Hu, P., Andersen, G.L., 2006. Greengenes, a chimera-checked 16SrRNA gene database and workbench compatible with ARB. Applied and Envi-ronmental Microbiology 72, 5069e5072.
Felsenstein, J., 2004. Phylip (Phylogeny Inference Package) Version 3.63. Distributedby Author. Department of Genome Sciences, University of Washington, Seattle.
Fierer, N., Jackson, R.B., 2006. The diversity and biogeography of soil bacterialcommunities. Proceedings of the National Academy of Science USA 103, 626e631.
Fynn, R.W.S., Haynes, R.J., O'Connor, T.G., 2003. Burning causes long-term changesin soil organic matter content of a South African grassland. Soil Biology andBiochemistry 35, 677e687.
Garbeva, P., van Elsas, J.D., van Veen, J.A., 2008. Rhizosphere microbial communityand its response to plant species and soil history. Plant and Soil 302, 19e32.
Garcia, F.O., 1992. Carbon and Nitrogen Dynamics and Microbial Ecology in TallgrassPrairie. Ph.D. dissertation. Kansas State University, Manhattan, Kansas, USA.
Girvan, M.S., Bullimore, J., Pretty, J.N., Osborn, A.M., Ball, A.S., 2003. Soil type is theprimary determinant of the composition of the total and active bacterial commu-nities in arable soils. Applied and Environmental Microbiology 69, 1800e1809.
Graham, M.H., Haynes, R.J., 2004. Organic matter status and the size, activity andmetabolic diversity of the soil microflora as indicators of the success of reha-bilitation of sand dunes. Biology and Fertility of Soils 39, 429e437.
Griffiths, R.I., Whiteley, A.S., O'Donnell, A.G., Bailey, M.J., 2003. Influence of depthand sampling time on bacterial community structure in an upland grasslandsoil. FEMS Microbiology Ecology 43, 35e43.
Hamman, S.T., Burke, I.C., Stromberger, M.E., 2007. Relationships between microbialcommunity structure and soil environmental conditions in a recently burnedsystem. Soil Biology and Biochemistry 39, 1703e1711.
Haas, H.J., Evans, C.E., Miles, E.R., 1957. Nitrogen and Carbon Changes in Soils asInfluenced by Cropping and Soil Treatments. USDA Technical Bulletin 1164. U.S.Government Printing Office, Washington, DC, USA.
Hedlund, K., 2002. Soil microbial community structure in relation to vegetationmanagements on former agricultural land. Soil Biology and Biochemistry 34,1299e1307.
Horner-Devine, M.C., Lage, M., Hughes, J.B., Bhannan, B.J.M., 2004. A taxaearearelationship for bacteria. Nature 432, 750e753.
Jangid, K.,Williams,M.A., Franzluebbers, A.J., Sanderlin, J.S., Reeves, J.H., Jenkins,M.B.,Endale, D.M., Coleman, D.C., Whitman, W.B., 2008. Relative impacts of land-use,
K. Jangid et al. / Soil Biology & Biochemistry 42 (2010) 302e312312
management intensity and fertilization upon soilmicrobial community structurein agricultural systems. Soil Biology and Biochemistry 40, 2843e2853.
Jastrow, J.D., Miller, R.M., Lussenhop, J., 1998. Contributions of interacting biologicalmechanisms to soil aggregate stabilization in restored prairie. Soil Biology andBiochemistry 30, 905e916.
Killham, K., 1994. Soil Ecology. Cambridge University Press, UK.Kitchen, D.J., Blair, J.M., Callaham Jr., M.A., 2009. Annual fire and mowing alter
biomass, depth distribution, and C and N content of roots and soil in tallgrassprairie. Plant and Soil. doi:10.1007/s11104-009-9931-2.
Knapp, A.K., Briggs, J.M., Hartnett, D.C., Collins, S.L., 1998. Grassland Dynamics: Long-term Ecological Research in Tallgrass Prairie. Oxford University Press, New York.
Lane, D.J., 1991. 16S/23S rRNA sequencing. In: Stackebrandt, E., Goodfellow, M. (Eds.),Nucleic Acid Techniques in Bacterial Systematics. Wiley, New York, pp. 115e175.
Lauber, C.L., Strickland, M.S., Bradford, M.A., Fierer, N., 2008. The influence of soilproperties on the structure of bacterial and fungal communities across land-usetypes. Soil Biology and Biochemistry 40, 2407e2415.
Mann, L.K., 1986. Changes in soil carbon storage after cultivation. Soil Science 142,279e288.
McCune, B., Grace, J.B., 2002. Analysis of Ecological Communities. MjM SoftwareDesign, Gleneden Beach, Oregon.
McLauchlan, K.K., Hobbie, S.E., Post, W.M., 2006. Conversion from agriculture tograssland builds soil organic matter on decadal time scales. Ecological Appli-cations 16, 143e153.
Michelsen, A., Andersson, M., Jensen, M., Kjøller, A., Gashew, M., 2004. Carbonstocks, soil respiration and microbial biomass in fire-prone tropical grassland,woodland and forest ecosystems. Soil Biology and Biochemistry 36, 1707e1717.
Miller, W.P., Miller, D.M., 1987. A micropipette method for soil mechanical analysis.Communications in Soil Science and Plant Analysis 18, 1e15.
Mubyana-John, T., Wutor, V.C., Yeboah, S.O., Ringrose, S., 2007. Fire and its influenceon microbial community structure and soil biochemical properties in theOkavanga delta, Botswana. Scientific Research and Essay 2, 47e54.
Ojima, D.S., Schimel, D.S., Parton, W.J., Owensby, C.E., 1994. Long- and short-termeffects of fire on nitrogen cycling in tallgrass prairie. Biogeochemistry 24,67e84.
Pickett, S.T.A., 1989. Space-for-time substitution as an alternative to long-termstudies. In: Likens, G.E. (Ed.), Long-term Studies in Ecology. Springer-Verlag,New York, pp. 110e135.
Plassart, P., Vinceslas, M.A., Gangneux, C., Mercier, A., Barray, S., Laval, K., 2008.Molecular and functional responses of soil microbial communities undergrassland restoration. Agriculture, Ecosystems and Environment 127, 286e293.
Ransom, M.D., Rice, C.W., Todd, T.C., Wehmueller, W.A., 1998. Soils and soil biota. In:Knapp, A.K., Briggs, J.M., Hartnett, D.C., Collins, S.L. (Eds.), Grassland Dynamics:Long-term Ecological Research in Tallgrass Prairie. Oxford University Press, NewYork, pp. 48e66.
Rice, C.W., Todd, T.C., Blair, J.M., Seastedt, T.R., Ramundo, R.A., Wilson, G.W.T., 1998.Belowground biology and processes. In: Knapp, A.K., Briggs, J.M., Hartnett, D.C.,Collins, S.L. (Eds.), Grassland Dynamics: Long-term Ecological Research inTallgrass Prairie. Oxford University Press, New York, pp. 244e264.
Rice, E.L., Parenti, R.L., 1978. Causes of decreases in productivity in undisturbedtallgrass prairie. American Journal of Botany 65, 1091e1097.
Ross, D.J., Speir, T.W., Tate, K.R., Feltham, C.W., 1997. Burning in a New Zealandsnow-tussock grassland: effects on soil microbial biomass and nitrogen andphosphorus availability. New Zealand Journal of Ecology 21, 63e71.
Samson, F., Knopf, F.,1994.Prairie conservation inNorthAmerica.Bioscience44, 418e421.Schloss, P.D., Handelsman, J., 2005. Introducing DOTUR, a computer program for
defining operational taxonomic units and estimating species richness. Appliedand Environmental Microbiology 71, 1501e1506.
Simmons, B.L., Coleman, D.C., 2008. Microbial community response to transitionfrom conventional to conservation tillage in cotton fields. Applied Soil Ecology40, 518e528.
Singleton, D.R., Furlong, M.A., Rathbun, S.L., Whitman, W.B., 2001. Quantitativecomparisons of 16S rRNA gene sequence libraries from environmental samples.Applied and Environmental Microbiology 67, 4374e4376.
Smith, N.R., Kishchuk, B.E., Mohan, W.W., 2008. Effects of wildfire and harvestdisturbances on forest soil bacterial communities. Applied and EnvironmentalMicrobiology 74, 216e224.
White, D.C., Stair, J.O., Ringleberg, D.B., 1996. Quantitative comparisons of in situmicrobial biodiversity by signature biomarker analysis. Journal of IndustrialMicrobiology and Biotechnology 17, 185e196.
Williams, M.A., Bottomley, P.J., Myrold, D., 2006. Carbon flow from 13C labeled strawand root residues into phospholipids fatty acids of a soil microbial communityunder field conditions. Soil Biology and Biochemistry 38, 759e768.
Woodcock, S., Curtis, T.P., Head, I.M., Lunn, M., Sloan, W.T., 2006. Taxaearea relation-ships for microbes: the unsampled and the unseen. Ecology Letters 9, 805e812.
Wu, T., Chellemi, D.O., Graham, J.H., Martin, K.J., Rosskopf, E.N., 2008. Comparison ofsoil bacterial communities under diverse agricultural land management andcrop production practices. Microbial Ecology 55, 293e310.
Yao, H., Bowman, D., Shi, W., 2006. Soil microbial community structure anddiversity in a turfgrass chronosequence: land-use change versus turfgrassmanagement. Applied Soil Ecology 34, 209e218.