development of liquid cooling for pcs - chalmers...
TRANSCRIPT
Development of Liquid Cooling for PCsComponent Analysis for Factory Sealed SystemsDegree Thesis
Jonas ThorénAnton Widell
Department of Applied MechanicsCHALMERS UNIVERSITY OF TECHNOLOGYGöteborg, Sweden, 2011Report No. 2011:08


Development of Liquid Cooling for PCsComponent Analysis for Factory Sealed Systems
JONAS D. THORÉNANTON O. C. WIDELL
Performed at Fractal Design & Chalmers University of TechnologyExaminer & Supervisor at Chalmers: Karin Munch
Supervisor at Fractal Design: Hannes Wallin
REPORT NO. 2011:08
Department of Applied MechanicsCHALMERS UNIVERSITY OF TECHNOLOGY
Göteborg, Sweden 2011
Development of Liquid Cooling for PCsComponent Analysis for Factory Sealed SystemsJONAS D. THORÉNANTON O. C. WIDELL
© JONAS THORÉN, ANTON WIDELL 2011
Technical report no. 2011:08 ISSN 1652-9901Department of Applied MechanicsChalmers University of TechnologySE 412-96 GöteborgSwedenTelephone + 46 (0)31-772 1000
Cover:Concept sketch showing a factory sealed water cooling in a computer case.
Department of Applied MechanicsGöteborg, Sweden 2011

FörordDenna rapport är ett examensarbete för två studenter på Designingenjörsprogram-met vid Chalmers Tekniska Högskola, utfört i samarbete med FD Sweden AB (Fractal Design). Arbetets omfattning är 15 högskolepoäng, vilket motsvarar en halv termins heltidsstudier, och utfördes under våren 2011.
Vi vill tacka våra handledare, Karin Munch (Chalmers) och Hannes Wallin (Fractal Design), för de råd och det stöd de gett oss under projektets gång, samt Fractal Design för att de tillhandahållit lokaler och de produkter som använts vid testningarna.


Development of Liquid Cooling for PCsComponent Analysis for Factory Sealed SystemsJONAS D. THORÉNANTON O. C. WIDELLDepartment of Applied MechanicsChalmers University of Technology
AbstractIn recent years, existing solutions for cooling personal computer CPUs have been
supplemented by a new product category, factory sealed water cooling loops. These sys-tems, consisting of a water block with an integrated pump, a fan and a radiator, perform well compared to the air cooling solutions but are less effective than larger, custom-built water cooling systems.
This project aims to explore the most important aspects of a factory sealed system and to identify possible cost-effective enhancements of the performance.
The most significant differences between the different groups of water cooling loops are the block design and the pumping power. The performance of both categories is also largely dependent on the fan power, but increasing fan power has a large negative impact on the noise level.
Both radiator size and fan model choice appear, in tests, to be relatively unimportant, presuming that the noise level is kept constant. The position and direction of the fan, however, has significant impact on both the temperature and the sound level.
Water blocks can be designed in several different ways, both regarding the heatsink design and the flow direction. In simulation, flow with the inlet centered above the heatsink result in considerably lower pressure drop and slightly higher temperatures than flow through the block, for heatsinks with fin arrays.
Creating a competitive product in this product segment certainly seems possible, as there are performance-increasing changes to be made that seemingly has little impact on the production cost. Computer simulations are deemed to be suitable for the devel-opment of the block.
Keywords: Water, Liquid, Cooling, Electronics, Personal Computer, Heatsink


Development of Liquid Cooling for PCsComponent Analysis for Factory Sealed SystemsJONAS D. THORÉNANTON O. C. WIDELLInstitutionen för tillämpad mekanikChalmers Tekniska Högskola
SammanfattningProduktkategorin kylare för persondatorers processorer har under de senaste åren
utökats med en ny undergrupp, fabriksförslutna vattenkylningssystem. Dessa system, bestående av fläkt, radiator samt ett vattenblock med integrerad pump, presterar väl jämfört med luftkylningsalternativen, men har lägre kylförmåga än mer omfattande, användarbyggda vattenkylningssystem.
Detta projekt syftar till att utforska vilka produktaspekter som begränsar prestandan av ett fabriksförslutet system, samt diskutera möjliga kostnadseffektiva förbättringar.
De mest signifikanta skillnaderna mellan de olika kategorierna av vattenkylningssys-tem är dels utformningen av blocken och dels pumpstyrkan. Prestandan kan i båda fallen ökas avsevärt genom starkare fläktar, men då på bekostnad av ljudnivån.
Både radiatorstorlek och valet av fläkt har, i tester, visat sig ha relativt liten inverkan på prestandan, givet konstant ljudnivå. Fläktens placering och rikting i relation till ra-diatorn har dock betydande inverkan på både temperatur och ljudnivå.
Vattenblock kan utformas enligt flera olika principer, både när det gäller kylfläns-ens utformning och flödets riktning. För kylflänsar med flänskorridorer ger flöde med centrerat inlopp ovanför kylflänsen avsevärt lägre tryckfall men enbart något högre temperatur än flöde rakt igenom kylflänsen.
Det bedöms finnas goda möjligheter att utveckla konkurrenskraftiga produkter inom denna produktkategori, då signifikanta förbättringar av prestandan troligtvis kan genomföras utan stora ökningar av produktionskostnaden. Datorsimulering bedöms vara mycket lämpligt vid utveckling av vattenblocket.
Rapporten är skriven på engelska.
Nyckelord: Vattenkylning, kylning, elektronik, persondator, kylfläns


Contents
Terminology 1Acronyms. . . . . . . . . . . . . . . . . . . . . . . . . . . . . . . . . . . . . . . . . . . . . . . . . . . . . . . . . . . . . . . 1Nomenclature . . . . . . . . . . . . . . . . . . . . . . . . . . . . . . . . . . . . . . . . . . . . . . . . . . . . . . . . . . . 1Terms . . . . . . . . . . . . . . . . . . . . . . . . . . . . . . . . . . . . . . . . . . . . . . . . . . . . . . . . . . . . . . . . . . 1
1. Introduction 21.1. Purpose of the Study . . . . . . . . . . . . . . . . . . . . . . . . . . . . . . . . . . . . . . . . . . . . . . . . . . 31.2. Research Questions . . . . . . . . . . . . . . . . . . . . . . . . . . . . . . . . . . . . . . . . . . . . . . . . . . . 31.3. Delimitations . . . . . . . . . . . . . . . . . . . . . . . . . . . . . . . . . . . . . . . . . . . . . . . . . . . . . . . . 3
2. Theory and Literature Review 42.1. Heat Transfer Theory. . . . . . . . . . . . . . . . . . . . . . . . . . . . . . . . . . . . . . . . . . . . . . . . . . 42.2. Fluid Flow Theory . . . . . . . . . . . . . . . . . . . . . . . . . . . . . . . . . . . . . . . . . . . . . . . . . . . . 52.3. Literature on Heatsink Design. . . . . . . . . . . . . . . . . . . . . . . . . . . . . . . . . . . . . . . . . . 52.4. Literature on Other Aspects of the Product. . . . . . . . . . . . . . . . . . . . . . . . . . . . . . . 7
3. Method 83.1. Experimental Testing . . . . . . . . . . . . . . . . . . . . . . . . . . . . . . . . . . . . . . . . . . . . . . . . . . 8
3.1.1. Reference Products . . . . . . . . . . . . . . . . . . . . . . . . . . . . . . . . . . . . . . . . . . . . . . . 83.1.2. Component Testing . . . . . . . . . . . . . . . . . . . . . . . . . . . . . . . . . . . . . . . . . . . . . . . 8
3.2. Computer Fluid Dynamics Simulation . . . . . . . . . . . . . . . . . . . . . . . . . . . . . . . . . . . 8
4. Testing Results 94.1. System Tests of Cooling Solutions . . . . . . . . . . . . . . . . . . . . . . . . . . . . . . . . . . . . . . . 94.2. Comparisons of Various Components . . . . . . . . . . . . . . . . . . . . . . . . . . . . . . . . . . . 11
4.2.1. CPU Water Blocks . . . . . . . . . . . . . . . . . . . . . . . . . . . . . . . . . . . . . . . . . . . . . . . 114.2.2. Radiators . . . . . . . . . . . . . . . . . . . . . . . . . . . . . . . . . . . . . . . . . . . . . . . . . . . . . . . 114.2.3. Fans . . . . . . . . . . . . . . . . . . . . . . . . . . . . . . . . . . . . . . . . . . . . . . . . . . . . . . . . . . . 124.2.4. Brief Examination of the Impact of Tubing and Liquid . . . . . . . . . . . . . . . . 124.2.5. Thermal Compound . . . . . . . . . . . . . . . . . . . . . . . . . . . . . . . . . . . . . . . . . . . . . 13
4.3. Testing of Different Fan Configurations . . . . . . . . . . . . . . . . . . . . . . . . . . . . . . . . . 134.4. Simulation Testing on Heatsink Flow Direction . . . . . . . . . . . . . . . . . . . . . . . . . . 15
5. Performance Considerations 175.1. Radiator . . . . . . . . . . . . . . . . . . . . . . . . . . . . . . . . . . . . . . . . . . . . . . . . . . . . . . . . . . . 17
5.1.1. Radiator Size. . . . . . . . . . . . . . . . . . . . . . . . . . . . . . . . . . . . . . . . . . . . . . . . . . . . 175.1.2. Flow Velocity and Direction . . . . . . . . . . . . . . . . . . . . . . . . . . . . . . . . . . . . . . 18

5.1.3. Radiator Material. . . . . . . . . . . . . . . . . . . . . . . . . . . . . . . . . . . . . . . . . . . . . . . . 195.1.4. Reservoir . . . . . . . . . . . . . . . . . . . . . . . . . . . . . . . . . . . . . . . . . . . . . . . . . . . . . . 20
5.2. Water Block . . . . . . . . . . . . . . . . . . . . . . . . . . . . . . . . . . . . . . . . . . . . . . . . . . . . . . . . 205.2.1. Main Block Material and Size. . . . . . . . . . . . . . . . . . . . . . . . . . . . . . . . . . . . . . 205.2.2. Flow Through the Heatsink. . . . . . . . . . . . . . . . . . . . . . . . . . . . . . . . . . . . . . . . 215.2.3. Heatsink Type . . . . . . . . . . . . . . . . . . . . . . . . . . . . . . . . . . . . . . . . . . . . . . . . . . . 225.2.4. Flow Between Pump and Heatsink . . . . . . . . . . . . . . . . . . . . . . . . . . . . . . . . . 235.2.5. Heatsink Shape and Flow Concentration . . . . . . . . . . . . . . . . . . . . . . . . . . . . 23
5.3. Thermal Compound. . . . . . . . . . . . . . . . . . . . . . . . . . . . . . . . . . . . . . . . . . . . . . . . . . 245.4. Fans . . . . . . . . . . . . . . . . . . . . . . . . . . . . . . . . . . . . . . . . . . . . . . . . . . . . . . . . . . . . . . . 24
5.4.1. Fan Models . . . . . . . . . . . . . . . . . . . . . . . . . . . . . . . . . . . . . . . . . . . . . . . . . . . . . 245.4.2. Number of Fans . . . . . . . . . . . . . . . . . . . . . . . . . . . . . . . . . . . . . . . . . . . . . . . . . 255.4.3. Required Air Pressure . . . . . . . . . . . . . . . . . . . . . . . . . . . . . . . . . . . . . . . . . . . . 255.4.4. Fan Configuration . . . . . . . . . . . . . . . . . . . . . . . . . . . . . . . . . . . . . . . . . . . . . . . 255.4.5. Automatic Fan Speed . . . . . . . . . . . . . . . . . . . . . . . . . . . . . . . . . . . . . . . . . . . . . 25
5.5. Pump . . . . . . . . . . . . . . . . . . . . . . . . . . . . . . . . . . . . . . . . . . . . . . . . . . . . . . . . . . . . . . 265.5.1. Pump Strength . . . . . . . . . . . . . . . . . . . . . . . . . . . . . . . . . . . . . . . . . . . . . . . . . . 265.5.2. Pump Efficiency . . . . . . . . . . . . . . . . . . . . . . . . . . . . . . . . . . . . . . . . . . . . . . . . . 27
5.6. Tubing . . . . . . . . . . . . . . . . . . . . . . . . . . . . . . . . . . . . . . . . . . . . . . . . . . . . . . . . . . . . . 275.6.1. Inner Diameter . . . . . . . . . . . . . . . . . . . . . . . . . . . . . . . . . . . . . . . . . . . . . . . . . . 275.6.2. Material . . . . . . . . . . . . . . . . . . . . . . . . . . . . . . . . . . . . . . . . . . . . . . . . . . . . . . . 28
5.7. Liquid . . . . . . . . . . . . . . . . . . . . . . . . . . . . . . . . . . . . . . . . . . . . . . . . . . . . . . . . . . . . . 295.8. Mounting Hardware . . . . . . . . . . . . . . . . . . . . . . . . . . . . . . . . . . . . . . . . . . . . . . . . . 29
6. Concluding Remarks 306.1. Development Potential . . . . . . . . . . . . . . . . . . . . . . . . . . . . . . . . . . . . . . . . . . . . . . . 30
Reference List 31
Appendix A. Testing Details I
Appendix B. Line Graphs of Temperature V
Appendix C. Automatic Fan & Pump Speed IX

1
TerminologyAcronyms
CFD – Computer Fluid DynamicsCFM – Cubic Feet per Minute, 1 CFM equals 1700 liters per hourCPU – Central Processing Unit, the main heat source in the computer. The CPU die
is the CPU integrated circuit, which is mounted on a much larger circuit board and covered by an IHS, then installed on the motherboard
DIY – Do It Yourself, custom built system assembled by the customerID – Inner Diameter (used for tubing)IHS – Integrated Heat Spreader, the aluminum casing of the CPU diePWM – Pulse-Width Modulation, a standard for controlling the power usage of electri-
cal devicesRPM – Rotations Per Minute (used for fans and pumps)SPL – Sound Pressure Level, here measured in dB(A)
Nomenclature
ΔP / Pressure drop / Head loss – the pressure lost when forcing a fluid through a system. To have the same flow rate, a stronger pump is needed if the pressure drop is higher
ΔT / Temperature delta – the difference in temperaturek – Thermal conductivity of a fluid or solidQ – Heat flux, the amount of heat dissipated through the system per time unit
Terms
Coolant – The fluid used in the systemFin / Microfin – Pin / micropin with considerably larger length than width, typically the
fin length covers the entire heatsinkHeatsink – Metal component used for transferring heat to a fluid. High-performance
water heatsinks are typically designed with microfins or micropinsPin / Micropin – Protruding piece of the heatsink base, primarily increasing the fluid-
solid contact area. Pins with width less than one millimeter are often called micropinsSocket / Processor Socket / CPU Socket – Refers to the interface between the CPU
and the motherboard. Typically, many other motherboard specifications are kept un-changed for all motherboards with the same socket
Thermal Compound/Paste/Grease / TIM (Thermal Interface Material) – Compound, typically ceramic-based, used to fill microscopic gaps between two metal surfaces
2
1. IntroductionToday, the most common method for thermal management of computer chips is air
cooling, where the heat gets transported from the chip to a directly adjacent metal block, then transported either through solid metal or through heat pipes to a heatsink, from where the heat is transferred to the surrounding air. Heat pipes are sealed metal pipes, usually made of copper, containing only a small amount of liquid and vacuum. With water cooling, water in tubes transfer the heat from the block to the fins. Thus, the water in water cooling replaces copper rather than air.
The main advantages of water cooling, compared to conventional air cooling, are that the distance between the heat source and the heatsink can be longer and that the heatsink may be larger than what is possible in a usually restricted space around the heat source.
Traditionally, water cooling has only been used by a small group of computer users with considerable technical knowledge and interest. Now, however, factory sealed water cooling products are getting introduced to the market, which eliminates much of the hassle and the risk of traditional solutions. These products give the user roughly the same performance as the top-of-the-line air coolers, at roughly the same price point, rather than being fully comparable to the more expensive and more powerful user-built water cooling systems.
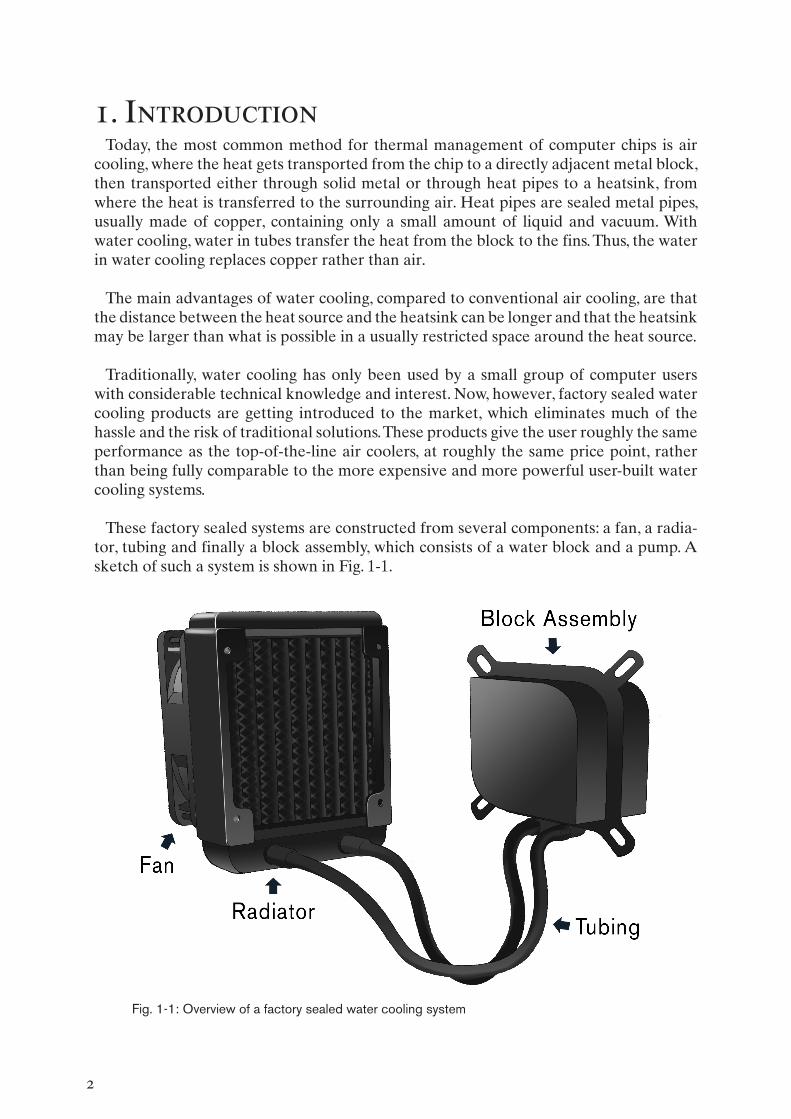
These factory sealed systems are constructed from several components: a fan, a radia-tor, tubing and finally a block assembly, which consists of a water block and a pump. A sketch of such a system is shown in Fig. 1-1.
Fig. 1-1: Overview of a factory sealed water cooling system

3
1.1. Purpose of the StudyThe present project aims to examine the components of a factory sealed water cooling
system, both by physical testing and by theoretical analysis. For each component, the impact of different subcomponent design options on the total system performance will be evaluated.
1.2. Research Questions• Is it possible to develop a liquid cooling product which can offer performance im-
provements compared to the best factory sealed solutions on the market, without making changes that substantially affect the product price?
• Which components have the largest impact on the performance of the system and which aspects of these components determine the performance?
1.3. Delimitations• For the construction of the pump and the fans, only the requirements on the com-
ponent from a system perspective will be considered rather than the function and design of the sub-components.
• While the performance impact will be examined, thermal compound composition will not be considered.
• As the radiator is presumed to be purchased from a third party, no actual opti-mization of the radiator will be performed. Instead, different aspects of radiator design will be considered only as part of the radiator choice guidelines.
• Liquid composition will only be touched upon briefly in testing and theory.
• User opinions will only be studied through online data, such as forums and review sites. For this product category, very well-described opinions are widely available online
• While manufacturing will be considered for all parts, no calculations or tests on manufacturing possibilities will be made.
• The cost aspect is to be evaluated only through estimations by the authors and by the developing staff at Fractal Design.

4
2. Theory and Literature Review2.1. Heat Transfer Theory
The rate of heat transfer between a solid and a fluid, or vice versa, depends on several variables: contact area, temperature difference, average fluid velocity, thermal conduc-tivity of the fluid as well as the relation between thermal and velocity boundary layers in the fluid, known as the Prandtl number (Çengel and Turner, 2005).
For turbulent flow in tubes, considered in the present project a sufficient approxima-tion for the theoretical understanding, the total heat conductance can be described by Newton’s second law of cooling, the definition of the Nusselt number and the Colburn equation (2-1).
Q = A ∙ ΔT ∙ 0.023 ∙ Re0.8 ∙ Pr1/3 ∙ k
(2-1)D
Here, A is the contact surface area, ΔT is the temperature difference, Re is the Reyn-olds number, Pr is the Prandtl number, k is the thermal conductivity of the fluid and D is the characteristic length of the geometry. The Reynolds number is defined as Re = V ∙ D / v, where V is the average velocity and v is the kinematic viscosity of the fluid.
Hence, apart from the variables that are dependant of the fluid composition (k, Pr and v), Q is proportional to A, ΔT, V0.8 and D-0.2. Thus, for example, doubling the area will cut the temperature difference in half, given no other changes. Changing the velocity will have affect the temperature almost as much, while altering the characteristic length has considerably less (and reversed) theoretical impact.
The thermal properties of the solid is only relevant for the solid-fluid transmission through the temperature difference, as it is the surface temperature of the solid that counts. Heat conduction through a solid is determined by Fourier’s law of heat conduc-tion (2-2), where k is the thermal conductivity of the material, A is the area, ΔT is the temperature difference and L is the thickness of the material.
-Q = k ∙ A ∙ ΔT
(2-2)L
There are two materials with much better thermal conductivity to cost ratio than all others, these being copper and aluminum. Typical thermal conductivity values for these metals in their pure form are shown in table 2-1, but it should be noted that aluminum alloys with lower conductivity are often used in practice.
Table 2-1: Thermal Conductivity of Copper and Aluminum
Material k [W ∙ m-1 ∙ °C-1]
Copper 401
Aluminum 237

5
2.2. Fluid Flow TheoryWith water as liquid, the flow regime is likely to be turbulent in all parts, at all relevant
flow rates. In a pipe, the pressure drop through the pipe length is dependent on the pipe length L and characteristic length D, the velocity v, the density ρ and the Darcy friction factor f (2-3). The friction factor depends on the relative roughness of the pipe and the Reynolds number, which, in turn, depends on the velocity, the characteristic length and the viscosity of the fluid.
ΔP = f ∙ L ∙ ρ ∙ V2
(2-3)2 ∙ D
Since f is determined by the implicit Colebrook equation, the effect of changes can-not be explicitly written. For example, decreasing the characteristic length will increase ΔP both directly and indirectly by increasing f through decreasing Re; increasing V will increase ΔP quadratically directly but also indirectly decrease the pressure drop through decreasing f. In general, the pressure drop is high if the velocity is high and the charac-teristic length is low.
As for pumping power, the total flow energy is proportional both to the pressure and to the velocity squared, severely limiting the maximum possible velocity attainable without massive energy consumption.
2.3. Literature on Heatsink DesignWhile early liquid cooling systems, such as the prototype developed by Lee et al. (1992),
used curved multi-pass channels in their block designs, modern water blocks, both com-mercial and experimental, typically use copper pins or fins that protrude from the main block core.
As early as 1981, Tuckerman and Pease proposed using water-cooled micro-channel heatsinks for thermal management of computer circuits. Since then, several research projects have attempted to determine the optimal shape for the heatsink, but as the results are highly dependent on both the chamber geometries and the flow rate, results may not be applicable for other conditions than tested.
Xie et al. (2008) examine the thermal resistance versus the pressure drop for different channel heights and different fin spacings. They find the optimal fin thickness and bot-tom thicknesses to be 0.3 mm and 0.2 mm, respectively, for a 20 mm * 20 mm fin-type heatsink with 6 mm high fins and 0.5 mm fin spacing.
In an extensive study of fin thickness and density, Li and Peterson (2006) show both that a ratio of 0.7 between fin width and pitch is optimal for both fin height 0.36 mm and 0.18 mm and that a fin density of around 120 fins per 10 mm base area is optimal on both heights. However, the tests were made with extremely weak (but constant) pumping power (0.02W), which likely means that the fin density is far too high for the present application.

6
Jasperson et al. (2010) compare pins and fins, but are using extremely small dimensions (0.2 mm fin width and spacing, 0.67 mm fin height). Therefore, both the fin and the pin variants are extremely restrictive, with pressure drops between 2 and 5 kPa at 3.6 liters per hour flow rate. Also, they do not compare the thermal resistance for a given com-bination of flow rate and pressure drop, but rather a combination of flow rate and pin dimensions. In another comparison between pins and fins, Salem et al. (2005) show that very thin and densely placed micro-fins (0.14 mm fin spacing) perform significantly bet-ter than a sparse array of very large pins intended for air cooling (2.4 mm pin diameter, 19 mm pin height). Salem et al. also show that the performance of the air heatsink could be significantly improved by reducing the pin height from 19 to 10 mm.
In a comparison between different pin shapes by Bauman et al. (2001), diamond-shaped pins outperformed a number of other forms. However, that test is made with much larger pins than found on modern top performance water blocks. John et al. (2010) compare temperature to pressure drop not only between square and circular pins, but also with different axial and transversal pitches. They conclude that the optimal choice depend on the Reynolds number, but their tests occur at far lower Reynolds numbers than likely found in actual products. Even though they perform their tests with water, the highest tested Reynolds number is 500, corresponding to very low velocities.
Jasperson et al. (2010) also discuss the plausibility of different manufacturing tech-niques for microchannel and micropin production. They consider casting, extrusion and sintering the viable options for mass production. Out of these, extrusion is only available for microfins, while casting and sintering can be used to produce heatsinks of either type.
In an investigation into the optimal heatsink shape for a automotive DC/DC current converter, Pickert et al. (2010) show that elliptical pins gives the system better thermal conductivity than other pin shapes, while actually resulting in slightly less pressure drop than plain fins.
In one of a very limited number of studies where the water flow through the heatsink is not parallel to the heated surface, Tsunekane and Taira (2007) determine that there is a large advantage in using microfins for cooling a high-powered laser. Out of the two tested fin widths, 0.14 mm and 0.3 mm, 0.14 mm proves to be the best choice. However, it should be noted that this test is performed with pump pressure more than one order of magnitude larger (0.2 MPa) than the pump pressures used in computer water cooling.
Older research papers mostly depend on experimental measurements, while recent projects often include CFD (Computational Fluid Dynamics) simulations, a branch of finite element analysis. Since correctly simulating the flow becomes significantly more extensive computationally with an increase in pin number, some researchers propose simplified models, such as the porous medium model used by Yu and Joshi (2002).
To summarize, while there has been numerous studies on heat sink optimization, the conclusion has to be drawn that the preferred design type is application-dependent. The results from the various studies can likely serve as excellent guidelines for choosing a decent starting point, and the methods used, especially the CFD analysis, could be used for developing and optimizing a water block for a factory sealed system.

7
2.4. Literature on Other Aspects of the ProductStern et al. (2009), a group affiliated with Sun Microsystems, attempt to outline a
comprehensive set of testing methods for closed-loop liquid cooling systems for comput-ers, primarily regarding time degradation and external handling. The issues these tests attempt to reduce should be taken into consideration during the product development.
Nanofluids, a base liquid with metallic or non-metallic nanometer particles, have been shown to increase the thermal conductivity significantly (Choi and Eastman, 1995). In a test with a microchannel heatsink by Ho et al. (2009), the largest advantage was found to be about 70% at the largest flow rate tested, a flow rate that required relatively little pumping power (less than 1W). While cost restrictions may decrease the importance of these findings for the present project type, evaluating the cost could be worthwhile.

8
3. MethodA major part of the project focused on evaluating existing products in experimental
studies. The experimental analysis of the sub-components was then supplemented by a theoretical analysis, focusing on the parts estimated to be the most important for the performance of the product.
3.1. Experimental TestingThe competitor product evaluation was done through experimental testing in a con-
trolled environment. The testing was designed to be as close as possible to standard procedure for reviews on products in this segment, partly since its prevalence is due to a common acceptance of its relevance and partly because the sales of the product are presumed to depend heavily on such tests performed by reviewers.
To acquire as relevant results as possible, the testing equipment, such as the other computer parts, was chosen to mirror a standard setup for a typical user. The tests were thus performed using standard components installed in a standard computer case, and with normal external conditions. Details of the testing procedure, as well as a list of the components in the testing system, can be found in Appendix A.
3.1.1. Reference ProductsA total of eleven cooling products were chosen for testing. Four of these were air cool-
ers, Intel Stock, Scythe Shuriken, Gelid Tranquillo and Noctua NH-U12P SE. Various factory sealed water cooling products made up for five of the remaining products, Antec Kühler H2O 620, Corsair H50, Corsair H70, CoolIT Vantage ECO and AVC Hercules Pro, and finally, two DIY systems were chosen, XSPC Rasa 750 RX240 kit and Swiftech X2O 320 kit.
3.1.2. Component TestingFurther component tests were done, both using parts of the water cooling products and
using other DIY components in different, for the project relevant, combinations. These include tests of CPU water blocks, radiators, fans, tubing, liquid, thermal compound and fan configurations.
3.2. Computer Fluid Dynamics SimulationComputer simulations of both fluid flow and heat transfer was done in ANSYS, a com-
mercial software package that was used in several of the studies mentioned in chapter 2.3. Simulating this type of fluid flow problems is an iterative process, where changes of a large number of parameters in the design can be made indefinitely to change the performance of the water block.

9
4. Testing Results4.1. System Tests of Cooling Solutions
The results over time of the main product tests can be seen in Fig. 4-1. As the reporting interval of the CPU is 1°C, a bar graph may be misleading. Therefore, in addition to the bar charts shown in this chapter, the temperature over time is also available for most tests as line graphs in Appendix B.
0 10 20 30 40 50
Scythe ShurikenIntel Stock
Noctua NH-U12P SEAVC Hercules Pro
Gelid TranquilloCoolIT Vantage ECO
Antec Kühler H2O 620Corsair H50Corsair H70
XSPC Rasa RS 240
XSPC Rasa RS 240Swiftech X20-320 Silent
Swiftech X20-320
Temperature [°C]
Temperature rise, ambient to lowest temperature at hottest core at idleTemperature rise, ambient to highest temp at hottest core at load
Fig. 4-1: CPU temperature with various cooling solutions. Tests with grey background were con-ducted outside the computer case (see next page).
It can be noted that the products have gathered in four different groups based on their performance. The first group consists of the Intel Stock and Scythe Shuriken coolers, which are both air coolers in the low price range. Both performed poorly, as the tests had to be aborted since the maximum CPU temperature (set in OCCT) of 75°C was reached in both instances. Hence the corresponding lines in the graphs reaches comparatively high temperatures and ends prematurely.
Larger air coolers from Gelid and Noctua plus two of the factory sealed water cooling products from AVC and CoolIT make up the second group. The air coolers peak at about 42°C, where the Gelid has a slight edge over its Noctua counterpart, with the AVC and CoolIT units performing in approximately the same range. It can be argued that the CoolIT Vantage ECO may perform better compared to the others at higher tempera-tures, since its integrated pump is controlled by a sensor close to the liquid coolant in the system. During the tests the pump was working at a relatively low speed, which could mean that the coolant was not hot enough for the pump to increase its rotation speed.

10
Higher temperature from the CPU would lead to higher coolant temperature, and could possibly mean that the product would close in on the next group.
The remaining factory sealed water cooling products, from Corsair and Antec, seem to have a considerably higher cooling capacity, and form a group of their own. Consider-ing that all three products are developed by Asetek and have a very similar design, the results correspond well with each other. It should be noted that the Antec Kühler would have performed closer to the Corsair products if the fan had been installed in an intake position, where the air would travel forwards, instead of in the exhaust setup that was depicted in the manual of the product (see chapter 4.3).
A single system, the XSPC Rasa 750 RX240 kit, can be found even further down, rising to about only 31°C for the duration of the test, and thus forming the fourth and last group of the test.
Further tests were done using one additional DIY water cooling system, the Swiftech X2O-320 Edge, in comparison to the already tested XSPC Rasa 750 RX240 kit. Three tests were completed in this session, and the results can be seen in the upper section of Fig. 4-1. All three tests were done with the cooling systems placed outside the case, as the Swiftech system was unable to fit into the chassis. In this test the XSPC system measured about one to two degrees lower compared to the previous test, which is natural as the air in the room is a few degrees colder than the case air.
Still, the XSPC kit was outperformed by its Swiftech counterpart by quite a margin. However, the Swiftech radiator measured 360 mm, and three powerful fans were at-tached to it, making the system reach very high noise levels. Therefore a second test of this system was conducted, now with the fans installed to a fan control and the pump connected to a PWM control, reducing the noise considerably. In this test the Swiftech kit performed slightly better than the XSPC system regarding temperature levels, but were significantly quieter.
35 40 45 50 55
Noctua, Both stock fansScythe Shuriken
Intel StockGelid Tranquillo
Corsair H50Corsair H70
Antec Kühler H2O 620CoolIT Vantage ECO
AVC Hercules ProXSPC Rasa RS 240
Swiftech X20-320Swiftech X20-320 Silent
XSPC Rasa
SPL, dB(A)
SPL, idle SPL, load
Fig. 4-2: Recorded sound pressure levels of the cooling solutions

11
The sound pressure levels reached by the different systems (Fig. 4-2) varied between 39 dB(A) and 51 dB(A). In this regard, the air cooling systems, the CoolIT and the second Swiftech configuration performed well, while the Corsair H70, the AVC Hercules and the XSPC kit performed significantly worse. Apart from the first, full power, test with the Swiftech, the H70 was loudest at around 47 dB(A).
Regarding the perception of the sounds, it can be noted that both the H70 and the Intel Stock fan was perceived to be louder than the chart conveys, while the H50 was perceived as rather quiet, considering the SPL.
4.2. Comparisons of Various ComponentsWhile all the components that are involved in the heat transfer have an impact on
the system temperature (since the exit temperature of one subsystem is the entry tem-perature of the next), some are bound to have more impact on the total temperature difference through the system than others.
To assess the relative importance of the different components, several rounds of tests were performed with only one component changing between different test runs.
4.2.1. CPU Water BlocksIn order to assess the importance of the CPU water block, five blocks from different
systems were tested using the Swiftech pump and radiator. Since this pump is relatively powerful, this test is likely to favor high resistance blocks as the pump works near its maximum flow rate.
In the test, the Swiftech Apogee block performed extremely well, while the XSPC Rasa block barely out-performed the two Asetek blocks from the Corsair H50 and H70. With a temperature gap of more than five degrees to the H50, the block from the AVC Hercules did not perform very well under these circumstances (Fig. 4-3).
0 10 20 30 40 50
H50
AVC Hercules
H70
Rasa
Apogee
Temperature [°C]
Fig. 4-3: CPU temperature with various water blocks
4.2.2. RadiatorsThe temperature difference span induced by the various radiators was, for the most
part, very slim (Fig. 4-4). With the exception of the Magicool 280, all the radiators reached a maximum system temperature within a span of 2°C.
12
0 10 20 30 40 50
H70
H50
AVC 120
AVC 240
Unknown 240
XSPC RS240
XSPC RX120
XSPC RX240
Magicool 280
Temperature [°C]
Fig. 4-4: CPU temperature with various radiators
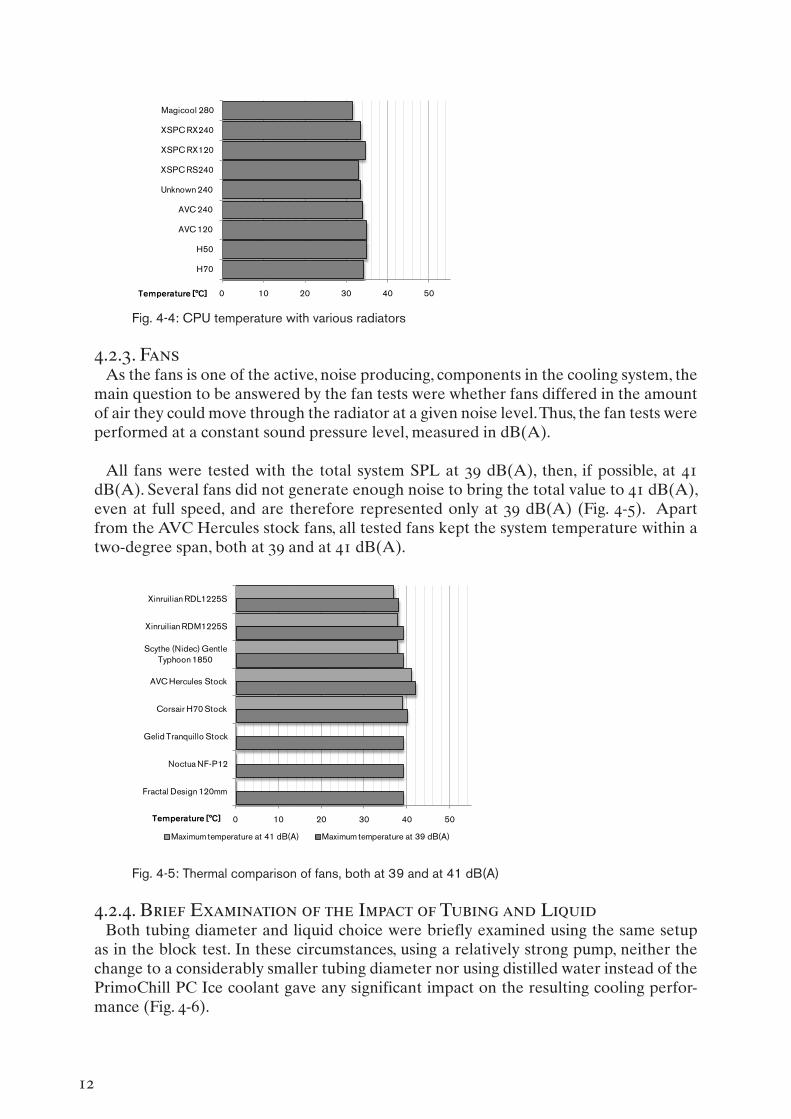
4.2.3. FansAs the fans is one of the active, noise producing, components in the cooling system, the
main question to be answered by the fan tests were whether fans differed in the amount of air they could move through the radiator at a given noise level. Thus, the fan tests were performed at a constant sound pressure level, measured in dB(A).
All fans were tested with the total system SPL at 39 dB(A), then, if possible, at 41 dB(A). Several fans did not generate enough noise to bring the total value to 41 dB(A), even at full speed, and are therefore represented only at 39 dB(A) (Fig. 4-5). Apart from the AVC Hercules stock fans, all tested fans kept the system temperature within a two-degree span, both at 39 and at 41 dB(A).
0 10 20 30 40 50
Fractal Design 120mm
Noctua NF-P12
Gelid Tranquillo Stock
Corsair H70 Stock
AVC Hercules Stock
Scythe (Nidec) Gentle Typhoon 1850
Xinruilian RDM1225S
Xinruilian RDL1225S
Temperature [°C]
Maximum temperature at 41 dB(A) Maximum temperature at 39 dB(A)
Fig. 4-5: Thermal comparison of fans, both at 39 and at 41 dB(A)
4.2.4. Brief Examination of the Impact of Tubing and LiquidBoth tubing diameter and liquid choice were briefly examined using the same setup
as in the block test. In these circumstances, using a relatively strong pump, neither the change to a considerably smaller tubing diameter nor using distilled water instead of the PrimoChill PC Ice coolant gave any significant impact on the resulting cooling perfor-mance (Fig. 4-6).
13
0 10 20 30 40 50
Apogee
Apogee - Thin tubes
Apogee - Water
Temperature [°C]
Fig. 4-6: Performance impact of using a different liquid and different tubing diameter
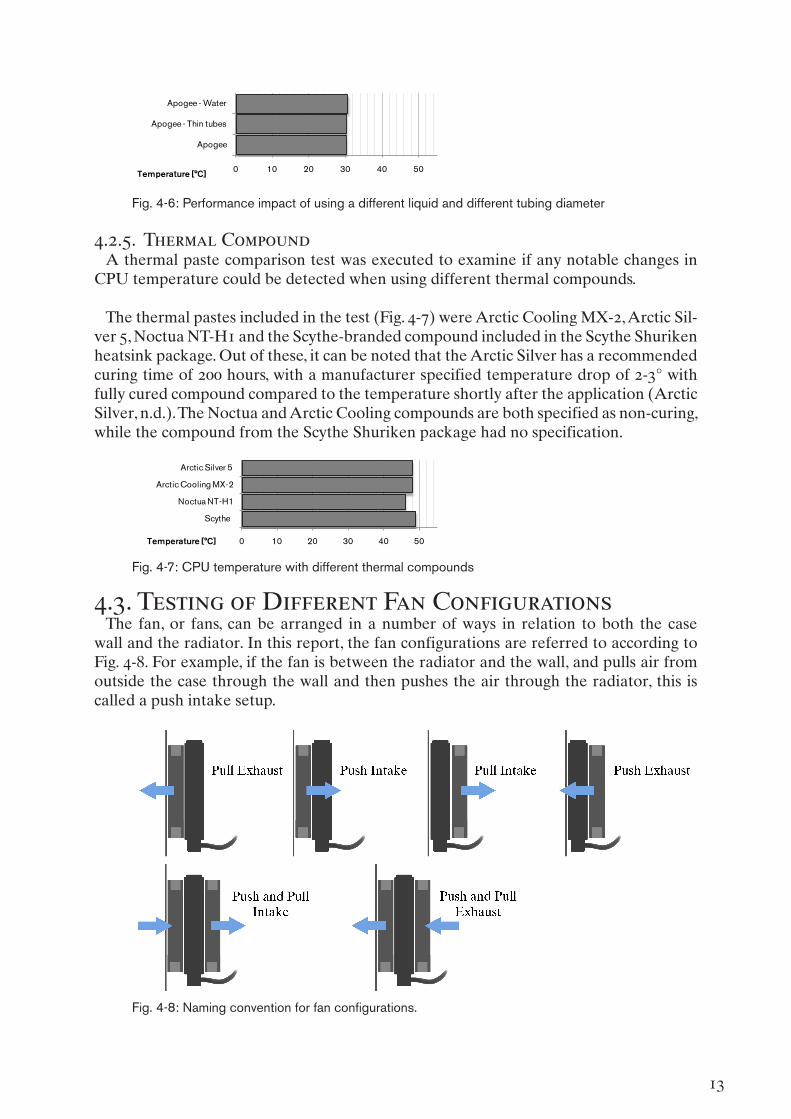
4.2.5. Thermal CompoundA thermal paste comparison test was executed to examine if any notable changes in
CPU temperature could be detected when using different thermal compounds.
The thermal pastes included in the test (Fig. 4-7) were Arctic Cooling MX-2, Arctic Sil-ver 5, Noctua NT-H1 and the Scythe-branded compound included in the Scythe Shuriken heatsink package. Out of these, it can be noted that the Arctic Silver has a recommended curing time of 200 hours, with a manufacturer specified temperature drop of 2-3° with fully cured compound compared to the temperature shortly after the application (Arctic Silver, n.d.). The Noctua and Arctic Cooling compounds are both specified as non-curing, while the compound from the Scythe Shuriken package had no specification.
0 10 20 30 40 50
Scythe
Noctua NT-H1
Arctic Cooling MX-2
Arctic Silver 5
Temperature [°C]
Fig. 4-7: CPU temperature with different thermal compounds
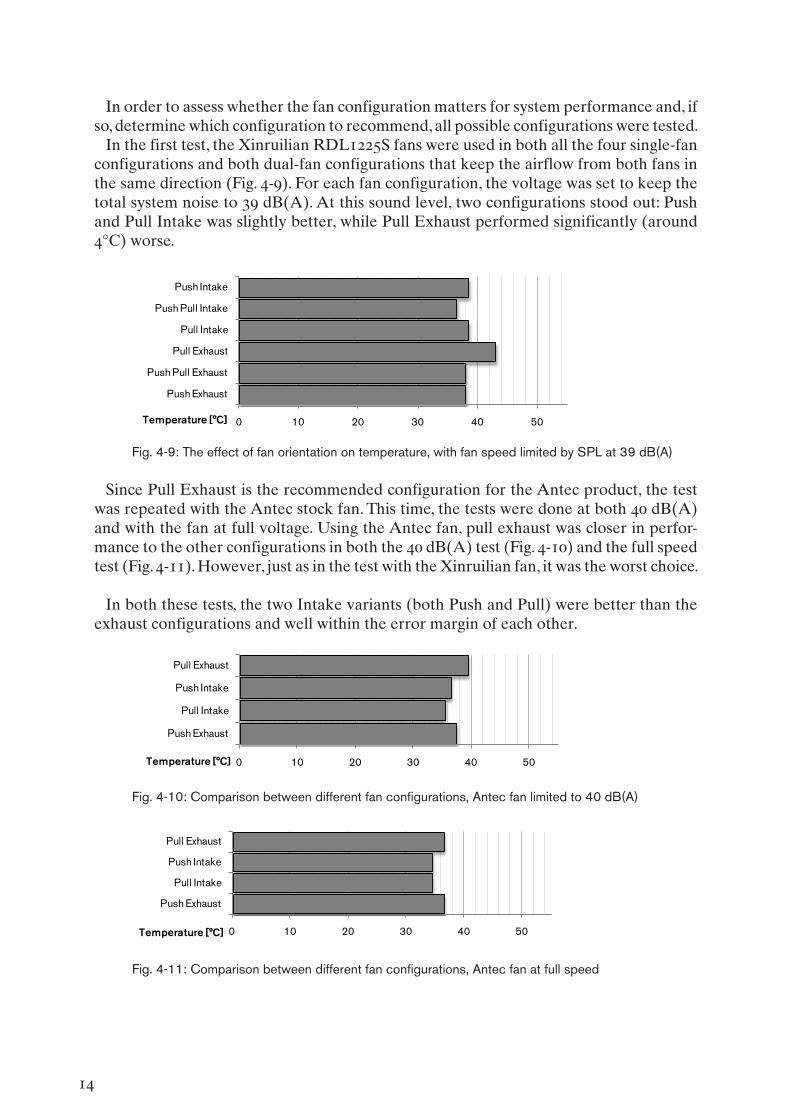
4.3. Testing of Different Fan ConfigurationsThe fan, or fans, can be arranged in a number of ways in relation to both the case
wall and the radiator. In this report, the fan configurations are referred to according to Fig. 4-8. For example, if the fan is between the radiator and the wall, and pulls air from outside the case through the wall and then pushes the air through the radiator, this is called a push intake setup.
Fig. 4-8: Naming convention for fan configurations.
14
In order to assess whether the fan configuration matters for system performance and, if so, determine which configuration to recommend, all possible configurations were tested.
In the first test, the Xinruilian RDL1225S fans were used in both all the four single-fan configurations and both dual-fan configurations that keep the airflow from both fans in the same direction (Fig. 4-9). For each fan configuration, the voltage was set to keep the total system noise to 39 dB(A). At this sound level, two configurations stood out: Push and Pull Intake was slightly better, while Pull Exhaust performed significantly (around 4°C) worse.
0 10 20 30 40 50
Push Exhaust
Push Pull Exhaust
Pull Exhaust
Pull Intake
Push Pull Intake
Push Intake
Temperature [°C]
Fig. 4-9: The effect of fan orientation on temperature, with fan speed limited by SPL at 39 dB(A)
Since Pull Exhaust is the recommended configuration for the Antec product, the test was repeated with the Antec stock fan. This time, the tests were done at both 40 dB(A) and with the fan at full voltage. Using the Antec fan, pull exhaust was closer in perfor-mance to the other configurations in both the 40 dB(A) test (Fig. 4-10) and the full speed test (Fig. 4-11). However, just as in the test with the Xinruilian fan, it was the worst choice.
In both these tests, the two Intake variants (both Push and Pull) were better than the exhaust configurations and well within the error margin of each other.
0 10 20 30 40 50
Push Exhaust
Pull Intake
Push Intake
Pull Exhaust
Temperature [°C]
Fig. 4-10: Comparison between different fan configurations, Antec fan limited to 40 dB(A)
0 10 20 30 40 50
Push Exhaust
Pull Intake
Push Intake
Pull Exhaust
Temperature [°C]
Fig. 4-11: Comparison between different fan configurations, Antec fan at full speed

15
However, in the full speed test, the sound pressure level differed quite audibly between the intake variants (Fig. 4-12): Push Intake generated a total system noise of 45 dB(A) while the equally well performing Pull Intake configuration only generated 42 dB(A).
35 40 45 50
Push Exhaust
Pull Intake
Push Intake
Pull Exhaust
SPL [dB(A)]
Fig. 4-12: Sound pressure level with the Antec fan at full speed in different configurations
Finally, tests were performed with and without a fan shroud, basically an empty frame that is placed between the fan and the radiator, which supposedly gives a more evenly distributed airflow. No significant differences were recorded in these tests.
4.4. Simulation Testing on Heatsink Flow DirectionTo help determining which flow direction to use in the block construction, top inlet,
side outlets or side inlet, side outlet, simulation testing was performed using a simplified block model and the ANSYS software.
The tests were all performed using microfins, with the fin-channel width ratio at 0.7 and 3 mm fin height. The size of the simulated block was 20*20 mm, less wide than a CPU block, therefore the flow rate was set to 67 liters per hour, which would equal 100 liters per hour at a 3 cm wide block. The bottom of the block is 3 mm thick, and the bottom surface was subjected to 50W of heat. The thickness of the bottom block is likely much larger than optimal, as the temperature difference between lower and upper surfaces of the copper bottom is roughly half the total heat source to inlet temperature drop.
Fig. 4-13: Images of the simulation setups.
Inlet width was 4.8 mm in both test setups. The outlet in the side inlet setup was also 4.8 mm, while the two outlets in the top inlet setup were both 2.4 mm. Both setups are depicted in fig 4-13. All inner inlet and outlet edges were rounded with a 1 mm radius.
16
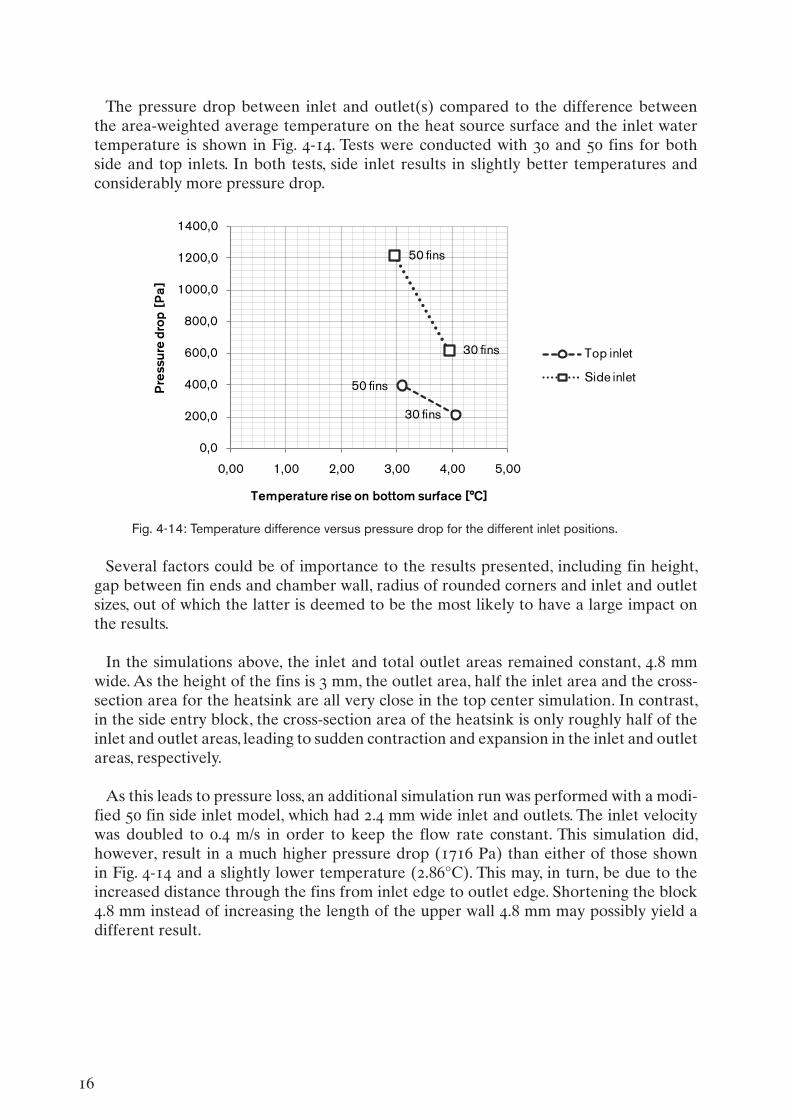
The pressure drop between inlet and outlet(s) compared to the difference between the area-weighted average temperature on the heat source surface and the inlet water temperature is shown in Fig. 4-14. Tests were conducted with 30 and 50 fins for both side and top inlets. In both tests, side inlet results in slightly better temperatures and considerably more pressure drop.
30 fins
50 fins
30 fins
50 fins
0,0
200,0
400,0
600,0
800,0
1000,0
1200,0
1400,0
0,00 1,00 2,00 3,00 4,00 5,00
Pre
ssur
e dr
op [
Pa]
Temperature rise on bottom surface [°C]
Top inlet
Side inlet
Fig. 4-14: Temperature difference versus pressure drop for the different inlet positions.
Several factors could be of importance to the results presented, including fin height, gap between fin ends and chamber wall, radius of rounded corners and inlet and outlet sizes, out of which the latter is deemed to be the most likely to have a large impact on the results.
In the simulations above, the inlet and total outlet areas remained constant, 4.8 mm wide. As the height of the fins is 3 mm, the outlet area, half the inlet area and the cross-section area for the heatsink are all very close in the top center simulation. In contrast, in the side entry block, the cross-section area of the heatsink is only roughly half of the inlet and outlet areas, leading to sudden contraction and expansion in the inlet and outlet areas, respectively.
As this leads to pressure loss, an additional simulation run was performed with a modi-fied 50 fin side inlet model, which had 2.4 mm wide inlet and outlets. The inlet velocity was doubled to 0.4 m/s in order to keep the flow rate constant. This simulation did, however, result in a much higher pressure drop (1716 Pa) than either of those shown in Fig. 4-14 and a slightly lower temperature (2.86°C). This may, in turn, be due to the increased distance through the fins from inlet edge to outlet edge. Shortening the block 4.8 mm instead of increasing the length of the upper wall 4.8 mm may possibly yield a different result.

17
5. Performance ConsiderationsIn this chapter, the relevant aspects of each component will be discussed, based on test-
ing and theory. For each aspect, pros and cons of different options are weighed against each other in order to make informed component choices.
5.1. RadiatorThe radiator is mounted at the case wall, together with the fan (Fig. 5-1).
Fig. 5-1: System overview with radiator highlighted
In order to keep the difference between room temperature and water temperature low, the radiator has to be constructed from materials with good thermal properties and provide large surface areas for both water and air contact. It must also provide low resistance to both air and water flows. In Fig. 5-2, a sketch with the names used for various parts of the radiator construction is shown.
Fig. 5-2: Naming convention for radiator parts
5.1.1. Radiator SizeSince the radiator is to be mounted in a fan/radiator slot in the computer case, the size
must conform to a standard fan slot size. Fan slots in computer cases are usually square and either 80 mm, 92 mm, 120 mm, 140 mm or 180 mm large. In modern computers, the fan slots near the top rear edge (closest to the processor) are usually 120 or 140 mm, with a single 120 or 140 mm at the rear panel and often a double 120 or 140 mm at the top panel. Thus, possible sizes for radiators in a CPU water-cooling loop include 120*120, 140*140, 120*240 and 140*280 mm.
18
A larger radiator gives the system a larger area to dissipate heat, which decreases the temperature deltas between both air and radiator and radiator and water. Out of these, the air-radiator delta is much larger, thus more important to optimize. A double radiator will, however, require two fans, which means that each fan will have to spin at a lower speed to keep the system noise level constant. Thus, the air velocity will decrease, which increases the air-radiator temperature difference. In the testing, see chapter 4.2.2, the temperature gain from a double radiator seemed to be around 1°C at the testing load and with constant sound level, a performance gain that can at most be considered moderate.
The choice between 120 mm and 140 mm wide radiators, single or double, mostly comes down to fan performance. In general, 140 mm fans will move more air at the same noise level than their 120 mm counterparts. 140 mm wide radiators do, of course, also give the system 36% (1402 * 120-2) more radiator area.
Taken together, a system with a 280*140 mm radiator will likely outperform a system with a 120*120 mm radiator with around 3°C at a load of 100W. However, such a system will not be possible to install in as many cases as the 120*120 mm one. Thus, offering the customers a few products with different radiator sizes may be the best option.
Radiators are also offered in a variety of thicknesses, mostly ranging from 25 to 60 mm. Thicker radiators often have much wider fin spacing in order to keep the air pressure drop at a reasonable level. Therefore, the thicker radiators outperform the more tightly spaced thinner ones at very low fan speeds, since the fans generate much less static air pressure at low speeds (less than 1000 rpm). However, at medium or high fan speeds, the wider spaced radiators typically perform worse than the denser ones.
Since good performance is most important under full load, when fan speeds below 1000 rpm are not sufficient to dissipate the heat with a reasonable temperature delta, a radiator with close fin spacing most likely gives the system the best overall performance.
5.1.2. Flow Velocity and Direction The heat dissipated from the water to the radiator itself has, as described in chapter
2.1, an almost linear relationship to the flow velocity. Thus, if the flow speed doubles, the temperature delta between the water and the radiator is cut in half. Therefore, once the temperature delta is small enough, the performance gain from increased flow becomes negligible.
For most radiators, this appears to occur around 100-150 liters per hour in both data released by radiator manufacturers and in tests by independent reviewers.
Thus, it is reasonable to either design the system around this flow rate, or to have a radiator with a much smaller water cross-section area, to reach the same velocity with a lower flow rate. Reaching the same velocity in a smaller cross-section at a lower flow rate will, however, increase the pressure drop, thus at least partly negating the pumping power gains from the flow rate decrease.
At 100 liters per hour, the temperature difference between inlet and outlet will be 0.86°C in order to transfer 100W in pure water (determined by using 5-1). Having a small

19
temperature difference between inlet and outlet is to be preferred, as this gives cooler water in the outer regions of the CPU block.
ΔT = Q
(5-1)cp ∙ m ∙ 1000
Most radiators are double-pass constructions (Fig. 5-3), where the water can pass through half the ducts in one direction up to the top chamber, then through the other half down towards the outlet. Some radiators are, instead, multi-pass constructions, where the water will go up and down the radiator height more than once. Given the same cross section area for a single duct, this gives a much smaller total cross-sectional area, and thus much higher velocities. The high velocity, in addition to the much longer water path, increases total water resistance significantly.
Fig. 5-3: Flow in ducts and upper chamber of a double-pass radiator
In addition, the number of ducts vary between different radiators, for example the AVC Hercules radiator have 18 ducts while the radiator from the Corsair H70 only has eight. More ducts give a larger pressure drop, presuming that the total cross-section area and thus the velocity is kept constant. However, more ducts decrease the width of the fins, increasing average temperature on the fins. It also increases the surface area of the radiator that is exposed to the fan slightly, thus increasing the air pressure drop, the air velocity and the sound level.
5.1.3. Radiator MaterialThe radiator consists, in essence, of three parts: the fins, the ducts, and the mounting
frame. The material choice in the first two have different impacts on the heat transmis-sions, while the latter has no impact on the performance of the radiator.
Many radiator manufacturers use copper for the fins, which leads to better heat con-ductance through the fins for a given thickness, resulting in either a lower temperature drop between the ducts and the air contact surface or in thinner fins, which reduces the noise. However, the radiators supplied with all the pre-assembled systems tested in chapter 4.1 had aluminum fins, in all likelihood due to cost considerations.
The temperature gains to be had from using copper instead of aluminum is likely around 2°C (at 100W), while not having any detrimental effects on any other aspect of the product than the production cost. Thinner fins gives less flow resistance for the air and therefore decreases the amount of noise generated. However, the fins must be thick enough to transfer the heat from the ducts to the entire fin surface.

20
As for the ducts, most radiators, even those with copper fins, are equipped with ducts of aluminum. Most likely, this is because the difference in required thickness is not as relevant for the ducts, since the ducts will be fairly thick in either case due to their inner dimensions.
5.1.4. Reservoir While DIY water cooling systems typically have specific reservoirs, the integrated
water cooling solutions do not. Instead, these systems are built with as low permeability as possible in mind, especially regarding tubing choice (see chapter 5.6.2). However, no tubing is completely impermeable, thus some margin for water loss must be had. The part of the product where lack of fluid has the least adverse effects is the top of the radiator, in the chamber between the inlet and the outlet ducts. Therefore, in order to make choosing thin tubing walls possible, this chamber should not be too small.
5.2. Water BlockThe block is mounted on the motherboard, with firm contact to the CPU (Fig. 5-4), and
is one of the most critical components in a water cooling loop.
Fig. 5-4: System overview with block highlighted
5.2.1. Main Block Material and SizeIn a three-dimensional heat transmission such as through the processor block, a large
base thickness will result in a higher temperature delta between the top and bottom surfaces, while also resulting in a larger cross-section area and thus lower temperature deltas across the surface. This will result in an optimal thickness (for a given heat source and heatsink), through which there will be a temperature delta with the thermal con-ductance as the only variable.
As noted in 2.1, the two metals with the most relevant performance per cost properties are copper and aluminum. As the thermal conductance (k) for copper is nearly twice as high as for aluminum, the temperature difference between the CPU mating surface and the water contact area will be twice as high for aluminum compared to copper. As the temperature difference through the block is estimated to be in the order of a few degrees, this is a significant difference.

21
A combination of two different metals, such as the copper-plated aluminum on the AVC Hercules, serves no practical purpose, as the surface area material has no significant impact on the heat transfer to and from the block. Instead, this choice can, presumably, be attributed to the marketing value of a copper finish.
The optimal base thickness is bound to differ between different heatsink designs, but is relatively easy to determine by simulation. If it turns out that the ideal thickness is so thin as to possibly interfere with the strength of the material, calculations will be necessary to ensure that the block will be able to withstand the applied forces without significant deformation. In similar simulations, near-optimal fin height and fin length should be determined for the specific block design used.
There exists no industry standard for the size of the CPU block, and different manu-facturers use differing sizes and shapes in their designs. What can be noted is that larger block areas will not necessarily improve performance, and may instead only serve to make the product more expensive, as copper has a relatively high price. A large bottom area of the block assembly, either from a wide copper base or from the upper block part may also interfere with tall capacitors on some motherboards and is therefore to be avoided. The block should, ideally, have at least the same area as the CPU IHS, to make sure the latter is fully covered and thus maximizing the mating area.
Depending on the material used in the mounting of the product to the motherboard, and the amount of force used to fasten the block to the CPU, it might be necessary to manufacture the block into having a slightly convex surface facing the CPU (known as a bow). This is both due to the slight bending of the block base when force is applied to the edges from above and on the middle from below, and due to the fact that the CPU IHS is not completely flat and commonly slightly concave. This could possibly make the block have slightly less contact with the CPU in the very middle of the IHS, directly above the CPU die where contact is most desired, impairing the over-all performance of the product.
Having the surface designed to be convex from the beginning prevents this scenario, but requires careful calculations and manufacturing. Possibly, the bow could result from the block assembly, if the center of the upper part is slightly below its edges.
5.2.2. Flow Through the HeatsinkThere are two main variants in block design regarding heatsink water inlet position:
flow-through, where the water enter on one side of the heatsink; and top centered, where the water enters from directly above the center of the heatsink and spreads toward the sides.
Out of these, the top centered variant has a small advantage in that the coolest water enters at the most critical point - directly above the processor. However, as the tem-perature increase in the water between inlet and outlet is very small compared to the difference between water temperature and copper temperature (a ratio of roughly 1:10), this is not of great importance.

22
For a given fin height and a given heatsink cross-section area, the velocity in a side inlet block will be twice as high on average, since only half the water needs to go through each half of the heatsink. This has a significant impact on both the heat transmission rate and the pressure drop, but the impact on temperature is only linear while the effect on pressure drop is squared (see chapter 2). Therefore, a block with top inlet will allow for a denser heat sink at a given pressure than the side inlet variant, which will have greater impact on the heat transmission through the increased surface area.
The simulation test conducted on inlet position, as shown in 4.4, appears to verify that the number of fins are more important for the heat transmission, while the pressure drop depends heavily on the inlet position. Therefore, a system with several outlets is to be recommended. It seems reasonable that having the flow pass only a quarter of the heatsink on each pass through the block would improve performance over pressure drop even more. However, the difficulty in accommodating the flow through such a block, as well as manufacturing limitations on the thickness of heatsink fins, makes the feasibility of this uncertain.
In the Asetek blocks, such as the Corsair H70, the flow follows another variant, which could be described as top flow-through. The flow comes from the top, but not at the center, with some of the water exiting the block against the main flow direction and then reentering it between the fins further from the center.
5.2.3. Heatsink TypeFor the heatsink, there are two main options: long thin fins or a matrix of pins (Fig. 5-5).
For the pins, these can be of various shapes, see chapter 2.3. Since the flow through the heatsink is massively affected by many other parameters, such as the heatsink height, the position and shape of the inlet(s) and the outlet(s), a definitive answer to which kind of pin or fin shape which is optimal to use given certain circumstances is hard to achieve. Some basic simulation tests were performed as part of this project, but the results were at best inconclusive.
Neither principle (pin nor fin) seems clearly better than the other, which is reflected in the mix of solutions between the top-of-the-line water blocks available on the market. Given that the width of the pins is smaller than the space between them, which is usually the case, the area exposed to the water becomes larger with fins.
Fig. 5-5: Closeups of the Swiftech Apogee (a pin heatsink) and the Coolit Vantage (a fin heatsink)
When it comes to production, fins have a definite advantage. If machined, only half as many machining operations are needed, and fins can be created using other methods, such as skiving.

23
5.2.4. Flow Between Pump and HeatsinkTo combine fins and a top centered inlet, the inlet must be very wide perpendicularly
to the fins, otherwise the fins beyond the inlet will not have any flow. In order to get the flow from the pump into this wide inlet, without massive pressure loss, a chamber of some size must exist between the pump and the inlet. Such a solution, including the chamber in between block inlet and heatsink inlet, can be seen on the Koolance CPU-370 (Fig. 5-6). The main downside of this is that the overall height of the pump/block assembly increases.
Fig. 5-6: Injection chamber and injection plate of the Koolance CPU-370, seen from below Image source: Skinnee Labs (http://skinneelabs.com/cpu-370-review/2/), cropped.
Since the chamber should be wider than both inlets, and since the pump impeller should be inserted from below but must have wider blades than the pump outlet, the upper part of the block cannot be manufactured as a single part.
5.2.5. Heatsink Shape and Flow ConcentrationWhile the IHS on most modern CPU:s is both square and large, the actual CPU die is
much smaller and, on some architectures, the CPU die may not be square, such as on the popular Intel Core i7 series (Fig. 5-7). In order to provide the most effective cooling for i7 processors, several blocks, such as the Swiftech Apogee XTL, have rectangular inlets and a recommended mounting direction.
Fig. 5-7: The Core i7 CPU, with the die position superimposed on the IHS Image source: http://www.xbitlabs.com/articles/cpu/display/intel-core-i7_2.html.
Thus, it is optimal to have the injection inlet in the same direction as the normal mount-ing orientation of the i7, which means that the inlet should be in the up-down direction inside the computer, thus perpendicular to any text on the outer shell of the product.
24
5.3. Thermal CompoundAs mentioned in chapter 4.2.5, some thermal compounds require curing time for
optimal performance. By adding the test data and the manufacturer temperature drop claims together, is seems plausible that the Arctic Silver compound will reach the same performance as the Noctua paste after curing. However, having that performance from the start must be seen as a significant advantage both for product reviews and for the user experience. It is very likely that the user checks the temperatures immediately after installing a new cooling solution, but much less likely that the user checks the tempera-tures again after 200 hours of computer use to form a new opinion.
Since the temperature gaps between the different compounds must be seen as sig-nificant, the thermal compound choice should be carefully made after a more thorough study than the time constraints of this project allowed. Apart from the thermal paste choice, the compound application also has a large impact on performance (Appendix A).
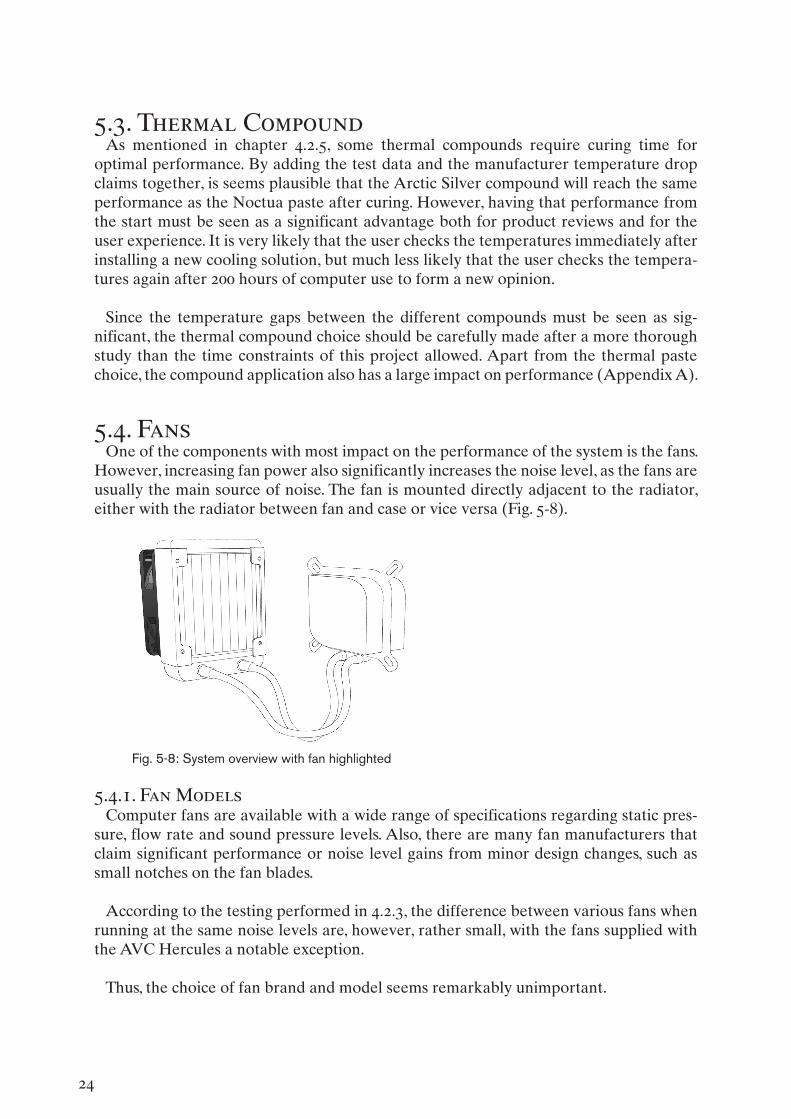
5.4. FansOne of the components with most impact on the performance of the system is the fans.
However, increasing fan power also significantly increases the noise level, as the fans are usually the main source of noise. The fan is mounted directly adjacent to the radiator, either with the radiator between fan and case or vice versa (Fig. 5-8).
Fig. 5-8: System overview with fan highlighted
5.4.1. Fan ModelsComputer fans are available with a wide range of specifications regarding static pres-
sure, flow rate and sound pressure levels. Also, there are many fan manufacturers that claim significant performance or noise level gains from minor design changes, such as small notches on the fan blades.
According to the testing performed in 4.2.3, the difference between various fans when running at the same noise levels are, however, rather small, with the fans supplied with the AVC Hercules a notable exception.
Thus, the choice of fan brand and model seems remarkably unimportant.

25
5.4.2. Number of FansAccording to the tests in 4.3, there seems to be performance gains to be made by equip-
ping the radiator with two fans in a push/pull configuration rather than just having a single fan, even when keeping the sound level constant and thus lowering the voltage of the individual fans. These gains are, however, rather small, and should be weighed against both the cost of an extra fan as well as the increased difficulty to fit and install the unit within the computer case.
It seems that most of the performance gain usually achieved with a push/pull configu-ration is due to the increased fan power and could instead be achieved with a single, more powerful, fan.
However, from the test in 4.3, there seems to be roughly a one degree performance gain to be had even with constant noise level, which may be interesting in a premium product variant where the maximum possible performance is desired.
5.4.3. Required Air PressureThe air velocity, when pushing 0.03 m3/s (65 CFM) through the radiator area (assuming
⅓ of the area is radiator water ducts) corresponding to the fan blade paths (8.4*10-3 * ⅔ m2), averages at 5.5 m/s.
In theoretical calculation, at that speed and by modeling the radiator as 4 * 1 * 20 mm rectangular ducts, the pressure drop through the radiator is around 1.58 Pa (0.16 mm H2O). As a reference, the Xinruilian RDL1225S, a fan with high pressure rating, is rated at 65.1 CFM and 2.6 mm H2O, a considerably higher pressure (Xinruilian Science & Technology, n.d.). As with the pumps however, the fan will not deliver the maximum flow rate and pressure at the same time.
This supports a notable result from the fan testing, where there was no significant cor-respondence between rated static pressure and system performance, contrary to com-mon expectations among customers.
5.4.4. Fan ConfigurationWhen it comes to fan configuration, recommending the optimal configuration is im-
portant, as this increases the performance of the system remarkably without affecting cost or production methods at all. To make sure that the recommendations are sound, the results found in 4.3, where the pull intake configuration was clearly superior, should be confirmed by repeating the tests for a variety of different computer cases. Due to time constraints, this was deemed to lie beyond the scope of this project. However, the results are the same as those presented by Asetek (2011a), even though this is not the configuration recommended in all Asetek produced systems.
5.4.5. Automatic Fan SpeedSince modern processor energy saving technology can vary the amount of energy con-
sumed, and thus the amount of heat to be dissipated, by more than a factor of ten, having the maximum cooling performance at all times is not necessary. By decreasing pump and fan power while the computer is idle or under limited load, both the energy consumption of the cooling system as well as the noise level can be lowered.

26
This also enables better load performance as the noise level limit for full speed opera-tion can be raised, while not changing the noise level for normal operation.
Several methods can be used to achieve this, including temperature sensors included in the cooling solution, PWM signals or voltage variation from the motherboard, computer software or physical user control (Appendix C).
5.5. PumpThe pump is an important part of the product as well, as the pump strength determines
the flow rate, and thus the velocity, in both the radiator and the water block. While doubling the flow rate roughly doubles the heat transmission rate (and thus cuts the temperature delta in half), doubling the flow rate requires eight times more pumping power. On integrated systems, the pump is usually part of the block assembly.
5.5.1. Pump StrengthAs stated in the radiator section above (chapter 5.1.2), the benefit from increasing
the pumping power is negligible once the temperature delta between the radiator and the fluid is small enough (roughly below two degrees). This, for most radiators, occurs around 100-150 liters per hour.
As the solid-fluid interface surface area in the block is so much smaller in the processor water block, it is unlikely that the temperature delta will be so small that the possible performance gain becomes negligible. However, as the block design supposedly is to be made specifically for this project, the block can be designed to have good heat transmis-sion properties and a reasonable flow resistance at the expected flow rate.
The pumps used in all the tested liquid cooling systems were considerably weaker than those included in the DIY kits. While no specific pump testing was performed as part of this project, all other parts were tested at constant pump pressure, thus the remaining performance difference between the factory sealed and the DIY systems can likely be attributed to the pump, making it a significant contributor to the overall system perfor-mance.
The required pump pressure, at the specified flow rate, is equal to the total flow resist-ance of block, radiator and tubing. At 150 liters per hour, these are estimated to be around 4 kPa, 1 kPa and 1.5 kPa, respectively. Thus, to achieve a 150 liters per hour flow rate, the pump should be able to provide around 6.5 kPa at 150 liters per hour (the pump curve should pass through the 150 liter per hour / 6.5 kPa point).
Since none of the components are specified at this point, these values are estimated. The resistance in the pump and the block correspond roughly to published data on exist-ing DIY components, while the tubing pressure drop is calculated with 8 mm ID tubing and two sharp 90° bends.
The numbers should, however, be sufficiently precise to serve as guidelines when choosing a pump from existing models. Then, once the pump, the radiator and the tubing
27
are chosen, the block can be designed in such a way that it has a flow resistance at the specified flow rate equal to the remaining pump head at that flow rate (having deducted the pressure drop from radiator and tubing).
Corresponding to the situation with fan speed control (Chapter 5.4.5), similar gains can be had from automatically changing the pump speed (Appendix C).
5.5.2. Pump EfficiencyPump efficiency is a major factor for determining the total energy consumption of the
cooling solution. Also, an efficient pump will generate less heat, which decreases the total heat that needs to be dissipated from the water block. The efficiency of a pump is not constant for all workloads, thus it is not only important that the pump will supply the required pressure at the specified flow rate, but also that the pump operates near its maximum efficiency at that flow rate.
While the pumps used in computer water cooling seldom generate as much noise as a few powerful fans, the pump could easily be the main source of noise in a system with slow or medium speed fans. Therefore, it is important to keep the sound pressure level ratings in mind when choosing pump.
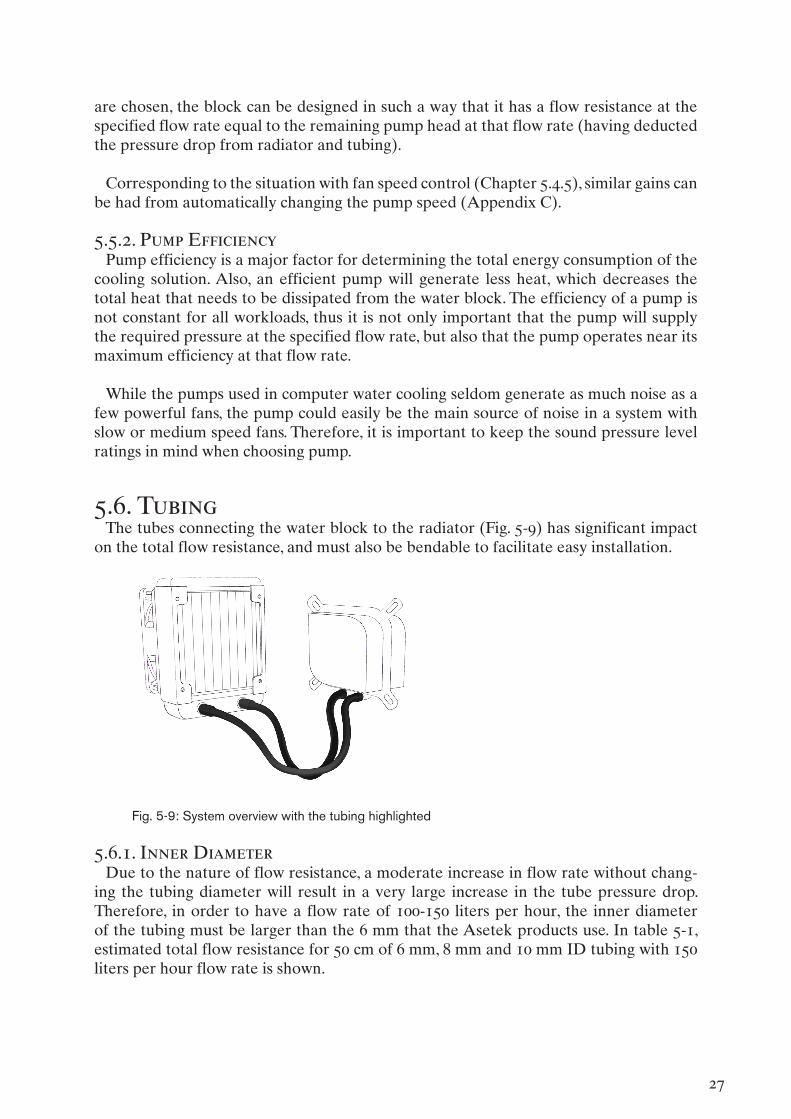
5.6. TubingThe tubes connecting the water block to the radiator (Fig. 5-9) has significant impact
on the total flow resistance, and must also be bendable to facilitate easy installation.
Fig. 5-9: System overview with the tubing highlighted
5.6.1. Inner DiameterDue to the nature of flow resistance, a moderate increase in flow rate without chang-
ing the tubing diameter will result in a very large increase in the tube pressure drop. Therefore, in order to have a flow rate of 100-150 liters per hour, the inner diameter of the tubing must be larger than the 6 mm that the Asetek products use. In table 5-1, estimated total flow resistance for 50 cm of 6 mm, 8 mm and 10 mm ID tubing with 150 liters per hour flow rate is shown.
28
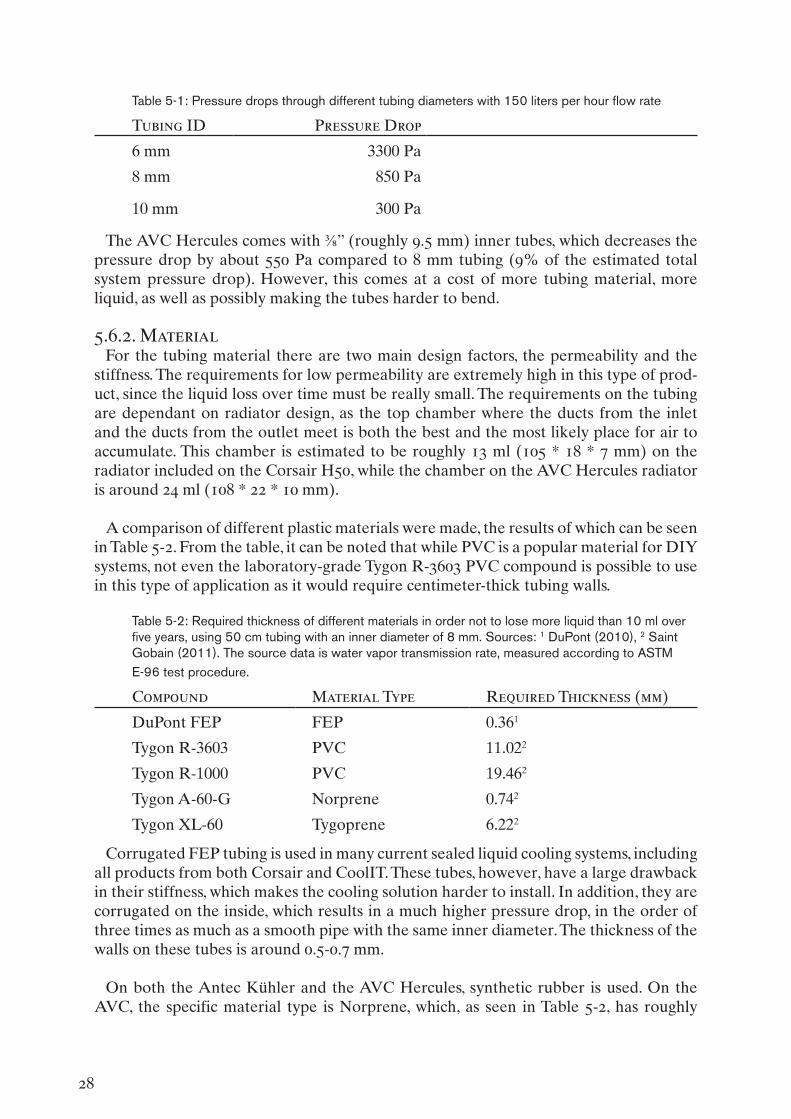
Table 5-1: Pressure drops through different tubing diameters with 150 liters per hour flow rate
Tubing ID Pressure Drop
6 mm 3300 Pa
8 mm 850 Pa
10 mm 300 Pa
The AVC Hercules comes with ⅜” (roughly 9.5 mm) inner tubes, which decreases the pressure drop by about 550 Pa compared to 8 mm tubing (9% of the estimated total system pressure drop). However, this comes at a cost of more tubing material, more liquid, as well as possibly making the tubes harder to bend.
5.6.2. Material For the tubing material there are two main design factors, the permeability and the
stiffness. The requirements for low permeability are extremely high in this type of prod-uct, since the liquid loss over time must be really small. The requirements on the tubing are dependant on radiator design, as the top chamber where the ducts from the inlet and the ducts from the outlet meet is both the best and the most likely place for air to accumulate. This chamber is estimated to be roughly 13 ml (105 * 18 * 7 mm) on the radiator included on the Corsair H50, while the chamber on the AVC Hercules radiator is around 24 ml (108 * 22 * 10 mm).
A comparison of different plastic materials were made, the results of which can be seen in Table 5-2. From the table, it can be noted that while PVC is a popular material for DIY systems, not even the laboratory-grade Tygon R-3603 PVC compound is possible to use in this type of application as it would require centimeter-thick tubing walls.
Table 5-2: Required thickness of different materials in order not to lose more liquid than 10 ml over five years, using 50 cm tubing with an inner diameter of 8 mm. Sources: 1 DuPont (2010), 2 Saint Gobain (2011). The source data is water vapor transmission rate, measured according to ASTM E-96 test procedure.
Compound Material Type Required Thickness (mm)
DuPont FEP FEP 0.361
Tygon R-3603 PVC 11.022
Tygon R-1000 PVC 19.462
Tygon A-60-G Norprene 0.742
Tygon XL-60 Tygoprene 6.222
Corrugated FEP tubing is used in many current sealed liquid cooling systems, including all products from both Corsair and CoolIT. These tubes, however, have a large drawback in their stiffness, which makes the cooling solution harder to install. In addition, they are corrugated on the inside, which results in a much higher pressure drop, in the order of three times as much as a smooth pipe with the same inner diameter. The thickness of the walls on these tubes is around 0.5-0.7 mm.
On both the Antec Kühler and the AVC Hercules, synthetic rubber is used. On the AVC, the specific material type is Norprene, which, as seen in Table 5-2, has roughly

29
twice the permeability of FEP. This is not a major problem, as a wall thickness of roughly 1 mm is still very thin. However, the tubing supplied with the Hercules has a 2 mm wall thickness, which must be seen as more than strictly necessary. The Norprene tubing has a tendency to fold when bent too sharply, which AVC counteracts by surrounding the tube with a metal spiral. On the Antec, a different, unspecified, compound is used, which is more flexible and less prone to folding (Asetek, 2011b). Overall, the Antec tubing material is deemed to be very suitable for the product category.
5.7. LiquidThe coolant used in most factory sealed water cooling systems is a mixture of water
and ethylene glycol, based on their thermal properties as well as being easy to attain and handle. Ethylene glycol is commonly used in fluid based heat transfer systems (MEGlobal, 2008), and although it is poisonous to humans if consumed, this will not be seen as an issue in this type of product. Ideally, the liquid would be non-conductive to prevent major damage to surrounding components if a leak were to occur. However, even if both distilled water and the ethylene glycol are essentially non-conductive, micro particles of copper or aluminum will spread throughout the liquid after being dislodged by the wear of the block and radiator.
The ethylene glycol is added to the water to prevent a build-up of algae and to prevent oxidation due to there being two different metals in the loop (copper and aluminum). As the system is closed, no exchange of water (which is a common method for avoiding these issues in a DIY system) is possible, which makes these measures crucial.
Several manufacturers sell specialized non-conductive fluids for use in water cooling, but these will, just as the pure water, become conductive due to the metal micro particles from block and radiator.
5.8. Mounting HardwareRelatively high pressure between block and CPU is required for good thermal con-
ductance, and high pressure also reduces the risk of an uneven installation, where the contact between block and IHS could, at worst, be at a single corner. However, too much pressure may damage the computer components.
Many manufacturers use different techniques for limiting the pressure, such as the lim-ited threading on the Asetek screws. This needs to be done carefully, as the low mounting pressure is probably a significant reason for the mediocre performance of the tested AVC block, on which low pressure was evident based on the thermal compound spread.
A test was conducted with increased pressure on the Antec Kühler, simply by adding a second backplate that the screw threads entered after the first, basically causing the first backplate to act as a washer. This did not yield any significant performance increase, hence the mounting pressure of the Asetek solutions is deemed sufficient.
30
6. Concluding RemarksAs expected, while the performance of the system depends on all components involved
in the heat transfer, a few components have a much larger impact than others. The most important components are the block, the pump and the combination of radiator size and fan speed.
Out of these, only the block design does not affect the sound level. There are several different types of heatsinks, but neither microfins nor micropins have a clear advantage over the other. The optimal dimensions of the heatsink elements seem to depend on several variables, most importantly the pump strength. For a fin array heatsink, a top inlet gives a much lower pressure drop while it has only a very small temperature disad-vantage compared to a side inlet, flow-through, heatsink.
Radiator size mostly matters if the increased number of fans are all allowed to spin at the same speed rather than keeping the noise level constant. Otherwise, the decreased air velocity will partly neutralize the performance gains that were had from the increased surface area. Fan models and specifications seem remarkably unimportant when testing at constant sound level, but increasing the fan speed and thus also the system noise will decrease the temperature significantly. With automated fan control, this can be done automatically when necessary.
Another important factor to the system performance is the fan configuration. A good configuration can decrease both temperature and sound level significantly, compared to a less suitable one. However, recommending a configuration is difficult, as the optimal choice is bound to depend on the air flow through the computer case.
Further examination is necessary to determine the optimal heatsink geometry for use in different circumstances.
6.1. Development PotentialSince several components can be changed for the better without apparent additional
production costs, creating a competitive system on this market certainly seems possible.
To increase performance, such a system should, probably, use a top inlet position in the block. The flow rate should also be increased compared to the existing systems, partly by using a stronger pump than the ones used in the factory sealed water cooling systems available on the market today and partly by decreasing the flow resistance in both the tubing and the block.
For developing a competitive block assembly, CFD simulations is deemed to be a good approach.

31
Reference ListArctic Silver (n.d.). Arctic Silver 5: High density polysynthetic silver thermal compound.
Retrieved from http://www.arcticsilver.com/as5.htm on 2011-03-03
Asetek (2011a). Air Flow Matters, Part 1. Retrieved from http://www.asetek.com/blog/229.html on 2011-05-12
Asetek (2011b). Questions of the Month - May 2011: Why is rubber tubing being used on Asetek’s latest water coolers?. Retrieved from http://www.asetek.com/blog/243-questions-of-the-month-may-2011.html on 2011-05-12
Baumann, H., Heinemeyer, P., Staiger, W., Töpfer, M., Unger, K., & Müller, D. (2001). Optimized cooling systems for high-power semiconductor devices. IEEE Transactions on Industrial Electronics, 48(2), 298-306.
Çengel, Y A., Turner, R H. (2005). Fundamentals of Thermal-Fluid Sciences. New York: McGraw-Hill
Choi, S. U. S. (1995). Enhancing thermal conductivity of fluids with nanoparticles. Paper presented at the American Society of Mechanical Engineers, Fluids Engineering Division (Publication) FED, 231, 99-105.
DuPont. (2010). DuPont FEP Film [Fact Sheet]. Retrieved from http://www2.dupont.com/Teflon_Industrial/en_US/assets/downloads/h55007.pdf on 2011-03-03
Ho, C. J., Wei, L. C. & Li, Z. W. (2009). An experimental investigation of forced convective cooling performance of a microchannel heat sink with Al2O3/water nanofluid. Applied Thermal Engineering, 30, 96-103.
Intel Corporation (2004). Enhanced Intel® SpeedStep® Technology for the Intel® Pentium® M Processor - White Paper [Fact Sheet]. Retrieved from ftp://download.intel.com/design/network/papers/30117401.pdf on 2011-05-21.
Jasperson, B. A., Jeon, Y., Turner, K. T., Pfefferkorn, F. E., & Qu, W. (2010). Comparison of micro-pin-fin and microchannel heat sinks considering thermal-hydraulic performance and manufacturability. IEEE Transactions on Components and Packaging Technologies, 33(1), 148-160.
John, T. J., Mathew, B., & Hegab, H. (2010). Parametric study on the combined thermal and hydraulic performance of single phase micro pin-fin heat sinks part I: Square and circle geometries. International Journal of Thermal Sciences, 49(11), 2177-2190.
Lee, T. Y. T., Andrews, J., Chow, P., & Saums, D. (1992). Compact liquid cooling system for small, moveable electronic equipment. Paper presented at the Proceedings - IEEE Semiconductor Thermal and Temperature Measurement Symposium, 30-36.

32
Li, J., & Peterson, G. P. (2006). Geometric optimization of a micro heat sink with liquid flow. IEEE Transactions on Components and Packaging Technologies, 29(1), 145-154.
MEGlobal (2008). Ethylene Glycol Product Guide [Fact Sheet]. Retrieved from http://www.meglobal.biz/media/product_guides/MEGlobal_MEG.pdf on 2011-04-14
Pickert, V., Cheng, H., Pritchard, L., & Atkinson, D. J. (2010). An experimental and computational study of water cooled heatsinks for HEV’s. Paper presented at the IET Conference Publications 2010 (563 CP)
Saint Gobain (2011). Water vapor transmission rates. Email communication with Swedish sales manager Poria Mokarami.
Salem, T. E., Porschet, D., & Bayne, S. B. (2005). Thermal performance of water-cooled heat sinks: A comparison of two different designs. Paper presented at the Annual IEEE Semiconductor Thermal Measurement and Management Symposium, 264-269.
Stern, M., Copeland, D., Vogel, M., Dunn, J., Kearns, D., & Lindquist, S. (2009). Preliminary specification for a closed loop liquid cooling system product reliability test plan. Paper presented at the Annual IEEE Semiconductor Thermal Measurement and Management Symposium, 159-163.
Tuckerman, D. B., & Pease, R. F. W. (1981). High-performance Heat Sinking for VLSI. Electron Device Letters, EDL-2(5), 126-129.
Tsunekane, M., & Taira, T. (2007). Design and performance of compact heatsink for high-power diode edge-pumped, microchip lasers. IEEE Journal on Selected Topics in Quantum Electronics, 13(3), 619-625.
Xie, X. L., Liu, Z. J., He, Y. L., & Tao, W. Q. (2009). Numerical study of laminar heat transfer and pressure drop characteristics in a water-cooled minichannel heat sink. Applied Thermal Engineering, 29(1), 64-74.
Xinruilian Science & Technology (n.d.). 120*120*25mm [Fact Sheet]. Retrieved from http://www.x-fan.com/pdf/dc2010%20pdf/37-DC1225.pdf on 2011-03-03
Yu, E., & Joshi, Y. (2002). Heat transfer enhancement from enclosed discrete components using pin-fin heat sinks. International Journal of Heat and Mass Transfer, 45(25), 4957-4966.
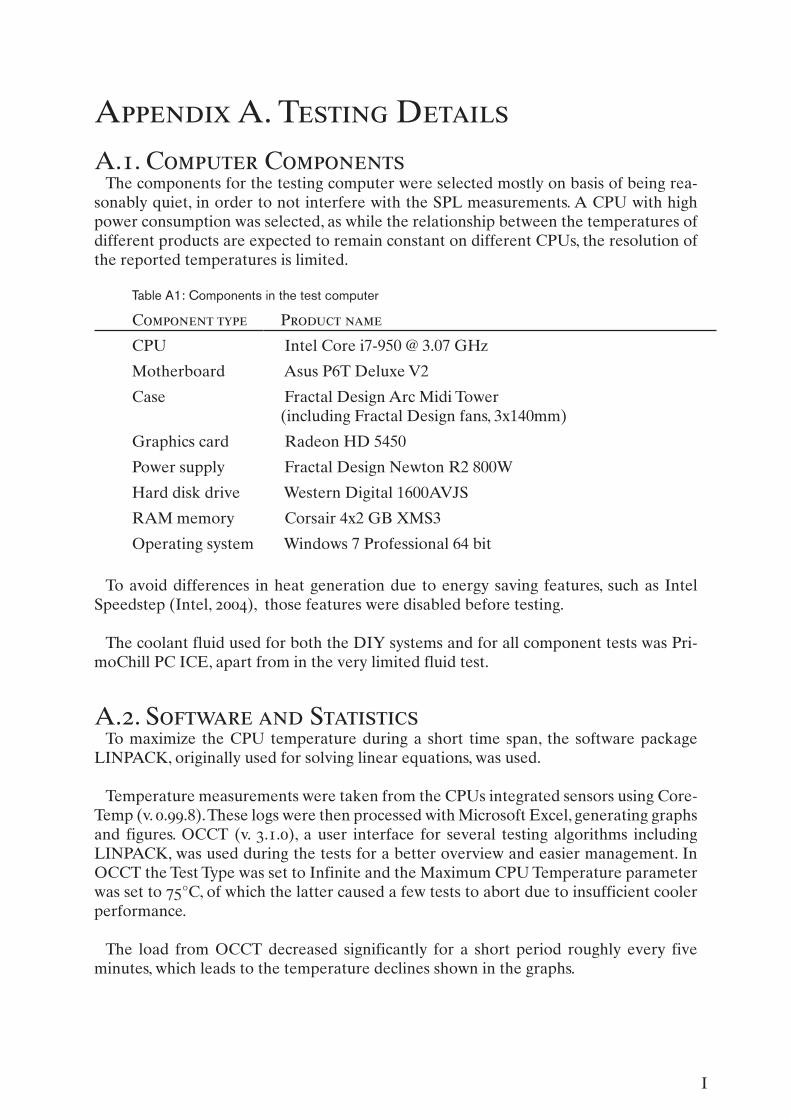
I
Appendix A. Testing DetailsA.1. Computer Components
The components for the testing computer were selected mostly on basis of being rea-sonably quiet, in order to not interfere with the SPL measurements. A CPU with high power consumption was selected, as while the relationship between the temperatures of different products are expected to remain constant on different CPUs, the resolution of the reported temperatures is limited.
Table A1: Components in the test computer
Component type Product name
CPU Intel Core i7-950 @ 3.07 GHz
Motherboard Asus P6T Deluxe V2
Case Fractal Design Arc Midi Tower (including Fractal Design fans, 3x140mm)
Graphics card Radeon HD 5450
Power supply Fractal Design Newton R2 800W
Hard disk drive Western Digital 1600AVJS
RAM memory Corsair 4x2 GB XMS3
Operating system Windows 7 Professional 64 bit
To avoid differences in heat generation due to energy saving features, such as Intel Speedstep (Intel, 2004), those features were disabled before testing.
The coolant fluid used for both the DIY systems and for all component tests was Pri-moChill PC ICE, apart from in the very limited fluid test.
A.2. Software and StatisticsTo maximize the CPU temperature during a short time span, the software package
LINPACK, originally used for solving linear equations, was used.
Temperature measurements were taken from the CPUs integrated sensors using Core-Temp (v. 0.99.8). These logs were then processed with Microsoft Excel, generating graphs and figures. OCCT (v. 3.1.0), a user interface for several testing algorithms including LINPACK, was used during the tests for a better overview and easier management. In OCCT the Test Type was set to Infinite and the Maximum CPU Temperature parameter was set to 75°C, of which the latter caused a few tests to abort due to insufficient cooler performance.
The load from OCCT decreased significantly for a short period roughly every five minutes, which leads to the temperature declines shown in the graphs.

II
A.3. SettingsSince the processor generated enough heat to pass the 75°C limit with some heatsinks
even at the stock frequency, and as the temperature deltas were reasonably large, no overclocking of the CPU was performed. The case fans were set to spin at reduced speed with a fan control, which was then kept unchanged throughout the tests.
All coolers were tested with their respective recommended settings and supplied components, such as fans and mounting hardware, with the exception of thermal com-pound (see A.5). In the main test, every product was tested twice, with re-installation and re-application of thermal paste in between, to make sure that reliable results were attained. The average measured temperatures of these two tests were then used for the comparison charts. During the product test, there were two tests (out of 24) where the test runs differed significantly, the cause was, however, visually identified in each case (wrong fan pin header for the pump and insufficient thermal paste). Therefore, after the full product test was completed, the part tests were conducted with only one test run each, but with careful visual inspection.
The tests were done with the products mounted inside the case and with all case sides closed, unless otherwise mentioned.
A.4. Measurement and InstrumentsBetween each test run, ambient sound pressure level (SPL) and room temperature
were checked. SPL was measured both before, with the test computer off, and during each product test. The sound level measurements during the tests were taken with no audible sounds from sources other than the testing computer, apart from the ambient background noise, which measured 35 dB(A).
The instrument used was a Voltcraft SL-200, using the dB(A) setting. Both the SPL meter and the testing computer were placed in marked areas, 40 cm apart. The SPL meter was placed on a small tripod, 12 cm above the table surface. Measurements were taken with the meter at the “fast” setting.
Room temperature was measured before and after each test, using a standard elec-tronic thermometer with two sensors, displaying both readings on a display. The sensors were placed close to each other and the computer air intake, then the room temperature was determined by using the average value. The temperature delta between the ambi-ent room temperature and the temperature reported by the software was used in the product temperature comparisons rather than the reported temperature itself. All tests were conducted with a room temperature between 20° and 25°C.
A.5. Thermal Compound Choice and ApplicationFor the tests, the Arctic Silver 5 thermal compound was used. This compound has a
recommended curing time of up to 200 hours, during which the thermal conductivity supposedly increases. To avoid having the curing time affect test results, all measure-ments were taken after the first start-up after the thermal compound was applied.

III
The compound was applied in an x-shaped pattern, with the thin lines covering ap-proximately half the Integrated Heat Spreader (IHS) diagonally. Different methods of applying the compound were tested beforehand, and the x-shape method was deemed having a good spread with consistent results. With the compound in place the cooling product was attached to the CPU, the paste spreading automatically due to the pressure from the mounting. After each test, upon removal of the heatsink or block, the residual paste was examined to ensure that the spread was sufficient and that there was minimal extra compound between the heat source and the heatsink or block.
A.6. Testing ProcedureBefore application of thermal paste, both the IHS and the heatsink block were cleaned
with a cloth, dampened with a small amount of alcohol. After installation of the cooling system to be tested, the computer was booted and all diagnostic software was started. Other processes and background programs were kept to a minimum as to not interfere with the testing. Before LINPACK was started, the computer was left untouched for about three minutes, to make sure it was completely idle. During this time period the temperature logging via CoreTemp was initiated. After starting the test, CPU tempera-tures were regularly checked to ensure that no errors had been made during the mount-ing of the product. If the maximum temperature reached on the hottest CPU Core had remained the same for at least ten minutes, the test was considered to be finished. This resulted in different test session durations for different products.
When the tests were finished, LINPACK was shut down, and the computer was left idle to regain normal temperatures. The logs generated by CoreTemp were then transferred into Microsoft Excel, where different test sheets, depending on test type, had been pre-pared. This concluded the procedure, and the computer was shut down to allow installa-tion of the next product.
A.7. Notes on Component TestsIn the block tests, the block units taken from the factory sealed systems were con-
nected to the other components by thin tubing, and their pump blade assemblies were left in place. Both these factors increase flow resistance, but the pump is presumed to be powerful enough to make these factors irrelevant. The pump electrics, including the electromagnets, were removed.
The radiator tests were done with a DIY system for easier installation and customiza-tion, which also reduced the time required to empty the system of liquid once a new radiator was to be mounted. The water block used in the tests was the XSPC Rasa previ-ously used in the water block tests, and the pump/reservoir were the XSPC X2O 750. PVC tubing with ½ inch ID was used, except for the radiators from the factory closed systems, which required thinner tubing.
Both the radiators and the pump/reservoir were placed outside the case in marked areas, to make the installation and testing process more efficient. After installation of the system and the fans, and correct placement of all components was ensured, the SPL was measured to keep the different radiator setups at a constant level.

IV
In the fan and fan configuration tests, fan speed, and thus noise generation, was con-trolled by setting the voltage using a standard PC fan control. For most fans, sound pres-sure level was strictly growing with increasing voltage. However, on the Scythe Gentle Typhoon, a higher voltage could result in a lower SPL. Thus, fan voltage was set to a high value and then decreased until the SPL was sufficiently low.
The TIM comparison was done with a Noctua heatsink (model NH-U12P SE2) and an attached Noctua fan (model NF-P12).
A.8. Regarding Recorded Noise Levels The contribution from different sound sources to the total measured noise can be seen
in Fig. A-1, as measured with the Antec Kühler and the Xinruilian RDL1225S fan. Apart from the CPU cooling, no other component in the computer setup measures over 29 dB(A). For these measurements, the system was not under load, therefore the pump, which is temperature controlled, was very silent at roughly 27 dB(A). However, even with an increased pump speed, the pump is not likely to become a more significant noise source than the radiator fan.
With the fan at full speed, the total measured noise is 41 dB(A) including the back-ground noise, out of which the fan contributes around 39 dB(A), making it the clearly most important contributing source. Measurements were also taken with the fan at a much lower speed, with the fan noise below 30 dB(A), in which case the total measured sound level was around 37 dB(A).
0 10 20 30 40 50
Background NoisePSU
Case FansPumpHDD
Radiator fan, 12VTotal
Rad fan, case fans voltTotal with lower fan noise
SPL [dB(A)]
Fig. A-1: Estimated SPL of various sound sources
It could be noted that the noise level of many personal computers will not be as depend-ant on the CPU cooling method, as the other components used in the testing computer were chosen for their low sound pressure level ratings.

V
Appendix B. Line Graphs of Temperature
5
10152025303540455055
Temperature [°C]
Noc
tua,
Bot
h st
ock
fans
Scy
the
Shu
riken
Inte
l Sto
ckG
elid
Tra
nqui
lloC
orsa
ir H
50C
orsa
ir H
70A
ntec
Küh
ler H
2O 6
20C
oolIT
Van
tage
EC
OA
VC H
ercu
les
Pro
XS
PC
Ras
a R
S 2
40
Fig. B-1: CPU temperature with different cooling solutions over time

VI
5
10
15
20
25
30
35
40
45
50
55Te
mpe
ratu
re [°
C]
Swiftech X20-320 Swiftech X20-320 Silent XSPC Rasa
Fig. B-2: Temperature of the cooling systems tested outside of the case
5
15
25
35
45
55
Tem
pera
ture
[°C
]
H50 AVC Hercules H70 Rasa Apogee
Fig. B-3: CPU temperature with various water blocks
15
20
25
30
35
40
Tem
pera
ture
[°C
]
H70 H50 AVC 120AVC 240 Unknown 240 XSPC RS240XSPC RX120 XSPC RX240 Magicool 280
Fig. B-4: CPU temperature with various radiators

VII
20
25
30
35
40
45Te
mpe
ratu
re [°
C]
Xinruilian RDL1225S Xinruilian RDM1225S Fractal Design 120mmNoctua NF-P12 Scythe (Nidec) Gentle Typhoon 1850 AVC Hercules StockCorsair H70 Stock Gelid Tranquillo Stock
Fig. B-5: Fan comparison with 39 dB(A) constant SPL
20
25
30
35
40
45
Tem
pera
ture
[°C
]
Push Exhaust Push Pull Exhaust Pull Exhaust Pull Intake Push Pull Intake Push Intake
Fig. B-6: The effect of fan orientation on temperature, with fan speed limited by SPL at 39 dB(A)
20
25
30
35
40
45
Tem
pera
ture
[°C
]
Push Exhaust Pull Intake Push Intake Pull Exhaust
Fig. B-7: Comparison between different fan configurations, Antec fan limited to 40 dB(A)
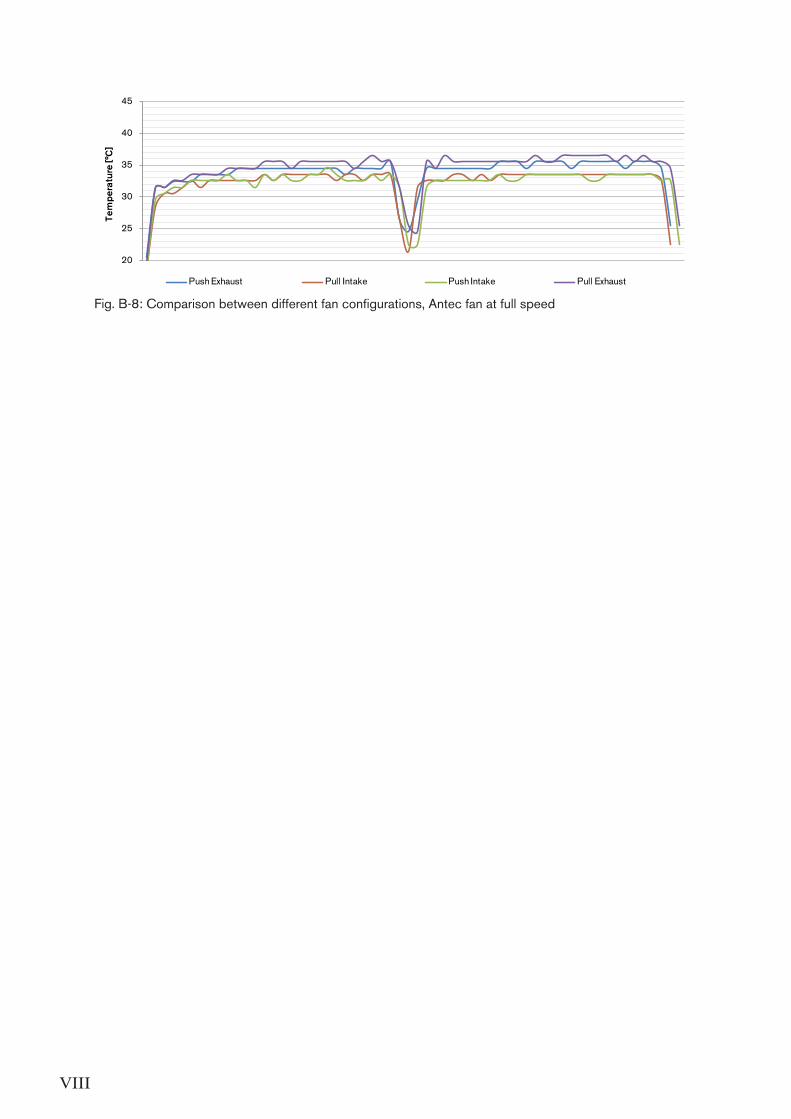
VIII
20
25
30
35
40
45Te
mpe
ratu
re [°
C]
Push Exhaust Pull Intake Push Intake Pull Exhaust
Fig. B-8: Comparison between different fan configurations, Antec fan at full speed

IX
Appendix C. Automatic Fan & Pump SpeedC.1. Built-in Sensors
Including sensors in the product has one main advantage in that it comes with few requirements regarding the surrounding components, having only to supply the specified voltage. However, this does require extra components in the cooling solution (sensors, electronics), and the relationship between registered temperature and cooling power will have to be factory set. Such a solution could, however, include an adjustment knob or a switch between a limited number of different temperature-power relationship curves, al-lowing the user to adjust the temperature response according to his or her requirements.
The sensor can also be installed in different parts of the water block assembly. In the Coolit Vantage, one of the products tested in chapter 4.1, the sensor is placed near the water between the radiator and the pump, causing both a delay in the reading and large seasonal and/or regional variation. The real indicator of the amount of heat transmit-ted in the system are the temperature deltas, such as the difference between water and air temperature, rather than the specific temperatures. A temperature response curve created for 20°C ambient temperature will have the fans and the pump spinning at full speed when the temperature in the water reaches 30°C (10°C temperature delta), which means that in a 30°C ambient room the system will work at full power continuously, which is completely unnecessary. This variation, as well as the delay, will become less significant if the temperature is measured at the copper block surface instead, since the ambient variations become less significant compared to the much larger temperature delta between copper and air.
For a system with integrated sensors, the fan power cables must be connected to the pump assembly in order to control both pump and fan speed. This may be advantageous if executed well, but may be a disadvantage as well if connecting the fan cable directly to the motherboard is easier in the computer case. However, having some way that the fan cable can attach and run along the tubing and a fan header near the tube inlet/outlet would perhaps make the product better no matter what fan speed control variant is used.
In any case, using built-in sensors most likely requires the development of a custom circuit board for the pump.
C.2. Motherboard ControlModern computer motherboards have automatic fan control options that are based on
the temperature readings from the processor itself. There are two kinds of fan headers in common use, the four pin PWM enabled header and the three-pin voltage variation header. On the three-pin header, the voltage of the positive pin varies depending on the temperature and the motherboard settings, usually between around 6V and 12V. There is, however, no established standard on the lower bound.
On the four-pin header, the positive pin always supplies 12V voltage, but there is a fourth pin (in addition to the fan speed reporting pin, the positive pin and the ground pin) that indicates the percentage of maximum speed that the fan (or pump) is expected

X
to run at. On most motherboards, the CPU fan header is four-pin while the case fan head-ers are three-pin. For a CPU cooling solution, using the CPU header is recommended as most motherboards have a start-up warning if it fails or is unconnected.
Using the motherboard signals has several advantages, including that it requires little extra materials, that the temperature readings are at the heat source itself and that many motherboards give the user good control over the temperature response. It is also likely that a standard circuit board for the pump can be used, perhaps even to control both pump and fans, presuming that the pump and the fans has the same voltage requirements for their respective desired speed/temperature curves.
The main disadvantage is that the user must select an appropriate fan control setting in the motherboards settings (the computer BIOS) upon installation, for which it is very difficult to supply good instructions as the procedure differs between different mother-boards. If the user fails to do this, or if the motherboard does not support four-pin fans, the pump and the fans will constantly run at full speed.
C.3. Computer Software ControlComputer software to control the fan speed could also be supplied with the product.
This, however, requires both a data interface between the computer and the cooling system (such as an USB cable) and the development of decent multi-platform software, which the user will have to install. The temperature data could, in this case, come from either sensors built-in in the product or from the processor temperature sensors.
C.4. Manual ControlManual fan and/or pump control, either with a knob for the user to control the speed
or with adapters setting the speed to certain levels, are cheap to produce but does not give automatic response to the computer load. While some users may prefer to manually set the speed to low during some computer applications, such as watching a movie, then manually turning it up before playing a computation-heavy game, it is presumed that most users would prefer automatic control. Since such options are cheap, it may be a good choice to include an adapter for lower speed in a kit designed for use with the motherboard signals.