development of full d-band corrugated horn …plasma and fusion research: regular articles volume 8,...
TRANSCRIPT

Plasma and Fusion Research: Regular Articles Volume 8, 1405163 (2013)
Development of Full D-Band Corrugated Horn Antenna forECRH System
Masatsugu SAKAGUCHI, Hiroshi IDEI1), Tetsuji SAITO and Takashi SHIGEMATSUFurukawa C & B Co., Ltd., Yamato, Kanagawa 242-0018, Japan
1)Research Institute for Applied Mechanics (RIAM), Kyushu University, Kasuga, Fukuoka 816-8580, Japan
(Received 16 May 2012 / Accepted 20 September 2013)
The corrugated horn antenna is widely used for the evaluation of transmission lines in electron cyclotronresonant heating systems, but little is known about the intensity and phase of its radiation profile over a widefrequency range. This paper is concerned with the development of a full D-band (110 - 170 GHz) corrugated hornantenna. The antenna was designed based on electromagnetic simulation codes for the finite element methodand the method of moment. To verify these numerical simulations, a low-power test system was established, andits dynamic power range was defined for the precise measurement of antenna radiation. The fabricated antennawas measured and analyzed with basic Gaussian optics for a number of frequencies throughout the D-band.The measured radiation profiles are Gaussian-like and agree well with the numerical simulations. The radiatedintensity pattern is slightly elliptical in the lower frequency range, as unwanted higher-order modes arose at thecorrugated mode conversion section and generated the elliptical radiation pattern. The evolutions of the antennaradiation do not correspond with those expected by basic Gaussian optics.
c© 2013 The Japan Society of Plasma Science and Nuclear Fusion Research
Keywords: corrugated horn antenna, finite element method, method of moment, basic Gaussian optics, radiationprofile, mode conversion
DOI: 10.1585/pfr.8.1405163
1. IntroductionNuclear fusion research is in the key process of
constructing the flagship tokamak reactor, ITER, inCadarache, France. ITER’s aim is to show nuclear fusioncan be used to generate electrical power, and to gain exper-imental data to design and operate the first electricity pro-ducing fusion power plant. The international fusion devel-opment program was widened to include a satellite toka-mak within the Broader Approach (BA). JT-60SA (Naka,Japan) is a part of BA activities [1].
Electron Cyclotron Resonance Heating (ECRH) is anattractive method for plasma production, auxiliary heat-ing, and current drive in a burning fusion-plasma exper-iments. The frequency of ECRH can be determined ateither the fundamental or harmonics of the electron cy-clotron frequency, fce = neB/2πme ≈ n ·28 [GHz/T] · [BT],where e and me are the electron charge and mass, B isthe confinement magnetic field and n = 1, 2, 3 . . . is theharmonic number. Accompanied by the magnetic field ofthe reactors, the ECRH frequency of ITER and JT-60SA is170 GHz [2,3] and 110 / 137 GHz [4,5], respectively. Otherthan ITER and JT-60SA, many devices employ the ECRHsystem and have individual gyrotron frequency tied to longterm R&D. Additionally, a dual frequency gyrotron havebeen studied for a future advanced ECRH system [6,7]. Onthe other hand, the frequency range is limited due to thegyrotron market for industries. The main frequency ranges
author’s e-mail: [email protected]
are 110 GHz band and 140 GHz band, 170 GHz band [8].Multi frequency gyrotron will give a large flexibility to theECRH system.
The present authors propose the use of a quasi-opticalhigh-purity HE11 mode exciter to experimentally evaluatethe ECRH transmission line [9]. The HE11 mode exciter iscomposed of a corrugated horn antenna and quasi-opticalphase-matched mirrors. The corrugated horn antenna iswidely used as a prime focus feed for high-efficiency re-flector antennas in radio astronomy and radar, and it is alsoemployed as a direct radiator in ECE radiometer applica-tions. Although the corrugated horn antenna was a pri-mary component of the HE11 mode exciter, little is knownabout a number of its properties. One of these charac-teristics is the antenna’s precise propagation profile, in-cluding both amplitude and phase. This profile is nec-essary to design the quasi-optical phase matched mirrors.The second property is the breadth of the antenna’s band-width. A broadband standard antenna helps to evaluate themultifrequency ECRH devices throughout the full D-bandrange. The frequency range of commercial antennas sepa-rates several types of D-band range depending on the inputcircular waveguide radius.
In this paper, the development of a full D-band cor-rugated horn antenna is reported, focusing on the preciseevaluation of its radiation properties and bandwidth. Thecontents of this paper are as follows: Section 2 reviews thegeneral considerations of the corrugated horn antenna and
c© 2013 The Japan Society of PlasmaScience and Nuclear Fusion Research
1405163-1

Plasma and Fusion Research: Regular Articles Volume 8, 1405163 (2013)
Fig. 1 Geometry and dimensions of the designed corrugated horn antenna.
describes the conceptual design of the antenna dimension;Section 3 describes the electromagnetic numerical simula-tions and their results; Section 4 describes the low-powertest system for the measurement of antenna propagation;Section 5 describes the measurement results and the Gaus-sian optics analysis; and Sec. 6 is the summary.
2. General Considerations and Con-ceptual DesignUnwanted higher-order modes (HOMs) are easily ex-
cited in a normal smooth-wall horn antenna due to the edgediffraction related to the dominant mode. The excitationof HOMs can be eliminated by the addition of corrugat-ing walls. Corrugated horns can provide reduced edgediffraction, improved pattern symmetry and reduced cross-polarization levels. When corrugations of width w anddepth d are considered under conditions of ka � 1, thesurface reactance at the open end is given approximatelyby the following equation [10]:
Z =w
dtan (kd) , (1)
where k(= 2π/λ) is the wave number and a is the radius ofthe antenna aperture. When the corrugation depth d = λ/4,Z becomes infinite, while when d = λ/2, Z becomes zero.The hybrid HE11 mode can be reached from the TM11
mode by increasing Z inductively from zero (d = 0 to λ/4)or from the TE11 mode by decreasing Z capacitively fromzero (d = λ/2 to λ/4). Besides the above, a number of ad-ditional parameters determine the characteristics of the ra-diated modes, including the size of the smooth wall circu-lar waveguide diameter, the length of the transition sectionand the aperture inner diameter. In particular, the shape ofthe corrugated wall section contributes to the broad band-width of the mode.
The operating principle of a corrugated horn antennacan be explained by considering the corrugated waveguide.The designed center frequency was 140 GHz, but the an-tenna was designed to work in the broadband frequency
range of the full D-band (110 - 170 GHz). After much de-liberation, the geometry and dimensions were determined,as shown in Fig. 1. The input TE10 mode of the WR-6fundamental rectangular waveguide was changed into theTE11 mode of the smooth-wall circular waveguide in themode transition section. This section was individually de-signed using numerical simulations to eliminate the poten-tial propagation of HOMs (TM01 and TE21 mode). Theconverted TE11 mode led into another mode transition sec-tion with corrugations. The corrugated walls linearly flaredfor simplicity and consisted of a mode launching sectionand a taper section. The mode launching section changedfrom an initial depth of λ/2 to a final depth of λ/4 at140 GHz, and the taper section had a constant depth ofλ/4. The aperture inner diameter contributed to the radi-ated beam size and was arbitrarily selected as 10.0 mm.The length of the corrugated walls, including those of themode launching section, was determined automatically ac-cording to the selected taper angle and the aperture diame-ter. A longer and smoothly flared mode launching sectionis desired for a broader bandwidth. The spread angle of thewalls was set at 7.3 degrees due to manufacturing limita-tions.
The propagation properties can be approximated withGaussian optics in association with the mode conversionefficiency of the free-space Gaussian beam and the HE11
mode. The beam waist radius w0 and waist location z areapproximated below [11]:
w0 =0.6435a
1 +[π(0.6435a)2
λRh
]2 , (2)
z =Rh
1 +[
λRh
π(0.6435a)2
]2 , (3)
where Rh is the horn slant length and a is the aperture ra-dius.
1405163-2
Plasma and Fusion Research: Regular Articles Volume 8, 1405163 (2013)
3. Numerical Simulations3.1 Comparison between numerical simula-
tion codesTo verify the conceptual design, we employed two
types of electromagnetic numerical simulation codes andobserved the differences between them. The first wasthe HFSS (ver. 13.0) code for the finite element method(FEM), and the other was the Wipl-d (ver. 9.0) code [12]for the method of moment (MoM). The FEM uses a precisevolume mesh and is common in antenna analysis, particu-larly in examining near-field resonance conditions. How-ever, the FEM requires substantial CPU time to solve dueto its volume mesh, including the propagating free spacearea. MoM requires relatively little CPU time because ofits surface meshing, and it is mainly used in the analysis oflarge-scale free-space propagation.
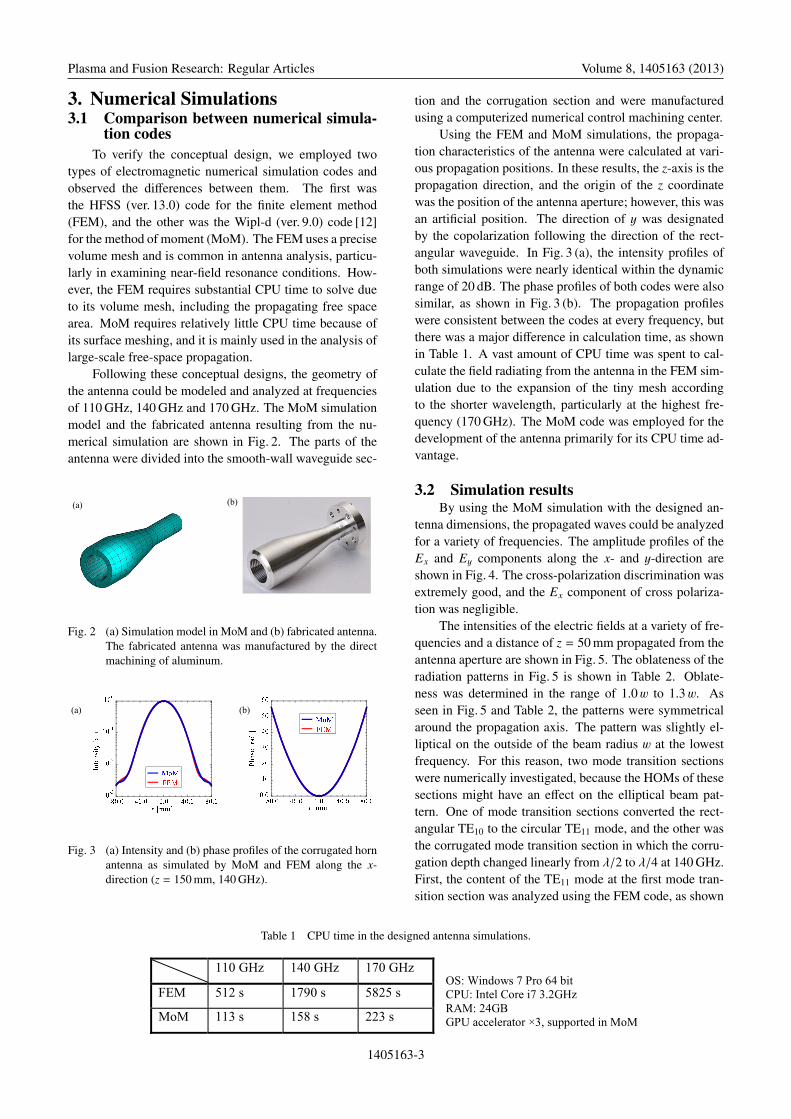
Following these conceptual designs, the geometry ofthe antenna could be modeled and analyzed at frequenciesof 110 GHz, 140 GHz and 170 GHz. The MoM simulationmodel and the fabricated antenna resulting from the nu-merical simulation are shown in Fig. 2. The parts of theantenna were divided into the smooth-wall waveguide sec-
Fig. 2 (a) Simulation model in MoM and (b) fabricated antenna.The fabricated antenna was manufactured by the directmachining of aluminum.
Fig. 3 (a) Intensity and (b) phase profiles of the corrugated hornantenna as simulated by MoM and FEM along the x-direction (z = 150 mm, 140 GHz).
Table 1 CPU time in the designed antenna simulations.
tion and the corrugation section and were manufacturedusing a computerized numerical control machining center.
Using the FEM and MoM simulations, the propaga-tion characteristics of the antenna were calculated at vari-ous propagation positions. In these results, the z-axis is thepropagation direction, and the origin of the z coordinatewas the position of the antenna aperture; however, this wasan artificial position. The direction of y was designatedby the copolarization following the direction of the rect-angular waveguide. In Fig. 3 (a), the intensity profiles ofboth simulations were nearly identical within the dynamicrange of 20 dB. The phase profiles of both codes were alsosimilar, as shown in Fig. 3 (b). The propagation profileswere consistent between the codes at every frequency, butthere was a major difference in calculation time, as shownin Table 1. A vast amount of CPU time was spent to cal-culate the field radiating from the antenna in the FEM sim-ulation due to the expansion of the tiny mesh accordingto the shorter wavelength, particularly at the highest fre-quency (170 GHz). The MoM code was employed for thedevelopment of the antenna primarily for its CPU time ad-vantage.
3.2 Simulation resultsBy using the MoM simulation with the designed an-
tenna dimensions, the propagated waves could be analyzedfor a variety of frequencies. The amplitude profiles of theEx and Ey components along the x- and y-direction areshown in Fig. 4. The cross-polarization discrimination wasextremely good, and the Ex component of cross polariza-tion was negligible.
The intensities of the electric fields at a variety of fre-quencies and a distance of z = 50 mm propagated from theantenna aperture are shown in Fig. 5. The oblateness of theradiation patterns in Fig. 5 is shown in Table 2. Oblate-ness was determined in the range of 1.0w to 1.3w. Asseen in Fig. 5 and Table 2, the patterns were symmetricalaround the propagation axis. The pattern was slightly el-liptical on the outside of the beam radius w at the lowestfrequency. For this reason, two mode transition sectionswere numerically investigated, because the HOMs of thesesections might have an effect on the elliptical beam pat-tern. One of mode transition sections converted the rect-angular TE10 to the circular TE11 mode, and the other wasthe corrugated mode transition section in which the corru-gation depth changed linearly from λ/2 to λ/4 at 140 GHz.First, the content of the TE11 mode at the first mode tran-sition section was analyzed using the FEM code, as shown
1405163-3

Plasma and Fusion Research: Regular Articles Volume 8, 1405163 (2013)
Fig. 4 MoM-simulated copolarization (Ey component) and cross polarization (Ex component) amplitude patterns at z = 50 mm in the Hplane (along the x-direction) and E plane (along the y-direction).
Fig. 5 Intensity field pattern calculated by MoM simulation at z = 50 mm in a range of a 30 mm square focusing on the beam center atfrequencies of (a) 110 GHz, (b) 140 GHz and (c) 170 GHz.
Table 2 Oblateness of radiation pattern measured at z= 50 mm.
in Fig. 6. The content of each mode can be calculatedby eigenmode expansion in HFSS. The highest contentof the TE11 mode was 99.2% (at 110 GHz). At the otherfrequencies, the mode contents were 97.8% (at 140 GHz)and 97.6% (at 170 GHz). These results indicate that therectangular to circular transition contributed relatively lit-tle to the HOMs of the corrugated horn antenna. Next, thepropagation of the corrugated part, which included the sec-ond mode transitional section, was analyzed using MoM,as shown in Fig. 7. At 110 GHz, the amplitude level bythe inner wall was higher towards the horn aperture on theyz plane (E plane) compared with the xy plane (H plane).This result suggests that the diffraction was caused by the
Fig. 6 Cross-sectional E/H plane surface amplitude distributionin the rectangular-circular mode transitional section at (a)110 GHz and (b) 170 GHz.
edges of the corrugations and that the standing wave arosefrom the combination of reflection and interference at thecorrugated mode transitional section on the yz plane (Eplane). The amplitude distributions were similar betweenthe E and H planes, exhibiting no diffraction at 170 GHz.
The elliptic radiation patterns at the lower frequen-cies were due to the nonoptimized corrugated mode tran-sitional section. The nonoptimized mode transition causedthe standing waves and diffraction. The functional form ofthe corrugated mode transitional section should be consid-ered in the future work, but a linear shape was employed
1405163-4

Plasma and Fusion Research: Regular Articles Volume 8, 1405163 (2013)
Fig. 7 Cross-sectional E/H plane surface amplitude distribution in the corrugated section at (a) 110 GHz and (b) 170 GHz.
Fig. 8 Schematic diagram of the low-power measuring system.
in the present study.
4. Experimental Setup4.1 Experimental geometry
The low-power measuring system for the propagatingwaves was prepared in collaboration with Kyushu Univer-sity, as shown in Fig. 8 and Fig. 9. The test system wascomposed of millimeter wave components and a receiver(WR-6 rectangular waveguide), which was controlled by athree-dimensional stage to scan the measuring point. Theaccuracy of positioning the receiver stage was on the orderof 1/100 of the wavelength of the frequency range. Fig-ure 8 shows a schematic diagram of the system at 170 GHz.Two synthesizers were prepared to obtain a stable, high-resolution measuring frequency. The first was a radio fre-quency (RF) source used as a multiplier to generate themillimeter wave, and the second was a local (LO) oscil-lator used for its harmonic mixers. The LO signals wereequally divided and led to the reference port and receiver
port. Because the conversion loss in the harmonic mixerswas not low (typically 35 dB), additional intermediate fre-quency (IF) amplifiers were prepared. The IF signals wereconnected to the vector network analyzer (Agilent Tech-nologies 8753ES) and detected at 70 MHz. The propertiesof the propagated wave were measured by comparing thereference signal with the received spatial scanned signal.
4.2 Test of the low-power measuring systemTo verify the low-power measuring system, the phase
evolution of the propagated wave was measured. The sys-tem required an accurate alignment setting between thepropagating z direction and the system longitudinal direc-tion. HOMs can be excited due to the misalignment ofthe propagating axis in the waveguide coupling betweenthe corrugated waveguides. A misalignment of 1 degreehas been shown to generate unwanted mode contents of0.03 [13].
The receiver was shifted along the z direction away
1405163-5

Plasma and Fusion Research: Regular Articles Volume 8, 1405163 (2013)
Fig. 9 (a) Experimental setup (corrugated horn and the receiver fixed on the 3D stage) and (b) experimental diagram.
Fig. 10 Measured phase evolution along the z-direction in thesystem test.
from the antenna aperture in increments of approximately10λ, as shown in Fig. 9. The measured frequencies were110 GHz and 170 GHz, and the input RF power level wasintentionally decreased by 20 dB to 40 dB from the ratedinput power level. Figure 10 shows the measured phaseevolutions at each level and the linearization lines for theinput power drop of 20 dB. The measured plots werenearly identical at every power range and well approxi-mated to the linearization lines. The phase evolution wasexpressed with the kz term. The gradient of the lineariza-tion lines agreed well with the theoretical wave numbers k(k = 2.305 at 110 GHz and k = 3.563 at 170 GHz), evenas the input power dropped by 20 dB. Additionally, thedynamic range was checked by attenuating the input sig-nal when the receiver position was fixed at z = 200 mm.The measured amplitude level is shown in Fig. 11, and thereceived level at z = 50 mm was characterized as the ref-erence signal level. As the power was reduced in 5 dB in-crements, the receiving level also fell linearly and was un-der the noise level when the attenuation level was 30 dB.These results indicated that the test system was correctlyaligned and possessed a dynamic range at a power of ap-proximately 25 dB.
Fig. 11 Measured amplitude level when the input signal was at-tenuated at z = 200 mm.
5. Experimental Results and Discus-sion
5.1 Gaussian-like beamThe intensity and phase distributions radiating from
the horn antenna were measured at z = 50 to 200 mm in in-crements of 50 mm at 110 GHz and 170 GHz. It shouldbe noted that the phase offset from the finite receivingangle was not taken into consideration by the receiver’s(WR-6 rectangular waveguide) radiation properties. Thephase differences around beam center were minor: 0.024radian in the E plane and 0.055 radian in the H plane. Fig-ure 12 shows the contour plots of the measured intensityand phase patterns at a propagating length of z = 50 mmand a frequency of 170 GHz. Both phase profiles weresymmetric, without an offset toward the beam center. Theantenna propagation axis was well aligned to the axis ofthe system longitudinal direction. The intensity profile wassymmetric at 170 GHz but was elliptical, as predicted bythe MoM simulation, at 110 GHz.
The validity of the numerical simulations was checkedusing experimental data from the low-power measuringsystem. Figure 13 shows the measured intensity and phase
1405163-6

Plasma and Fusion Research: Regular Articles Volume 8, 1405163 (2013)
Fig. 12 Measured (a) intensity and (b) phase patterns of the horn antenna (z = 50 mm, 110 and 170 GHz).
Fig. 13 Measured intensity and phase profiles with the fitted curves along the x-direction at z = 150 mm at frequencies of (a) 110 GHzand (b) 170 GHz. The MoM simulation results for the same conditions are also indicated.
distribution at z = 150 mm, with the fitted curve calculatedusing Gaussian optics and the MoM-simulated distributionalso marked. The measured intensity profile was Gaussian-like at the dynamic range of 20 dB in both frequencies.This agreement was sufficient because an intensity dropof 20 dB or a beam radius of 1.52w includes 99% of theradiated power. The measured and simulated profiles ex-hibited a strong agreement. The MoM simulation showedgood agreement with the measurements, proving itself tobe a useful tool for designing millimeter wave componentsin free-space propagation.
5.2 Basic Gaussian optics analysisTo determine the beam evolution, all profiles were fit-
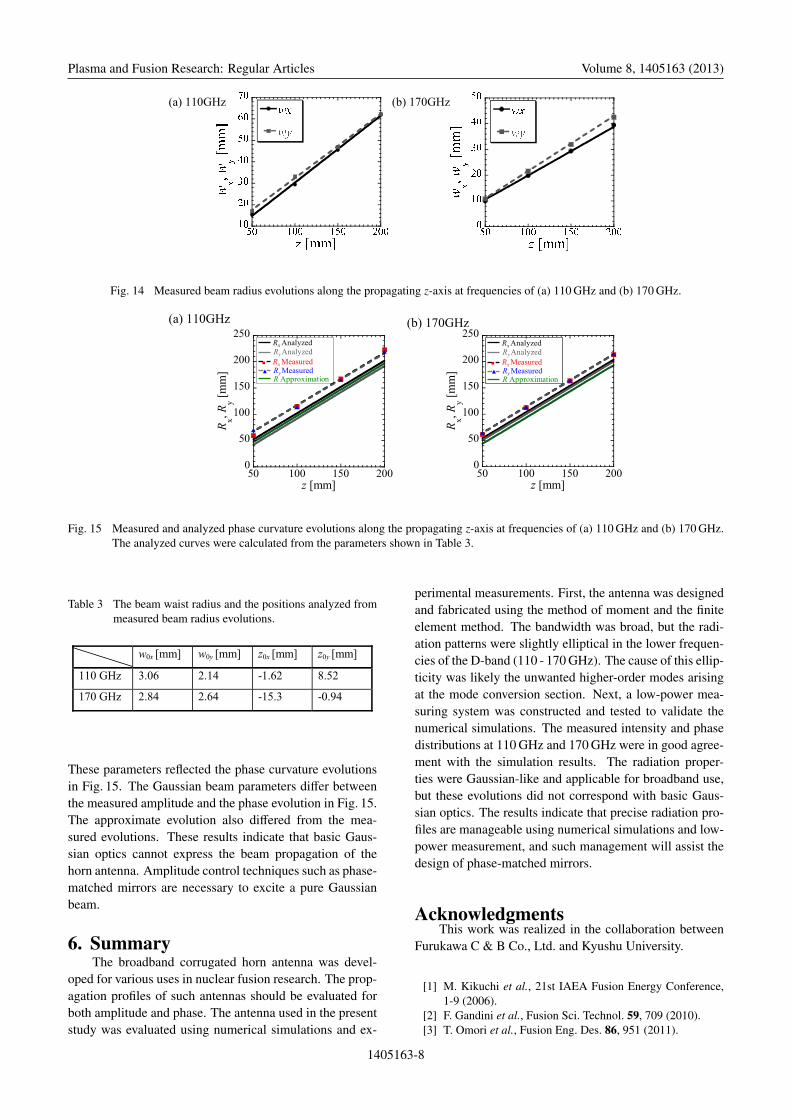
ted and analyzed in terms of basic Gaussian optics. Fig-ure 14 shows the evolution of the beam radius in the x andy axes along the propagating z direction. The Gaussianbeam parameters (w0, z0) were deduced from Fig. 14 andare noted in Table 3. The evolutions of the phase curva-ture R are shown in Fig. 15, along with the fitted and an-alyzed curves. The analyzed curves were calculated fromthe parameters shown in Table 3. In addition, the Gaus-sian beam parameters (w0, z) of the antenna were deducedfrom Eq. (2) and (3): (w0, z) = (2.94 mm, 3.31 mm) at110 GHz and (w0, z) = (2.63 mm, 3.31 mm) at 170 GHz.
1405163-7
Plasma and Fusion Research: Regular Articles Volume 8, 1405163 (2013)
Fig. 14 Measured beam radius evolutions along the propagating z-axis at frequencies of (a) 110 GHz and (b) 170 GHz.
Fig. 15 Measured and analyzed phase curvature evolutions along the propagating z-axis at frequencies of (a) 110 GHz and (b) 170 GHz.The analyzed curves were calculated from the parameters shown in Table 3.
Table 3 The beam waist radius and the positions analyzed frommeasured beam radius evolutions.
These parameters reflected the phase curvature evolutionsin Fig. 15. The Gaussian beam parameters differ betweenthe measured amplitude and the phase evolution in Fig. 15.The approximate evolution also differed from the mea-sured evolutions. These results indicate that basic Gaus-sian optics cannot express the beam propagation of thehorn antenna. Amplitude control techniques such as phase-matched mirrors are necessary to excite a pure Gaussianbeam.
6. SummaryThe broadband corrugated horn antenna was devel-
oped for various uses in nuclear fusion research. The prop-agation profiles of such antennas should be evaluated forboth amplitude and phase. The antenna used in the presentstudy was evaluated using numerical simulations and ex-
perimental measurements. First, the antenna was designedand fabricated using the method of moment and the finiteelement method. The bandwidth was broad, but the radi-ation patterns were slightly elliptical in the lower frequen-cies of the D-band (110 - 170 GHz). The cause of this ellip-ticity was likely the unwanted higher-order modes arisingat the mode conversion section. Next, a low-power mea-suring system was constructed and tested to validate thenumerical simulations. The measured intensity and phasedistributions at 110 GHz and 170 GHz were in good agree-ment with the simulation results. The radiation proper-ties were Gaussian-like and applicable for broadband use,but these evolutions did not correspond with basic Gaus-sian optics. The results indicate that precise radiation pro-files are manageable using numerical simulations and low-power measurement, and such management will assist thedesign of phase-matched mirrors.
AcknowledgmentsThis work was realized in the collaboration between
Furukawa C & B Co., Ltd. and Kyushu University.
[1] M. Kikuchi et al., 21st IAEA Fusion Energy Conference,1-9 (2006).
[2] F. Gandini et al., Fusion Sci. Technol. 59, 709 (2010).[3] T. Omori et al., Fusion Eng. Des. 86, 951 (2011).
1405163-8

Plasma and Fusion Research: Regular Articles Volume 8, 1405163 (2013)
[4] S. Moriyama et al., Nucl. Fusion 49, 8 (2009).[5] A. Isayama et al., Plasma Fusion Res. 7, 2405029 (2011).[6] D. Wagner et al., IEEE Trans. Plasma Sci. 36, 2, 324
(2008).[7] K. Sakamoto et al., International Conference on Infrared,
Millimeter, and Terahertz Waves, 1 (2011).[8] V. Erckmann et al., AIP Conf. Proc. 1406, 165 (2011).[9] H. Idei et al., Proceedings of US/Japan/EU RF Heating
Technology Workshop, 1 (2011).[10] J.D. Kraus, Antennas 2nd ed. (McGraw-Hill Companies,
New York, 1988) p.657.[11] P. Goldsmith, Quasioptical Systems: Gaussian Beam Qua-
sioptical Propogation and Applications (IEEE Press, NewYork, 1998) p.170.
[12] B.M. Kolundžija et al., WIPL-D Microwave: Circuit and3D EM Simulation for RF & Microwave Applications(Artech House, London, 2005) p.2.
[13] H. Idei et al., IEEE Trans. Microw. Theory Tech. 54, 11(2006).
1405163-9