development of an indicator of propensity to energy
TRANSCRIPT

1
Development of an Indicator of Propensity to Energy Commercial Losses using Geospatial Statistical Techniques and Socio-Economic Data: the Case of AES
Eletropaulo
Autoria: Eduardo de Rezende Francisco, Eduardo Bortotti Fagundes, Mateus Canniatti Ponchio, Felipe Zambaldi
Abstract Given the growing importance of integrating marketing and operations indicators to enhance business performance, and the availability of sophisticated geospatial statistical techniques, this paper draws on these concepts to develop an indicator of propensity to energy commercial losses. Loss management is a strategic topic among energy distribution companies, in particular for AES Eletropaulo. In such context, this work’s objectives are: (i) to appropriate spatial auto-regressive models and geographically weighted regression in measuring the cultural influence of neighborhood in customer behavior in the energy fraud act; (ii) to replace slum coverage areas by a regional social vulnerability index (IPVS); and (iii) to associate energy loss with customer satisfaction indicators, in a spatial-temporal approach. Spatial regression techniques are revised, followed by a discussion on social vulnerability and customer satisfaction indicators. Operational data obtained from AES Eletropaulo’s geographical information systems were combined with secondary data in order to generate predictive regression models, having energy loss as the response variable. Results show that the incorporation of market and social oriented data about customers substantially contribute to explicate energy loss – the coefficient of determination in the regression models rose from 17.76% to 63.29% when the simpler model is compared to the more complex one. In the last section, suggestions are made for future work and opportunities for the replication of the methodology in comparable contexts are discussed.
1. Introduction
Every year, AES Eletropaulo, one of the most important Brazilian electricity distribution companies, fails to bill 2,388 GWh derived from non-technical losses, an amount of energy that is greater than the residential consumption of a city with a population of over 2.3 million people. According to ANEEL (the Brazilian Governmental Energy Agency), the annual commercial energy loss in the Brazilian energy distribution sector was about R$ 5 billion in 2007, approximately 13.6% of all energy produced in Brazil during that period (ANEEL, 2009). Due to its relevance, loss management is a strategic topic among energy distribution companies. Losses can be originated by frauds, measurement anomalies, failures in internal billing processes, irregular connections, or cut-off clients directly connected to the grid. Loss management requires a joint effort for its control and for the definition of strategies that are effective to mitigate their impact on the financial results of the company. Sophisticated statistical methods have been proposed in the operations management field of study as an alternative to traditional ones. In another context, for instance, Brito, Pignanelli and Csillag (2008) showed the benefits of multilevel modeling when compared to traditional statistical methods to investigate the relationship between quality management and financial performance. In this paper, spatial modeling and geostatistical analysis are seen as key elements in planning the development, management and operation of energy losses

2
prevention. The effectiveness, economy and reliability depend on the correct choice of dimensions (categories of variables) used in its manipulation. Previous studies (FRANCISCO, 2006; FRANCISCO; FAGUNDES, 2006a, 2006b; FRANCISCO et al., 2007a, 2007b) state that the consumption of electric energy is a very good proxy of household income in certain conditions; such results benefited from geospatial statistical techniques. In this paper, similar techniques will be explored to measure energy losses, understood as the difference between bought (income) and sold (outcome – sum of consumption) energy. This information exists for each Transforming Distribution Station (ETD) and its coverage area. It is expected that the use of sophisticated techniques to support tactical and operational management will contribute for a better financial return through actions oriented towards loss reduction. Geographical analysis tools bring about this contribution, throughout diverse information levels of manipulation. The geostatistical techniques contribute with evaluation and quantification of geographical influence of this phenomenon. This paper is organized as follows: in the next section, the objectives are presented, followed by a brief presentation of the main concepts dealt with; the methodology is then described. Subsequently, the results are depicted and, in the last section, concluding remarks are offered. 2. Objectives In 2006, AES Eletropaulo created the CLPI – Commercial Losses Potential Indicator (FRANCISCO; FAGUNDES, 2006a, 2006b; FRANCISCO et al., 2007a), which integrates information of energy loss rate, average of residential electricity consumption, rate of cut-off customers and areas occupied by slums. This index has been used to refine inspection action priority, and serves as a source for demographic and behavioral clusters (decision tree analyses) for commercial losses, strategic support for metering maintenance and replacement process. The CLPI, however, does not take into account customer satisfaction indicators or social vulnerability data. Customer satisfaction indicators have a fundamental importance for AES Eletropaulo’s strategy to achieve the position of best Brazilian energy distribution company. For instance, a set of customer satisfaction indicators computed by ABRADEE (ABRADEE – Association of Brazilian Power Distribution Companies, 2009) account for one quarter of the global evaluation of Brazilian electric energy distribution companies that are elected to receive a performance award (the ABRADEE’s Prize). Social responsibility governance, on the other hand, gained strategic importance for energy companies in the last three years. The knowledge about the “bottom of pyramid” customers is a subsidy for actions related to income generation, citizenship, illegal connections and efficient use of energy. It has been suggested that manufacturing and marketing integration and managerial priorities influence positively business performance (PAIVA, 2008). In this context, the objectives of this paper are to improve the CLPI in three perspectives:

3
a. appropriation of geostatistical techniques (spatial auto-regressive models and geographically weighted regression) in order to measure the cultural influence of neighborhood in customer behavior in the energy fraud act;
b. replacement of slum coverage areas by a regional social vulnerability index (IPVS); and c. association of this indicator, in its formative conception, with the Customer Satisfaction
survey indicators, published by ABRADEE, in a spatial-temporal approach. 3. Concepts Review In this section, spatial regression techniques are revised, followed by a discussion on social vulnerability and customer satisfaction indicators.
3.1 Spatial Regression Techniques Nowadays, it is very common to analyze “spatially enabled” data. The motivation has come from several disciplines, including the universe of marketing and social sciences, and the subsequent improvements that spatial statistics allow in the interpretation, measurement of relationships, and prediction. As pointed out by Bradlow et al. (2005), by generalizing the notion of a map to include demographic and psychometric representations, spatial models can capture a variety of effects (spatial lags, spatial autocorrelation, and spatial drift) that affect firm or consumer decision behavior. In a traditional linear regression, we assume that the relationship modeled holds everywhere in the study area, that is, the regression parameters are considered "whole-map" statistics. In many situations, this is not correct, as mapping residuals may reveal. An alternative to incorporate spatial effects in econometric models, according to Griffith (1987), is to specify an auto-regressive model with the dependent’s variable autocorrelation as a statistic parameter; the rational is to include a spatial lag in the regression as an independent variable calculated by means of a matrix containing the distances among the different regions as coefficients of contiguity (ANSELIN, 1988). That option is the basis for what is known as spatial auto regression (SAR) techniques. Alternatively, and motivated by computational development, geographically weighted regression (GWR), a term introduced by Fotheringham, Charlton and Brunsdon (2002) to describe a family of regression models in which the coefficients β are allowed to vary spatially, also takes advantage of data from locations near the focal location as they are informative about the relationship between the independent and dependent variables in the focal location. When calculating the estimates for a focal location, GWR gives more weight to data from locations that are closer to it than to those that are distant (MITTAL; KAMAKURA; GOVIND, 2004). What makes GWR different from SAR techniques, however, is the fact that GWR permits parameter estimates to vary locally; regression coefficients are determined by examining the set of points within a well-defined neighborhood of each point, using a weighting scheme (normally, bi-square or Gaussian). A bandwidth that defines the neighborhood is the key factor; it may be defined manually or alternatively by some form of adaptive method such as the minimization of the Akaike

4
Information Criterion (AIC) (FOTHERINGHAM; CHARLTON; BRUNSDON, 2002; SMITH; GOODCHILD; LONGLEY, 2007). 3.2 Social Vulnerability In this work social vulnerability is understood as being “the limited capacity of individuals or groups to respond to risks or contingencies and the consequent predisposition to a decrease in well-being” (FILGUEIRA; PERI, 2004, p. 21, translated by the authors). This definition is coherent with others, such as that of Kaztman (1999) and of SEADE (2004). In a study to characterize the social vulnerability situation in different regions in the State of São Paulo, in addition to the socio-economic variables of income and educational level that are classically used in similar works, SEADE (2004) used variables that indicate the family life cycle (such as the presence of small children, adolescents, female family heads or young family heads in households) and housing conditions (households with urban services such as being connected to the water and sewage networks and trash collection). This study (SEADE, 2004) gave rise to the Paulista Index of Social Vulnerability – IPVS, presented in the following section. 3.2.1 The Paulista Index of Social Vulnerability – IPVS The objective of SEADE’s (2004) study was to allocate social vulnerability marks to each of the sectors in the census that comprise the State of São Paulo. Starting with the database taken from the Demographic Census (IBGE, 2000) of people living in the State of São Paulo, they used factor analysis procedures with the aim of exploring the underlying structures in the universe of variables studied. The analyses revealed two factors, called socio-economic and family life cycle (SEADE, 2004): a) Factor 1 – Socio-economic – related to the income and the level of education of the person responsible for the household. Low values in this factor are indicative of low income and / or little education; b) Factor 2 – Family Life Cycle – expresses the family life cycle – age of those responsible for the household, number of children and others aspects. Low values in this factor are indicative of young families. Once the factors had been identified, by means of cluster analysis they tried to identify sectors in the census that had similar profiles in terms of socio-economic conditions and family life cycle (factors 1 and 2). At the end of the analysis they generated a typology with six different groups of sectors that had taken part in the census. This typology is called the Paulista Index of Social Vulnerability – IPVS. Exhibit 1 shows the groups that form the IPVS.

5
Exhibit 1 – Groups forming the Paulista Index of Social Vulnerability – IPVS Factor 1 – Factor 2 – Family Life Cycle Socio-economic Young families Adult families Aged families
Low High vulnerability (group 5) Very high vulnerability (group 6)
Medium Medium vulnerability (group 4)
High
Very low vulnerability (group 2)
Low vulnerability (group 3)
Very high No vulnerability (group 1)
Source: adapted from SEADE, 2004, p. 27. The granular unit of SEADE’s study was the sector that had taken part in the census. Specifically for the city of São Paulo, the resulting social vulnerability map was as follows. Figure 1 – Map of the social vulnerability in the city of São Paulo
Source: adapted from SEADE, 2004. This result is extremely rich in information, both for public policy purposes as well as for marketing purposes. In this work, information regarding social vulnerability among AES Eletropaulo’s customers will be utilized in order to enhance the accuracy of an energy loss estimator. 3.3 ABRADEE’s Customer Satisfaction Survey ABRADEE coordinates the ABRADEE’s Survey of Residential Customer Satisfaction every year since 1999, applied simultaneously for many distribution companies (40 in 2004, 43 in

6
2005, 48 in 2006, 44 in 2007, 40 in 2008) (ABRADEE, 2005, 2007, 2008). Its main objective is to evaluate customer satisfaction by measuring service quality perceived attributes. It also allows the ranking of companies per category. It is a household survey, based on a stratified probabilistic sample (per municipality, district and census sector), which guarantees the representativeness of the distribution companies population. In addition, interviews are made for selected households, with the target person being the head of family (ABRADEE, 2003). Forty-three attributes of perceived quality and price are collected, grouped in eight areas (IDARs): energy supply; information and communication; energy bill; customer care; image; price; public lighting; and social responsibility. The average of the five first quality areas, weighted by customer declared importance of each area, originates the ISQP (Perceived Quality Satisfaction Indicator), the main index of that survey. In addition, two general satisfaction indexes (IAC and ISG), and some demographic aspects are collected: household income, head of family's age and educational level, monthly billed electricity consumption of the household and some others (ABRADEE, 2008). After the survey period, a database with all variables for all respondents is published by ABRADEE for each distribution company. The most detailed location information of the household collected in the interview is the district where the household is located (addresses, postal codes or census sectors were not supplied) (FRANCISCO; WHIGHAM; MOORE, 2007). It allows the generation of indexes by district and municipality, besides regional indicators commonly published, as illustrated by Figure 2. The ABRADEE's survey conducted in the city of São Paulo in 2008 had 1,200 respondents, spread in 75 districts of São Paulo and other 23 municipalities. We considered, in an exploratory way, the following indicators for this study: ISQP, the five ISQP’s IDARs, IAC, ISG and the particular attribute “satisfaction with concessionary acting on fraud combat”. Figure 2 – ISQP per District and Municipality using 2008 ABRADEE’s Survey
Source: prepared by the authors.
Percentage of Satisfied Customers 12 regions
Satisfaction Average 98 areas (districts or municipalities)
0 – 5%
95 – 100%
1 – 1.5
9.5 – 10
7
4. Methodology Understanding the spatial distribution of data derived from phenomena occurring over a certain geographical area constitutes a challenge for the clarification of core issues in several areas of public and corporate administration, such as health, urban dynamics, environment, marketing and asset management. Such studies have become increasingly more common, due to the availability of Geographical Information Systems (GIS), and also due to the need for clarification of the spatial distribution of common problems and socio-economical interaction variables that the traditional and classical models usually do not address. Geostatistics is a field of regional science that approaches the theme of dependence and spatial heterogeneity, critical aspects in any study on regional economy. These characteristics can invalidate the use of conventional econometric techniques. Spatial quantitative methods are a special case of overall statistical focus and, therefore, require a set of different methods and techniques than those utilized in conventional statistics. Companies that have geographical information as essential to their business benefit from the application of those techniques. In this section, we present the SAR and GWR techniques which were applied in the study and their characteristics, comparing them to the use of OLS (ordinary least square) techniques. Then, we demonstrate the process employed to improve an indicator of electricity commercial losses to be explained by means of the applied regressions. 4.1 Regression Techniques Applied in this Study Two geostatistics techniques used were: spatial auto-regression (SAR) and geographically weighted regression (GWR). They are exploratory techniques for spatial data analysis. The SAR technique remount to the 1950s and is traditionally used in spatial statistics (SMITH; GOODCHILD; LONGLEY, 2007). Spatial auto-regressive (SAR) models usually adopt neighborhood matrices (W) with distance weights (and the same dependent term y to estimate y, in an auto-regressive ρWy term), which are internally based on the distance between the points or the centroids of the polygons involved in the predicting model. Equations 1 (multivariate linear regression, or ordinary least square regression) and 2 (SAR) show how the auto-regressive term is incorporated. OLS: εβ += Xy (1) SAR: εβρ ++= XWyy (2)
where y is the dependent variable; X is the vector of independent variables; β is the vector of coefficients and ε is the estimation error (allegedly normal).
Geographically weighted regression (GWR) was introduced by Fotheringham, Brunsdon and Charlton (2002) to describe a family of regression models in which the coefficients, β, are allowed to vary spatially. In a traditional linear regression we assume that the relationship we are modeling holds everywhere in the study area – that is, the regression parameters are "whole-map" statistics (it is also valid for SAR). In many situations this is not necessarily the case, as mapping the residuals (the difference between the observed and predicted data) may reveal. Many different

8
solutions have been proposed for dealing with spatial variation in the relationship. GWR provides an easily grasped means of modeling such relationships, with local variations of β coefficients, as shown in Equation 3. GWR: εβ += Xggy )()( (3)
where y, X, β and ε are as in equations (1) and (2), and g indicates that the parameters are to be estimated at a location (point) whose coordinates are given by the vector g (sample point or zone centroid).
The coefficients β(g) are determined by examining the set of points within a well-defined neighborhood of each of the sample points, using a weighting scheme (normally, bi-square or Gaussian). The bandwidth that defines the neighborhood is the key factor; it may be defined manually or alternatively by some form of adaptive method such as the minimization of the Akaike Information Criterion (AIC) (FOTHERINGHAM; BRUNSDON; CHARLTON, 2002; FRANCISCO; WHIGHAM; MOORE, 2007; SMITH; GOODCHILD; LONGLEY, 2007). Figure 3 shows the differences between the three techniques of regressions applied respectively to the equations (1), (2) and (3). Figure 3 – Differences between ordinary linear regression (OLS), spatial auto-regression (SAR) and geographically weighted regression (GWR) OLS SAR GWR
Source: prepared by the authors.
4.2 Improvement of Commercial Losses Potential Indicator For each geographical region under study, four basic pieces of information are integrated: (i) percentage of power (or energy) loss (total); (ii) average household income (through the proxy average of residential energy consumption); (iii) IPVS (indicator of social vulnerability); and (iv) percentage of cut-off clients. Figure 4 schematizes the four constructs involved in the creation of this energy loss indicator.

9
Figure 4 – Formative explanatory variables (constructs) of the Commercial Losses Potential Indicator
Source: prepared by the authors. Figure 5 brings a summary of the steps of the creation of this indicator. Figure 5 – Building Steps of the Commercial Losses Potential Indicator Source: prepared by the authors. The methodology consisted, basically, of the following steps:
Percentage of Cut-off Customers
Household Income (Energy Consumption)
Propensity of Loss Indicator
Social Vulnerability Index (IPVS)
Energy Losses
Unit: Distribution Station
Unit: 1 km2 quadricules
Unit: Census Sectors
Unit: 1 km2 quadricules Weighs among constructs
Primary grid Coverage of each distribution station
Losses (%) per distribution station
Higher propensity to losses
Commercial Losses
Potential Indicator
Percentage of cut-off customers
Average of household income (electricity consumption)
IPVS (Paulista Social Vulnerability Index)
10
a. mapping of the primary grid of all AES Eletropaulo circuits and association of each grid segment to the Transforming Distribution Station (ETD) that feeds it;
b. establishment of the coverage area of each ETD, through the geostatistical technique of Thiessen polygons, from the proximity of each geographical site to the grid segments;
c. mapping of the geographic density of cut-off customers (using a mesh of one square kilometer);
d. mapping of the concentration of electricity residential consumption, as proxy of household income and association to the same area units of the density of cut-off clients (using a mesh of one square kilometer);
e. mapping of Brazilian census sectors using the IPVS; f. spatial overlay (spatial junction) between geographical layers obtained in steps (b), (c), (d)
and (e); g. weighting among the four information dimensions associated to each area unit, for the
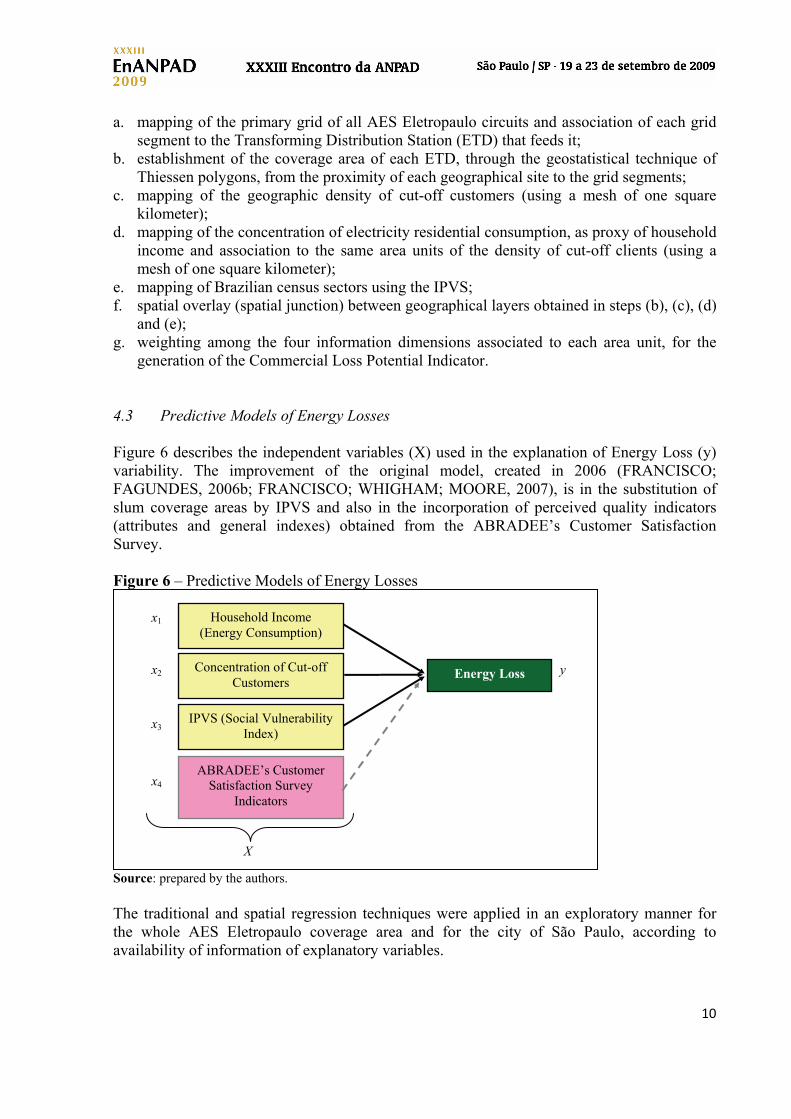
generation of the Commercial Loss Potential Indicator. 4.3 Predictive Models of Energy Losses Figure 6 describes the independent variables (X) used in the explanation of Energy Loss (y) variability. The improvement of the original model, created in 2006 (FRANCISCO; FAGUNDES, 2006b; FRANCISCO; WHIGHAM; MOORE, 2007), is in the substitution of slum coverage areas by IPVS and also in the incorporation of perceived quality indicators (attributes and general indexes) obtained from the ABRADEE’s Customer Satisfaction Survey. Figure 6 – Predictive Models of Energy Losses
Source: prepared by the authors. The traditional and spatial regression techniques were applied in an exploratory manner for the whole AES Eletropaulo coverage area and for the city of São Paulo, according to availability of information of explanatory variables.
Concentration of Cut-off Customers
Household Income (Energy Consumption)
Energy Loss
IPVS (Social Vulnerability Index)
ABRADEE’s Customer Satisfaction Survey
Indicators
x1
x2
x3
x4
y
X
11
5. Results The use of ABRADEE’s Survey indicators was initiated with the investigation of direct association (simple and spatial) between customer satisfaction and energy loss. In such a context, we decompose (weighted per area) energy losses values for each sampled municipality and district. Table 1 shows results for diverse tested models. Association is relatively high considering GWR technique, highlighting ISQP and information and communication quality area (IDAR). Table 1 – Comparison between explanatory models of customer satisfaction from energy loss
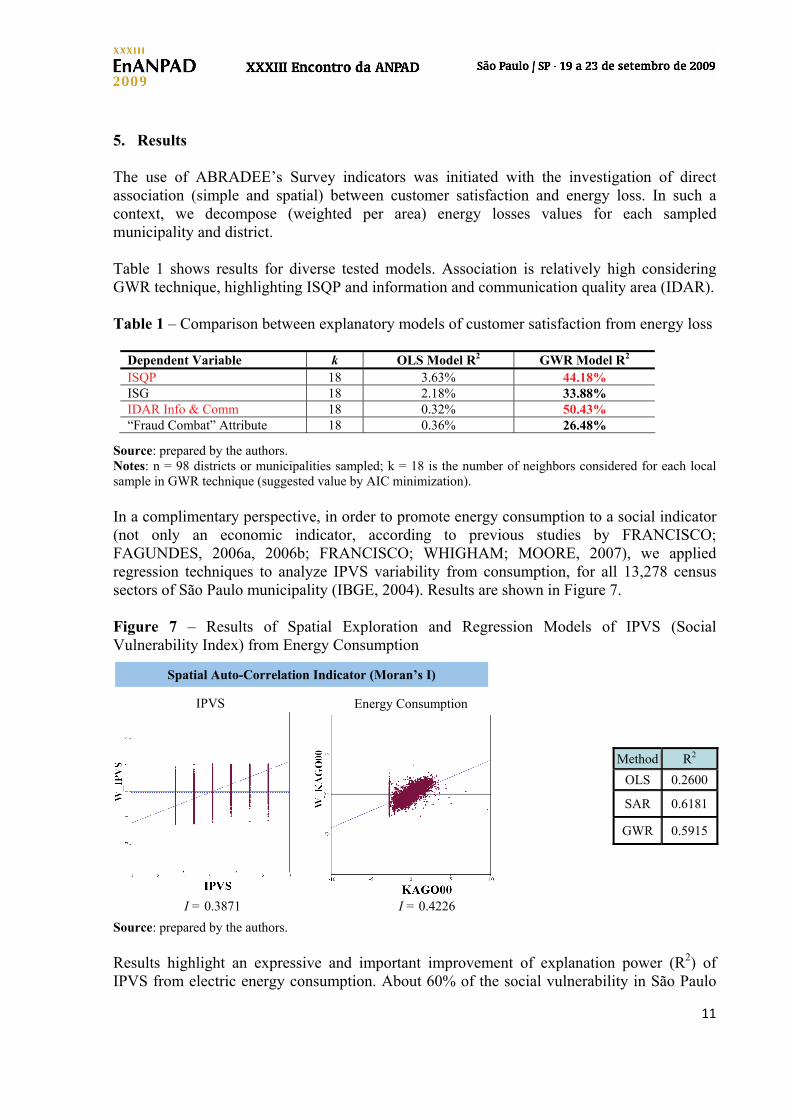
Source: prepared by the authors. Notes: n = 98 districts or municipalities sampled; k = 18 is the number of neighbors considered for each local sample in GWR technique (suggested value by AIC minimization). In a complimentary perspective, in order to promote energy consumption to a social indicator (not only an economic indicator, according to previous studies by FRANCISCO; FAGUNDES, 2006a, 2006b; FRANCISCO; WHIGHAM; MOORE, 2007), we applied regression techniques to analyze IPVS variability from consumption, for all 13,278 census sectors of São Paulo municipality (IBGE, 2004). Results are shown in Figure 7. Figure 7 – Results of Spatial Exploration and Regression Models of IPVS (Social Vulnerability Index) from Energy Consumption
Source: prepared by the authors. Results highlight an expressive and important improvement of explanation power (R2) of IPVS from electric energy consumption. About 60% of the social vulnerability in São Paulo
Dependent Variable k OLS Model R2 GWR Model R2 ISQP 18 3.63% 44.18% ISG 18 2.18% 33.88% IDAR Info & Comm 18 0.32% 50.43% “Fraud Combat” Attribute 18 0.36% 26.48%
Method R2 OLS 0.2600
SAR 0.6181
GWR 0.5915
Spatial Auto-Correlation Indicator (Moran’s I)
I = 0.3871 I = 0.4226
Energy Consumption IPVS
12
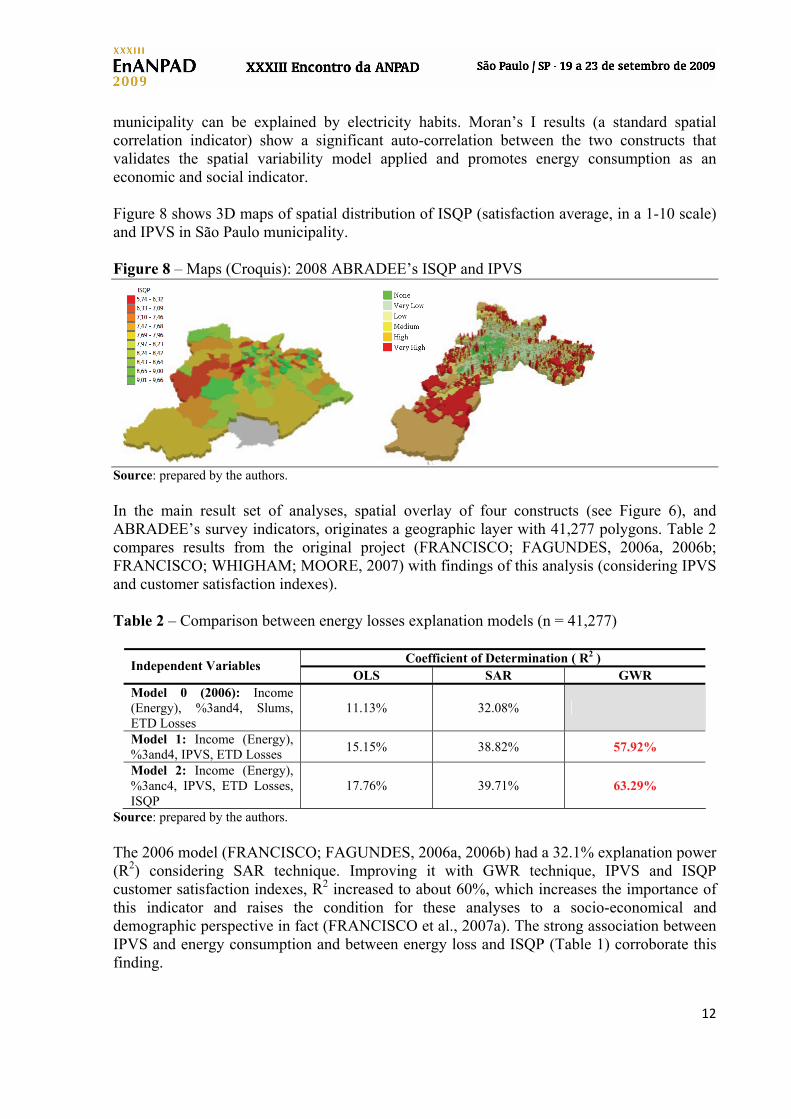
municipality can be explained by electricity habits. Moran’s I results (a standard spatial correlation indicator) show a significant auto-correlation between the two constructs that validates the spatial variability model applied and promotes energy consumption as an economic and social indicator. Figure 8 shows 3D maps of spatial distribution of ISQP (satisfaction average, in a 1-10 scale) and IPVS in São Paulo municipality. Figure 8 – Maps (Croquis): 2008 ABRADEE’s ISQP and IPVS
Source: prepared by the authors. In the main result set of analyses, spatial overlay of four constructs (see Figure 6), and ABRADEE’s survey indicators, originates a geographic layer with 41,277 polygons. Table 2 compares results from the original project (FRANCISCO; FAGUNDES, 2006a, 2006b; FRANCISCO; WHIGHAM; MOORE, 2007) with findings of this analysis (considering IPVS and customer satisfaction indexes). Table 2 – Comparison between energy losses explanation models (n = 41,277)
Source: prepared by the authors. The 2006 model (FRANCISCO; FAGUNDES, 2006a, 2006b) had a 32.1% explanation power (R2) considering SAR technique. Improving it with GWR technique, IPVS and ISQP customer satisfaction indexes, R2 increased to about 60%, which increases the importance of this indicator and raises the condition for these analyses to a socio-economical and demographic perspective in fact (FRANCISCO et al., 2007a). The strong association between IPVS and energy consumption and between energy loss and ISQP (Table 1) corroborate this finding.
Coefficient of Determination ( R2 ) Independent Variables OLS SAR GWR
Model 0 (2006): Income (Energy), %3and4, Slums, ETD Losses
11.13% 32.08%
Model 1: Income (Energy), %3and4, IPVS, ETD Losses 15.15% 38.82% 57.92%
Model 2: Income (Energy), %3anc4, IPVS, ETD Losses, ISQP
17.76% 39.71% 63.29%
13
6. Concluding Remarks Developed in 2006 for the whole concession area of AES Eletropaulo, the Commercial Losses Potential Indicator already effectively contributed for definition of strategies in some processes and projects of the company. Such support takes place vis-à-vis at each source of loss detected, such as: combat to frauds only at connected clients and in certain geographical areas, regularization of illegal nuclei, recovery of cut-off clients through commercial strategies, and it may help in the better orientation of future installations of anti-fraud grids and specific equipment, among other strategies. Since the information utilized is internal and under AES Eletropaulo management, this methodology can be easily implemented and maintained. The innovation is in the integration of technical information, heterogeneous and no-integrated at first, such as total loss per transforming distribution station, and commercial information, such as average billed power consumption and the status (cut-off versus non-cut-off) of each consumer unit. Such integration is enabled by geographic information systems, and the generation of the indicator is made by the determination of geostatistical techniques, still of very limited application, and thus, pioneer in the power distribution industry. Actually, the incorporation of geographic data was proven to improve electricity loss detection, because it allowed for the quantification of contextual local effects, which are relevant to the field of operations management due to the existence of regional interdependence among the studied phenomenon. Results show this innovation is primordial for establishing better performance in energy loss reduction and for supporting social responsibility and cultural programs. AES Eletropaulo diminished its commercial loss in 0.8 percentage points from 2007 to 2008’s first quarters. Additionally, the inclusion of socio-demographic indicators by means of a vulnerability index in substitution of the rough information about the local presence of slums was revealed to improve the explanation for electricity losses. In fact, the association found between vulnerability, electricity consumption and energy loss suggest that electricity consumption and fraud are not only economic phenomena, but also socially determined. That may reinforce the need for special policies, both from the public and the private sector, to foster customer’s welfare and reduction of fraud levels by means of regionally driven initiatives. Coherently, the inclusion of an attitudinal indicator of satisfaction to explain losses also proved to be significant. In such a context, distributors can be motivated to face satisfaction not only as means to attract and retain customers, but also do reduce loss. Based on the findings of this study, loss can be considered to have social and market dimensions and processes to prevent it incorporate complementary operational and marketing orientations. In summary, this project aims to establish a geostatistical methodology for the identification of areas with greater potential energy losses (reducing operational costs), and to highlight the statistical relationship between socio-economical variables and energy losses, especially considering poverty indicators. Spatial modeling and geostatistical analysis are key elements for it. The incorporation of customer satisfaction indicators, based on an important survey, raised the condition of analysis to a new level: the one which considers cultural and socio-economic aspects.

14
As an opportunity, distributors may develop knowhow and data in order to improve their operational tactics for fraud prevention and market penetration, and even offer those skills to other sectors. However, the specificity of data required in this study may imply that this analysis is costly to reproduce. Also, the use of more granular data would result in more precise estimates than the current application with regionally aggregated data. However, with suitable adjustments regarding data availability, there is opportunity to expand this study to costly efficient designs and broader contexts. Hence this work is both novel and new in the energy distribution industry, and should be improved and incorporated in a larger set of optimization processes and in similar service and utility companies. References ABRADEE – Associação Brasileira dos Distribuidores de Energia Elétrica. Pesquisa ABRADEE da Satisfação do Cliente Residencial 2003 – Relatório Comparativo Eletropaulo. Rio de Janeiro, Brazil: Author, 2003. ABRADEE – Associação Brasileira dos Distribuidores de Energia Elétrica. Pesquisa ABRADEE da Satisfação do Cliente Residencial 2005 – Relatório Comparativo Eletropaulo. Rio de Janeiro, Brazil: Author, 2005. ABRADEE – Associação Brasileira dos Distribuidores de Energia Elétrica. Pesquisa ABRADEE da Satisfação do Cliente Residencial 2007 – Relatório Comparativo Eletropaulo. Rio de Janeiro, Brazil: Author, 2007. ABRADEE – Associação Brasileira dos Distribuidores de Energia Elétrica. Pesquisa ABRADEE da Satisfação do Cliente Residencial 2008 – Relatório Comparativo Eletropaulo. Rio de Janeiro, Brazil: Author, 2008. ABRADEE – Associação Brasileira dos Distribuidores de Energia Elétrica. Prêmio ABRADEE 2009 – Relatório Descritivo. Rio de Janeiro, Brazil: Author, 2009. ANEEL – Agência Nacional de Energia Elétrica. Biblioteca Virtual. Disponível em: <http://www.seade.gov.br>. Acesso em: Mar. 12, 2009. ANSELIN, L. Spatial Econometrics: methods and models. Dordrecht, The Netherlands: Kluwer Academic Publishers, 1988, 284 p.
BRADLOW, Eric T. et al. Spatial Models in Marketing, Marketing Letters, v. 16 (December), 2005, p. 267-78. BRITO, Luiz Artur Ledur; PIGNANELLI, Alexandre; CSILLAG, João Mário. Does Quality Management Improve Performance? A Longitudinal Multilevel Approach. In: ENCONTRO ANUAL DA ASSOCIAÇÃO NACIONAL DOS PROGRAMAS DE PÓS-GRADUAÇÃO EM ADMINISTRAÇÃO, 32, 2008, Rio de Janeiro: ANPAD, 2008. p. 1-16. 1 CD-ROM.

15
FILGUEIRA, Carlos; PERI, Andrés. América Latina: los rostros de la pobreza y sus causas determinantes. Santiago de Chile: Naciones Unidas, 2004. (Población y Desarrollo, n. 54/2004). FOTHERINGHAM, Stewart; BRUNSDON, Chris; CHARLTON, Martin. Geographically Weighted Regression: the analysis of spatially varying relationships. Hoboken, New Jersey: Wiley, 2002. 282 p. FRANCISCO, Eduardo de Rezende. Relação entre o Consumo de Energia Elétrica, a Renda e a Caracterização Econômica de Famílias de Baixa Renda do Município de São Paulo. 2006. Master Thesis (Mestrado em Administração de Empresas) – Escola de Administração de Empresas de São Paulo da Fundação Getulio Vargas, São Paulo, Brazil, 2006. FRANCISCO, Eduardo de Rezende; FAGUNDES, E. B. Geostatistical Study between Social-Economical Variables and Power Losses. IN: 1st Congress of Operational Excellence and Innovation of AES Latin America, São Paulo, Brazil, 2006a. FRANCISCO, Eduardo de Rezende; FAGUNDES, E. B. Estudo Geoestatístico entre Variáveis Sócio-Econômicas e Perdas de Energia. IN: 1ª Jornada Técnica AES Eletropaulo e AES Sul. São Paulo, Brazil, 2006b. FRANCISCO, Eduardo de Rezende; FAGUNDES, E. B.; WHIGHAM, Peter; MOORE, A. Fraud and Energy Losses: a Geostatistical Analysis. IN: NERI Conference 2007 – National Energy Research Institute. Auckland, New Zealand, 2007a. FRANCISCO, Eduardo de Rezende; ARANHA, Francisco; ZAMBALDI, Felipe; GOLDSZMIDT, Rafael. Electricity Consumption as a Predictor of Household Income: a spatial statistics approach. IN: Advances in Geoinformatics, XXIV, 315 p. ISBN: 978-3-540-73413-0. Editora Springer. Davis, Clodoveu Augusto; Monteiro, Antonio Miguel (org.), 2007b. FRANCISCO, Eduardo de Rezende; WHIGHAM, Peter; MOORE, A. Point Allocation Inside Polygons and GWR: An Experimental Analysis with Survey Data. IN: SIRC 2007 – The 19th Annual Colloquium of the Spatial Information Research Centre. University of Otago, Dunedin, New Zealand, 2007. GRIFFITH, D. A. Spatial Autocorrelation – a primer. Washington: Association of American Geographers, 1987, 87 p.
IBGE – BRAZILIAN INSTITUTE OF GEOGRAPHY AND STATISTICS. Censo Demográfico 2000: Características Gerais da População. Rio de Janeiro: IBGE, 2000. 178 p. IBGE – BRAZILIAN INSTITUTE OF GEOGRAPHY AND STATISTICS. Pesquisa Nacional por Amostra de Domicílios 2004. Rio de Janeiro, Brazil: Author, 2004. KAZTMAN, Ruben (Coord.). Activos y Estructuras de Oportunidades: estudios sobre las raíces de la vulnerabilidad social en Uruguay. Montevideo: CEPAL, 1999. 357 p.

16
MITTAL, Vikas; KAMAKURA, Wagner A; GOVIND, Rahul Geographic Patterns in Customer Service and Satisfaction: An Empirical Investigation, Journal of Marketing, v. 68 n. 3, 2004, p. 48-62. PAIVA, Ely Laureano. Manufacturing and Marketing Integration from a Cumulative Capabilities Perspective. In: ENCONTRO ANUAL DA ASSOCIAÇÃO NACIONAL DOS PROGRAMAS DE PÓS-GRADUAÇÃO EM ADMINISTRAÇÃO, 32, 2008, Rio de Janeiro: ANPAD, 2008. p. 1-16. 1 CD-ROM. SEADE – STATE DATA ANALYSIS SYSTEM FOUNDATION. Metodologia. In: ______. Índice Paulista de Vulnerabilidade Social: espaços e dimensões da pobreza nos municípios do Estado de São Paulo. São Paulo: SEADE, 2004. SMITH, Michael; GOODCHILD, Michael F.; LONGLEY, Paul A. Geospatial Analysis: a comprehensive guide to principles, techniques and software tools. Leicester, United Kingdom: Matador, 2007. 516 p.