country energy security indicator profile 2009
TRANSCRIPT
Country Energy Security Indicator Profile 2009

Prepared by the Energy Programme, Economic Development DivisionSecretariat of the Pacific Community
Suva, Fiji2012
Fiji Country Energy Security Indicator Profile 2009

© Copyright Secretariat of the Pacific Community (SPC), 2012
All rights for commercial / for profit reproduction or translation, in any form, reserved. SPC authorises the partial reproduction or translation of this material for scientific, educational or research purposes, provided that SPC and the source document are properly acknowledged. Permission to reproduce the document and/or translate in whole, in any form, whether for commercial / for profit or non-profit purposes, must be requested in writing. Original SPC artwork may not be altered or separately published without permission.
Original text: English
Secretariat of the Pacific Community Cataloguing-in-publication data
Fiji Country Energy Security Indicator Profile 2009 / prepared by the Energy Programme, Economic Development Division, Secretariat of the Pacific Community
1. Energy policy – Fiji.2. Power resources – Fiji.3. Energy security – Fiji.
I. Title II. Secretariat of the Pacific Community
333.79099611 AACR2
ISBN: 978-982-00-0547-1

Table of contents
ivFij i Country Energy Security Indicator Profi le 2009
Acknowledgement ................................................................................................................................................................................................................ vForeword ............................................................................................................................................................................................................................. viAbbreviations ...................................................................................................................................................................................................................... viiCountry profile ......................................................................................................................................................................................................................1Energy context ......................................................................................................................................................................................................................3FAESP key energy security outcome 1 – access to energy .................................................................................................................................................4FAESP key energy security outcome 2 – affordability ..........................................................................................................................................................6FAESP key energy security outcome 3 – efficiency and productivity ...................................................................................................................................8FAESP key energy security outcome 4 – environmental quality ..........................................................................................................................................9FAESP action theme 1 – Leadership, governance, coordination and partnership .............................................................................................................. 10FAESP action theme 2 – Capacity development, planning, policy and regulatory frameworks ...........................................................................................11FAESP action theme 3 – Energy production and supply ..................................................................................................................................................... 12
3.1 Petroleum and alternative fuels .......................................................................................................................................................................... 123.2 Renewable energy ............................................................................................................................................................................................. 13
FAESP action theme 4 – Energy conversion ....................................................................................................................................................................... 144.1 Electric power ..................................................................................................................................................................................................... 14
FAESP action theme 5 – End-use energy consumption ...................................................................................................................................................... 155.1 Transport energy use ......................................................................................................................................................................................... 155.2 Energy efficiency and conservation .................................................................................................................................................................... 15
FAESP action theme 6 – Energy data and information ....................................................................................................................................................... 16FAESP action theme 7 – Financing, monitoring and evaluation .......................................................................................................................................... 17
AcknowledgementThe Framework for Action on Energy Security in the Pacific (FAESP) country energy security indicator report 2009 was prepared by the Energy Programme of the Economic Development Division (EDD) of the Secretariat of the Pacific Community (SPC).
Many special thanks to the Fiji Department of Energy (FDOE) for their contribution in the coordination of the National Planning and Policy Workshop in October 2011.
SPC would also like to thank the European Union Energy Initiative – Partnership Dialogue Facility (EUEI PDF) for providing funds to SPC to carry out in-country technical activities and collect data required for the energy security indicators.
The cooperation of the many contributors to this edition is gratefully acknowledged. The source note below each table credits the various government and private sector agencies that have collaborated in furnishing the information for the booklet.
Fij i Country Energy Security Indicator Profi le 2009v
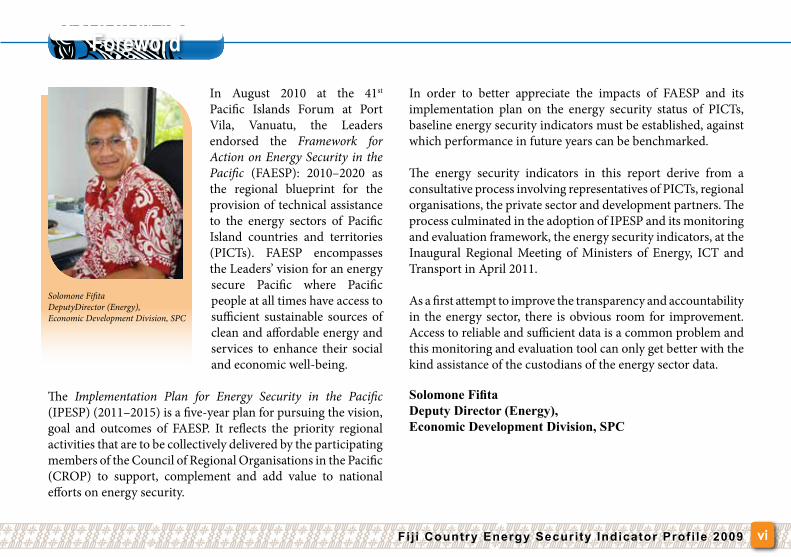
In August 2010 at the 41st Pacific Islands Forum at Port Vila, Vanuatu, the Leaders endorsed the Framework for Action on Energy Security in the Pacific (FAESP): 2010–2020 as the regional blueprint for the provision of technical assistance to the energy sectors of Pacific Island countries and territories (PICTs). FAESP encompasses the Leaders’ vision for an energy secure Pacific where Pacific people at all times have access to sufficient sustainable sources of clean and affordable energy and services to enhance their social and economic well-being.
The Implementation Plan for Energy Security in the Pacific (IPESP) (2011–2015) is a five-year plan for pursuing the vision, goal and outcomes of FAESP. It reflects the priority regional activities that are to be collectively delivered by the participating members of the Council of Regional Organisations in the Pacific (CROP) to support, complement and add value to national efforts on energy security.
In order to better appreciate the impacts of FAESP and its implementation plan on the energy security status of PICTs, baseline energy security indicators must be established, against which performance in future years can be benchmarked.
The energy security indicators in this report derive from a consultative process involving representatives of PICTs, regional organisations, the private sector and development partners. The process culminated in the adoption of IPESP and its monitoring and evaluation framework, the energy security indicators, at the Inaugural Regional Meeting of Ministers of Energy, ICT and Transport in April 2011.
As a first attempt to improve the transparency and accountability in the energy sector, there is obvious room for improvement. Access to reliable and sufficient data is a common problem and this monitoring and evaluation tool can only get better with the kind assistance of the custodians of the energy sector data.
Solomone FifitaDeputy Director (Energy), Economic Development Division, SPC
Foreword
Solomone FifitaDeputyDirector (Energy),Economic Development Division, SPC
viFij i Country Energy Security Indicator Profi le 2009

Abbreviations
Fij i Country Energy Security Indicator Profi le 2009vii
ADB Asian Development Bank
ADO automotive diesel oil
Ave. average
CDB China Development Bank
CO2 carbon dioxide
DPK dual purpose kerosene
e. estimate
EESLI Ecosystems, Environment and Sustainable Livelihoods Initiative
EEZ exclusive economic zone
FAESP Framework for Action on Energy Security in the Pacific
FDoE Fiji Department of Energy
FEA Fiji Electricity Authority
14 FICs Forum Island countries (SIS and non-SIS affiliation)
FNU Fiji National University
FSC Fiji Sugar Corporation
GDP gross domestic product
GHG greenhouse gases
GJ gigajoules
GWh giga Watt hours
HIES household income and expenditure survey
HFO heavy fuel oil
IPP independent power producer
IUCN International Union for Conservation of Nature
km kilometre
LPG liquefied petroleum gas
MEPS minimum energy performance standards
MJ megajoules
n.a (data) not available
N/A (indicator) not applicable
Non-SIS Non-Forum small island state members – Fiji, FSM, PNG, Samoa, Solomon Islands, Tonga & Vanuatu
PICs Pacific Island countries
PPA Pacific Power Association
ppm parts per million
PRISM Pacific Regional Information System, Statistics for Development at the Secretariat of the Pacific Community
PV photo voltaic
PWD Public Works Department
RE renewable energy
RET renewable energy technology
SEFP Sustainable Energy Financing Project
SHS solar home systems
SIS Forum small island states – Cook Islands, Kiribati, Nauru, Niue, Palau, RMI & Tuvalu
SPREP – PIGGAREP
Secretariat of the Pacific Regional Environment Programme – Pacific Islands Greenhouse Gas Abatement through Renewable Energy Project
ULP unleaded petrol (another name for motor gasoline)
UNDP United Nations Development Programme
UNFCCC United Nations Framework Convention on Climate Change
USP University of the South Pacific
1Fij i Country Energy Security Indicator Profi le 2009
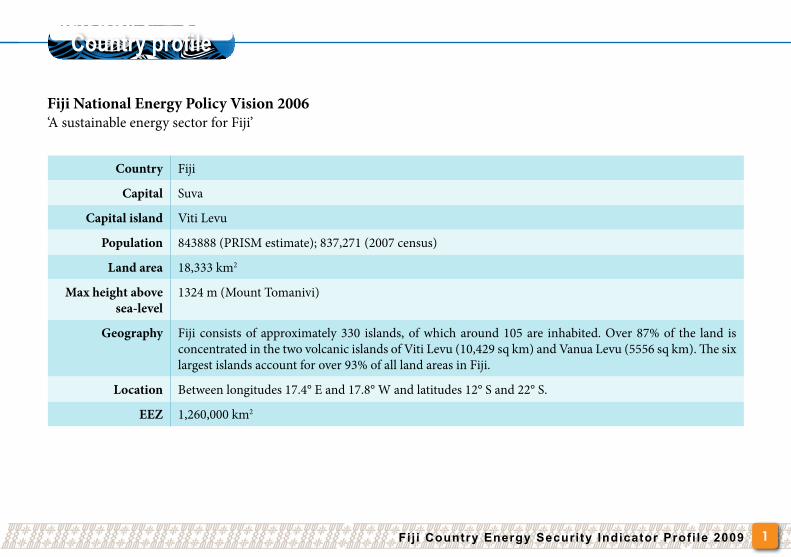
Fiji National Energy Policy Vision 2006‘A sustainable energy sector for Fiji’
Country Fiji
Capital Suva
Capital island Viti Levu
Population 843888 (PRISM estimate); 837,271 (2007 census)
Land area 18,333 km2
Max height above sea-level
1324 m (Mount Tomanivi)
Geography Fiji consists of approximately 330 islands, of which around 105 are inhabited. Over 87% of the land is concentrated in the two volcanic islands of Viti Levu (10,429 sq km) and Vanua Levu (5556 sq km). The six largest islands account for over 93% of all land areas in Fiji.
Location Between longitudes 17.4° E and 17.8° W and latitudes 12° S and 22° S.
EEZ 1,260,000 km2
Country profile
Fij i Country Energy Security Indicator Profi le 20092
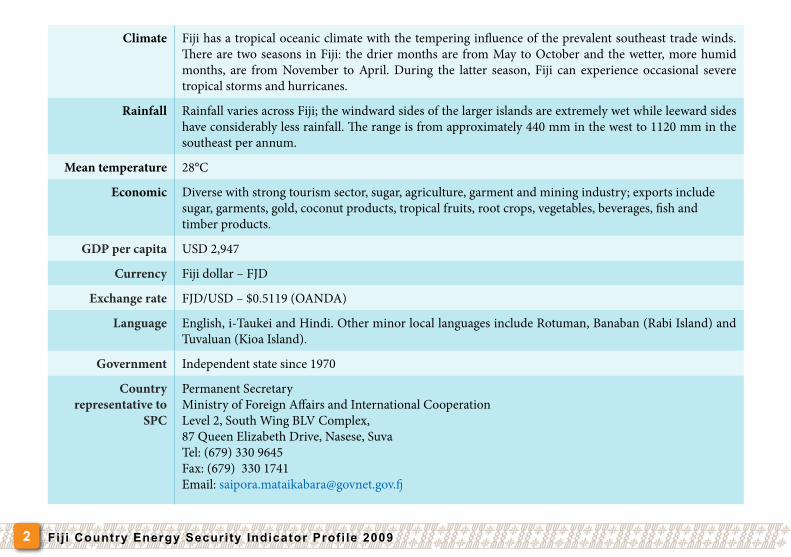
Climate Fiji has a tropical oceanic climate with the tempering influence of the prevalent southeast trade winds. There are two seasons in Fiji: the drier months are from May to October and the wetter, more humid months, are from November to April. During the latter season, Fiji can experience occasional severe tropical storms and hurricanes.
Rainfall Rainfall varies across Fiji; the windward sides of the larger islands are extremely wet while leeward sides have considerably less rainfall. The range is from approximately 440 mm in the west to 1120 mm in the southeast per annum.
Mean temperature 28°C
Economic Diverse with strong tourism sector, sugar, agriculture, garment and mining industry; exports include sugar, garments, gold, coconut products, tropical fruits, root crops, vegetables, beverages, fish and timber products.
GDP per capita USD 2,947
Currency Fiji dollar – FJD
Exchange rate FJD/USD – $0.5119 (OANDA)
Language English, i-Taukei and Hindi. Other minor local languages include Rotuman, Banaban (Rabi Island) and Tuvaluan (Kioa Island).
Government Independent state since 1970
Country representative to
SPC
Permanent Secretary Ministry of Foreign Affairs and International Cooperation Level 2, South Wing BLV Complex, 87 Queen Elizabeth Drive, Nasese, SuvaTel: (679) 330 9645Fax: (679) 330 1741Email: [email protected]

3Fij i Country Energy Security Indicator Profi le 2009
Energy contextEnergy consumption in Fiji like the rest of PICTs is heavily dependent on petroleum fuels, which roughly account for over 91% of the country’s consumption. Liquid petroleum fuel is currently supplied to Fiji by three multinational petroleum companies (Pacific Energy, Mobil and Total), which ship fuel in medium range tankers mainly from Singapore and South Korea. In 2009, around 259 million litres of diesel, 58 million litres of petrol, 191 million litres of kerosene and 16 kilo tonnes of liquified petroleum gas (LPG)were imported into the country. LPG is mainly imported from Australia by Fiji Gas and Blue Gas. Fuel import for 2009 stood in the vicinity of USD 345 million dollars with the current gross domestic product (GDP) of USD 2.48 billion dollars. Fiji also re-exports fuels to a number of small PICs such as Tuvalu and Tonga. The transport sector (land, maritime and air) is perceived as the major sector that consumes fuel imported to Fiji accounting for some 70% of the fuel consumed. Other petroleum fuel products such as heavy fuel oil are also imported to Fiji.
For the power sector, around 72% of households in Fiji are connected to the electricity grid network provided by the Fiji Electricity Authority (FEA). In 2009, FEA generated 777 GWh of electricity, of which 715 GWh was sold, and recorded an estimated 11% distribution loss.
Electricity is supplied by FEA to the two biggest islands (Viti Levu and Vanua Levu) and also the island of Ovalau. Of the electricity generated in 2009, 61% was sourced from renewable energy, of which hydro contributed 58%, wind 1% and 2% from bagasse and biomass supplied by the independent power producers — Fiji Sugar Corporation and Tropic Woods Limited. Around 75 million litres of diesel fuel and heavy fuel oil were consumed for electricity generation in 2009.
For areas not supplied by FEA, the Public Works Department (PWD) provides power supply to government stations at rural and outer islands whilst the FDOE’s Rural Electrification Unit targets rural villages and communities installing diesel and micro hydro mini-grid systems, including solar home systems. In 2009, over 20,000 households in Fiji have been identified to be in access of small scale power.
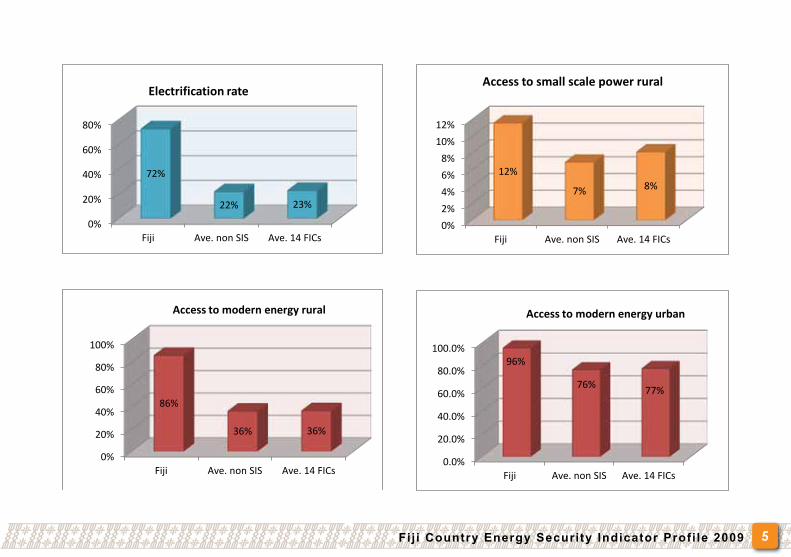
The 2009 baseline energy security indicators presented in this report are compiled and structured according to the four key outcomes to energy security and the seven action themes of FAESP. Graphical comparison included in the analysis provides a snapshot of Fiji’s situation compared to other Forum small island states (SIS) and Forum Island countries.
Fij i Country Energy Security Indicator Profi le 20094
No. FAESPindicators
Explanatory notes
1 Electrification rate (%)
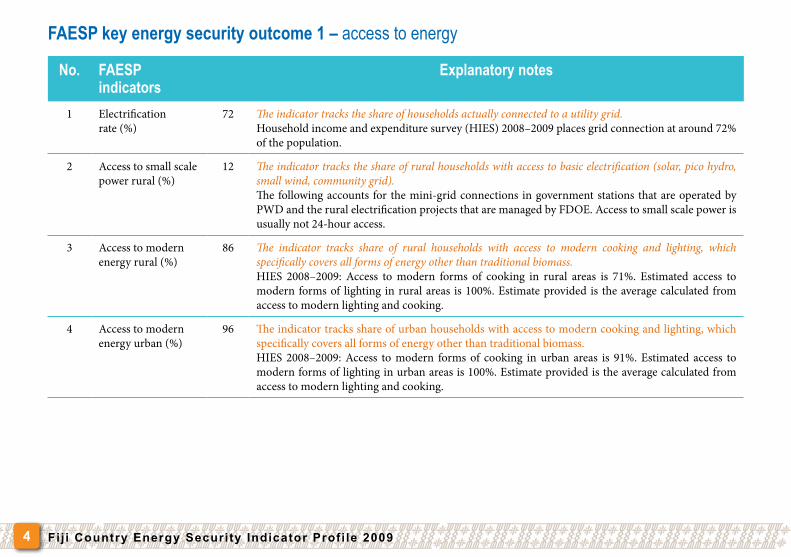
72 The indicator tracks the share of households actually connected to a utility grid. Household income and expenditure survey (HIES) 2008–2009 places grid connection at around 72% of the population.
2 Access to small scale power rural (%)
12 The indicator tracks the share of rural households with access to basic electrification (solar, pico hydro, small wind, community grid). The following accounts for the mini-grid connections in government stations that are operated by PWD and the rural electrification projects that are managed by FDOE. Access to small scale power is usually not 24-hour access.
3 Access to modern energy rural (%)
86 The indicator tracks share of rural households with access to modern cooking and lighting, which specifically covers all forms of energy other than traditional biomass.HIES 2008–2009: Access to modern forms of cooking in rural areas is 71%. Estimated access to modern forms of lighting in rural areas is 100%. Estimate provided is the average calculated from access to modern lighting and cooking.
4 Access to modern energy urban (%)
96 The indicator tracks share of urban households with access to modern cooking and lighting, which specifically covers all forms of energy other than traditional biomass.HIES 2008–2009: Access to modern forms of cooking in urban areas is 91%. Estimated access to modern forms of lighting in urban areas is 100%. Estimate provided is the average calculated from access to modern lighting and cooking.
FAESP key energy security outcome 1 – access to energy
5Fij i Country Energy Security Indicator Profi le 2009
0%2%4%6%8%
10%12%
Fiji Ave. non SIS Ave. 14 FICs
12%
7% 8%
Access to small scale power rural
0%
20%
40%
60%
80%
Fiji Ave. non SIS Ave. 14 FICs
72%
22% 23%
Electrification rate
0%
20%
40%
60%
80%
100%
Fiji Ave. non SIS Ave. 14 FICs
86%
36% 36%
Access to modern energy rural
0.0%
20.0%
40.0%
60.0%
80.0%
100.0%
Fiji Ave. non SIS Ave. 14 FICs
96%
76% 77%
Access to modern energy urban

Fij i Country Energy Security Indicator Profi le 20096
No. FAESPindicators
Explanatory notes
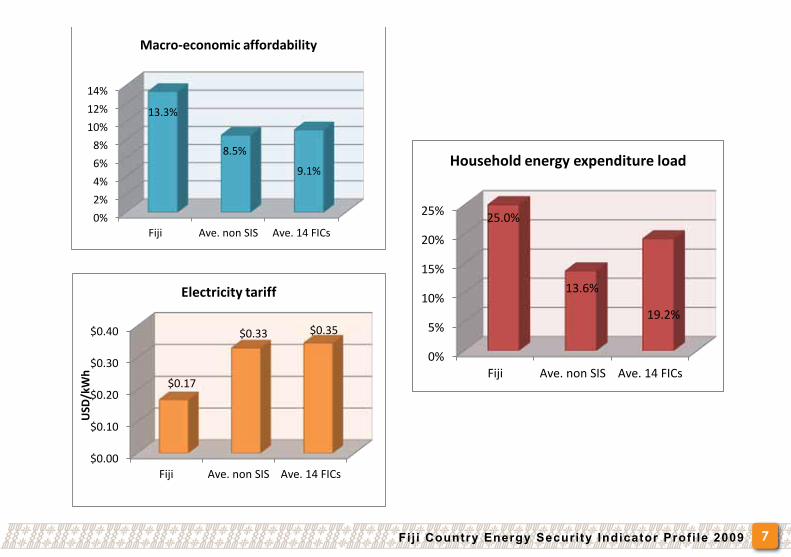
5 Macro-economic affordability (percentage)
13.33 The indicator tracks fuel imports as a percentage of GDP. The higher the figure, the more vulnerable an economy is towards world market price volatility. The following figure was calculated from reference data provided by the Fiji Bureau of Statistics website: Fuel imports over total GDP for 2009 were USD 344,955,540 / USD 2,487,066,150. Fuel imports calculated in this analysis is accounted from diesel (ADO and IDO), motor gasoline (Mogas), dual purpose kerosene (DPK) and LPG.
6 Electricity tariff (USD/kWh)
0.17 The indicator tracks average tariffs for the year (all tariff categories, i.e. residential, commercial and industrial). Requires averaging during the year as tariffs in most PICs are adjusted several times in a year.Refer to the table on the right for reference calculation of the average tariff.
Electricity tariff 0.17Commercial block USD/kWh 0.19Industrial block USD/kWh 0.19Residential block USD/kWh 0.121-250 kWh USD/kWh 0.11>250 USD/kWh 0.12Lifeline % 62.8%
Referenced electricity tariff calculation based on FEA data
7 Electricity lifeline (%)
62.8 Relation between average tariff and lifeline tariff if a lifeline tariff exists.Refer to the table on the right for reference calculation of the electricity lifeline.
8 Household energy expenditure load (%)
25 The indicator tracks average household expenditure for energy per year as a percentage of average household income. The analysis was based on the 2008–2009 HIES. Reporting gives a breakdown of annual expenditure from the calculation of the total household operation expenditure and total transport expenditure.
FAESP key energy security outcome 2 – affordability
7Fij i Country Energy Security Indicator Profi le 2009
0%2%4%6%8%
10%12%14%
Fiji Ave. non SIS Ave. 14 FICs
13.3%
8.5%
9.1%
Macro-economic affordability
$0.00
$0.10
$0.20
$0.30
$0.40
Fiji Ave. non SIS Ave. 14 FICs
$0.17
$0.33 $0.35
USD
/kW
h
Electricity tariff
0%
5%
10%
15%
20%
25%
Fiji Ave. non SIS Ave. 14 FICs
25.0%
13.6%
19.2%
Household energy expenditure load

Fij i Country Energy Security Indicator Profi le 20098
No. FAESPindicators
Explanatory notes
9 Energy intensity (MJ/USD)
8.4 The indicator tracks the amount of energy utilised to produce 1 USD of GDP.
10 Productive power use (%)
70.9 The indicator tracks the share of commercial and industrial use of electricity in total supply.Data calculated from the financial summary of the FEA 2009 Annual Report.
FAESP key energy security outcome 3 – efficiency and productivity
0.00
2.00
4.00
6.00
8.00
10.00
Fiji Ave. non SIS Ave. 14 FICs
$8.4
$6.2$7.0
MJ/
USD
Energy intensity
67%
68%
69%
70%
71%
Fiji Ave. non SIS Ave. 14 FICs
70.9%70.2%
68.3%
% C
omm
erci
al a
nd in
dust
rial
elec
tric
iy u
se
Productive power use
9Fij i Country Energy Security Indicator Profi le 2009
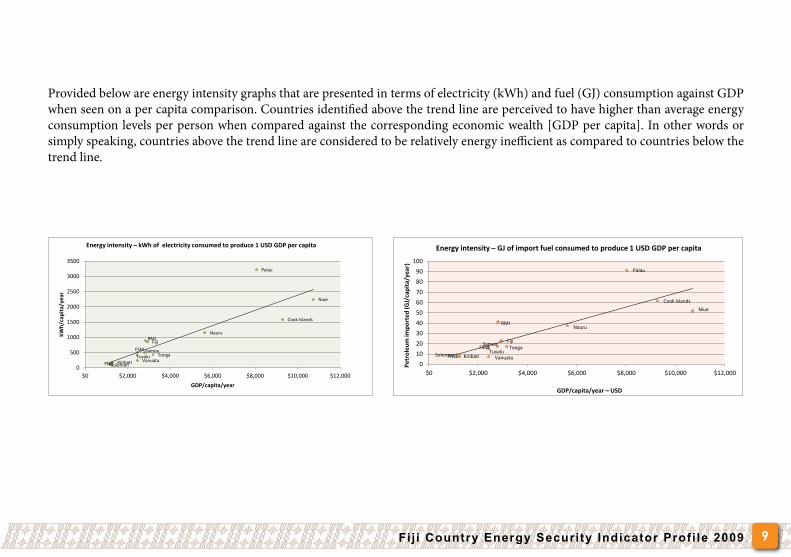
Provided below are energy intensity graphs that are presented in terms of electricity (kWh) and fuel (GJ) consumption against GDP when seen on a per capita comparison. Countries identified above the trend line are perceived to have higher than average energy consumption levels per person when compared against the corresponding economic wealth [GDP per capita]. In other words or simply speaking, countries above the trend line are considered to be relatively energy inefficient as compared to countries below the trend line.
Cook Islands
FijiFSM
Kiribati
Nauru
Niue
Palau
PNG
RMI
Samoa
Solomon
TongaTuvaluVanuatu
0
500
1000
1500
2000
2500
3000
3500
$0 $2,000 $4,000 $6,000 $8,000 $10,000 $12,000
kWh/
capi
ta/y
ear
GDP/capita/year
Energy intensity – kWh of electricity consumed to produce 1 USD GDP per capita
Cook Islands
FijiFSM
Kiribati
Nauru
Niue
Palau
PNG
RMI
Samoa
SolomonTonga
TuvaluVanuatu
0102030405060708090
100
$0 $2,000 $4,000 $6,000 $8,000 $10,000 $12,000
Petr
oleu
m im
port
ed (G
J/ca
pita
/yea
r)
GDP/capita/year – USD
Energy intensity – GJ of import fuel consumed to produce 1 USD GDP per capita
Fij i Country Energy Security Indicator Profi le 200910
No. FAESPindicators
Explanatory notes
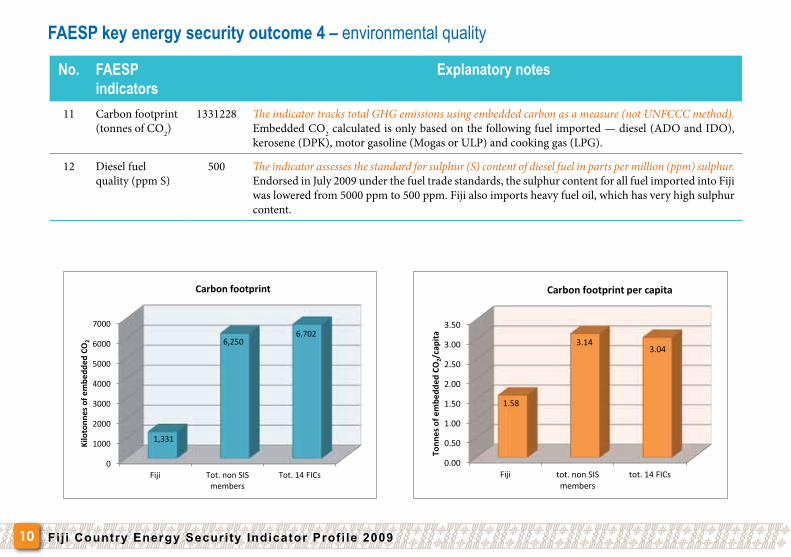
11 Carbon footprint (tonnes of CO2)
1331228 The indicator tracks total GHG emissions using embedded carbon as a measure (not UNFCCC method). Embedded CO2 calculated is only based on the following fuel imported — diesel (ADO and IDO), kerosene (DPK), motor gasoline (Mogas or ULP) and cooking gas (LPG).
12 Diesel fuel quality (ppm S)
500 The indicator assesses the standard for sulphur (S) content of diesel fuel in parts per million (ppm) sulphur. Endorsed in July 2009 under the fuel trade standards, the sulphur content for all fuel imported into Fiji was lowered from 5000 ppm to 500 ppm. Fiji also imports heavy fuel oil, which has very high sulphur content.
FAESP key energy security outcome 4 – environmental quality
0.00
0.50
1.00
1.50
2.00
2.50
3.00
3.50
Fiji tot. non SIS members
tot. 14 FICs
1.58
3.143.04
Tonn
es o
f em
bedd
ed C
O2/
capi
ta
Carbon footprint per capita
0
1000
2000
3000
4000
5000
6000
7000
Fiji Tot. non SIS members
Tot. 14 FICs
1,331
6,2506,702
Kilo
tonn
es o
f em
bedd
ed C
O2
Carbon footprint

11Fij i Country Energy Security Indicator Profi le 2009
FAESP action theme 1 – Leadership, governance, coordination and partnership
No. FAESPindicators
Explanatory notes
13 Status of energy administration (score)
2 The indicator assesses the status the energy administration has in the country. (Score system: Energy ministry = 3; Energy department = 2; Energy office = 1)FDOE is under the Ministry of Works, Transport and Public Utilities. FDOE is the government’s focal point for Fiji’s energy sector, energy policy development and oversight of off-grid rural electrification work. FEA is responsible for electricity supply nationally and operates on the islands of Viti Levu, Vanua Levu and Ovalau. PWD is responsible for the electrification of government stations in remote and outer islands. There are three petroleum companies (Mobil, Total and Pacific Energy) that import petroleum products into Fiji. LPG is imported by Fiji Gas and Blue Gas. Electricity and fuel prices are regulated by the Commerce Commission.
14 Energy legislation (score) 2 The indicator assesses the status of the energy sector legislation in the country. (Score system: Updated energy act = 3; Adopted energy policy = 2; Subsector act or policy = 1) There is no energy act for Fiji. However, the following policies and legislation guide the energy sector administration: the endorsed National Energy Policy and Action Plan 2006; the Rural Electrification Policy 1993, which allows FDOE to undertake the administration and control of the rural electrification programme; the Electricity Act (Ca. 1980); the Petroleum Act (Cap. 190); the Fuel and Power Emergency Act (Cap. 191); the Public Enterprise Act 1996; the Commerce Act 1998, the Electricity Reform Bill 1998; the Environment Management Act 2005; the Public Private Partnership Act 2006; and the Renewable Energy service Company (RESCO) Bill 2004.
15 Co-ordination and consultation (score)
1 The indicator aims to measure how decisions and directions given at regional or subregional events translate into practical action at national level. (Score system: Meetings lead to relevant national action = 1; No action = 0)Fiji actively participates in regional activities; is a utility member of PPA. Clear sense of collaboration among key energy stakeholders in the country.

Fij i Country Energy Security Indicator Profi le 200912
FAESP action theme 2 – Capacity development, planning, policy and regulatory frameworks
No. FAESPindicators
Explanatory notes
16 Energy planning status (score)
3 The indicator assesses the state/quality of energy planning. It distinguishes between integrated planning and subsector (i.e. power, petroleum) planning. (Score system: Whole of energy sector plan/roadmap operational with M&E framework = 3; Subsector plan operational with M&E framework = 2; Energy sector plans in preparation = 1)Endorsed National Energy Policy and Action Plan is comprehensive; FEA has a rolling development plan; National Strategic Development Plan.
17 Energy sector regulation (score)
1 The indicator assesses energy sector regulation. It measures the progress towards a regulator independent of government or regulated entities. (Score system: Independent whole of energy sector regulator established = 3; Whole of energy sector regulator established = 2; Subsector regulator established = 1) Regulatory roles governed under the Commerce Commission for electricity and fuel prices. LPG prices are not fully regulated.
18 Enabling framework for private sector participation (score)
1 The indicator assesses progress towards an enabling framework for private sector participation in selling electricity to the grid. (Score system: Standard power purchase and petroleum supply agreements operational = 3: Standard agreements for subsector operational = 2; Standard agreements in preparation = 1)No specific legislation in place. FEA has full authority over the inclusion of IPPs to supply into their grids. The current inclusion of IPPs such as FSC, Vatukoula Gold Mines and Tropic Woods into the FEA supply line is based on tariff purchases that are determined by FEA. The Hotels Aid Act provides some allowance for the inclusion of hotels to sell excess electricity to the FEA grid.
19 Private sector contribution (%)
2 The indicator tracks the share of electricity produced by independent power producers under a power purchase agreement.The average generation mix for 2009 was 58% hydro, 25% diesel, 14% heavy fuel oil, 1% wind with the other 2% provided by the independent power producers — Tropik Woods and Fiji Sugar Corporation (FEA 2009 Annual Report).

13Fij i Country Energy Security Indicator Profi le 2009
No. FAESPindicators
Explanatory notes
20 Fuel supply security (days)
70 The indicator measures the number of days a country can keep operating in case of a petroleum product supply interruption. Calculation used if actual data is not available. (Size of total petroleum storage (m3)/Average petroleum product consumption per day). Indicative estimate established during the National Planning and Policy Workshop in Oct ober 2011. Collection of fuel storage capacity data from the petroleum companies was not possible during the compilation of this booklet.
21 Fuel supply diversity (%)
0 The indicator measures the share of locally produced fuel (biofuel or fossil fuel) as a percentage of total supply. No major biofuel projects were undertaken in Fiji in 2009. Large scale biofuel production began in 2010 on the island of Koro.
22 Fuel supply chain arrangements (score)
0 The indicator assesses control of countries over fuel supply chain. (Score system: Joint procurement scheme operational = 2; Participation in preparation of joint procurement arrangements = 1)No joint fuel procurement arrangement. Fuel imported is directly under the multinational petroleum companies — Pacific Energy, Mobil and Total — with importation mainly via South Korea and Singapore. LPG imports are mostly from Australia.
FAESP action theme 3 – Energy production and supply3.1 Petroleum and alternative fuels
Fij i Country Energy Security Indicator Profi le 200914
3.2 Renewable energy
No. FAESPindicators
Explanatory notes
23 Renewable energy share (%)
8.81 The indicator measures the share of renewable energy as a percentage of total supply for a given year.Referenced calculation takes into account only the RE supplied by FEA as presented in their 2009 Annual Report. Contribution from other RE systems installed by FDOE and PWD was not ascertained.
24 Renewable resource knowledge (score)
2 The indicator assesses the quality of knowledge of national renewable energy potential. (Score system: Comprehensive assessment of all RE resources including cost for each source = 3; Comprehensive physical assessment of all RE resources = 2; Resource assessments fragmentary, under way = 1)Extensive data sets and study reports available on renewable energy resources: solar PV systems, hydro, wind, biomass, biogas and biofuel. On-going monitoring and assessments undertaken for wind, ocean and biofuel. Available reports can be accessed from ADB, World Bank, FDOE, FEA, SPC, UNDP, IUCN, SPREP-PIGGAREP, USP and FNU.
25 Least-cost RE development plan (score)
1 The indicator assesses if data and information on RE have been translated into a least-cost development plan that gives priority to the most economical RE resource or application. (Score system: Least-cost development plan operational = 2; Least-cost development plan in preparation = 1)No specific least-cost development plan in place but priority activities identified in national policy and action plan.
15Fij i Country Energy Security Indicator Profi le 2009
FAESP action theme 4 – Energy conversion4.1 Electric power
No. FAESPindicators
Explanatory notes
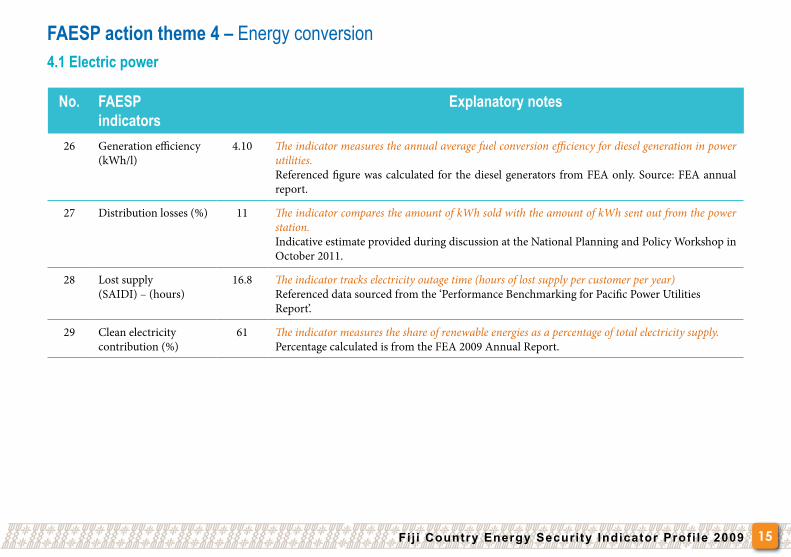
26 Generation efficiency (kWh/l)
4.10 The indicator measures the annual average fuel conversion efficiency for diesel generation in power utilities.Referenced figure was calculated for the diesel generators from FEA only. Source: FEA annual report.
27 Distribution losses (%) 11 The indicator compares the amount of kWh sold with the amount of kWh sent out from the power station.Indicative estimate provided during discussion at the National Planning and Policy Workshop in October 2011.
28 Lost supply (SAIDI) – (hours)
16.8 The indicator tracks electricity outage time (hours of lost supply per customer per year)Referenced data sourced from the ‘Performance Benchmarking for Pacific Power Utilities Report’.
29 Clean electricity contribution (%)
61 The indicator measures the share of renewable energies as a percentage of total electricity supply.Percentage calculated is from the FEA 2009 Annual Report.
Fij i Country Energy Security Indicator Profi le 200916
No. FAESPindicators
Explanatory notes
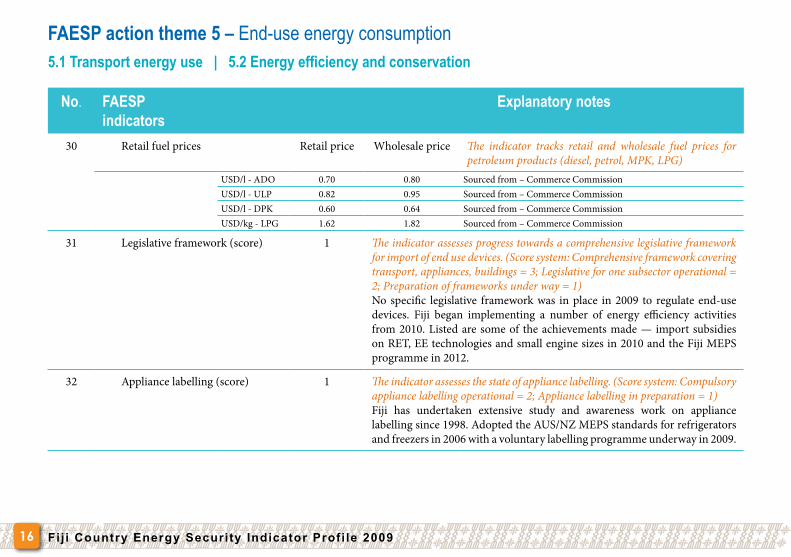
30 Retail fuel prices Retail price Wholesale price The indicator tracks retail and wholesale fuel prices for petroleum products (diesel, petrol, MPK, LPG)
USD/l - ADO 0.70 0.80 Sourced from – Commerce CommissionUSD/l - ULP 0.82 0.95 Sourced from – Commerce CommissionUSD/l - DPK 0.60 0.64 Sourced from – Commerce CommissionUSD/kg - LPG 1.62 1.82 Sourced from – Commerce Commission
31 Legislative framework (score) 1 The indicator assesses progress towards a comprehensive legislative framework for import of end use devices. (Score system: Comprehensive framework covering transport, appliances, buildings = 3; Legislative for one subsector operational = 2; Preparation of frameworks under way = 1)No specific legislative framework was in place in 2009 to regulate end-use devices. Fiji began implementing a number of energy efficiency activities from 2010. Listed are some of the achievements made — import subsidies on RET, EE technologies and small engine sizes in 2010 and the Fiji MEPS programme in 2012.
32 Appliance labelling (score) 1 The indicator assesses the state of appliance labelling. (Score system: Compulsory appliance labelling operational = 2; Appliance labelling in preparation = 1)Fiji has undertaken extensive study and awareness work on appliance labelling since 1998. Adopted the AUS/NZ MEPS standards for refrigerators and freezers in 2006 with a voluntary labelling programme underway in 2009.
FAESP action theme 5 – End-use energy consumption5.1 Transport energy use | 5.2 Energy efficiency and conservation
17Fij i Country Energy Security Indicator Profi le 2009
FAESP action theme 6 – Energy data and information
No. FAESPindicators
Explanatory notes
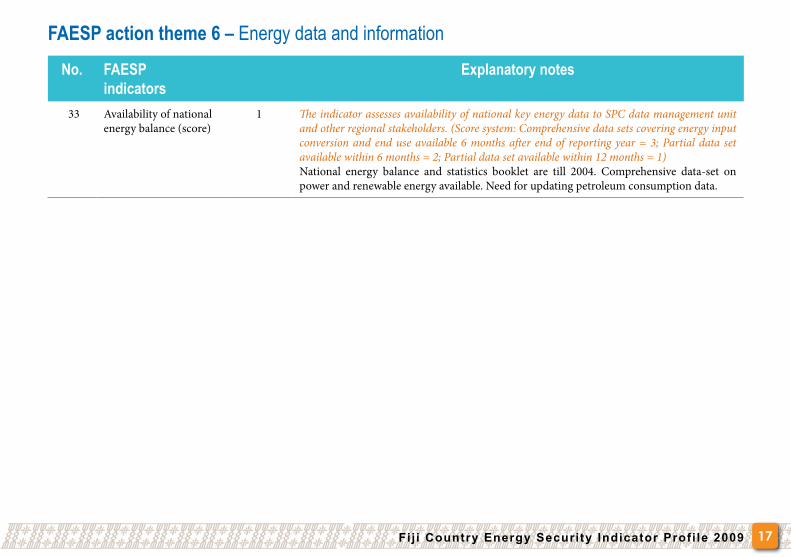
33 Availability of national energy balance (score)
1 The indicator assesses availability of national key energy data to SPC data management unit and other regional stakeholders. (Score system: Comprehensive data sets covering energy input conversion and end use available 6 months after end of reporting year = 3; Partial data set available within 6 months = 2; Partial data set available within 12 months = 1)National energy balance and statistics booklet are till 2004. Comprehensive data-set on power and renewable energy available. Need for updating petroleum consumption data.
Fij i Country Energy Security Indicator Profi le 200918
FAESP action theme 7 – Financing, monitoring & evaluation
No. FAESPindicators
Explanatory notes
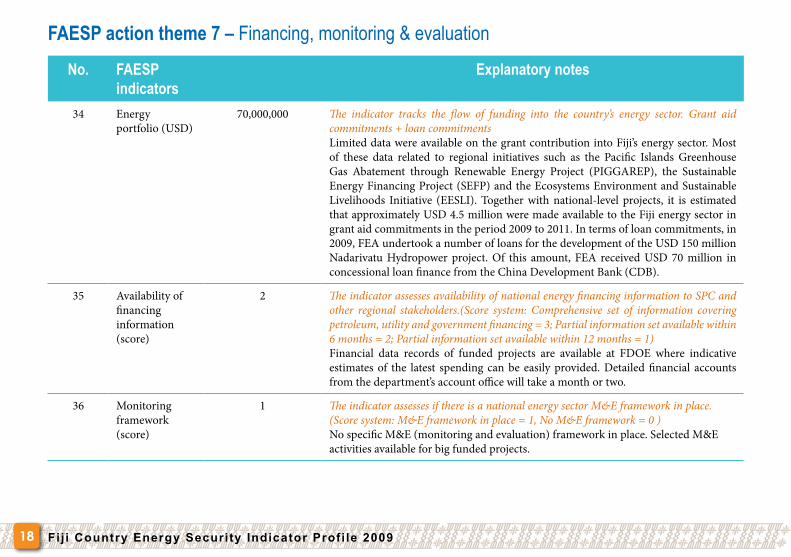
34 Energy portfolio (USD)
70,000,000 The indicator tracks the flow of funding into the country’s energy sector. Grant aid commitments + loan commitments Limited data were available on the grant contribution into Fiji’s energy sector. Most of these data related to regional initiatives such as the Pacific Islands Greenhouse Gas Abatement through Renewable Energy Project (PIGGAREP), the Sustainable Energy Financing Project (SEFP) and the Ecosystems Environment and Sustainable Livelihoods Initiative (EESLI). Together with national-level projects, it is estimated that approximately USD 4.5 million were made available to the Fiji energy sector in grant aid commitments in the period 2009 to 2011. In terms of loan commitments, in 2009, FEA undertook a number of loans for the development of the USD 150 million Nadarivatu Hydropower project. Of this amount, FEA received USD 70 million in concessional loan finance from the China Development Bank (CDB).
35 Availability of financing information (score)
2 The indicator assesses availability of national energy financing information to SPC and other regional stakeholders.(Score system: Comprehensive set of information covering petroleum, utility and government financing = 3; Partial information set available within 6 months = 2; Partial information set available within 12 months = 1)Financial data records of funded projects are available at FDOE where indicative estimates of the latest spending can be easily provided. Detailed financial accounts from the department’s account office will take a month or two.
36 Monitoring framework (score)
1 The indicator assesses if there is a national energy sector M&E framework in place. (Score system: M&E framework in place = 1, No M&E framework = 0 )No specific M&E (monitoring and evaluation) framework in place. Selected M&E activities available for big funded projects.
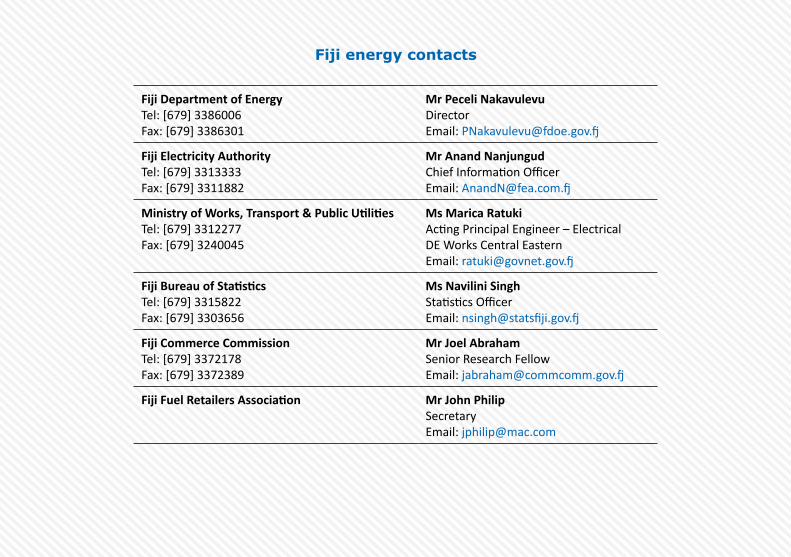
Fiji energy contacts
Fiji Department of EnergyTel: [679] 3386006 Fax: [679] 3386301
Mr Peceli Nakavulevu Director Email: [email protected]
Fiji Electricity Authority Tel: [679] 3313333 Fax: [679] 3311882
Mr Anand Nanjungud Chief Information Officer Email: [email protected]
Ministry of Works, Transport & Public Utilities Tel: [679] 3312277 Fax: [679] 3240045
Ms Marica Ratuki Acting Principal Engineer – Electrical DE Works Central Eastern Email: [email protected]
Fiji Bureau of StatisticsTel: [679] 3315822 Fax: [679] 3303656
Ms Navilini Singh Statistics Officer Email: [email protected]
Fiji Commerce Commission Tel: [679] 3372178 Fax: [679] 3372389
Mr Joel Abraham Senior Research Fellow Email: [email protected]
Fiji Fuel Retailers Association Mr John Philip Secretary Email: [email protected]
