development of acoustic emission sensor optimized for
TRANSCRIPT

Sensors 2019, 19, 1865; doi:10.3390/s19081865 www.mdpi.com/journal/sensors
Article
Development of Acoustic Emission Sensor
Optimized for Partial Discharge Monitoring
in Power Transformers
Wojciech Sikorski
Institute of Electrical Power Engineering, Poznan University of Technology, Piotrowo 3A,
60‐965 Poznan, Poland; [email protected]
Received: 29 March 2019; Accepted: 16 April 2019; Published: 18 April 2019
Abstract: The acoustic emission (AE) technique is one of the unconventional methods of partial
discharges (PD) detection. It plays a particularly important role in oil‐filled power transformers
diagnostics because it enables the detection and online monitoring of PDs as well as localization of
their sources. The performance of this technique highly depends on measurement system
configuration but mostly on the type of applied AE sensor. The paper presents, in detail, the design
and manufacturing stages of an ultrasensitive AE sensor optimized for partial discharge detection
in power transformers. The design assumptions were formulated based on extensive laboratory
research, which allowed for the identification of dominant acoustic frequencies emitted by partial
discharges in oil–paper insulation. The Krimholtz–Leedom–Matthaei (KLM) model was used to
iteratively find optimal material and geometric properties of the main structures of the prototype
AE sensor. It has two sensing elements with opposite polarization direction and different heights.
The fully differential design allowed to obtain the desired properties of the transducer, i.e., a
two‐resonant (68 kHz and 90 kHz) and wide (30‒100 kHz) frequency response curve, high peak
sensitivity (−61.1 dB ref. V/μbar), and low noise. The laboratory tests confirmed that the prototype
transducer is characterized by ultrahigh sensitivity of partial discharge detection. Compared to
commonly used commercial AE sensors, the average amplitude of PD pulses registered with the
prototype sensor was a minimum of 5.2 dB higher, and a maximum of 19.8 dB higher.
Keywords: acoustic emission (AE); ultrasonic transducer; partial discharge (PD); surface discharge;
interturn discharge; oil–paper insulation; power transformer diagnostics; KLM model
1. Introduction
Power transformers are a strategic component of the electric power system. It is commonly
believed that the oil–paper insulation system is designed in order to work reliably for 30‒40 years.
However, there are many power transformers installed all around the world, which operate without
failure above this age. The asset management strategy developed by most power distribution
companies, which is directed towards an extension of transformer life, results mostly from the high
cost of the device purchased as well as long delivery time, reaching over a year. However, such
policy increases the probability of catastrophic failure occurrence, which is followed by a number of
negative consequences, such as a threat to the life of the substation staff, significant economic losses,
environmental hazards (oil leaks or fire), and local blackouts [1‒5]. Therefore, recently, an increase of
requirements towards the reliability of the exploited power transformers and the demand for
professional services and diagnostics solutions has been observed. Such a strategy extends the time
of safe exploitation of older units [6‒10]. While analyzing cases of power transformer breakdowns
described in the literature or reports of power distribution companies, one may notice that many of
Sensors 2019, 19, 1865 2 of 30
them are related to accelerated degradation of the insulation system, which might have been caused
by the high activity of partial discharges [1,11‒14]. For that reason, monitoring of PD intensity and
the dynamics of its changes may be an important indicator to predict impending failure. The
effectiveness of PD detection depends not only on the applied measurement technique, but also on
the configuration of the measurement system, particularly on PD sensors performance. The highest
sensitivity of PD pulse detection may be obtained using a measurement setup that complies with the
IEC 60270 standard (so‐called conventional electrical method) [15,16]. Under ideal measuring
conditions (shielded high‐voltage laboratory), the conventional electrical method allows detection of
low‐energy PD pulses (apparent charge < 0.1 pC). Unfortunately, PD detection in field conditions,
due to the high level of electromagnetic disturbances (switching operations and corona discharge in
transmission lines), is practically impossible [17]. Mainly for that reason, online monitoring systems
available on the market or currently developed by research centers are based only on
unconventional PD detection methods. This group includes dissolved gas analysis (DGA) in oil
[18‒20], detection of electromagnetic waves in the high‐frequency (HF) [21,22] and ultrahigh frequency
(UHF) ranges [23‒27], and the acoustic emission method (AE), which, apart from detection and
on‐line monitoring of PD, also locates PD sources [28‒32]. It should be underlined that sensitivity of
these techniques highly depends on sensor position in a power transformer tank and its distance
from the PD source as well as on the construction and parameters of the sensor [33].
In the acoustic emission method, mostly piezoelectric contact transducers are used for PD
detection. It should be noted that in the last few years the research works on alternative solutions
have been conducted. Sikorski in [34] presented an active dielectric window (ADW). It is a new
concept of combined acoustic emission (AE) and electromagnetic PD detector intended for assembly
in the transformer’s inspection hatch. A similar approach was presented by Siegel et al. [35], but, in
this case, a sensor able to detect AE and UHF signals was mounted through an oil drain valve. Due
to the high cost of commercial AE sensors, some researchers propose low‐budget solutions, based
on, among others, the application of piezoelectric diaphragms (buzzers) [36].
Leading manufacturers, like Physical Acoustics or Vallen Systeme, offer several dozen different
types of piezoelectric sensors, which cover the demand of the majority of research fields and
diagnostic techniques based on the acoustic emission phenomenon. Depending on application type
and, resulting from it, the frequencies of ultrasonic signals registered, transducers are divided into
three categories: low frequency (20‒100 kHz), standard frequency (100‒400 kHz), and high
frequency (>400 kHz) sensors. The category of standard frequency sensors is the most numerous.
They are, among others, used for drying process monitoring of wood, hot reheat pipe crack
detection, or integrity testing of pressure vessels, metallic, and composite structures. Low‐frequency
AE sensors are usually recommended for structural health monitoring of large concrete and geologic
structures, leakage detection in liquid pipelines, and corrosion screening of flat bottom storage
tanks. In turn, high‐frequency sensors are applied in AE testing of small specimens [37,38].
Wideband AE sensors with a flat frequency response curve (at the cost of less sensitivity) are a
separate category. Despite lower efficiency, this type of transducers is ideal in cases where the
frequency of AE signals generated by the investigated phenomenon is unknown or when acquired
AE signals are broadband by nature.
The recommendations of the leading manufacturers regarding the optimal choice of sensor for
PD detection in oil‐filled transformers are far less unambiguous than in case of the remaining AE
applications. Vallen Systeme suggests the use of a transducer operating in the range between 100 kHz
and 400 kHz or low‐frequency transducer (20‒100 kHz) when noise is low. From the variety of the
offered several dozens of sensors, the producer selected two models for PD detection, i.e., VS30
(20‒80 kHz) and VS75 (30‒120 kHz, frequency peak 75 kHz) [38]. In turn, Physical Acoustics offered
five models of transducers (D9241A, R6D, R15D, R30D, and R50D), for which monitoring of large
power transformers is specified as one of the typical applications [39]. Providing such sensors is
quite confusing since they work in different frequency ranges. For instance, the operating frequency
range for sensor type D9241A is from 20 kHz to 60 kHz (with frequency peak 30 kHz) and for sensor

Sensors 2019, 19, 1865 3 of 30
type R15D from 50 kHz to 400 kHz (resonant frequencies: 75 kHz and 150 kHz), whereas for sensor
type R50D between 100 kHz and 700 kHz (resonant frequencies: 100 kHz and 500 kHz) [39].
The presented information show that, so far, the manufacturers have not elaborated an AE
sensor specially designed and optimized for PD detection in oil‐filled power transformers. It is hard
to blame only the producers because there are at least several reasons for such a situation. First,
power transformer diagnostics using the AE method are still being run on a fairly small scale,
particularly compared to such industrial applications of the AE method such as structural health
monitoring of large concrete and steel structures, fatigue and fracture materials research, bearing
condition monitoring, or leakage detection in pipelines. Second, scientists investigating AE signals
emitted by PD—depending on the type of the applied ultrasonic transducer and measurement
set‐up configuration—draw quite different conclusions (see details in Section 2). Third,
recommendations included in official documents of international organizations establishing
standards (IEC, IEEE, and CIGRE) are very general. In the Guide for the Detection of Acoustic
Emissions from Partial Discharges in Oil‐Immersed Power Transformers issued by IEEE in 2000 [40],
the AE sensor for PD detection is defined as a piezoelectric displacement transducer operating in its
compression mode and has a resonant frequency (for longitudinal waves) in the 120 to 160 kHz
range. Users are recommended to apply a band‐pass filter (with lower and upper cutoff frequencies
of 100 kHz and 300 kHz) to eliminate most of the signals that are not associated with PDs, e.g.,
vibrations caused by the magnetostrictive action of the core (Barkhausen noise), oil pumps, and
cooling fans. Simultaneously, it was noted that depending on location and type of PD source, some
group of users find that a low‐frequency AE sensor (e.g., 60 kHz) is more useful, particularly when
higher‐frequency signals are attenuated. However, the IEEE guide criticizes this type of sensor for
being more susceptible to external or other mechanical signals.
In the revised version of the IEEE C57.127 guide issued seven years later, more attention was
paid to the problem of the adequate sensor selection [41]. First of all, it was highlighted that the
main frequency of low‐energy PDs (e.g., partial discharge in oil and PD in voids or gas bubbles) is
100 kHz and for larger discharges (surface discharges, turn‐to‐turn discharges, and arcing)
frequencies should decrease (20‒100 kHz). Furthermore, the low‐frequency AE waves are less
attenuated. For that reason, part of the users—particularly for factory and laboratory
applications—choose sensors with resonant frequencies for longitudinal waves of 60 kHz. However,
fearing of external disturbances and noises occurring in the band between 20 kHz and even 60 kHz,
most users apply sensors with the resonant frequency of 150 kHz. Unfortunately, this choice is not
related to the partial discharges frequency at all. Rather, this is due to the fact that 150 kHz standard
transducers are easy available on the market (e.g., Physical Acoustics R15α and R15D, Vallen VS150,
Soundwel SR150, Bangos AES150, Acoustic Emission Consulting i150, Fuji Ceramics AE154DL,
AE144S, etc.). The 150 kHz standard AE sensor may reduce the noise level compared to the 60 kHz
resonant frequency sensor, but it will also strongly reduce PD detection sensitivity [41,42].
In 2009 CIGRE Working Group D1.33 published a technical brochure titled Guidelines for
Unconventional Partial Discharge Measurements [43], in which one may find information that PD
occurrence is a source of acoustic emission signals of frequencies in a band between 10 kHz and 300 kHz.
In turn, in a brochure issued in 2015 titled Guidelines for Partial Discharge Detection using
Conventional (IEC 60270) and Unconventional Methods [44], according to the CIGRÉ Working
Group D1.37 experts, the frequency band of the AE signals emitted by PDs is definitely wider and is
in the range from 20 to even 1000 kHz. The change in recommendations might have been caused by
the fact that part of the researchers prefers broadband multiresonant transducers.
In the standard IEC TS 62478: High voltage test techniques—Measurement of partial discharges
by electromagnetic and acoustic methods published in 2016 by the International Electrotechnical
Commission (IEC)—the detailed guidelines regarding AE sensors were not included [45]. The
document informs that for PD detection, typically the ultrasonic frequency range is employed
(approximately 20 kHz to 250 kHz), as well as the audible range (approximately 100 Hz to 20 kHz). It
additionally underlines that the frequency ranges used for acoustic detection are chosen depending
on the insulation system (solid, liquid, or gaseous), for which the AE method is being employed.

Sensors 2019, 19, 1865 4 of 30
The newest document, in which the issue of AE sensor selection has been raised, is a brochure
Partial Discharges in Transformers elaborated by CIGRÉ Working Group D1.29 and issued in
February 2017 [46]. This document suggests using transducers working in a band of 10 to 300 kHz,
where in order to obtain the highest PD detection sensitivity, resonant type piezoelectric sensors
with resonance frequency between 60 kHz and 150 kHz are recommended.
The relatively low PD detection sensitivity of the AE method used in power transformers
diagnostics is considered as one of its main disadvantages. This results directly from the physical
nature of the PD phenomenon because only a small part of the energy of a PD current pulse is
transformed into mechanical energy in the form of acoustic waves. Another reason is the AE wave
attenuation—the combined effect of scattering, absorption, and reflection of sound waves, which
occurs on the wave propagation path between PD source and the ultrasonic transducer. Therefore,
the use of a proper ultrasonic transducer is so important from the AE method efficiency point of
view [33].
The above‐presented state of affairs has become a motivation to design and manufacture an AE
sensor optimized for detection and monitoring of PD in oil‐filled power transformers. As a result of
the conducted research, a prototype ultrasonic transducer was developed, which sensitivity of
partial discharges detection is higher than in the case of the most popular commercial AE sensors. In
addition, its most important advantage is its very simple structure and low production costs. The
prototype sensor presented in this article may find application in the AE systems specially designed
for locating or online monitoring of partial discharges in large power transformers. In the theoretical
part of the manuscript (Section 2), the results of the previous works on acoustic frequencies emitted
by partial discharges in oil–paper insulation were discussed. The investigated types of PDs and
electrode systems used in the experiment were described in Section 3. Parameters of the
measurement setup, in which the frequencies of AE signals generated by partial discharges, were
identified were presented in Section 4. Basing on the obtained measurement results (Section 5), a
prototype AE sensor was designed and manufactured. The details concerning this task were
discussed in Section 6. Finally, the prototype sensor was tested, in order to evaluate its performance
compared to commonly used commercial AE sensors (Section 7).
2. Acoustic Frequencies Emitted by Partial Discharges in Oil–Paper Insulation—Previous Works
One of the first papers dealing with the frequency analysis of AE signals emitted by partial
discharges in oil–paper insulation was presented by R.T. Harrold in 1975 [47]. Ultrasonic signals
were recorded using a wideband transducer, which was composed of a lithium sulfate disc (0.147 cm
thick, 2.28 cm diameter) with stainless‐steel electrodes. In his research, the author limited the
analyzed frequency band to the range from 150 kHz to 1.75 MHz. On the basis of the obtained
results, the following conclusions were formulated. (1) Ultrasonic frequency spectra from 150 kHz to
1.75 MHz emitted by different types of PD in oil had not revealed any unique frequency of high
acoustic energy; (2) using resonant transducers in the band above 150 kHz, AE from various PD
sources should easily be detected, but signals received at the lower frequencies were higher and the
frequency spectrum of a point‐to‐pressboard plane source in oil might have cut off near 300 kHz;
and (3) detection of PD sources using acoustic emission technique was more readily achieved using
resonant transducers operating in the 20 kHz to 100 kHz range.
In another of Harrold’s works [48], the acoustic emission signal generated by sparks and arcs in
mineral oil was investigated. Partial discharge pulses were recorded with both narrowband and
wideband ultrasonic transducers: Brüel & Kjaer type 4135 condenser microphone (10 Hz–100 kHz),
Brüel & Kjaer type 4131 condenser microphone (20 Hz–20 kHz), Celesco type LC‐10 hydrophone
(1 kHz–100 kHz), self‐produced wideband hydrophone (1 kHz–2 MHz), and Physical Acoustics
Corporation contact microphone, type 15‐12 (up to 500 kHz). Studies showed that (as previously
theoretically predicted), high energy (kJ) arcs radiate maximum acoustic levels in the low frequency
region from ~120 Hz to ~10 kHz, whereas, low energy (μJ) PD (microsparks) have maximum
acoustic emission at higher frequencies in the ~10 kHz to ~400 kHz range.
Sensors 2019, 19, 1865 5 of 30
Howells and Norton [49] were one of the first to publish a comprehensive report, in which they
assessed the possibility of practical application of the AE method for diagnostics of power
transformers. The authors performed laboratory tests on three small distribution 10 kVA
transformers with deliberately modeled defects to generate and register AE pulses from partial
discharges. The applied AE measurement system consisted of a piezoelectric resonant‐type
transducer (Dunegan S140 L/D with 140 kHz nominal resonant frequency) and 100 kHz high‐pass
filter. Such configuration strongly influenced the frequency parameters of the registered AE pulses.
Their dominant frequency (~150 kHz) practically coincided with the resonance frequency of the
ultrasonic transducer. The authors also presented the results obtained during the induced voltage
tests with PD measurement of two large power transformers (230 kV/56 MVA and 230 kV/200 MVA).
The same type of ultrasonic transducer was used to detect AE pulses, but this time the high‐pass
filter with a lower cutoff frequency (20 kHz instead of 100 kHz) was used. For both tested
transformers, AE pulses were recorded only at higher voltage levels (130% and 150% rated voltage,
respectively). The frequency‐domain analysis showed that most of the AE signal energy from PD is
transmitted in the low‐frequency band (from 20 kHz to about 80 kHz), and the rest in the range of
140 to 170 kHz, that is close to the resonant frequency of the transducer.
In the work of Zhu et al. [50], the relations between various types of PD in the transformer and
their frequency spectra of AE were studied. For this purpose, different electrode systems were used,
in which insulation defects were modeled: (1) PD of protrusions in transformer; (2) PD of point
electrode with different curvature; (3) PD along barrier surface in transformer; (4) PD in gaseous
void in solid insulation of transformer; and (5) PD in the thick paper insulation of high voltage
connection of transformer. Furthermore, the authors investigated the frequency of acoustic signals
generated by magnetic noises. In this study, two kinds of AE sensor with piezoelectric elements
were used. One was wideband and the other narrowband. Their maximum frequency response was
700 kHz and 200 kHz, respectively. Based on the obtained results, the following conclusions were
drawn. (1) Obtained peak frequencies in the frequency spectra of AE from PD distributed within 70
to 150 kHz; (2) frequency spectra analysis showed that frequencies of Barkhaussen noise were lower
than 20 kHz and frequencies of magneto‐mechanical AE were within 20–65 kHz; (3) to minimize the
negative impact of magnetic noises, frequency bandwidth of 70–180 kHz was recommended for the
AE measuring system of PD detection in power transformer; and (4) various types of PD emit signals
of different frequencies, which made it possible to identify insulation defects.
Bengtsson et al. [51] performed a transducer independent determination of the acoustic
frequencies emitted by a partial discharge in oil. For this purpose, the experiment was based on the
phenomenon of single‐slit diffraction, and the registration of AE pulses was performed using two
100 kHz hydrophones. The first one was a reference and the second one was mounted in a computer
controlled moving frame. It was found that the main signal content from low‐energy PDs ~100 pC
magnitude is ~100 kHz (91 kHz and 99 kHz are peak frequencies). In the later publication [42], the
authors stated that due to the short AE signal duration, the frequency distribution was rather wide.
However, due to the effect that high‐frequency components are strongly attenuated by pressboard,
they prefer acoustic sensors in the 20 to 120 kHz range, which is lower than recommended by users,
who are afraid of core noises. The authors also presented interesting results of the experiment, in
which PDs in the insulation of a paper‐wound conductor were recorded simultaneously using low
and high‐frequency sensors. This experiment shows that the detection sensitivity for this type of PD
signals is higher using low‐frequency sensors (peak frequency was ~50 kHz) as the high‐frequency
components are severely attenuated.
In another Bengtsson paper [52], for recording PD pulses in transformer oil, the UAEA 250
transducer with two resonant frequencies—125 kHz and 250 kHz—was used. In the point‐to‐plate
electrode system immersed in oil, the main frequency of registered AE signals overlapped with the
first resonance frequency of the UAEA transducer (125 kHz). In turn, in the case of creeping
discharges, most of the energy of the AE signal was transmitted in the low‐frequency range from
approximately 25 to 40 kHz and close to the center frequency of the transducer (110‒130 kHz).
Sensors 2019, 19, 1865 6 of 30
In research carried out by Sakoda et al. [53], ultrasonic waves caused by a single PD pulse in oil
were measured. The results of these measurements were analyzed by means of an FFT in order to
understand the properties of the elastic waves and distinguish the kinds of detectable elastic waves.
Broadband ultrasonic transducer (1000 kHz) was used in the research. The results presented in the
paper proved that almost all energy of AE pulses from PD in oil was transmitted in the lower
frequency band (up to about 100 kHz) and the dominant frequency was about 25 kHz.
In turn, Boczar [54] analyzed the AE signals emitted by (1) surface discharges in oil, (2) gas
bubble discharges in oil, and (3) discharges in indeterminate potential particles moving in oil.
Detection of AE pulses was performed by a wideband (from 10 kHz to 1 MHz) piezoelectric
transducer type 8312 of Brüel & Kjaer, with a standard 40 dB built‐in preamplifier. The creeping
discharges generated low‐frequency AE signals (below 100 kHz), with most of the energy being
carried in the band from about 70 to 90 kHz. The other two types of PD generated signals in a much
wider frequency band.
Kundu et al. [55] studied PD on conductor protrusions in the transformer and PD along barrier
surface in the transformer. Point‐to‐plane electrode systems were used to model the PD on
protrusions, plane‐to‐plane electrodes with pressboard insulation and rod‐to‐plane electrodes with
pressboard insulation were used to model surface discharge. The resonance‐type 150 kHz AE sensor
was used to acquire PD signals. For the PD in oil, the average peak frequency was 128 kHz and the
median frequency was 138 kHz. AE signals from surface discharges had definitely lower
frequencies. In a plane‐to‐plane electrode system, the average peak frequency of AE was 60 kHz and in
rod‐to‐plane electrode system configuration was 50 kHz. The average of median frequency was 78 kHz
and 88 kHz, respectively.
In the work of Sikorski [56], most of the basic types of partial discharges (ten types in total)
occurring in oil–paper insulation were examined. Based on the results of the research, the following
conclusions were formulated. (1) Each of the investigated PD forms generates repeatable and unique
AE signals, (2) results of frequency‐domain analysis strongly depend on the type of the applied
sensor, (3) the low‐frequency (30 kHz) sensor is more sensitive in detection of high‐energy PD like
surface discharges than wideband sensor, (4) high‐energy creeping sparks generate AE signal in the
20 to 40 kHz frequency band, and (5) low‐energy PD, like discharges in gas bubbles or in internal gas
voids, emit short AE pulses in the higher frequency band (100–300 kHz). The conclusions from the
model tests were confirmed by measurements carried out on power transformers.
3. Investigated Types of Partial Discharges and Electrode Systems Used in Experiment
Basing on the literature [57‒59], surface and interturn discharges were selected for the research,
in relation to their high energy and strongly destructive character for power transformer insulation
system. Additionally, PDs in oil were investigated, which usually are the initial form of the surface
and interturn discharges.
3.1. Surface Discharges
Various terms for surface discharges, such as sliding discharge, creeping discharge, or surface
tracking discharge, can be found in the literature [60,61]. Surface discharge is the most dangerous
type of PD that can lead to a catastrophic failure of a power transformer under normal operating
conditions [62]. This phenomenon occurs in the oil/pressboard barrier system, which is the weakest
and most problematic area in the power transformer insulation system, because of the accumulation
of water molecules (due to moisture migration), contaminations (iron or copper particles, corrosive
sulfur) and other aging products (gaseous and solid hydrocarbons). Generally, all insulation systems
of the transformer can be treated as systems of the oil barrier type in which the initiation and
development of PDs always take place in oil [59]. In an ideal setup of this type, the electric field is
perpendicular to the barrier surface and parallel (tangential) to the spacing elements (strips and
spacers). In this configuration, the ratio of electric field strength in the barrier to electric field
strength in the oil channels is inversely proportional to the ratio of the relative permittivity of the
barrier (ε = 3.6–4.7) and oil (ε = 2.2). Thus, the electric field strength in the barriers does not exceed

Sensors 2019, 19, 1865 7 of 30
60–70% of the electric field strength in the oil channels. A breakdown of barriers that are located
perpendicularly to the force lines of the electric field can only be a result of discharges in oil. Spacers
in oil ducts in the ideal oil barrier system are ‘unbreakable’ because the cross‐stress here is almost the
same as stress in the oil channels. The cross‐strength of the spacing elements is always greater than
their surface dielectric strength. Therefore, the development of PD on strips or spacers can be caused
almost exclusively by a loss of surface dielectric strength [63]. The electrical stress on the
oil/pressboard interface contains both tangential and normal components of the electric field.
However, the formation of surface discharge over the pressboard barrier is more assisted by the
tangential component and, according to Sokolov, progresses in four stages [64]:
Stage 1. The discharge begins in the oil, on the edge of the outer winding coil (small area with
very strong electric field), and then develops in the form of plasma channel (leader), which is more
or less consistent with the direction of electric field force lines. As a result, it comes to the breakdown
of an oil duct, between the outer winding coil, and the nearest pressboard barrier.
Stage 2. Upon reaching the barrier, the plasma channel spreads on the barrier surface in the
form of creeping sparks, which create—due to high temperature—permanent carbonized, partially
conductive paths, so‐called ‘black marks’. At the initial stage of surface discharge development,
there are also ʹwhite marksʹ observed that indicate a drying out process of the pressboard through
moisture evaporation [60,65,66].
Stage 3. Electric field forces that accompany the surface discharges are capable of pulling water
and oil out of the cellulose pores, which results in microscopic sparking within the pressboard. High
moisture content and an inhomogeneous distribution in the pressboard barrier cause a dangerous
current concentration on a narrow path. Then carbonized traces are generated even at very low
currents, ~0.1 mA. Along with the development of this phenomenon, the electric conductivity of the
path grows—until breakdown. The electric field forces can accumulate water molecules into the
shortest path between the ‘electrodes’, facilitating the initiation of the high‐energy, long creeping
sparks [62].
Stage 4. High‐energy sparking not only causes the formation of carbonized traces on the
pressboard surface, but also leads—due to dissociation of oil molecules—to the formation of
hydrogen [67], gaseous hydrocarbons (mainly C2H2 and CH4), and wax‐like substances [68]. As the
path length increases, the apparent charge of the surface discharges decreases to ~500 pC‒5 nC, and it is
high enough to continue the degradation of cellulose. The permanent destruction of cellulose fibers
occurs under the influence of PD with an apparent charge of ~1 nC. The development of surface
discharge can continue from minutes to even years, until the treeing conductive path cause shunting
of an essential part in the transformer insulation resulting in a powerful arc [69]. The possible
scenarios of surface discharge formation in transformer insulation system are illustrated in Figure 1.
(a) (b) (c) (d)
Figure 1. Possible scenarios of surface discharge formation in transformer insulation system:
(a) flashover along the barrier to the earthed construction part or equipotential ring (the flashover
bypasses the intercoil spacers); (b) flashover across the surface of intercoil spacer; the discharge may
later develop along the lateral surface of the strip (or on the surface of barrier—as shown in Figure 1a;
(c) breakdown of distance strip; and (d) photo of a fragment (~450 800 mm) of the pressboard
barrier strongly degraded by surface discharges (numerous carbonized traces are visible).
Sensors 2019, 19, 1865 8 of 30
The main three causes of surface discharge initiation are as follows [59].
1. The occurrence of sources of intense ionization, such as
air bubbles that can get into the transformer tank during the oil filling process [56],
free water molecules that have settled out of the insulation and oil into a separate layer,
emulsified water, which is supersaturated in solution but has not yet totally separated from
the oil,
the violent release of water vapor bubbles from cellulose to oil (“bubble effect”) [70],
local electrical overstress in the oil wedge (at the oil–pressboard–electrode triple junction),
gas bubbles formed by the cavitation in transformer oil. The cavitation phenomenon
(defined as the formation of discontinuity areas in a fluid) can be triggered by high
temperature (hot spots), oil pumps or core/windings vibrations [71],
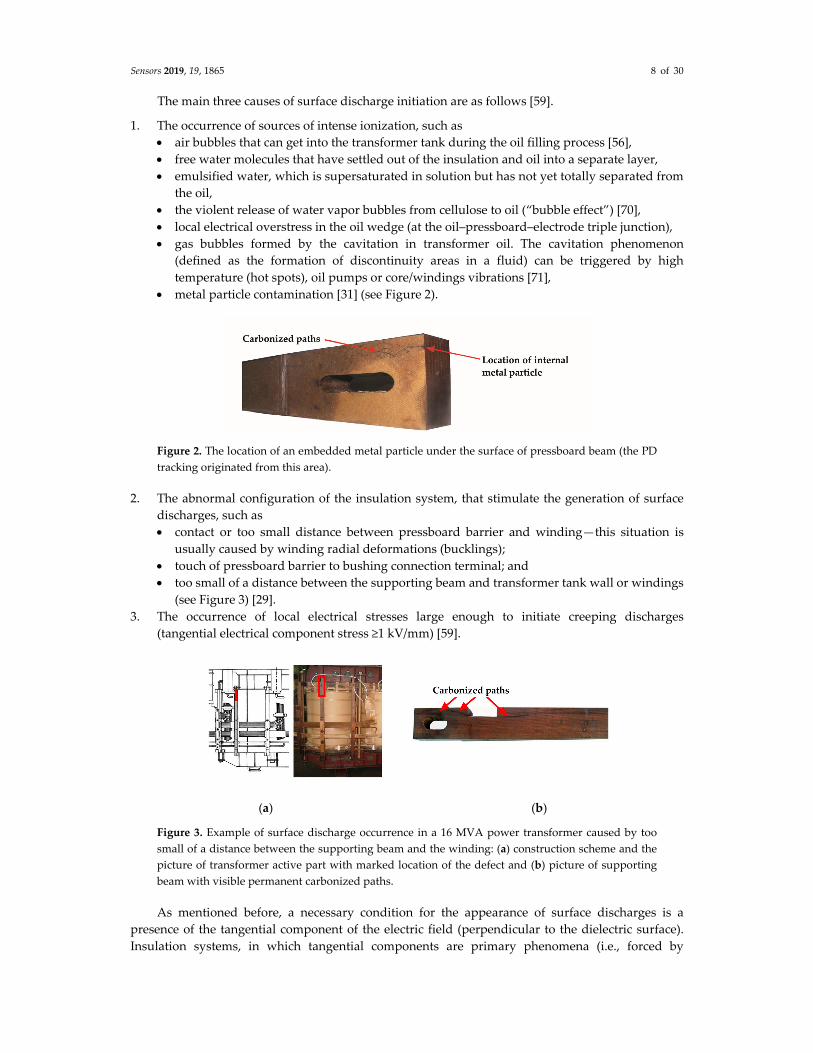
metal particle contamination [31] (see Figure 2).
Figure 2. The location of an embedded metal particle under the surface of pressboard beam (the PD
tracking originated from this area).
2. The abnormal configuration of the insulation system, that stimulate the generation of surface
discharges, such as
contact or too small distance between pressboard barrier and winding—this situation is
usually caused by winding radial deformations (bucklings);
touch of pressboard barrier to bushing connection terminal; and
too small of a distance between the supporting beam and transformer tank wall or windings
(see Figure 3) [29].
3. The occurrence of local electrical stresses large enough to initiate creeping discharges
(tangential electrical component stress ≥1 kV/mm) [59].
(a) (b)
Figure 3. Example of surface discharge occurrence in a 16 MVA power transformer caused by too
small of a distance between the supporting beam and the winding: (a) construction scheme and the
picture of transformer active part with marked location of the defect and (b) picture of supporting
beam with visible permanent carbonized paths.
As mentioned before, a necessary condition for the appearance of surface discharges is a
presence of the tangential component of the electric field (perpendicular to the dielectric surface).
Insulation systems, in which tangential components are primary phenomena (i.e., forced by

Sensors 2019, 19, 1865 9 of 30
electrode system), are divided into two groups: (1) insulation systems, which normal components
are negligibly small and (2) insulation systems, in which they play an important role.
The first group is typical for all spacing elements, e.g., pressboard strips spacing oil channels or
pressboard spacers spacing coils. For generating surface discharges of this type, the presented in
Figure 4 electrode system was used (hereinafter referred to as ʺelectrode system Aʺ). A typical
representative of the second group (so‐called Toepler systems) is an insulation system of bushing
insulator or insulation between two windings of different heights (in this case at the end of a lower
winding, there occur both tangential and normal components) [60,72‒74]. This type of surface
discharges was generated in the electrode system (hereinafter referred to as ʺelectrode system Bʺ),
which was presented in Figure 5.
Figure 4. The applied electrode system for generation of surface discharges on pressboard sample in
oil with a negligibly small normal component of electric field—electrode system A.
Figure 5. The applied electrode system for generation of surface discharges on a pressboard sample
in oil with significant normal component of electric field—electrode system B.
3.2. Interturn Partial Discharges
Another very dangerous type of PD for power transformer insulation system is interturn
(intercoil) discharge. The following gives the reasons for the occurrence of these discharges.
1. High electrical stress in wedge‐shaped oil gaps [75] (see Figure 6a),
2. axial deformation of windings (axial collapse by excessive axial compression, conductors
tilting, axial bending of conductors and excessive deflection, winding insulation damage,
and/or rupture) [58,59] (see Figure 6b),
3. excessive moisture content leading to a concentration of gas bubbles in oil gaps and ducts [70], and
4. paper and pressboard surface contamination with conductive particles and oil aging products [61].
It is estimated that interturn discharges, compared to surface discharges, in a significantly
shorter time, may lead to power transformer catastrophic failure. During the defect development, the
energy of discharges grows quickly from relatively low level approximately 500‒1000 pC to over 100 nC,
which causes insulation breakdown and turn‐to‐turn flashover.

Sensors 2019, 19, 1865 10 of 30
The examples of the destructive influence of interturn discharges on power transformer
insulation system were shown in Figure 7, whereas the electrode system, in which this type of
discharges was generated, is shown in Figure 8.
(a) (b)
Figure 6. Possible reasons for interturn discharges in power transformer: (a) high electrically stress
areas in wedge‐shaped oil gaps and (b) too small insulation spacing caused by excessive axial
deflection of conductors (coils).
(a) (b) (c)
Figure 7. Pictures presenting consequences of destructive action of interturn discharges:
(a) breakdown of paper insulation in the place of the deformed winding, (b) a vast area of carbonized
winding insulation, (c) complete destruction of windings and insulation.
Figure 8. The applied electrode system for generation of interturn discharges.
3.3. Partial Discharges in Oil
For generating PD in oil, the needle–plate electrode system, shown in Figure 9, was applied. Of
course, such an electrode system is unacceptable in the main insulation system of the power
transformer. However, its properties give a view on the consequences of constructive or
technological oversights, e.g., when needle electrode (screw or sharp edge) is a grounded
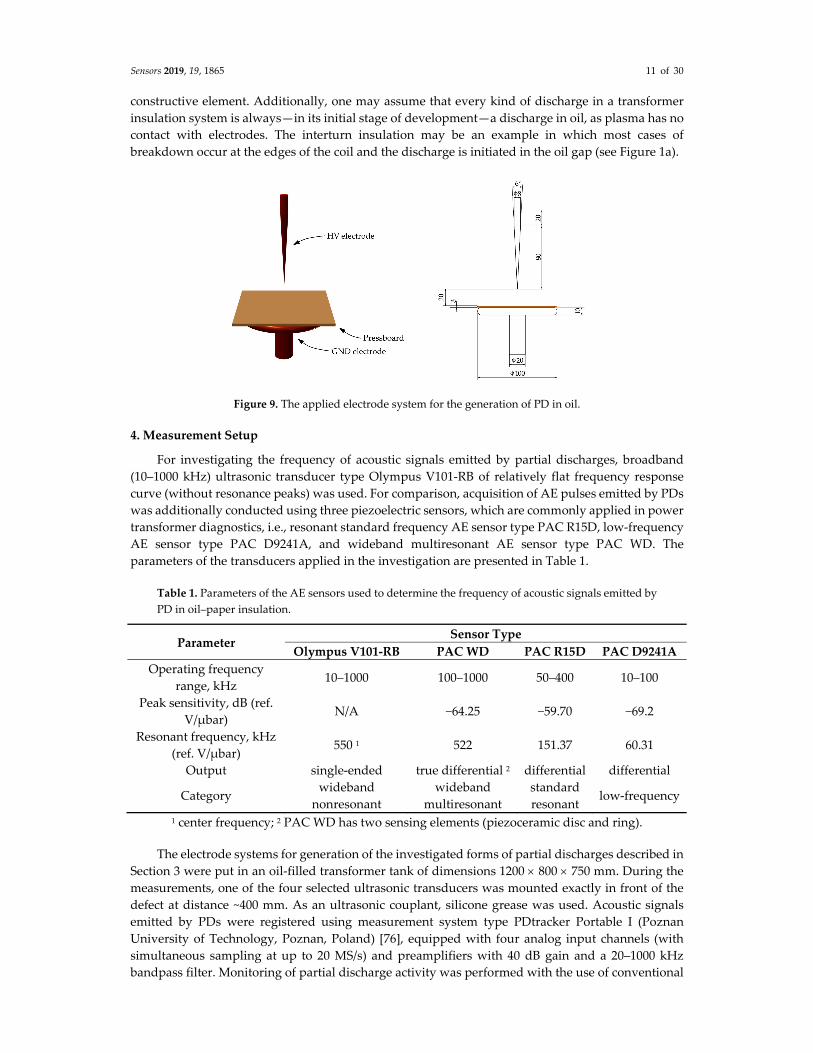
Sensors 2019, 19, 1865 11 of 30
constructive element. Additionally, one may assume that every kind of discharge in a transformer
insulation system is always—in its initial stage of development—a discharge in oil, as plasma has no
contact with electrodes. The interturn insulation may be an example in which most cases of
breakdown occur at the edges of the coil and the discharge is initiated in the oil gap (see Figure 1a).
Figure 9. The applied electrode system for the generation of PD in oil.
4. Measurement Setup
For investigating the frequency of acoustic signals emitted by partial discharges, broadband
(10‒1000 kHz) ultrasonic transducer type Olympus V101‐RB of relatively flat frequency response
curve (without resonance peaks) was used. For comparison, acquisition of AE pulses emitted by PDs
was additionally conducted using three piezoelectric sensors, which are commonly applied in power
transformer diagnostics, i.e., resonant standard frequency AE sensor type PAC R15D, low‐frequency
AE sensor type PAC D9241A, and wideband multiresonant AE sensor type PAC WD. The
parameters of the transducers applied in the investigation are presented in Table 1.
Table 1. Parameters of the AE sensors used to determine the frequency of acoustic signals emitted by
PD in oil–paper insulation.
Parameter Sensor Type
Olympus V101‐RB PAC WD PAC R15D PAC D9241A
Operating frequency
range, kHz 10‒1000 100‒1000 50‒400 10‒100
Peak sensitivity, dB (ref.
V/μbar) N/A −64.25 −59.70 −69.2
Resonant frequency, kHz
(ref. V/μbar) 550 1 522 151.37 60.31
Output single‐ended true differential 2 differential differential
Category wideband
nonresonant
wideband
multiresonant
standard
resonant low‐frequency
1 center frequency; 2 PAC WD has two sensing elements (piezoceramic disc and ring).
The electrode systems for generation of the investigated forms of partial discharges described in
Section 3 were put in an oil‐filled transformer tank of dimensions 1200 800 750 mm. During the
measurements, one of the four selected ultrasonic transducers was mounted exactly in front of the
defect at distance ~400 mm. As an ultrasonic couplant, silicone grease was used. Acoustic signals
emitted by PDs were registered using measurement system type PDtracker Portable I (Poznan
University of Technology, Poznan, Poland) [76], equipped with four analog input channels (with
simultaneous sampling at up to 20 MS/s) and preamplifiers with 40 dB gain and a 20‒1000 kHz
bandpass filter. Monitoring of partial discharge activity was performed with the use of conventional

Sensors 2019, 19, 1865 12 of 30
PD measuring instrument type Doble PD‐Smart (Doble Engineering Co, Boston, MA, USA) and test
circuit according to IEC 60270 standard (Figure 10) was used. AE signals were registered for such a
value of test voltage, at which PD activity was stable (nonextinguishing). The electrical parameters
of the investigated types of discharges are presented in Table 2.
Figure 10. Schematic diagram of the measurement setup: U = high‐voltage supply; Z = short‐circuit
current limiting resistor; AE = four‐channel acoustic emission measuring system; P = preamplifier;
S = acoustic emission sensor; TT = oil‐filled transformer tank; PD = electrode system for partial
discharge generation; C = coupling capacitor; CD = coupling device (measuring impedance); CC =
connecting cable; M = conventional partial discharge measuring instrument; PC = computer.
Table 2. The electrical parameters of the investigated types of partial discharges.
PD Type
Parameter
PD Inception
Voltage
Ui (kV)
PD Testing
Voltage
Ut (kV) 1
Apparent Charge q (pC)
Mean Value
qavg
Maximum
Value qmax
Standard
Deviation
std(q)
Surface discharge
(electrode system A) 19.6 20.3 410 597 112
Surface discharge
(electrode system B) 12.9 14.1 1115 5430 155
Interturn discharge 18.5 19.9 792 3814 173
Partial discharge
in oil 21.1 21.8 126 495 62
1 values of test voltage, at which the PD activity was stable (nonextinguishing) and AE
pulses were registered.
5. Results and Discussions
For each of the investigated PD forms, 500 AE waveforms were registered. Then, for all
collected pulses, the average power spectrum density (PSD) was determined based on the peak hold
averaging technique. Peak hold averaging is performed at each frequency line separately, retaining
peak levels from one FFT record to the next. Because peak hold averaging retains the peak levels of
the averaged quantities, it is possible to detect all harmonic components that transfer most of the signal
energy [77,78].
The elaborated averaged PSD were shown together with the frequency response curves of the
used AE sensors in Figures 11‒14.

Sensors 2019, 19, 1865 13 of 30
(a)
(b)
(c)
(d)
Figure 11. Average normalized power spectrum density (PSD) determined for acoustic emission
(AE) signals emitted by surface discharges (generated in electrode system A) and registered with the
use of ultrasonic sensor type: (a) Olympus V101‐RB, (b) PAC WD, (c) PAC R15D, and (d) PAC D9241A.
(a)
(b)
(c)
(d)
Figure 12. Average normalized PSD determined for AE signals emitted by surface discharges
(generated in the electrode system B) and registered with the use of ultrasonic sensor type:
(a) Olympus V101‐RB, (b) PAC WD, (c) PAC R15D, and (d) PAC D9241A.

Sensors 2019, 19, 1865 14 of 30
(a)
(b)
(c)
(d)
Figure 13. Average normalized PSD determined for AE signals emitted by interturn discharges and
registered with the use of ultrasonic sensor type: (a) Olympus V101‐RB, (b) PAC WD, (c) PAC R15D,
and (d) PAC D9241A.
(a)
(b)
(c)
(d)
Figure 14. Average normalized PSD determined for AE signals emitted by partial discharges in oil
and registered with the use of ultrasonic sensor type: (a) Olympus V101‐RB, (b) PAC WD, (c) PAC
R15D, and (d) PAC D9241A.

Sensors 2019, 19, 1865 15 of 30
For the elaborated average PSD, besides peak frequency fpeak (point in the spectrum at which the
peak magnitude is observed), frequency centroid fcentroid and weighted peak frequency ⟨fpeak⟩ were
determined as well (Table 3). Frequency centroid is an average weighted frequency that takes into
account the whole spectrum (it indicates the location of the ʺcenter of massʺ of the PSD). Thus the
frequency centroid gives a fuller picture of the AE signalʹs frequency content than the peak
frequency. The parameter is described with the formula below.
where F[k] is the magnitude corresponding to bin k in the frequency spectrum.
In turn, weighted peak frequency ⟨fpeak⟩ is a geometric mean of frequency peak fpeak and
frequency centroid fcentroid:
Table 3. Frequency‐domain parameters determined on the basis of the average PSD of AE pulses
emitted by the investigated forms of partial discharges.
PD Type AE Sensor
Frequency Domain Parameter
Peak Frequency
(kHz)
Frequency
Centroid
(kHz)
Weighted Peak
Frequency
(kHz)
Surface discharge
(electrode system A)
Olympus
V101‐RB 68.3 78.6 73.3
PAC WD 96.3 117.2 106.2
PAC R15D 153.3 142.3 147.7
PAC D9241A 60.1 60.9 60.5
Surface discharge
(electrode system B)
Olympus
V101‐RB 37.6 44.5 40.9
PAC WD 28.4 48.2 37.0
PAC R15D 46.4 83.2 62.1
PAC D9241A 30.0 53.8 40.2
Interturn discharge
Olympus
V101‐RB 40.3 48.9 44.4
PAC WD 30.9 72.3 47.3
PAC R15D 46.6 100.2 68.4
PAC D9241A 40.0 53.5 46.3
Partial discharge
in oil
Olympus
V101‐RB 98.1 100.9 99.5
PAC WD 105.8 167.7 133.2
PAC R15D 115.2 127.5 121.2
PAC D9241A 59.7 59.0 59.3
Based on the results obtained with the use of Olympus V101‐RB, the following conclusions may
be drawn.
From all the investigated PD forms, AE signals of the lowest frequency were emitted by the
surface discharges generated in the electrode system B, in which the normal component of the
electric field plays a significant role. The frequency of the AE signals ranged between 20 kHz and
110 kHz, wherein 95% of the energy was transferred in a narrow band from 22 kHz to 42 kHz. In
turn, surface discharges generated in electrode system A, in which normal component is
1
1
N
kcentroid N
k
k F k
f
F k
, (1)
peak peak centroidf f f (2)

Sensors 2019, 19, 1865 16 of 30
negligibly small, emitted AE signals of higher frequencies. This kind of surface discharge
transferred 95% of the acoustic wave energy in the band between 48 kHz and 100 kHz. Frequency
centroid was 78.6 kHz and a peak frequency 68.3 kHz (for surface discharges generated in
electrode system B, it was 44.5 kHz and 37.6 kHz, respectively).
The values of frequency parameters of interturn discharges were slightly higher (by about 2‒5 kHz)
than parameters of surface discharges generated in electrode system B. The dominating
frequency band, in which 95% of the AE pulses energy was transferred, was in the range of
20 to 68 kHz.
AE signals of the higher frequency generated discharges in oil, which, opposite to the remaining
PD forms, had broadband character. In PSD, one may distinguish three separate frequency
bands, i.e., 43‒64 kHz, 80‒117 kHz, and 131‒155 kHz. However, the largest part of the energy
(90.3%) was transferred in the band of 80‒117 kHz, and the peak frequency was equal to 98.1 kHz.
Considering the results obtained with the use of the remaining transducers, one may formulate
the following additional conclusions.
Independently of the kind of the used transducers for surface discharges with significant
normal components of the electric field (electrode system B) and for interturn discharges, AE
signals of low frequency (<50 kHz) were registered.
Resonant and multiresonant transducers do not enable to precisely detect frequencies of AE
signal emitted by PD (they coincide with main or side‐band resonance frequency).
In the case of both broadband transducers (Olympus 101‐RB, PAC WD), a clear relation
between the investigated form of the partial discharge and frequency centroid of emitted AE
signals was observed. In Figure 15, one may see that the more energetic the given type of the
discharges was, the more “center of mass” of the spectrum (frequency centroid) moved to the
lower frequencies.
Figure 15. Influence of type and energy (value of apparent charge) of partial discharge on the
centroid frequency of registered AE signal.
In order to obtain a more complex picture of the frequencies of the AE signals emitted by the
PDs, all power density spectra collected using a broadband sensor type V101‐RB (Figure 16) were
summed and normalized. The analysis of the resultant spectrum allows to distinguish three main
frequency bands, in which the most energy of acoustic waves originating from surface discharge,
interturn discharge, and discharge in oil was transferred, i.e., 20‒45 kHz, 50‒70 kHz, and 85‒115 kHz.
Furthermore, in these bands, one may distinguish the dominating frequencies, which equal to 40 kHz,
68 kHz, and 90 kHz, respectively. Basing on this, one may formulate a thesis that the optimal AE
sensor for PD detection in power transformers should be a multiresonant transducer, in which the
calibration response curve has peaks at the frequencies mentioned above. One should not forget the
possible sources of disturbances occurring in power transformer. Luckily, the majority of them, like
pumps and fans, emit acoustic signals of frequency below 30 kHz. However, in extreme cases, the
frequency of noise associated with the deformation of magnetic domains in the transformer core

Sensors 2019, 19, 1865 17 of 30
may even reach 50 kHz [41]. Nevertheless, usually acoustic signals generated by the Barkhausen
effect have too low energy to excite the transducer. Additionally, they are effectively attenuated by
the paper insulated windings and thick pressboard barriers. Therefore, one may assume that the
ideal compromise linking high sensitivity of the PD detection and resistance to external disturbances
is an ultrasonic transducer with a bandwidth of 30 to 115 kHz and resonances at 68 kHz and 90 kHz.
In Section 6, each stage of designing and manufacturing of the transducer, which meets the above
requirements, is presented.
Figure 16. Summed and normalized PSD obtained for all investigated types of PD.
6. Design and Fabrication of Prototype AE Sensor
For prediction of transducer resonant frequencies, the Krimholtz–Leedom–Matthaei (KLM) [79]
model is currently most often used. Compared to other ultrasonic transducer models, like RLC [80],
Mason [81] and Redwood model [82], its main advantage is the separation of the acoustical and
electrical parts of the transduction process (Figure 17).
Due to that, it is possible to analyze these parts individually to improve the design of all
transducer components, i.e., matching layer, piezoelectric element, backing layer, and electrical
matching network. Moreover, the KLM model helps to design and optimize the transducers of a
more complex, multilayer structure [83,84]. A detailed description of the KLM model may be found
in the source publication [79], as well as many other papers in which authors present the design
process of piezoelectric transducers’ based on this method [85‒87].
The input parameters consist of the thickness of the piezoelectric material d, the area of the
electrodes A, and the acoustic impedances of the main transducer elements: the piezoelectric crystal
Z0, backing layer ZB, and matching layer ZM. Moreover, the model comprises the input capacitance
C0 and input electrical reactance X1. The acoustical side of the KLM model is fixed to the electrical
side by a transformer with a turns ratio (1:φ). This transformer converts the electrical signal into the
proper acoustic values.
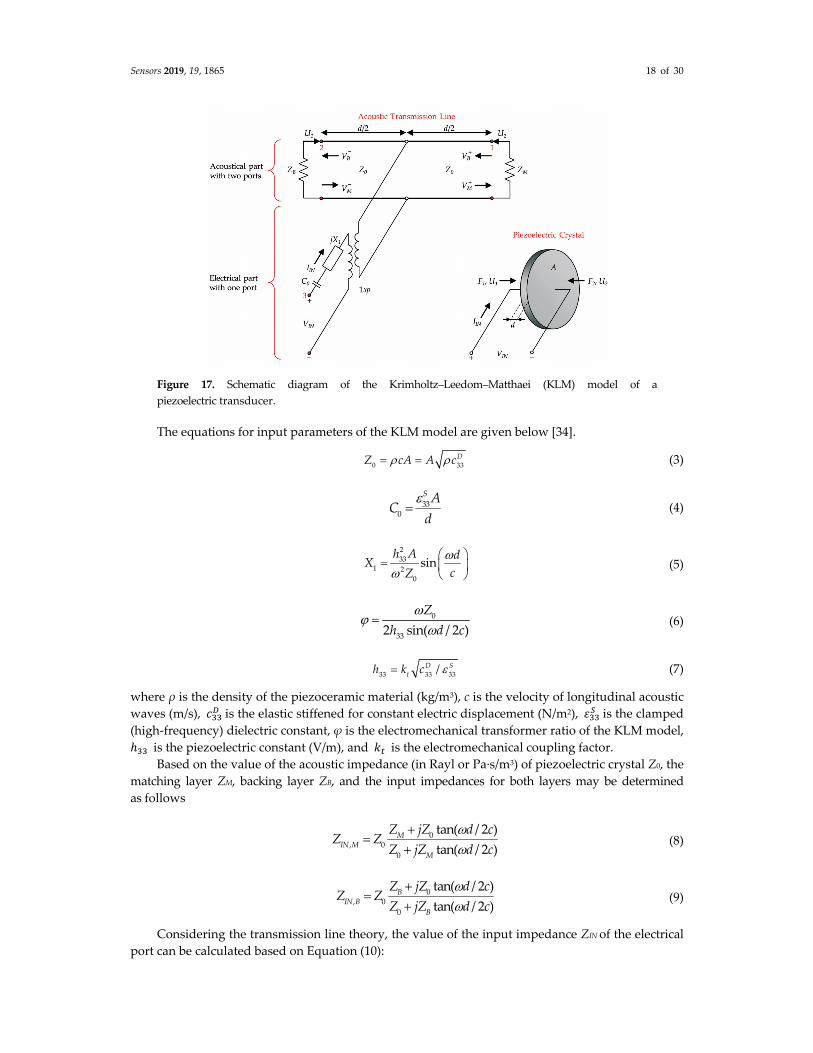
Sensors 2019, 19, 1865 18 of 30
Figure 17. Schematic diagram of the Krimholtz–Leedom–Matthaei (KLM) model of a
piezoelectric transducer.
The equations for input parameters of the KLM model are given below [34].
0 33
DZ cA A c (3)
330
S AC
d
(4)
2
331 2
0
sinh A d
XcZ
(5)
0
332 sin( / 2 )
Z
h d c
(6)
33 33 33/D S
th k c (7)
where ρ is the density of the piezoceramic material (kg/m3), c is the velocity of longitudinal acoustic
waves (m/s), 𝑐 is the elastic stiffened for constant electric displacement (N/m2), 𝜀 is the clamped
(high‐frequency) dielectric constant, φ is the electromechanical transformer ratio of the KLM model,
ℎ is the piezoelectric constant (V/m), and 𝑘 is the electromechanical coupling factor.
Based on the value of the acoustic impedance (in Rayl or Pa∙s/m3) of piezoelectric crystal Z0, the
matching layer ZM, backing layer ZB, and the input impedances for both layers may be determined
as follows
Considering the transmission line theory, the value of the input impedance ZIN of the electrical
port can be calculated based on Equation (10):
0, 0
0
tan( / 2 )
tan( / 2 )M
IN M
M
Z jZ d cZ Z
Z jZ d c
(8)
0, 0
0
tan( / 2 )
tan( / 2 )B
IN B
B
Z jZ d cZ Z
Z jZ d c
(9)

Sensors 2019, 19, 1865 19 of 30
where 𝑍 is the impedance as seen looking into the acoustic transmission line:
, ,
, ,
IN M IN B
a
IN M IN B
Z ZZ
Z Z
(11)
ZIN relates to the real impedance measured by the impedance analyzer. The minimum
impedance frequency on the ZIN(f) plot is the resonant frequency, at which the piezoceramic element
vibrates most readily and most efficiently transforms the mechanical energy into electrical energy. In
turn, the maximum impedance frequency is also the anti‐resonance frequency.
In order to ensure efficient transmission of acoustic waves energy from mineral oil through
steel power transformer tank to the transducer’s piezoelectric components, it is necessary to apply
matching layer, which optimal impedance value should be the geometric mean of the impedances of
steel (Zs) and the piezoelectric material (ZPZT):
M S PZTZ Z Z (12)
Assuming the acoustic impedance of the steel equals ZS = 46.2 MRayl and selected piezoelectric
ceramics ZPZT = 31.5 MRayl (see Table 5), then the optimal value of matching layer acoustic
impedance should total 38.15 MRayl. Therefore, high‐density alumina (Al2O3), with an impedance
that equals approx. 36‒37 MRayl, is usually the first choice material for the design and manufacture
of matching layer for AE sensors, that are supposed to be mounted at all kinds of metal structures
(transformers, reactors, storage tanks, pipelines, bridges, etc.). In the case of the designed sensor, the
disc with the diameter of 25 mm and height of 1 mm manufactured from high‐purity alumina and
acoustic impedance equal to ~37.9 MRayl is the matching layer. Basic parameters of the ceramics are
summarized in Table 4.
Table 4. Properties of the high‐purity alumina used for matching layer.
Properties Value Unit
Main component α‐Al2O3 ‐
Purity >99.5 wt‐%
Density 3950 kg/m3
Open porosity 0 vol.‐%
Average size of crystallites 10 μm
Compressive strength 3500 MPa
Young’s modulus 380 GPa
Poission’s ratio 0.22 ‐
Hardness 23 GPa
Acoustic velocity 9600 m/s
Acoustic impedance 37.9 MRayl
Two sensing elements (piezoceramic discs) with opposite polarization directions and different
geometries were used as active components. The technology based on two piezoelectric elements is
used by Physical Acoustics Company [39]. This way, for example, a multiresonant sensor type PAC
WD is produced, in which the piezoceramic ring and the axially placed disc are the active elements.
Such a fully differential design offers a number of advantages, of which the most important are
multiresonance frequency response curve (it has two main resonance frequency in thickness
vibration mode),
high sensitivity and low noise (because differential preamplifier multiplies the difference
between two input signals and simultaneously eliminates common‐mode noise), and
broader bandwidth in comparison to single‐ended resonant AE sensor.
1 20
1 aIN
ZZ jX
j C (10)

Sensors 2019, 19, 1865 20 of 30
For manufacturing active elements, piezoelectric ceramics PZT type 5A (Navy Type II) was
selected, which has high charge sensitivity and operates over a wide temperature range. Properties
of the used piezoelectric material are summarized in Table 5.
Table 5. Properties of the piezoelectric ceramic used.
Properties Symbol Value Unit
Relative dielectric constant KT 1900 ‐
Electromechanical coupling coefficients:
Longitudinal coupling coefficient k33 0.72 ‐
Transverse coupling coefficient k31 0.36 ‐
Shear coupling coefficient k15 0.68 ‐
Planar coupling coefficient kp 0.63 ‐
Piezoelectric charge constants:
Induced polarization in direction 3 (parallel to direction in which
ceramic element is polarized) per unit stress applied in direction 3 d33 400 × 10−12 C/N
Induced polarization in direction 3 per unit stress applied in
direction 1 (perpendicular to the direction in which ceramic
element is polarized)
d31 175 × 10−12 C/N
Induced polarization in direction 1 per unit shear stress applied
about a direction perpendicular to the direction in which ceramic
element is polarized
d15 590 × 10−12 C/N
Dielectric dissipation factor (dielectric loss) 1 tan σ ≤2.00 %
Frequency constants:
Frequency constant for thickness vibration mode NT 2040 Hz∙m
Frequency constant for planar vibration mode NP 1980 Hz∙m
Frequency constant for longitudinal vibration mode NL 1500 Hz∙m
Curie Point 2 TC 360 °C
Density ρ 7600 kg/m3
Acoustic impedance Z 31.5 MRayl
1 At 1 kHz, low field; 2 Maximum operating temperature = Curie point/2; 3 or m/V.
Calculations based on the KLM model showed that the resonance frequencies of thickness
vibration mode will be equal to 68 kHz and 90 kHz if piezoelectric discs of height 25 mm and 18.8 mm,
respectively, are applied. The presented in Figure 18 results of simulation in form of input
impedance characteristics ZIN(f) also allowed to recognize anti‐resonance frequencies (at maximum
impedance), which for selected PZT discs totaled 80.8 kHz and 107.1 kHz.
Figure 18. Simulated input impedance ZIN(f) measurement based on the KLM model for piezoelectric
discs with a height of 18.8 mm and 25 mm.
Sensors 2019, 19, 1865 21 of 30
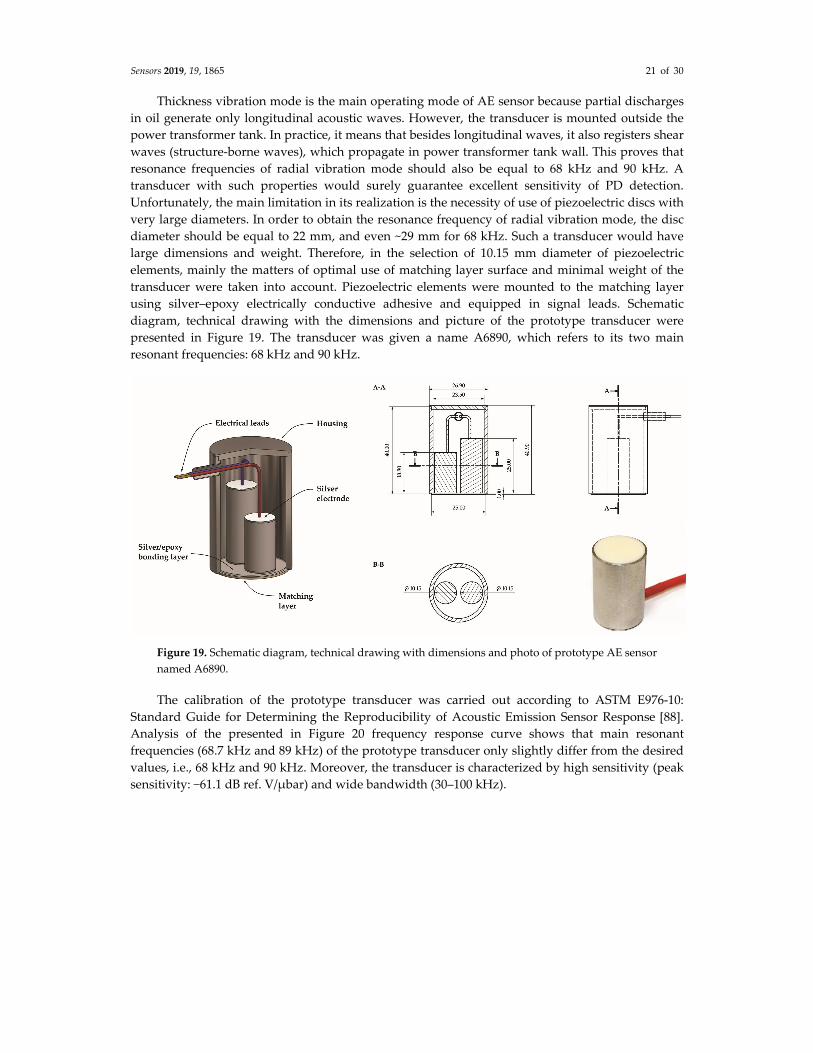
Thickness vibration mode is the main operating mode of AE sensor because partial discharges
in oil generate only longitudinal acoustic waves. However, the transducer is mounted outside the
power transformer tank. In practice, it means that besides longitudinal waves, it also registers shear
waves (structure‐borne waves), which propagate in power transformer tank wall. This proves that
resonance frequencies of radial vibration mode should also be equal to 68 kHz and 90 kHz. A
transducer with such properties would surely guarantee excellent sensitivity of PD detection.
Unfortunately, the main limitation in its realization is the necessity of use of piezoelectric discs with
very large diameters. In order to obtain the resonance frequency of radial vibration mode, the disc
diameter should be equal to 22 mm, and even ~29 mm for 68 kHz. Such a transducer would have
large dimensions and weight. Therefore, in the selection of 10.15 mm diameter of piezoelectric
elements, mainly the matters of optimal use of matching layer surface and minimal weight of the
transducer were taken into account. Piezoelectric elements were mounted to the matching layer
using silver–epoxy electrically conductive adhesive and equipped in signal leads. Schematic
diagram, technical drawing with the dimensions and picture of the prototype transducer were
presented in Figure 19. The transducer was given a name A6890, which refers to its two main
resonant frequencies: 68 kHz and 90 kHz.
Figure 19. Schematic diagram, technical drawing with dimensions and photo of prototype AE sensor
named A6890.
The calibration of the prototype transducer was carried out according to ASTM E976‐10:
Standard Guide for Determining the Reproducibility of Acoustic Emission Sensor Response [88].
Analysis of the presented in Figure 20 frequency response curve shows that main resonant
frequencies (68.7 kHz and 89 kHz) of the prototype transducer only slightly differ from the desired
values, i.e., 68 kHz and 90 kHz. Moreover, the transducer is characterized by high sensitivity (peak
sensitivity: −61.1 dB ref. V/μbar) and wide bandwidth (30‒100 kHz).
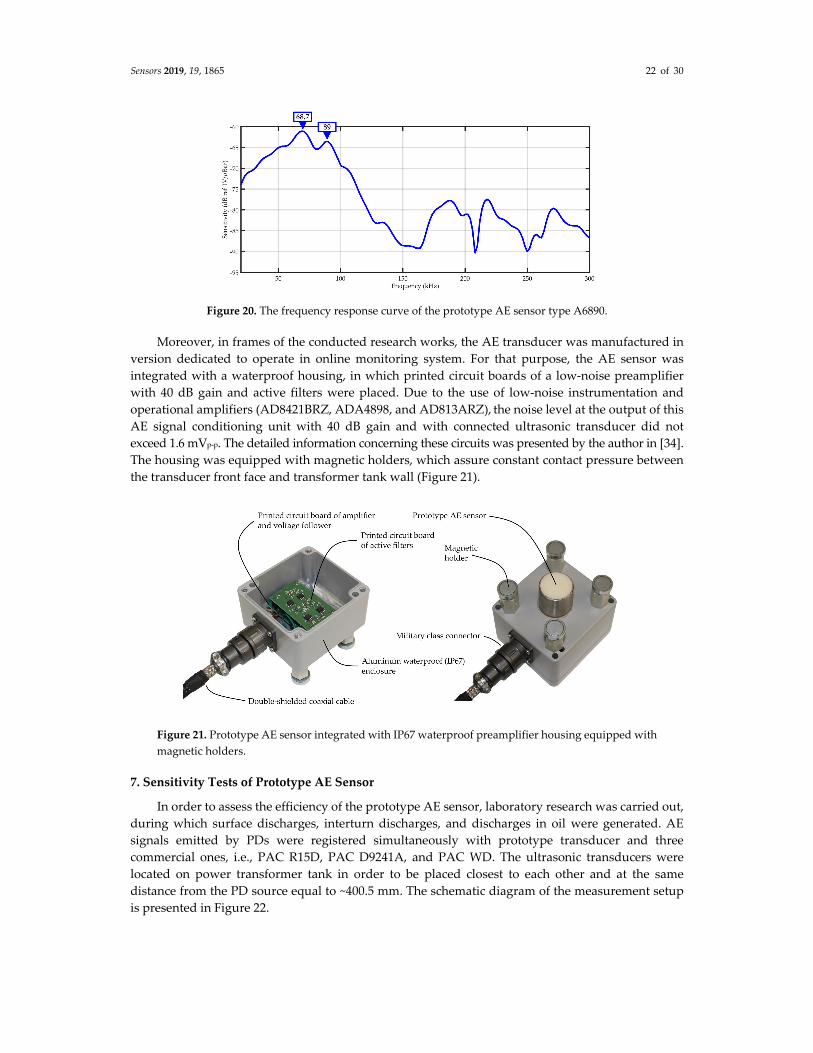
Sensors 2019, 19, 1865 22 of 30
Figure 20. The frequency response curve of the prototype AE sensor type A6890.
Moreover, in frames of the conducted research works, the AE transducer was manufactured in
version dedicated to operate in online monitoring system. For that purpose, the AE sensor was
integrated with a waterproof housing, in which printed circuit boards of a low‐noise preamplifier
with 40 dB gain and active filters were placed. Due to the use of low‐noise instrumentation and
operational amplifiers (AD8421BRZ, ADA4898, and AD813ARZ), the noise level at the output of this
AE signal conditioning unit with 40 dB gain and with connected ultrasonic transducer did not
exceed 1.6 mVp‐p. The detailed information concerning these circuits was presented by the author in [34].
The housing was equipped with magnetic holders, which assure constant contact pressure between
the transducer front face and transformer tank wall (Figure 21).
Figure 21. Prototype AE sensor integrated with IP67 waterproof preamplifier housing equipped with
magnetic holders.
7. Sensitivity Tests of Prototype AE Sensor
In order to assess the efficiency of the prototype AE sensor, laboratory research was carried out,
during which surface discharges, interturn discharges, and discharges in oil were generated. AE
signals emitted by PDs were registered simultaneously with prototype transducer and three
commercial ones, i.e., PAC R15D, PAC D9241A, and PAC WD. The ultrasonic transducers were
located on power transformer tank in order to be placed closest to each other and at the same
distance from the PD source equal to ~400.5 mm. The schematic diagram of the measurement setup
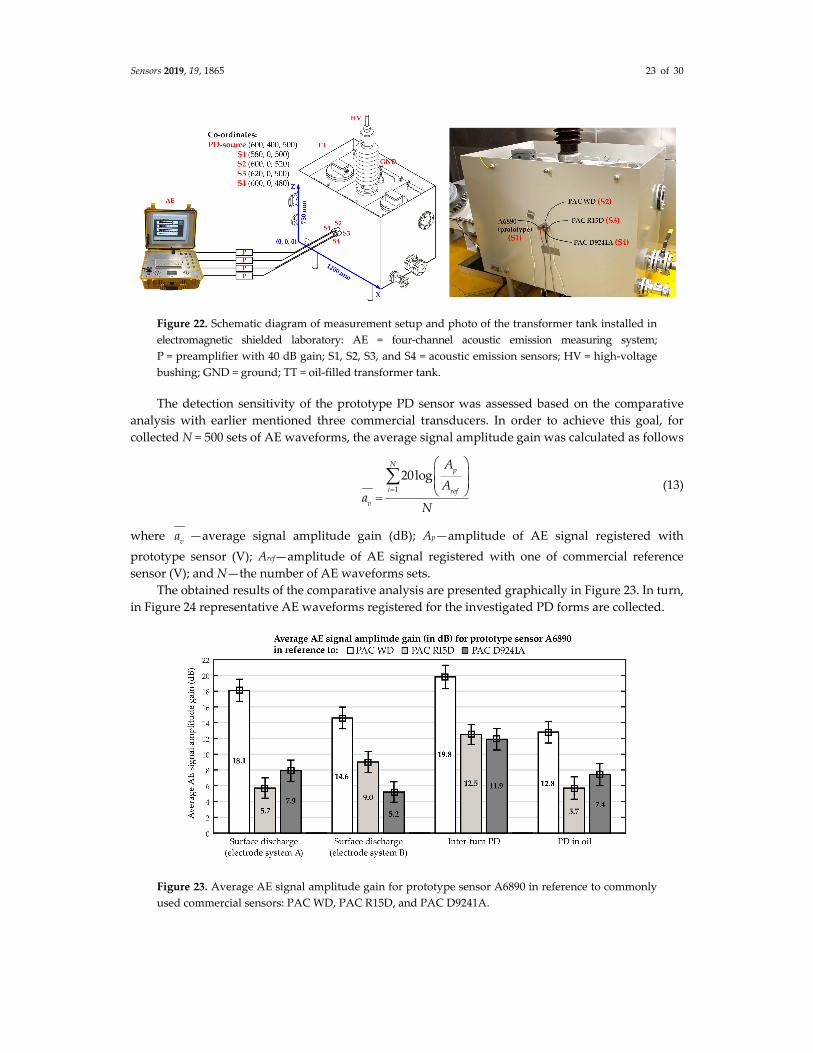
is presented in Figure 22.
Sensors 2019, 19, 1865 23 of 30
Figure 22. Schematic diagram of measurement setup and photo of the transformer tank installed in
electromagnetic shielded laboratory: AE = four‐channel acoustic emission measuring system;
P = preamplifier with 40 dB gain; S1, S2, S3, and S4 = acoustic emission sensors; HV = high‐voltage
bushing; GND = ground; TT = oil‐filled transformer tank.
The detection sensitivity of the prototype PD sensor was assessed based on the comparative
analysis with earlier mentioned three commercial transducers. In order to achieve this goal, for
collected N = 500 sets of AE waveforms, the average signal amplitude gain was calculated as follows
1
20logN
p
i ref
v
A
Aa
N
(13)
where va —average signal amplitude gain (dB); Ap—amplitude of AE signal registered with
prototype sensor (V); Aref—amplitude of AE signal registered with one of commercial reference
sensor (V); and N—the number of AE waveforms sets.
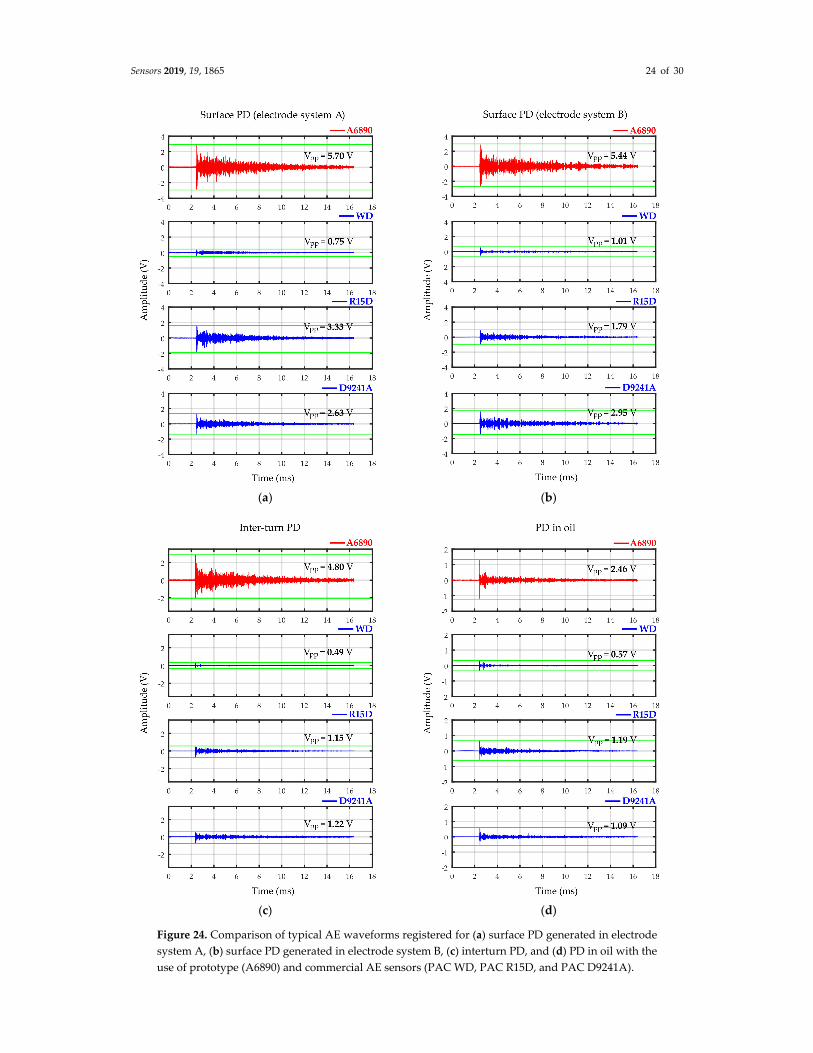
The obtained results of the comparative analysis are presented graphically in Figure 23. In turn,
in Figure 24 representative AE waveforms registered for the investigated PD forms are collected.
Figure 23. Average AE signal amplitude gain for prototype sensor A6890 in reference to commonly
used commercial sensors: PAC WD, PAC R15D, and PAC D9241A.
Sensors 2019, 19, 1865 24 of 30
(a) (b)
(c) (d)
Figure 24. Comparison of typical AE waveforms registered for (a) surface PD generated in electrode
system A, (b) surface PD generated in electrode system B, (c) interturn PD, and (d) PD in oil with the
use of prototype (A6890) and commercial AE sensors (PAC WD, PAC R15D, and PAC D9241A).

Sensors 2019, 19, 1865 25 of 30
The analysis results prove that due to optimization of the transducer frequency response curve
and application of two sensing elements, a very high detection sensitivity of partial discharges
typical for power transformer insulation system was obtained. The highest differences in favor of
prototype sensor were noted for interturn discharges. From the three commercial transducers, the
low‐frequency sensor type D9241A was characterized by the highest detection sensitivity of
interturn discharges. Comparing to that sensor, the amplitude of the AE pulses registered with
prototype sensor A6890 was ~3.9 higher (11.9 dB signal amplitude gain). The lowest difference was
observed for surface discharges generated in the electrode system with a significant normal
component of the electric field (electrode system B). In this case, the amplitude of the registered AE
pulses was, on average, ~1.8 higher than for sensor D9241A and 2.8 times higher than for sensor R15D,
which was respectively 5.2 dB and 9 dB signal amplitude gain.
The frequency analysis of the AE pulses registered with prototype sensor A6890 (Figure 25)
showed large similarity to the results obtained with broadband sensor type Olympus V101‐RB. As
expected, the highest similarity was noted for surface discharges generated in electrode system A
with negligibly small normal component of the electric field. For both transducers, frequency peak
value fpeak in the spectrum was identical (68 kHz). In turn, for surface discharges generated in
electrode system B with significant normal component of the electric field, the difference was equal to
only 2 kHz (fpeak = 38 kHz for Olympus V101‐RB and fpeak = 36 kHz for A6890). In the case of the
remaining investigated PD types, the differences were slightly higher and equal 7 kHz for interturn
discharges (fpeak = 40 kHz for Olympus V101‐RB and fpeak = 47 kHz for A6890) and 9 kHz for partial
discharges in oil (fpeak = 98 kHz for Olympus V101‐RB and fpeak = 89 kHz for A6890).
(a)
(b)
(c)
(d)
Figure 25. Average normalized PSD determined for AE signals emitted by (a) surface discharges
generated in electrode system A, (b) surface discharges generated in electrode system B, (c) interturn
discharges, and (d) partial discharges in oil, registered with the use of prototype AE sensor type A6890.

Sensors 2019, 19, 1865 26 of 30
8. Conclusions
A prototype AE sensor (named A6890) optimized for partial discharge detection in oil‐filled
power transformers was presented in the article. The main resonant frequencies of the A6890 sensor
were selected based on extensive laboratory research, which allowed identification of acoustic
frequencies emitted by partial discharges in oil–paper insulation. The measurement results showed
that typical for power transformer forms of PDs generate AE signals, in which energy is transmitted
in three main ranges: 20‒45 kHz, 50‒70 kHz, and 85‒115 kHz, and dominant frequencies are equal to
40 kHz, 68 kHz, and 90 kHz, respectively. In the lowest band (20‒45 kHz), noise associated with the
deformation of magnetic domains in the transformer core and external acoustic disturbances may
occur. Therefore, the prototype AE sensor was designed in order to operate in two remaining bands:
50‒70 kHz and 85‒115 kHz. For its manufacturing, two piezoelectric discs with opposite polarization
directions and different heights were used. Fully differential design allowed to obtain the desired
properties of the transducer, i.e., (1) two resonant frequencies for longitudinal acoustic waves (peaks
at 68.7 kHz and 89 kHz), (2) high peak sensitivity (−61.1 dB ref. V/μbar), (3) low noise (removal of the
common mode noise by the differential amplifier), and (4) wide frequency response (~30‒100 kHz). The
laboratory tests confirmed that the prototype transducer is characterized by ultrahigh sensitivity of
partial discharge detection. Compared to popular commercial AE sensors, the average amplitude
signal gain by a minimum 5.2 dB, and a maximum 19.8 dB was noted.
Funding: This work was supported by the Polish National Centre for Research and Development, within the
Applied Research Programme, grant No. PBS3/A4/12/2015.
Conflicts of Interest: The author declares no conflicts of interest.
References
1. Tenbohlen, S.; Jagers, J.; Vahidi, F.; Bastos, G.; Desai, B.; Diggin, B.; Fuhr, J.; Gebauer, J.; Krüger, M.; Lapworth,
J.; et al. Transformer Reliability Survey; Technical Brochure 642 CIGRE: Paris, France, 2015.
2. Martin, D.; Marks, J.; Saha, T. Survey of Australian power transformer failures and retirements. IEEE
Electr. Insul. Mag. 2017, 33, 16–22.
3. Bossi, A.; Dind, J.E.; Frisson, J.M.; Khoudiakov, U.; Light, H.F.; Narke, D.V.; Verdon, J. An international
survey on failures in large power transformers in service. Cigré Electra 1993, 88, 21–48.
4. Dombek, G.; Gielniak, J.; Wroblewski, R. Fire safety and electrical properties of mineral oil/synthetic ester
mixtures. In Proceedings of the IEEE 2017 International Symposium on Electrical Insulating Materials
(ISEIM), Toyohashi, Japan, 11–15 September 2017; pp. 227–230.
5. Dombek, G.; Gielniak, J. Fire safety and electrical properties of mixtures of synthetic ester/mineral oil and
synthetic ester/natural ester. IEEE Trans. Dielectr. Electr. Insul. 2018, 25, 1846–1852.
6. Christina, A.J.; Salam, M.A.; Rahman, Q.M.; Wen, F.; Ang, S.P.; Voon, W. Causes of transformer failures
and diagnostic methods—A review. Renew. Sustain. Energy Rev. 2018, 82, 1442–1456.
7. Chakravorti, S.; Dey, D.; Chatterjee, B. Recent Trends in the Condition Monitoring of Transformers; Springer:
London, UK, 2013.
8. Lopatkiewicz, R.; Nadolny, Z. Temperature field on high voltage power transformer. Prz. Elektrotech. 2008,
84, 50–52.
9. Tenbohlen, S.; Coenen, S.; Djamali, M.; Müller, A.; Samimi, M.H.; Siegel, M. Diagnostic Measurements for
Power Transformers. Energies 2016, 9, 347.
10. Nadolny, Z.; Dombek, G.; Przybylek, P.; Przadka, D. Thermal properties of mineral oil admixed with C60
and TiO2 nanoparticles. In Proceedings of the 2016 IEEE Conference on Electrical Insulation and Dielectric
Phenomena (CEIDP), Toronto, ON, Canada, 16–19 October 2016; pp. 538–541.
11. Lundgaard, L.E.; Poittevin, J.; Schmidt, J.; Allen, D.; Blackburn, T.R.; Borsi, H.; Kemp, I.J. Partial discharges
in transformer insulation. Cigre Task Force 2000, 15, 15–302.
12. Höhlein, I.; Kachler, A.J.; Tenbohlen, S.; Leibfried, T. Transformer life management German experience
with condition assessment. Contrib. CIGRE SC12 A 2003, 2, 2–4.
13. Wang, M.; Vandermaar, A.J.; Srivastava, K.D. Review of condition assessment of power transformers in
service. IEEE Electr. Insul. Mag. 2002, 18, 12–25.

Sensors 2019, 19, 1865 27 of 30
14. Lokhanin, A.K.; Shneider, G.Y.; Sokolov, V.V.; Chornogotsky, V.M. Internal Insulation Failure Mechanisms of
HV Equipment under Service Conditions; CIRGE: Paris, France, 2002.
15. IEC. IEC 60270:2000/AMD1:2015, High‐Voltage Test Techniques—Partial Discharge Measurements; IEC:
Geneva, Switzerland, 2015.
16. Hoek, S.M.; Coenen, S.; Bornowski, M.; Tenbohlen, S. Fundamental Differences of the PD Measurement
according to IEC 60270 and in UHF range. In Proceedings of the 2008 International Conference on
Condition Monitoring and Diagnosis, Beijing, China, 21–24 April 2008; pp. 79–81.
17. Wang, X.; Yang, M.; Yan, Z. Review and prospect of rejecting interference in Partial Discharge
measurement of power equipment. Power Syst. Technol. 2000, 24, 41–45.
18. Tang, X.; Wang, W.; Zhang, X.; Wang, E.; Li, X. On‐Line Analysis of Oil‐Dissolved Gas in Power
Transformers Using Fourier Transform Infrared Spectrometry. Energies 2018, 11, 3192.
19. Chen, W.; Chen, X.; Peng, S.; Li, J. Canonical Correlation Between Partial Discharges and Gas Formation in
Transformer Oil Paper Insulation. Energies 2012, 5, 1081–1097.
20. Xiang, C.; Zhou, Q.; Li, J.; Huang, Q.; Song, H.; Zhang, Z. Comparison of Dissolved Gases in Mineral and
Vegetable Insulating Oils under Typical Electrical and Thermal Faults. Energies 2016, 9, 312.
21. Álvarez, F.; Garnacho, F.; Ortego, J.; Sánchez‐Urán, M.Á. Application of HFCT and UHF Sensors in
On‐Line Partial Discharge Measurements for Insulation Diagnosis of High Voltage Equipment. Sensors
2015, 15, 7360–7387.
22. Robles, G.; Fresno, J.M.; Martínez‐Tarifa, J.M. Separation of Radio‐Frequency Sources and Localization of
Partial Discharges in Noisy Environments. Sensors 2015, 15, 9882–9898.
23. Judd, M.D.; Cleary, G.P.; Bennoch, C.J.J. Applying UHF partial discharge detection to power transformers.
IEEE Power Eng. Rev. 2002, 22, 57–59.
24. Coenen, S.; Tenbohlen, S.; Markalous, S.M.; Strehl, T. Sensitivity of UHF PD measurements in power
transformers. IEEE Trans. Dielectr. Electr. Insul. 2008, 15, 1553–1558.
25. Sikorski, W.; Szymczak, C.; Siodla, K.; Polak, F. Hilbert curve fractal antenna for detection and on‐line
monitoring of partial discharges in power transformers. Eksploatacja i Niezawodnosc 2018, 20, 343–351.
26. Robles, G.; Albarracín, R.; Vázquez‐Roy, J.L.; Rajo‐Iglesias, E.; Martínez‐Tarifa, J.M.;
Rojas‐Moreno, M.V.; Ardila‐Rey, J. On the use of Vivaldi antennas in the detection of partial discharges. In
Proceedings of the 2013 IEEE International Conference on Solid Dielectrics (ICSD), Bologna, Italy, 30
June–4 July 2013; pp. 302–305.
27. Polak, F.; Sikorski, W.; Siodla, K. Location of partial discharges sources using sensor arrays. In Proceedings
of the 2014 ICHVE International Conference on High Voltage Engineering and Application, Poznan,
Poland, 8–11 September 2014; pp. 1–4.
28. Kumar, A.S.; Gupta, R.P.; Udayakumar, K.; Venkatasami, A. Online partial discharge detection and
location techniques for condition monitoring of power transformers: A review. In Proceedings of the 2008
International Conference on Condition Monitoring and Diagnosis, Beijing, China, 21–24 April 2008; pp.
927–931.
29. Sikorski, W.; Moranda, H.; Brodka, B.; Neumann, R. Detection, recognition and location of partial
discharge sources in power transformer. Prz. Elektrotech. 2010, 86, 142–145.
30. Markalous, S.M.; Tenbohlen, S.; Feser, K. Detection and location of partial discharges in power
transformers using acoustic and electromagnetic signals. IEEE Trans. Dielectr. Electr. Insul. 2008, 15,
1576–1583.
31. Sikorski, W.; Siodla, K.; Moranda, H.; Ziomek, W. Location of partial discharge sources in power
transformers based on advanced auscultatory technique. IEEE Trans. Dielectr. Electr. Insul. 2012, 19,
1948–1956.
32. Kundu, P.; Kishore, N.K.; Sinha, A.K. A non‐iterative partial discharge source location method for
transformers employing acoustic emission techniques. Appl. Acoust. 2009, 70, 1378–1383.
33. Lundgaard, L.E. Partial discharge. XIII. Acoustic partial discharge detection‐fundamental considerations.
IEEE Electr. Insul. Mag. 1992, 8, 25–31.
34. Sikorski, W. Active Dielectric Window: A New Concept of Combined Acoustic Emission and
Electromagnetic Partial Discharge Detector for Power Transformers. Energies 2018, 12, 1–27.
35. Siegel, M.; Beltle, M.; Tenbohlen, S.; Coenen, S. Application of UHF sensors for PD measurement at power
transformers. IEEE Trans. Dielectr. Electr. Insul. 2017, 24, 331–339.

Sensors 2019, 19, 1865 28 of 30
36. Castro, B.; Clerice, G.; Ramos, C.; Andreoli, A.; Baptista, F.; Campos, F.; Ulson, J. Partial Discharge
Monitoring in Power Transformers Using Low‐Cost Piezoelectric Sensors. Sensors 2016, 16, 1266.
37. Vallen, H. Acoustic Emission Testing: Fundamentals, Equipment, Applications; Castell: Wuppertal,
Germany, 2006.
38. Acoustic Emission Sensors. Available online: http://www.vallen.de/fileadmin/user_upload/sov1512.pdf
(accessed on 26 February 2019).
39. Differential Acoustic Emission Sensors. Available online: https://www.physicalacoustics.com/differential
(accessed on 26 February 2019).
40. IEEE Guide for the Detection of Acoustic Emissions from Partial Discharges in Oil‐Immersed Power Transformers;
IEEE Std C57.127‐2000; Institute of Electrical and Electronics Engineers: Piscataway, NJ, USA, 13
December 2000.
41. IEEE Guide for the Detection and Location of Acoustic Emissions from Partial Discharges in Oil‐Immersed Power
Transformers and Reactors; IEEE Std C57.127‐2007 (Revision of IEEE Std C57.127‐2000); Institute of Electrical
and Electronics Engineers: Piscataway, NJ, USA, 31 August 2007.
42. Bengtsson, T.; Jönsson, B. Transformer PD diagnosis using acoustic emission technique. In Proceedings of
the 10th International Symposium on High Voltage Engineering, Montréal, QC, Canada, 25–29 August
1997; Volume 115.
43. CIGRE Working Group. Guidelines for Unconventional Partial Discharge Measurement; CIGRE Working
Group D1.33; CIGRE Working Group: London, UK, 2010.
44. CIGRE Working Group. Guidelines for Basic and Practical Aspects of Partial Discharge Detection Using
Conventional (IEC60270) and Unconventional Methods; CIGRE Working Group D1.47; CIGRE Working
Group: London, UK, 2015.
45. IEC‐TS PD. 62478: 2016 High Voltage Test Techniques—Measurement of Partial Discharges by Electromagnetic
and Acoustic Methods; BSI: London, UK, 2016.
46. CIGRE Working Group. Partial Discharges in Transformers; CIGRE Working Group D1.29; CIGRE Working
Group: London, UK, 2017.
47. Harrold, R.T. Ultrasonic spectrum signatures of under‐oil corona sources. IEEE Trans. Electr. Insul. 1975, 4,
109–112.
48. Harrold, R.T. Acoustic emission signatures of arcs and sparks. In Proceedings of the IEEE International
Conference on Electrical Insulation, Boston, MA, USA, 9–11 June 1980; pp. 184–189.
49. Howells, E.; Norton, E.T. Detection of partial discharges in transformers using acoustic emission
techniques. IEEE Trans. Power Appar. Syst. 1978, 5, 1538–1549.
50. Zhu, D.; Tan, K.; Jin, X. The study of acoustic emission method for detection of partial discharge in power
transformer. In Proceedings of the Second International Conference on Properties and Applications of
Dielectric Materials, Beijing, China, 12–16 September 1988; 614–617.
51. Bengtsson, T.; Leijon, M.; Ming, L. Acoustic frequencies emitted by partial discharges in oil. In
Proceedings of the 8th International Symposium on High Voltage Engineering, Yokohama, Japan, 23–27
August 1993; pp. 113–116.
52. Scholey, T.; Gorgius, D. Ultrasonic detection of discharges in power transformers. In Proceedings of the
9th International Symposium on HV Engineering, Graz, Austria, 28 August–1 September 1995.
53. Sakoda, T.; Arita, T.; Nieda, H.; Ando, K.; Otsub, M., Honda, C. Studies of elastic waves caused by corona
discharges in oil. IEEE Trans. Dielectr. Electr. Insul. 1999, 6, 825–830.
54. Boczar, T. Identification of a specific type of PD from acoustic emission frequency spectra. IEEE Trans.
Dielectr. Electr. Insul. 2001, 8, 598–606.
55. Kundu, P.; Kishore, N.K.; Sinha, A.K. Frequency domain analysis of acoustic emission signals for
classification of partial discharges. In Proceedings of the 2007 Annual Report‐Conference on Electrical
Insulation and Dielectric Phenomena, Vancouver, BC, Canada, 14–17 October 2007; pp. 146–149.
56. Sikorski, W.; Ziomek, W. Detection, recognition and location of partial discharge sources using acoustic
emission method. In Acoustic Emission; Intech Open: Rijeka, Croatia, 2012.
57. Sokolov, V.; Mayakov, V.; Kuchinsky, G.; Golubev, A. On‐Site Partial Discharge Measurement of Transformers.
Available online: http://es.eaton.com/InsulGardSalesTool/Documentation/PD%20Transformer.pdf (accessed on
18 April 2019).
58. Sokolov, V. Power Transformer: Post Failure and Post Mortem Analysis. In Proceedings of the My
Transfo, Rio de Janeiro, Brazil, 7–9 March 2007.

Sensors 2019, 19, 1865 29 of 30
59. Sokolov, V. Understanding failure modes of transformers. In Proceedings of the Euro TechCon 2005,
Chester, UK, 28–30 November; pp. 43–65.
60. Mitchinson, P.M.; Lewin, P.L.; Strawbridge, B.D.; Jarman, P. Tracking and surface discharge at the
oil‐pressboard interface. IEEE Electr. Insul. Mag. 2010, 26, 35–41.
61. Li, J.; Si, W.; Yao, X.; Li, Y. Partial discharge characteristics over differently aged oil/pressboard interfaces.
IEEE Trans. Dielectr. Electr. Insul. 2009, 16, 1640–1647.
62. Sokolov, V.; Berler, Z.; Rashkes, V. Effective methods of assessment of insulation system conditions in
power transformers: A view based on practical experience. In Proceedings of the Electrical Insulation
Conference and Electrical Manufacturing and Coil Winding Conference (Cat. No. 99CH37035), Cincinnati,
OH, USA, 26–28 October 1999; pp. 659–667.
63. Sikorski, W.; Walczak, K.; Przybylek, P. Moisture migration in an oil–paper insulation system in relation to
online partial discharge monitoring of power transformers. Energies 2016, 9, 1082.
64. Sokolov, V.; Vanin, B. Evaluation of power transformer insulation through measurement of dielectric
characteristics. In Proceedings of the 63rd Annual International Conference Doble Clients, Boston, MA,
USA, 25‐29 March, 1996.
65. Gao, B.; Yu, R.; Hu, G.; Liu, C.; Zhuang, X.; Zhou, P. Development Processes of Surface Trucking and
Partial Discharge of Pressboards Immersed in Mineral Oil: Effect of Tip Curvatures. Energies 2019, 12, 554.
66. Li, F., Cheng, Y., Tian, X., Duan, B., Cheng, C., Zhao, Z. Relationship between carbonized traces and space
charges in oil‐paper insulation. In Proceedings of the 2015 IEEE 11th International Conference on the
Properties and Applications of Dielectric Materials (ICPADM), Sydney, NSW, Australia, 19–22 July 2015;
pp. 971–974.
67. Piotrowski, T.; Rozga, P.; Kozak, R. Analysis of excessive hydrogen generation in transformers in service.
IEEE Trans. Dielectr. Electr. Insul. 2015, 22, 3600–3607.
68. Asokan, T.; Bandaru, S. X‐wax formation in transformer liquid dielectrics. In Proceedings of the IEEE
International Conference on Dielectric Liquids (ICDL 2005), Coimbra, Portugal,
26 June–1 July 2005; pp. 401–404.
69. Lokhanin, A.K.; Shneider, G.Y.; Sokolov, V.; Chornogotsky, V.M.; Morozova, T.I. Internal insulation
failure mechanisms of HV equipment under service conditions. Cigre Rep. 15 2002, 201, 1–6.
70. Przybylek, P. Investigations of the Temperature of Bubble Effect Initiation in Oil‐Paper Insulation. Prz.
Elektrotech. 2010, 86, 166–169.
71. Heinrichs, F.W. Bubble formation in power transformer windings at overload temperatures. IEEE Trans.
Power Appar. Syst. 1979, 5, 1576–1582.
72. Nakao, Y., Itoh, H., Sakai, Y., Tagashira, H. Studies of impulse creepage discharge in transformer oil. IEEE
Trans. Electr. Insul. 1991, 26, 732–738.
73. Zainuddin, H.; Mitchinson, P.M.; Lewin, P.L. Investigation on the surface discharge phenomenon at the
oil‐pressboard interface. In Proceedings of the 2011 IEEE International Conference on Dielectric Liquids,
Trondheim, Norway, 26‐30 June 2011; pp. 1–4.
74. Ziomek, W.; Kuffel, E.; Sikorski, W.; Staniek, P.; Siodła, K. Location and recognition of partial discharge
sources in a power transformer using advanced acoustic emission method. Prz. Elektrotech. 2008, 84, 20–23.
75. Ding, H.‐Z.; Wang, Z.D.; Jarman, P. On electric stresses at wedge‐shaped oil gaps in power transformers
with application to surface discharge and breakdown. In Proceedings of the 2008 IEEE International
Conference on Dielectric Liquids, Futuroscope‐Chasseneuil, France, 30 June–3 July 2008; pp. 1–4.
76. Sikorski, W. The detection and identification of partial discharges in power transformer with the use of the
acoustic emission method. Prz. Elektrotech. 2010, 86, 229–232.
77. Forouharmajd, F.; Mohammadi, Z.; Ahmadvand, M. Sound pressure level tools design used in
occupational health by means of Labview software. Int. J. Environ. Health Eng. 2015, 4, 41.
78. De Silva, C.W. (Ed.). Vibration Monitoring, Testing, and Instrumentation; CRC Press: Boca Raton FL, SUA,
2007.
79. Krimholtz, R.; Leedom, D.A.; Matthaei, G.L. New equivalent circuits for elementary piezoelectric
transducers. Electron. Lett. 1970, 6, 398–399.
80. Bechmann, R.; Fair, I.E. Standard definitions and methods of measurement for piezoelectric vibrators.
IEEE ANSI 1970, 176, 1–12.
81. Mason, W.P. Electromechanical Transducers and Wave Filters, 2nd ed.; Van Nostrand: Princeton, NJ, USA,
1948; ISBN 9780442051648.

Sensors 2019, 19, 1865 30 of 30
82. Redwood, M. Transient performance of a piezoelectric transducer. J. Acoust. Soc. Am. 1961, 33, 527–536.
83. Merks, E.J.; Bouakaz, A.; Bom, N.; Lancee, C.T.; Van Der Steen, A.F.; De Jong, N. Design of a multilayer
transducer for acoustic bladder volume assessment. IEEE Trans. Ultrason. Ferroelectr. Freq. Control 2006, 53,
1730–1738.
84. Tran‐Huu‐Hue, L.P.; Desmare, R.; Lavassort, F.; Lethiecq M. KLM circuit‐based method for modeling
multilayer piezoelectric structures. In Proceedings of the 1997 IEEE Ultrasonics Symposium Proceedings.
An International Symposium (Cat. No. 97CH36118), Toronto, ON, Canada, 5–8 October 1997; pp. 995–998.
85. Oakley, C.G. Calculation of ultrasonic transducer signal‐to‐noise ratios using the KLM model. Ieee Trans.
Ultrason. Ferroelectr. Freq. Control 1997, 44, 1018–1026.
86. Martin, P.M., Good, M.S., Johnston, J.W., Posakony, G.J., Bond, L.J., Crawford, S.L. Piezoelectric films for
100‐MHz ultrasonic transducers. Thin Solid Film. 2000, 379, 253–258.
87. Castillo, M.; Acevedo, P.; Moreno, E. KLM model for lossy piezoelectric transducers. Ultrasonics 2003, 41,
671–679.
88. ASTM E976‐10 Standard Guide for Determining the Reproducibility of Acoustic Emission Sensor Response;
ASTM International: West Conshohocken, PA, USA, 2016; p. 7.
© 2019 by the author. Licensee MDPI, Basel, Switzerland. This article is an open access
article distributed under the terms and conditions of the Creative Commons Attribution
(CC BY) license (http://creativecommons.org/licenses/by/4.0/).