development of a suitable anechoic treatment for the · pdf filedevelopment of a suitable...
TRANSCRIPT

C)ASD-TDR42-S5
l402 99710
DEVELOPMENT OF A SUITABLE ANECHOIC TREATMENTFOR THE ASD SONIC FATIGUE FACILITY
C TECHNICAL DOCUMENTARY REPORT ASD-TDR-62-985
L ".March 1963
l'---r
Directorate of Engineering Test
Aeronautical Systems Division
Air Force Systems CommandWright-Patterson Air Force Base, Ohio
Project No. 4437 .J, .
(Prepared under Contract No. AF 33(657)-7434by Armour Research Foundation of Illinois Institute of
Technology, Chicago, Illinois; Franklin G. Tyzzer, author.)

NOTICES
When Government drawings, specifications, or other data are used forany purpose other than in connection with a definitely related Governmentprocurement operation, the United States Governement thereby incurs noresponsibility nor any obligation whatsoever; and the fact that the Govern-ment may have formulated, furnished, or in any way supplied the saiddrawings, specifications, or other data, is not to be regarded by implica-tion or'otherwise as in any manner licensing the holder or any other personor corporation, or conveying any rights or permission to manufacture, use,or sell any patented invention that may in any way be related thereto.
Qualified requesters may obtain copies of this report from the ArmedServices Technical Information Agency, (ASTIA), Arlington Hall Station,Arlington 12, Virginia.
This report has been released to the Office of Technical Services, U.S.Department of Commerce, Washington 25, D. C., in stock quantities forsale to the general public.
Copies of this report should not be returned to the Aeronautical SystemsDivision unless return is required by security considerations, contractualobligations, (,r notice on a specific document.
Z6-640T. ZO0. 5-1-63

FOREWORD
This report was prepared by Armour Research Foundationof Illinois Institute of Technology, Chicago, Illinois on Air Force ContractAF 33(657)-7434, Project No. 4437, "Development of a Suitable AnechoicTreatment for the ASD Sonic Fatigue Facility". The work was adminis-tered under the direction of the Sonic Branch. Mr. W. K. Shilling was taskengineer.
The main part of the work was done between November 1961and April 1962 and the program was extended under a supplemental agree-ment from July to October 1962. The project leader was F. G. Tyzzerand other contributors are L. D. Williams, H. H. Hall, W. E. Lawrie,C. S. Caccavari, and W. C. Sperry.

ABSTRACT
Results are given for a research program leading to thedesign of an anechoic treatment for the test chamber of the ASD high intensitysound facility. The acoustical requirements for 96 percent absorptioncoefficient at normal incidence for a frequency range of 50 - 7000 cps andfor sound pressure levels up to 160 db and the mechanical requirements fora collapsible treatment presented novel problems in design. The require-ments were met by a treatment, six feet thick, composed of six layers ofabsorbing material irregularly spaced with the acoustical resistances perlayer increasing from values for layers at the incidence sound side to highervalues for layers near the room surfaces. Tests in the high intensity im-pedance tube facility designed for the program showed that the normal in-cidence absorption coefficient of the treatment was 96 percent or higherover most of the frequency range from 50 - 7000 cps at sound pressurelevels from 130 to 160 db. Fairly satisfactory results were also obtainedfor a five layer treatment subsequently designed. Etched polyurethanefoam supported by wire screens was initially chosen as the layer materialbecause of its resistance to damage in small scale life tests at particlevelocities corresponding to a sound pressure level of 160 db. In subsequentaccelerated life tests in the siren facility at North American Aviation,Columbus, Ohio, there was no significant damage to a four by four footspecimen of material after 105 hours at sound pressure levels between 165and 170 db except for failure of the supporting wire screens at about 78 hours.
This technIeal dooments-y repot has bow rvilwed and is approved forpub3lietion.
Wee I PIweplow
Colonel, =

REVIEW AND COORDINATION OF ASD TECHNICAL DOCUMENTARY
REPORT 62-985
Project ngineserswILLIm x. SZIL~LD InISonio Breach, Efviromsntal L•vouDirectorate of fkgineern tDspeW for Test and Support
Concurred Ins ý1t le eW IlIAM J. DuDOIS, Lt. Col. OW/ Acting Director ot ftineering TestDepat for Test and Support
Concurred In: P
haical Directorty for Teat and Support
Approved by:4 0 -
pmt Dsputy for Tat and upert
iv

TABLE OF CONTENTS
Page No.
Section I Introduction and Summary I
Section II Choice of Layer Type Absorbing Treatment 3
Section MI Layer System Design 5
Number and Spacing of Layers 5
Layer Impedance (Resistance) 6
Layer Support 7
Durability of Layer Material 7
Section IV Measurement of Acoustic Resistance 9
DC Resistance Tests 9
AC Resistance Tests 10
Section V Absorption of Layer Systems 13
Normal Absorption Coefficients 13
Random Absorption Coefficients 17
Section VI Fatigue Tests on Layer Materials 20
Limited Life Tests 20
Extended Life Tests 21
Section VII Miscellaneous Tests on Polyurethane Foam 24
Section VIII Conclusions and Recommendations 28
Conclusions 28
Recommendations 30
Acknowledgment 33
List of References 34
V

TABLE OF CONTENTS (Continued)
Page No.
Appendix I Development of High Intensity Test Facility 35
Impedance Tubes 35
Sample Holders 37
Driving Equipment 38
Measuring Equipment for Impedance Tubes 41
Flow Measuring Facility 42
Appendix II Theory and Calculation of Layer System Absorption 45
Theory for Calculation of Impedance
of Multiple Layers 45
Theory for Approximate Calculation
of System Absorption 48
Calculated Absorption of Layer Systems 50
Effect of Surface Density of Layers 51
Appendix III Calculation of Reverberant Room Conditions 53
vi
LIST OF FIGURES
Page No.
Fig. No. 1 DC Flow Resistance of Materials
(a) Polyurethane Foam, Etched,
Nos. 1, 2, 3, 4 55
(b) Polyurethane Foam Nos. 5, 6 56
(c) Fiberglas, Nos. 3, 5, 8, 9 57
(d) Fiberglas, Nos. 1, 2, 4, 6, 7 58
(e) Glass Wool, No. 10 59
(f) Wire Screen, Nos. 1, 2, 3, 4 60
(g) Wire Screen, Nos. 5A, 6A 61
(h) Wire Screen, No. 5, 1 - 4 layers 62
(i) Glass Fiber Cloth, Nos. 1A, 2A, 4A 63
(J) Glass Fiber Cloth, No. 3A 64
(k) Glass Fiber Cloth, Nos. 5, 6, 7, 8 65
Fig. No. 2 Variation of Sound Pressure Level with Particle
Velocity 66
Fig. No. 3 AC and DC Flow Resistance of Materials
(a) Material No. 3(1/2"), Polyurethane
Foam Etched, Low Frequencies 67
(b) Material No. 3(1/2"), Polyurethane
Foam Etched, Medium Frequencies 68
(c) Material No. 4(1/2"), Polyuxethane
Foam Etched, Low Frequencies 69
vii

LIST OF FIGURES (Continued)
Page No.
(d) Material No. 5A, 100 Mesh Wire
Screen, Low Frequencies 70
(e) Material No. SA, 100 Mesh Wire
Screen, Medium Frequencies 71
(f) Material No. IA, Woven Glass Cloth,
2 Layers 72
(g) Material No. 4A, Woven Glass Cloth,
2 Layers 73
Fig. No. 4 Normal Incidence Absorption Coefficients for
Layer Systems
(a) System No. 1 74
(b) System No. 2 75
(c) System No. 3 76
(d) System No. 3, 130 to 160 db 77
(e) System No. 4 78
(f) System No. 5 79
(g) System No. 6 80
(h) System No. 7 81
(i) Systems No. 1 and 3 82
0) System No. 8 83
(k) System No. 9 84
(1) System No. 10 85
viii

LIST OF FIGURES (Continued)
Page No.
(m) System No. 11 86
(n) System No. 14 87
(o) System No. 15 88
(p) System No. 16 89
(q) System No. 17 90
(r) System No. 18 91
(a) System No. 19 92
(t) System No. 20 93
(u) System No. 21 94
(v) System No. 22 95
(w) System No. 23 96
(x) System No. 24 97
(y) System No. 25 98
Fig. No. 5 Random Incidence Absorption Coefficients for
Layer System No. 11 99
Fig. No. 6 Damage from High Intensity Sound
(a) Fiberglas No. 3 (1/2") after Impedance
Tests 100
(b) Fibermetal No. 7 after Impedance Tests 101
(c) Wnven Glass Cloth No. 8 after
30 Minutes at 160 db 102
ix

LIST OF FIGURES (Continued)
Page No.
Fig. No. 7 Clamping Frame for Extended Life Tests 103
Fig. No. 8 Photograph of Specimen Mounted in Siren Facility 104
Fig. No. 9 Acceleration Record for Accelerometer at Center
of Extended Life Test Specimen 105
Fig. No. 10 Location of Breaks in Wire Screens After 78 Hours
at 157 db 106
Fig. No. II Temperature Rise at 103 cps for Polyurethane,
No. 3B (I1Z"), 1/4 Wave Length Backing 107
Fig. No. 1Z Temperature Rise at 2 .O and 400 cps for Poly-
urethane No. 3B (1/2"), 1/4 Wave Length Backing 108
Fig. No. 13 Temperature Rise for System No. 11 109
Fig. No. 14 Scale Model Showing a Mb.Aod of Supporting
Collapsible Layer Treatment 110
Fig. No. 15 Low Frequency Impedance Tube 111
Fig. No. 16 High Frequency Impedance Tube 112
Fig. No. 17 Layer System Sample Holders 113
Fig. No. 18 Block Diagram of Driving and Measuring Systems 114
x

LIST OF FIGURES (Continued)
Page No.
Fig. No. 19 Drivers and Horn for Low Frequency Impedance
Tube 115
Fig. No. 20 Drivers for Medium Frequency Impedance Tube 116
Fig. No. 21 DC Flow Resistance Equipment 117
Fig. No. 22 Normal Incidence Absorption Coefficient '!-orsus
Impedance 118
Fig. No. 23 System Diagram for Calculation of *N 119
2i

LIST OF TABLES
Page No.
Table I Description of Materials
(a) Polyurethane Foam 120
(b) Glass Wool 121
(c) MetdlUic Materials 122
(d) Woven Glass Cloth 123
Table II Effect of Layer Surface Density on Calculated
Absorption of System No. 10 124
Table MI Description of Layer Systems
(a) Systems I - 4 125
(b) Systems 5-8 126
(c) Systems 9- 11 127
(d) Systems 14 - 17 128
(e) Systems 18 - 21 129
(f) Systems Z2 - Z5 130
Table IV Impedance Tube Specifications 131
Table V List of Driving Equipment 132
Table VI List of Measuring Equipment 133
Table VII LAst of Flow Measuring Instruments 134
xii

LIST OF TABLES (Continued)
Page No.
Table VIII Calculated Absorption Coefficients for Six
Layer Systems with Equal Resistance Per
Layer and Spacings of System No. 1 135
Table IX Calculated Absorptions, ASD Room 136
Table X Reverberation Times, ASD Room 137
Table XI Difference Between Total Sound Level and
Direct Sound Level for a Non-Directional
Source in ASD Room 138
xiii

SYMBOLS
The units assigned to the symbols are used throughout the
report except when other units are used specifically mentioned. However,
when symbols are used in ratios such as d/) it is to be understood that the
symbols have the same units.
Symbol Units Definition
Scm Radius of impedance tube
A sabins Equivalent arr•a in ft2 of a perfectlyabsorptive surface
B ft2 Room coefficient equal to the total number ofsabins divided by one minus the averageabsorption coefficient of the room surfa.zes
c cm/sec Velocity of sound
d inches Length of air space between layers, also lengthof horn
E watts/cm Sound intensity, energy loss per unit area
f cps Frequency
j Symbol for imaginary part of impedance (-1) 1/2
e K dynes/cm 2 Volume coefficient of elasticity of air
£ inches Thickness of absorbing material
m grams/cm2 Surface density
M sec Surface density dividing by the characteristicimpedance of air, m/pc
p dynes/cm2 RMS value of instantaneous sound pressure
q Horn flare constant
r dyne sec/cm3 Specific acoustic resistance, acoustic resistanceper unit area, real part of .
xiv
SYMBOLS (Continued)
Symbol Units Definition
R Normalized specific acoustic resistance, r/pc
S cm 2 Area
T sec Reverberation time, for a 60 db sound decay
u cm/sec RMS particle velocity in a sound wave, alsolinear DC velocity of air
U cm 3/sec RMS volume velocity in a sound wave, alsoDC flow velocity of air
v cm/sec RMS value of velocity of vibration
V ft3 Volume of room
3w dynes sec/cm Characteristic impedance for sound in amedium or material
W Characteristic impedance w normalized bydividing by pc for air
X Imaginary part of specific impedance znormalized by dividing by pc for air
Y '\ Porosity of a material, ratio of volume of voidsto total volume
3z dyne sec/cm Specific impedance, acoustical impedance perunit area, p/u
zi dyne sec /cm Acoustical impedance
Z Normalized specific impedance, z/pc
a per cent Absorption coefficient at a surface, ratio ofenergy absorbed to incident energy
ON percent Absorption coefficient for sound at normalincidence at a surface
I/cm Phase shift in radians per unit length forsound in a medium or material, imaginarypart of propagation constant
xv

SYMBOLS (Continued)
Symbol Units Definition
r I/cm Propagation constant for sound in a material ormedium r = c + jp
S1/cm Attenuation constant in nepers per unit lengthfor sound in a medium or material, real partof propagation constant
cm Wavelength of aound, c/f
T 3. 1416
3P gram/cm Density
3pc dyne sec/cm Characteristic impedance of air
S1/sec Angular frequency 2wf
xvi

SECTION I
INTRODUCTION AND SUMMARY
The design of a wall and ceiling treatment for the ASD sonicfatigue facility (Ref. 1) involved not only rather severe acoustical require-ments but also the choice of material and supporting structures to satisfynon-acoustical requirements such as low cost, collapsibility, and durabilityunder extreme of temperature, humidity and sound pressure level. Thedesired acoustical characteristic was a normal incidence absorption greaterthan 96 percent for a frequency range between 20 and 10, 000 cps at soundpressure levels as high as 160 db. The maximum thickness of the treat-ment was six feet, which actually limited the lower frequency to about50 cps. The choice of materials and supporting structures involved ambientconditions with relative humidity close to 100 percent and temperature up to250 F (normal running conditions were estimated as 80 percent relativehumiditj and air temperature of 180 0 F), a total surface density less than10 lb/ft', the ability to collapse and store the treatment when the facility isused as a reverberant space, and durability of the treatment with respect todamage by normal handling and by the effects of the intense sound. The costof the treatment was also an important factor and required the use of com-mercially available materials of fairly low cost.
Layer type absorbing treatments were selected for measure-ment and study because preliminary calculations showed that such systemswould meet the acoustic and mechanical requirements and because, measure-ments of normal absorption over a wide frequency range are possible forsuch systems. Testing at high sound levels was also desirable because itwas believed that many of the acoustical properties of absorbing materialswould vary with sound level in the range above 130 to 140 db.
A high intensity test facility was developed which consisted ofthree impedance tubes with power sources capable of producing a 160 dbsound pressure level in a progressive plane wave in two 3-inch diametertubes between 50 and 2000 cps and in a 0.75-inch diameter tube from 1500to 7000 cps.
Measurements of DC flow resistance for large flow velocitieswere made on a large number of absorbing materials and the AC resistancewas measured for materials suitable for layer systems. The resistances ofall materials increased with increasing particle velocity in the range corres-ponding to particle velocities in plane progressive waves having soundpressure levels from 130 to 160 db.
Manuscript released by author 31 October 1962 for publication as an ASDTechnical Documentary Report.

Normal incidence absorption coefficients were measured fora number of layer systems by conventional impedance tube techniques,adapted for high intensities, to determine the number of layers, layerspacing, and layer resistance suitable for the proposed room treatment. Itwas found that the goal of 96 percent absorption could be attained overnearly all of the frequency range from 50 to 7000 cps with systems of fiveto seven layers with irregular spacings and with normalized resistances perlayer decreasing from values of about 0. 6 for layers near the hard end(corresponding to the room surfaces) to values about 0. 15 for layers at theincident sound side of the system. In spite of the fact that layer resistanceincreased with increasing particle velocity, it was found that variations inthe normal absorption coefficients of the layer systems were small formeasurements made at sound levels between 130 and 160 db.
Limited life tests at particle velocities corresponding to160 db sound levels eliminated many materials for this high intensity appli-cation. Etched polyurethane foam and fine mesh wire screens were notdamaged in this life test. This foam material, also called skeletal poly-urethane foam was chosen as the recommended layer material because of itslower cost compared to multiple wire screens.
Specifications for a recommended layer treatment are givenin Section VIII. This treatment consists of six layers of polyurethane foamsupported by open mesh wire screen with spacings between layers rangingfrom 7 to 17 inches. A description is also given for an alternate treatmentconsisting of five layers which is less expensive than the six layer treatmnentbut has a more irregular curve of absorption versus frequency. A suggestedmethod is also described for supporting the layers so that the treatment canbe collapsed into a relatively small volume for storage when the chamber isto be used for reverberant measurements.

SECTION II
CHOICE OF LAYER TYPE ABSORBING TREATMENT
Absorbing treatments for anechoic rooms for low intensitysound have generally used wedges of absorbing material (Ref. 2) (usuallymade of low density glass wool). This type of treatment has produced highabsorption at frequencies above the cut-off frequency at which the depth ofthe treatment is equal to one-fourth wavelength. To attain low frequencyabsorption the wedges are long and must be supported by wire mesh orother means. The absorption of a wedge can be measured at normal inci-dence in an impedance tube, but, since the tube must include the base ofthe wedge, measurements can only be made at low frequencies, below thatat which the tube cross section dimensions are less than a half wavelength.For a wedge with a one foot base the upper limit of measurement is about500 cps.
Anechoic treatments usi.ag layers of absorbing material havealso been built and performance tests have been reported by Bedel (Ref. 3).This treatment consisted of 16 layers of flannel and muslin, and absorptioncoefficients in the neighborhood of 98 percent were reported. The normalincidence absorption coefficient for this type of treatment can be measuredover a wide frequency range in impedance tubes, since the normal absorp-tion can be considered independent of area. The limitations on the crosssection of the impedance tube are thus removed, i.e., a small diameter ofimpedance tube can be used at the high frequencies.
The decision to develop a layer treatment rather than a wedgetreatment was made because of the following reasons:
(a) Measurement. As stated earlier, an upper limit onthe frequency of measurement (about 500 cps) exists for wedges and this isnot true for a layer treatment. It is also much more difficult to produce therequired high intensities (up to 160 db) in an impedance tube large enoughfor a wedge. Measurements at the intensities specified are consideredimportant because some acoustic properties of mraterials vary considerablyat particle velocities corresponding to sound pressure levels of 140 to160 db in a plane progressive sound wave.
(b) Collapsibility. One of the requirements for the treat-ment is the ability to be collapsed into a small volume when the ASD roomis to be used for reverberant measurements. A collapsible wedge treatmentwould require the use of hollow wedges which could be collapsed by meansof hinged members. In such a hollow wedge (Ref. 4), the absorbingmaterial is attached to flat perforated sheets which are hinged so that thebase width of the wedge can be shortened. Unless the absorbing material iscompressed considerably, the width of the base cannot be reduced more thana certain ratio, estimated at about one-third. For a layer type treatment,the ratio of the collapsed volume to the extended volume can be made at least
3

as small as one-fourth (see Section VIII for a possible method of collapsingand storing).
(c) Absorption at Non-normal Incidence. Although theabsorption of a solid wedge can only be measured accurately for normalincidence sound, wall treatments using solid wedges are effective at otherangles of incidence. Spaced layer treatments can be expected to havereduced absorption at certain frequencies and angles of incidence where thelayer spacing divided by the cosine of the angle of incidence (with respect tonormal incidence) is equal to n)k/2. Hollow wedges which are required fora collapsible treatment will exhibit similar wavelength effects especiallysince they must be mounted with their hinged ends parallel.
For a layer treatment this effect can be reduced by usingirregular layer spacing and low resistance for layers far from the wall. Itis therefore expected that a well designed layer treatment will be satisfac-tory with respect to absorption at non-normal angles of incidence.
4

SECTION III
LAYER SYSTEM DESIGN
In the design of a layer type absorbing treatment the variablesare number and spacing of layers and the acoustical impedance of each layer.The impedance of a thin layer can be considered as a lumped resistanceexcept at high frequencies. For the high intensity application, layer materialmust be chosen to have the correct acoustical resistance at high sound levelsand to be durable with respect to damage by sound and by handling duringcollapsing and storing. It must also be relatively unaffected by exposure tohigh humidity and temperatures between 00 and Z50 0F.
Although layer material qualities other than acoustical resis-tance are very important, the first steps in the design were consideration ofthe acoustical variables, with succeeding steps concerned with finding andtesting materials having the required acoustical and durability requirements.
NUMBER AND SPACING OF LAYERS
The number of layers must be large enough to prevent wave-length effects from causing low absorption at certain frequencies. Theabsorptive effect of a thin layer will be small when it is located at a pointwhere the sound particle velocity is small. A layer which is located at adistance of nX /2 from a reflecting wall is at a velocity node in the standingwave of normal incident and reflected sound and the layer has little effect onthe sound. For a small number of layers, there will be frequencies at whichone or more layers are near velocity nodes and a significant decrease inabsorptioa will result. A large number of layers can be located so that onlya small proportion of this number will be located near velocity nodes.
Although many layers have acoustical advantages, the numbermust be minimized because of cost of the layers and their supporting struc-ture, and the requirement that the treatment must be collapsed into a smallspace. Early in the program approximate calculations of the absorption oflayer treatments were made and it was found that six layers gave a fairlysmooth curve of absorption versus frequency. The method of calculation isdescribed in Appendix II. The calculated results were confirmed by experi-mental results described in Section V. Six layers seemed a practicalnumber from cost and mounting considerations and the dips in the absorptionversus frequency curve were acceptable. Tests on five layer systems gavenormal absorption curves which were nearly as satisfactory as those for sixlayer systems. Less than five layers would undoubtedly result in more anddeeper dips in the absorption vs. frequency curve and more than six wouldbecome more expensive and difficult to support in a collapsible treatment.
5

The spacing of the layers in a system should be irregular toavoid the wavelength effects mentioned above. For instance, an equal spacingof 12 inches for 6 layers in the 6-ft treatment cannot be used without havinglow absorption at frequencies at which n X /2 is 12 inches, 505, 1130 cps,etc. Small values of spacing cannot be used because of space requirementsfor mounting and collapsing. The minimum space between layers in thesystems described in Section V was 7 inches.
In the neighborhood of 47 cps where X. /4 is six feet, layersnear the wall are in the low particle velocity portions of the standing wavepattern and can be expected to have a smaller effect on the absorption thanlayers closer to the velocity maximum region. This reduction in effective-ness can be overcome to some extent by using layers with higher resistancenear the wall.
LAYER IMPEDANCE (RESISTANCE)
Layer impedance in this discussion is defined as the acousticimpedance per unit area measured at the surface of a layer which is backedby zero impedance. This backing condition is approximated for measure-ment purposes (see Section IV) by mounting the layer at a distance of onequarter wavelength or odd multiples of a quarter wavelength from a hard end.When the layer thickness is small compared to a wavelength, the real part ofthe impedance is much greater than the imaginary part and the impedance canbe considered to be a resistance. For layer thickness - of 1. 5 inch or lessthis approximation is good up to frequencies in the neighborhood of 1000 cpswhere X/) is about 0. 1.
In calculating the absorption of layer systems it is convenientto use the normalized resistance R which is the acoustic resistance perunit area r divided by pc, the characteristic impedance of air.
Calculations of the low frequency absorption characteristic ofa six layer system (see Appendix II) showed that values of R for the layersshould be in the range of about 0.05 to 0. 5. A number of absorbing materialswere then tested to find those with resistances in this range.
The materials which were tested are described in Table Iwhich gives available specifications, surface densities and values of DC andAC resistances at particle velocities corresponding to 140 db.
In many cases the material specifications are not complete butmore detailed specifications are given on those materials which are suitablefor high intensity layer systems. The test methods and results are dis-cussed in Section IV. Resistance to DC air flow is relatively simple tomeasure over a range of flow velocities and DC values give a fairly goodindication of the AC resistance measured in a sound field with the same RMSparticle velocity. The AC values, however, are approximately 1. 5 to. 2times the DC values. Both RAS and RDC increase with particle velocityin the range corresponding toI40 to 160 db pressure levels in a planeprogressive wave.
6

It was decided to design the layer treatment to meet thedesign goal of 96 percent normal incidence absorption coefficient at anintensity level of about 140 db. Although some areas of the ultimate treat-ment close to the. siren sound sources may be exposed to 160 db sound, thegreater part of the treatment vill be at much lower levels. The calculatedabsorption values, however, did not vary materially for a range of acousticresistance corresponding to a considerable range of intensity and this wasconfirmed by acoustic tube measurements of layer system at 130 to 160 dbsound pressure levels. It is expected, therefore, that the 96 percent goalcan be met for a wide range of sound intensity.
Layer systems with various combinations of layer spacingand resistance were measured in the impedance tubes. These tests,described in Section V, led to a preferred design from an acoustic stand-point. The choice of layer material is discussed in the following paragraphs.
LAYER SUPPORT
The materials to be used as layers have in general a lowsurface density and can be expected to vibrate under the influence of thesound pressure. This tends to change the layer impedance by decreasingthe resistance and producing a mass reactance term that is appreciable atfrequencies below 100 cps as outlined in Appendix II. It was difficult tocheck the magnitude of this effect in the impedance tube tests because thesamples are only 3 inches in diameter and are clamped at their circum-ferences. The change in layer impedance can be calculated, however, forlarge areas exposed to sound at normal incidence. Calculated absorptioncoefficients for the preferred system are shown in Table II for a range oflayer surface densities. Infinite surface density corresponds to nq. motionof the layers. It is seen that, above a surface density of 0. 3 lb/ft", theeffect of layer vibration is small. This can be attained by enclosing thelight weight layer material between wire screens with an open area suffi-ciently large to have a negligible effect on the layer resistance. Suchscreens can form part of the layer supporting structure. Detailed design ofthe mechanical supports for the layer material was not in the scope of thisproject but a suggested method is described in Section VIII.
DURABILITY OF LAYER MATERIAL
The testing of layer material for durability under the action ofintense sound requires accelerated life tests. Since the durability dependson the layer supporting structure as well as the properties of the material, afairly large area of material should be tested under the same conditions ofsupport as are to be used in the final installation.
7

Limited life tests on 3-inch diameter samples of layermaterial were made in the low frequency impedance tube and the test condi-tions and results are given in Section VI. The polyurethane materialrecommended in Section VIII withstood these tests without apparent damage,but some of the other materials failed after relatively short exposure to highintensity sound.
Accelerated life tests on a four by four foot specimen of layermaterial were made at 165 to 170 db in the discrete frequency, high inten-sity siren facility at North American Aviation, Columbus, Ohio. The poly-urethane material showed only slight damage in a 105 hour exposure.
The material also performed satisfactorily in miscellaneoustests described in Section VII involving the effects of temperature, waterabsorption, etc.
8

SECTION IV
MEASUREMENT OF ACOUSTIC RESISTANCE
The acoustic impedance of a thin layer of material is definedas the ratio of the acoustic pressure at the surface to the volume velocity ofair through the surface. As explained in Appendix II, the impedance of amaterial with zero impedance backing can be expressed as a function of thecharacteristic impedance, the propagation constant and the thickness. Whenthe thickness is a small part of a wavelength (at low frequencies), theimpedance is essentially a real quantity and can be considered as a lumpedresistance. The resistance per unit area, r, often called the specificresistance, is the pressure divided by the linear or particle velocity. Asmentioned previously, it is convenient to use the normalized specific resist-ance, R, which is r/pc where pc is 41.5 cgs units, the characteris-tic impedance of air. This definition of acoustic resistance can be extendedto zero frequency or DC flow and this is termed R DC to distinguish valuesmeasured by DC air flow from RAC values measured in a sound field.
DC RESISTANCE TESTS
The flow measuring facility described in Appendix I wasrelatively simple to operate, and measurements over a range of air flowvelocities were made on a large number of materials which are describedin Table I. This was done in order to select materials for layer systemtests. The results are shown in Fig. I (a) to (k). The normalized flowresistance R is plotted against linear flow velocity. Use of a loga-rithmic scale'oir flow velocity allows the rate of change of resistance to becompared for materials having different resistances. The sound pressurelevel scale at the top of the scale represents the pressure levels of a planeprogressive sound wave having RMS particle velocities equal to the flowvelocities on the bottom scale. This relationship is shown in Fig. 2.
In general the resistance of a layer of material increasedwith flow velocity, Since the rate of increase varied considerably for dif-ferent materials in the range of interest, 15 to 500 cm/sec correspondingto 130 to 160 db, no effort was made to fit a theoretical curve to the data.This could have been done by using an approximate relation (Ref. 5)between the resistance R and the flow velocity
R = Ro (l + U/u (I
where uc is the critical velocity at which R is twice the value of Rot theresistance at low flow velocity.
9

As mentioned previously a considerable variation of resist-ance can be tolerated in the design of a layer system and materials must beselected for their durability rather than for precise resistance values atdifferent sound levels.
Comparing the slopes of the resistance curves for differenttypes of material shows that Fiberglas and glass wool in Figs. 1(c), l(d),and l(e) have a low slope in the region of interest and that wire screens inFigs. l(f), l(g) and 1(h) have slightly higher slopes. The slopes for poly-urethane materials in Figs. l(a) and l(b) are greater than those for thewire screens and the slopes for woven glass cloth in Figs. 1(i), 1J), and1(k) are even greater.
Figure 1(h), showing the resistance of 1, 2, 3 and 4 layersof wire screen, is included to show that the resistance per screen is roughlyconstant so that desired resistance values can be obtained by multiple layersof screens. The tests also showed that the resistance was approximatelyproportional to thickness for the etched polyurethane foam material.
From the curves of Fig. 1, DC resistance values at the flowvelocity corresponding to the particle velocity in a progressive plane wavewith a sound pressure level of 140 db were obtained and listed in Table I.This tabulation enabled appropriate materials to be chosen for the tests onvarious layer systems.
AC RESISTANCE TESTS
The AC impedance per unit area of a thin layer of materialwas defined as the ratio of the sound pressure to the particle velocity at thesurface of the material with zero impedance backing. At high intensitiesthere are non-linear effects, since this ratio is not independent of particlevelocity. An "average" impedance, however, was measured in theimpedance tube at a particular frequency by filtering out the harmonics inthe measured sound pressure. For convenience, this impedance is normal-ized by dividing by pc (41. 5 cgs units), the characteristic impedance ofair.
To obtain zero impedance backing for a test sample, it wasmounted at the end of the impedance tube and a hard end was located in thesample holder at a distance from the sample equal to an odd multiple of aquarter wavelength for the test frequency. At the sample location, there isa velocity maximum (pressure minimum) in the standing wave pattern andthus the impedance is small. With no sample, the measured impedance atthis point was less than about 0.02 and was essentially real. With a samplein position, the imaginary part of the measured impedance was also verysmall for the thin samples tested and for frequencies below about 1500 cps.The real part of the measured impedance was taken as the AC resistanceof the sample.
10
Tests were made over a range of particle velocities. It canbe shown that the particle velocity at the velocity maximum is the same asthe particle velocity in a progressive plane wave having the same pressurelevel as that measured at a pressure maximum in the standing wave pattern.The sound levels for the test results thus correspond to the pressure levelsin a progressive plane wave having the specified test velocities at thesample.
Two spacings between sample and hard end were used, 67.8inches for tests in the low frequency impedance tube at S0, 150 and 250 cpsand 11. 3 inches for tests in the medium frequency tube at 300, 900 and1500 cps.
Five materials were tested, etched polyurethane foam No. 3and No. 4, 100 mesh wire screen No. 5A, and glass cloth No. IA andNo. 4A. The results are shown in Fig. 3. DC resistance curves takenfrom Fig. I (shown as dashed lines) are included for comparison. Ingeneral -AC is greater than RDC and increases similarly with particlevelocity.
Figures 3(a), 3(b) and 3(c) show the effect on RAC causedby vibration of the test samples. As explained in Appendix II, the vibrationof a light weight layer caused by the sound tends to reduce the AC resistanceof the layer at low frequencies. The open symbols of Fig. 3(a) and 3(b)represent RAG for a 3 inch diameter sample of polyurethane No. 3clamped lightly at its circumference while the solid symbols represent RACfor a sample supported on each side by two 20 mesh screens. While theeffect of supporting screens can be attributed to an increase in surfacedensity for large areas of material, the effect for the 3 inch diameterclamped samples in the impedance tube is complicated by resonant vibrationAf the samples. For example, in Figs. 3(a) and 3(b) the screens increased
AC for the polyurethane by a relatively small amount at 50 and 150 cpsbut the increase was larger at ZS0 and 300 cps. In Fig. 3(c), the solidsymbols represent RAC for polyurethane No. 4 weighted by two discs of1/4 inch mesh hardware cloth with diameters of about 2. 5 inches.
When a sample was mounted at the end of the low frequencyimpedance tube so that its motion could be seen, considerable motion wasobserved and the displacement amplitude was a non-linear function of soundpressure level measured at a pressure maximum point in the impedance tube.The displacement at 100 cps increased rapidly with small increases in soundpressure at levels above 150 db. These non-linear effects are probably thereason for the different shape of the 150 cps curve in Fig. 3(a).
Although the tests on small unsupported samples in theimpiedance tubes were affected by sample vibration at low frequencies, valuesof 'AG for samples supported by screens are fairly representative of theperformance of large areas of material with surface densities great enoughto minimize vibration. The results show that
11

(1) RAC increases with sound intensity at nearly
the same rate as RDC.
(2) R AC varies with frequency but a meaningful
average value can be assigned for frequenciesbetween 50 and 1500 cps.
(3) The ratio RAn/RDC varies with material,from values in the neighborhood of 1. 5 foretched polyurethane foam to values about 2for wire screens and glass fiber cloth.
12

SECTION V
ABSORPTION OF LAYER SYSTEMS
NORMAL ABSORPTION COEFFICIENTS
The layer systems which were tested are described inTable EI. It lists spacings of the layers, their thickness, surface density,the type of material in each layer, and the approximate DC and ACresistances at a particle velocity corresponding to 140 db. In this table,etched polyurethane foam material is abbreviated as PU and glass woolmaterial as GW. More detailed information on layer material is given inTable I. The layers are numbered I - 6 with layer No. 1, the layer nextto the hard end which simulates the wall or ceiling in the room treatment.
Most of the measurements in the impedance tubes were madeon six layer systems since calculations had indicated that systems withfewer layers could be expected to have more irregularities in the absorptionversus frequency curve. More than six layers would result in higher cost.Some tests were made later on five layer systems and one test on a sevenlayer system. Each layer system was assembled in the sample holder andmeasured in the impedance tubes to obtain standing wave ratios from whichnormal incidence absorption was calculated at each frequency. The resultsare given in Fig. 4 as curves of absorption coefficient versus frequency atvarious sound pressure levels.
Although measurements in the impedance tubes included thelocation of minima in the standing wave pattern from which the impedance ofthe layer system was calculated, the impedance is not given in the report.In general, the frequency regions where the absorption was low were charac-terized by an increase in the reactive part of the impedance.
Systems Nos. I and 2 were tested to check the performanceof systems with tapered spacings and constant resistance per layer againstvalues which had been calculated (see Appendix H). The curves of Fig. 4(a)and (b) for these systems show fairly high values of absorption below about300 cps but were irregular at higher frequencies. System No. 2 was themirror image of System No. 1 and had less irregularity at the higher fre-quencies. Because the irregularities in the curves produced undesirableabsorption characteristics, measurements were not extended to frequenciesabove 2000 cps. The curves shown in Fig. 4(a) and (b) represent valuesmeasured at a sound pressure level of 140 db except for frequencies below50 cps. Measurements were also made at 130, 150 and 160 db at a numberof frequencies. The results (not shown for this system) indicated that theabsorption was not greatly affected by sound intensity.
13

In system No. 3, the resistance per layer was "tapered" inthree steps from higher values for layers I and 2 close to the hard end tolower values for layers 5 and 6. The spacing was the same as that forsystem No. 1. The tapered resistance improved the absorption curve com-pared to the curve for system No. 1 and, between 60 cps and 4500 cps,there was only one dip in the curve (at 475 cps) where the absorption wasbelow the 96 percent criteria. Absorption measurements made on thissystem at different sound levels are shown in Fig. 4(d). The solid line wastaken from the 140 db values of Fig. 4(c) and values for other sound levelsare rather close to this line. Although the resistance of the layer materialvaries with sound level as was shown in Figs. 3(a), (b), and (c), there waslittle difference in measured absorption of the system. The fact that theabsorption of this and other layer systems was not greatly affected bymoderate changes in layer resistance is important because 1). the final roomtreatment will be effective over a range of sound pressure levels and2) specifications for the resistance of materials in the final room treatmentcan be written with a reasonable tolerance for variations in this characteristic.
In system No. 4 the tapered spacing of system No. 3 wasreversed so that the larger spacings were near the hard end. The absorptioncurve shown in Fig. 4(e) was also quite satisfactory. The absorption at150 db is seen to be nearly the same as at 140 db.
In constructing a layer system for the r oom treatment, equalor nearly equal spacing would have advantages. System No. 5 having equalspacing of layers (12", 12", etc.) and system No. 6 having nearly equalspacing (14", 10", 14", etc.) were, therefore, measured to determine themagnitude of the dips in the absorption curve for frequencies at which layerspacing is approximately a whole number of half wave lengths. The curves ofFig. 4(f) for equal spacing have very low absorption at 525 cps and 1050 cps.For Fig. 4 (g) with nearly equal spacing, measurements were made only inthe medium frequency tube. The data are plotted as circles to be comparedwith the curve from Fig. 4(f) for equal spacing. The minimum at 525 cps was81 percent for nearly equal spacing compared to 73 percent for equal spacingand the minimum at 1050 cps was nearly eliminated by the variation inspacing. The absorption curve for the nearly equal spacing is considered tobe definitely inferior to the curves for layer systems with considerable varia-tion in spacing.
There are advantages in the cost of layer systems having thesame material and thickness per layer. Tests were therefore made on systemshaving equal resistance per layer and with the spacings of system No. 3. Theresults for three systems, No. 7 with R- = 0. 16, No. 1 with RDC = 0. 37,and No. 8 with RnDC = 0.7 are shown in'Figs. 4(h), 4(i) and 4(j) as circlesjoined by solid lin-i for comparison with the dashed line curve of system No. 3which had tapered resistance. The measurements were confined to the fre-quency range of the medium frequency tube since this range provided adequatecomparison of irregularities in the absorption curves. In all cases the absorp-tion curves of systems with equal resistance per layer were more irregularthan the curve for the system with tapered resistance. In the limited frequencyrange of the tests, the irregularities in the curve make it difficult to determinethe best resistance per layer for such systems.
14

In Fig. 4(k) results are shown for system No. 9 which hastapered resistance as in system No. 3 but has a measure of randomness inlayer spacing. The curve, however, was not much better than that ofsystem No. 3.
Layer system No. 10 had tapered resistance per layer and a"random" spacing differing from system No. 9. An absorption curve forthis system, Fig. 4(t), was made for the extended frequency range. Thiscurve exceeds the 96 percent criterion over nearly the whole frequency range.
In tests on layer systems in the 3 inch impedance tubes, eachlayer consisted of a 3. 5 inch diameter disc clamped between spacers, 3 inchI.D. and 3.5 inch O D. (see Fig. 16, Drawing of Sample Holders). Withthis boundary condition, vibration of a layer due to the sound field is quitedifferent from the vibration of an equivalent area of material in the system tobe used as a room treatment. The vibration of a layer with low surfacedensity causes a change in layer impedance at low frequencies and this willaffect the absorption of the system as explained in Section III and Appendix II.In the recommended treatment it is planned to support the layers betweenwire screens partly because the increase in surface density is desirableacoustically (especially for large areas of treatment) and partly because suchsupport is desirable mechanically. It was decided to make tests on the systemNo. 10 with layers weighted with wire screens so that the surface density wasin the same range as that for layers in the recommended treatment.
Discs of 1/4 inch mesh hardware cloth were attached on eachside of each layer of systemn No. 11 by sewing through the layer material withthread. The 2. 5 inch diameter of the screen discs was small enough toprevent contact with the clamping spacers so that they provided mass loadingwith little stiffening effect on the layers. Although the experimental systemwith weighted layers still did not simulate a system with large areas ofmaterial, the weighting reduced the resonant frequencies of the layers com-pared to the layers of system No. 10 and extended the lower limit of the fre-quency range where layer motion can be considered insignificant.
The results of tests on system No. 11 are shown in Fig. 4(m).Measurements were not made in the high frequency impedance tube sinceweighting of the 0.76 inch diameter samples would have been difficult andbecause weighting effects are small at high frequencies. Comparing theabsorption curve for system No. 11 with that of system No. 10 with unweightedlayers, it is seen that the curves are nearly alike except at frequencies near700 cps. Although resonance effects in the weighted and unweighted layersmust have been quite different, there was little difference in the measuredabsorption of the system. It is concluded that layer vibration had little effecton the measured absorption of these two systems in the impedance tube.
15

Subsequent to the development of the layer system discussedpreviously, it was reported that mechanisms for collapsing the ceiling treat-ment would require a clear space of two to three feet between the ceiling andthe first layer. Information that this space (which is larger than that pre-viously used) was not required was not received until the end of the programand tests were made on the remaining systems with layer no. 1 spaced 20 or30 inches from the hard end.
Systems No's. 14 and 15 were six layer systems with randomspacings and had a 30 inch space between layer no. 1 and the hard end. Thetest results shown in Figs. 4(n) and 4(o), were satisfactory, in that thenormal absorption was above 96 percent except for narrow dips near 600 and700 cps. The overall thicknesses of these systems was seven feet. This isgreater than the six foot requirement but the extra thickness was not con-sidered to be a serious handicap for the ceiling treatment. With six layersin a 42 inch space (72 - 30 inches) and a minimum clear space betweenlayers of six to seven inches, it is difficult to obtain sufficient irregularity inspacing.
A number of five layer systems were designed and tested todetermine whether they would be significantly inferior to the six layer systems.In systems No's. 16 to 19, inclusive, the resistance per layer was tapered inthe same way as system No. 11 but the high resistance layer no. I wasomitted. Systems No's 16 and 17 with 30 inch spacings to the hard end shownin Figs. 4(p) and 4(q) were inferior to the better six layer systems, althoughsystem No. 17 was close to the 96 percent criterion except for a deep dip(81 percent) at 700 cps. Systems No's. 18 and 19 with 20 inch spacing to thehard end shown in Figs. 4(r) and 4(s) were also inferior.
It was decided to retain the high resistances of layers I and 2and reduce or change the taper of the resistances in layers 4 and 5. SystemNo. 20 with only one layer, no. 5, with Rnr. equal to 0.07 gave the fairlysatisfactory absorption curve shown in Fig N(t). System No. 21, with aless abrupt change in resistance between layers no's. 4, 5, and 6, gave
r esults shown in Fig. 4(u). Both of these systems had a 30 inch space betweenlayer no. I and the hard end. Systems No's. 22 and 23 had hard end spacingsof 20 inches. System No. 23 had tapered resistances as in systems No's. 20and 21 but system No. 22 had a lower resistance for layer no. 2. Curves ofabsorption in Figs. 4(v) and 4(w) showed that system No. 22 was better thansystem No. 23 and was comparable with system No. 21.
Absorption curves for the five layer systems had more irregu-larities and deeper dips than the curves for six layer systems (compare Figs.4(u) and 4(v) for five layer systems with Figs. 4(n) and 4(o) for six layersystems). A six layer treatmert was therefore recommended although a fivelayer treatment was given as an alternate choice because of its lower cost.
16

Since the absorption of six layer systems was quite satisfac-tory, only a few tests were made on seven layer systems. Figure 4(x) showsthese absorption curves for a seven layer system, No. 24. It is seen thatthis curve is smoother, except for the dip at 800 cps, than the curve for therecommended six layer system No. 11 shown in Fig. 4(m). The dip at800 cps could probably have been avoided by a change in layer spacing, but itwas decided that the improvement in absorption for a seven layer systemcompared to a six layer system was not worth the cost and mounting difficul-ties associated with the extra layer.
RANDOM ABSORPTION COEFFICIENTS
Previous measurements on layer systems were confined tonormal incidence absorption coefficients. Wall and ceiling treatments in theASD room will be exposed, however, to sound at various angles of incidenceand there was a question whether wave length effects would decrease theabsorption for certain frequencies and angles of incidence. Although thiseffect was not considered to be large because of the random spacing of thelayers and the "tapering" of the resistance per layer, it was desirable tomeasure its magnitude. There are, however, many experimental difficultiesin measuring absorption at a surface as a function of angle although thismight be done more easily for the large surfaces in the completed ASD room.It was, therefore, planned as part of the supplemental agreement to measurerandom incidence coefficients for a section of a layer system in the reverber-ation room at the Riverbank Acoustical Laboratories. In a random field,sound energy is directed at a surface equally from all directions and lowabsorption at certain angles would tend to produce low random absorptioncoefficients. The test also provided experimental data on a fairly large areaof a layer system with supports (wire screens) similar to those of thereconmmended treatment. Thus, data on the 3 inch diameter areas previouslymeasured could be checked.
The specimen tested was 62 by 76 inches in cross section andconsisted of the polyurethane foam layers and spacings of system No. 11.Each layer of polyurethane foam was mounted between wire screens whichwere clamped at their edges in wood frames. The wood frames were mountedin a box of 3/4 inch plywood 69 by 83 inches in cross section and 6 ft. longwith layer No. 6 located at the open end. The box was mounted in an openingin the reverberation room wall so that layer No. 6 was part of the wall andwas exposed to the random sound field.
Conventional tests of absorption at Riverbank are made on8 by 9 ft. samples at frequencies of 125, 250, 500, 1000, 2000 and 4000 cpswhich are warbled ± 20 cps five times per second. The time for a 40 dbdecay of sound is measured in the room first with and then without the sampleby two separate microphone systems and the absorption is calculated fromthe difference in decay rate caused by the absorption of the sample. There isa statistical variation in the measured times so that 50 to 100 readings aretaken for each decay time.
17

The layer system sample was measured in the conventionalway and additional measurements were made at intermediate frequencieswith a single microphone system and adjustable filters. There was time tomake only 20 to 40 readings for each room condition at these intermediatefrequencies and the absorption coefficients are therefore not as accurate asthose for the conventional frequencies.
The results are shown in Fig. 5 plotted on the same scaleas the results of normal incidence measurements. This scale, however,exaggerates the accuracy of the data as is explained below. In the interpre-tation of the curve, comments should be made not only on the accuracy ofthe coefficients but also on the coefficients which exceeded 100 percent. Asexplained previously, values at the usual frequencies of 125, 250, 500,1000, 2000 and 4000 cps have less measurement error than those at inter-mediate frequencies, but error was introduced in all measurements by thesmall size of the absorbing specimen, approximately 33 sq. ft. compared to72 sq. ft. for a conventional test specimen. For example, the absorptionof the room without the test specimen is about 125 sabins at 500 cps andthe room with the sample (assuming 100 percent absorption) would be 158sabins. The accuracy of the specimen absorption, therefore, depends onsmall differences between large quantities. The measurements at 100, 125and 150 cps have further sources of error since they were near the frequencyrange where a room of this size does not have a random sound field.
With regard to absorption coefficients over 100 percent, suchvalues are commonly measured in reverberation tests on highly absorbents amples of small size. Due to diffusion at the edges of an absorbing arealocated at a reflecting surface, the effective area of the sample may exceedthe actual area. Thus, the sample of 33 sq. ft. might have an effective areaof 40 sq. ft. and result in a measured absorption of about 40 sabins giving anabsorption coefficient of 120 percent.
Corrections for this edge effect have not been agreed upon byvarious laboratories because the theory has not been satisfactorily worked out.Some laboratories routinely reduce all values above 100 percent to 99 percent.In others, corrections are applied depending on the magnitude of the measuredabsorption and the frequency and are based on tests on large areas of material.
With these qualifications in mind, the following conclusions aredrawn from the data of Fig. S.
1. The 33 sq. ft. area of layer system No. II hadrandom absorption coefficients greater than 96 per-cent over most of the frequency range between 200and 4000 cps. The data thus substantiates themeasurements of normal absorption coefficientsmade on the 3 inch diameter areas.
18

2. The low values at 100 and 125 cps probably arethe result of measurement error.
3. Wave length effects leading to low absorption werenot of sufficient magnitude to be detected exceptperhaps at the narrow dip at 860 cps.
4. The width of this dip is small so that it should notinterfere seriously with tests in the ASD facility.
19

SECTION VI
FATIGUE TESTS ON LAYER MATERIALS
The durability of a layer treatment depends on the supportingstructure for the absorbing layers as well as the layer materials. Testsshould therefore be made on layers large enough in area to simulate typesof layer supports to be used in the final installation. Since extended lifetests are expensive and time consuming, it was decided to select materialson the basis of small area tests of relatively short duration made in theimpedance tube facility. Larger specimens of material which withstoodexposure to 160 db sound in the impedance tube could then be exposed forextended periods at higher sound levels.
LIMITED LIFE TESTS
The limited life tests on small areas consisted of exposure of3 inch diameter samples of material to particle velocities equal to thevelocities that would occur in a progressive plane wave at 160 db. Thesamples were mounted as in the AC resistance tests at a distance equal toone quarter wave length from a hard end. The test frequency was 100 cpsand the spacing from the hard end was 33.8 inches. This frequency waschosen because adequate power was available from the sound sources with-out danger of failure and because the displacement amplitude of vibrationwas over 0. 5 inches for etched polyurethane foam no. 3 (without wire screensupports), one of the materials recommended in the preferred layer system.It is believed that such large displacements of an unsupported layer wouldprovide an accelerated life test, since considerably smaller displacementsare expected for supported layers.
Failure occurred for two materials during routine impedancetube tests for the measurement of acoustic resistance or layer system absorp-tion. Fiberglas PF 334, used in systems No. I and No. 2, failed duringsystem absorption tests at low frequencies. The material of layer No. 6(see Fig. 4) was torn as is shown in Fig. 6(a) and fibers were observed on theinside surfaces of the impedance tube and sample holder close to this layer.The failure of this type of material after relatively short exposure is considereda sufficient reason for eliminating low density glass fiber materials at least inthe layers exposed to high sound intensities. No changes in this material wereobserved, however, which could be attributed to high temperatures.
20

A sample of Fibermetal failed during AC resistance tests at50 cps. The damage can be seen in Fig. 6(b). Although this material canbe made with various sizes of fiber and sintering conditions, it is not con-sidered suitable because the low flow resistance specifications for layertreatments require a low density and thickness and, therefore, a low strengthfor the material.
A sample of etched polyurethane foam, material no. 3, wasrun in the limited life test setup at 100 cps and 160 db for three hours with-out any damage which could be observed visually. This sample had previouslybeen exposed to 157 db at 50 cps for three hours. Another sample of thismaterial was exposed for three hours to 160 db at 100 cps and the DC flowresistance was measured before and after the test. There was no change inmeasured flow resistance within the 1 to 2 percent accuracy limitations of themeasurement.
Two samples of glass cloth material no. 8 were tested. Thefirst sample showed a shifting of the strands toward the center of the disc andconsiderable fuzzing of the fine fibers in the strands in the exposed area.This occurred in the first two minutes of the 10-minute test. A second sam-ple was exposed for an hour without tearing or breaking and the amount offuzzing did not increase noticeably after the first ten minutes. The displace-ment amplitude of vibration was about 0. 5 inches. A photograph of thissample is shown in Fig. 6(c). It is reasonable to eliminate this type ofmaterial in designing high intensity layer treatment on the basis of the rapidchanges which occurred in the test.
A limited life test was made on a sample of 100 mesh wirescreen material no. 5 clamped at the end of the low frequency tube in thesame way as the woven glass cloth. No damage could be seen at the end of atwo hour exposure to 160 db at 100 cps.
No effects which could be attributed to a temperature rise dueto the sound were observed in the limited life tests or in other tests at soundlevels up to 160 db. Damage due to temperature in a layer system probablyis greatly reduced by the fact that only part of the incident sound energy isconverted to heat in each layer. The lower resistance of layers 5 and 6 tendbto reduce the energy absorption in these layers.
EXTENDED LIFE TESTS
A sonic fatigue test was made in the discrete frequency highintensity siren facility of North American Aviation, Inc., Columbus, Ohio ona four by four foot test specimen of 1/2 inch etched polyurethane foam materialno. 3, 60 pores per inch, mounted between 2 mesh stainless steel wirescreens. A reproducible copy of the report on this test prepared by NorthAmerican Aviation has been submitted to the sponsor.
21

The test specimen was mounted in a square aluminum framewhich clamped the edges of the wire screens enclosing the foam materialand which was bolted to the siren facility. Figure 7 shows details of themounting frame and Fig. 8 is a photograph of the specimen installed in thesiren facility.
The screens, which were approximately 56 by 56 inches insize, were clamped between the 1/2 inch outer members and the 3/8 inchspacer member. The foam material, 48 by 48 inches in size and 1/2 inchthick, was compressed by the screen to a thickness of 3/8 inch at itsperipheral edges. The foam material was in three pieces, one 4 by 2 feetfor the upstream half with the four foot edge vertical and two 2 by 2 footpieces for the downstream half. The screens were laced together at eightplaces along the junctions of the foam pieces and at the center of one of the2 by 2 foot pieces as is shown in Figs. 8 and 10. The circles in Fig. 10represent bolts through thin dished washers, 1 inch in diameter and theshort diagonal lines represent wire lacings.
One side cf the specimen formed part of the wall of therectangular exhaust passageway of the siren with theupstream edge 16 inchesfrom the siren horn assembly and the other side of the specimen was enclosedby aluminum close out plates approximately 4 inches from the foam material.
Three test frequencies were chosen to correspond with peaksin the acceleration versus frequency curves taken at 160 db sound pressurelevel. The four accelerometers were mounted at (1) top center, (2) middleof downstream top quarter, (3) middle of panel, and (4) middle of down-stream half. Gulton Industries Model A322 accelerometers were used andthey were cemented to the wire screens during this part of the test. Althoughthe acceleration amplitude varied with location of accelerometer the curve ofFig. 9 is fairly typical with regard to variations with frequency. Test fre-quencies of 140, 365 and 625 cps were chosen to correspond with peaks inthe curves. A 35 hour life test was run at each frequency and inspections ofthe specimen were made at one hour intervals during the first three hours ofa test and at four hour intervals thereafter. Sound pressure levels weremonitored by three microphones in the siren air streams along the horizontalcenter line of the specimen, one being near the upstream edge of the specimen,one at the center and the third near the downstream edge. A fourth micro-phone was used to monitor the sound pressure level at the center of thespecimen near its outside surface during periods when the microphones in theexhaust air stream were fouled by water, oil, etc.
In Test No. 1 at 142 cps, the sound pressure levels were166 db upstream, 164 db center, and 167 db downstream. No damage wasobserved during the 35 hour test, other than the loss of a lacing bolt which wasreplaced. At 23 hours, a malfunction of the siren lubrication system causedoil to be sprayed on the specimen and at 35 hours it became oil soaked.
22

In Test No. 2 at 365 cps, the sound pressure levels were166 db upstream, 167 to 169 db center and 163 downstream with the higherlevels corresponding to the period between 21 and 35 hours. At the end of2. 5 hours, the siren air drying system failed and the specimen was sprayedwith water and ethylene glycol in addition to the oil spray mentioned pre-viously. It was decided to continue with the now thoroughly soaked specimenand the test was resumed after mopping out the siren exhaust passage.Following this, the oil spray was reduced to a minimum. There was nodamage to the specimen during this 35 hours test except for the loss of lacingbolts which were replaced by bolts with lock type star washers.
In Test No. 3, there were numerous siren breakdowns in thefirst three hours of operating time at 625 cps and in the remaining period afrequency of 640 cps was used. Sound pressure levels were 168 db upstream,167 db center and 158 db downstream. At the end of 8 hours, breaks in thescreen wires were observed and "square pattern" cutting of the polyurethane.The specimen was dismantled and 48 breaks were observed in the insidescreen (toward the exhaust passage) and 31 breaks in the -utside screen.There were many breaks at and close to the clamping edges and breaks alonga horizontal line a few inches above the center line of the specimen. Thelocations of the breaks in the wire screen are shown in Fig. 10. The damageto the polyurethane consisted of slightly ragged cuts where it was in contactwith the screen and extended from 2 inches to 8 inches from the upstreamedge of the specimen. These "square pattern" cuts were deepest (about1/16 inch) near the upstream edge.
New screens were installed but the same polyurethane foammaterial was used in the remainder of the test, 27 hours. The contactpattern of the new screens on the polyurethane was slightly displaced fromthe pattern of the old screens. There was no indication of damage to thewire screens during the remaining 27 hours of the test and the damage to thepolyurethane material consisted of square pattern marks or very shallow cutsnear the upstream edge.
Tentative conclusions from the accelerated life tests are thatthe screen failure was mainly the result of the 78 hour cumulative time ofexposure rather than the 8 hours exposure in Test No. 3. Although Test No.3 at 625 cps may have been more severe, the new screens were not damagedby 27 hours of exposure at this frequency. Although the damage to the poly-urethane material was not observed until 78 hours of exposure, it probablyoccurred earlier. It may not have been noticed because the cuts were hiddenby the wires. This type of damage was very small in the final 27 hours ofexposure in Test No. 3. In general, the specimen stood up very well underadverse conditions of oil and water soaking in that major damage to thescreens did not occur until about 78 hours of exposure; the damage to thepolyurethane foam was small for this exposure time. It is understood thatfurther accelerated life tests may be made at ASD after analysis of the speci-mens used in the North American tests. A cheaper screen material can possi-bly be used on the basis of such tests.
23

SECTION VII
MISCELLANEOUS TESTS ON POLYURETHANE FOAM
A series of tests was made to determine characteristics andperformance of etched polyurethane foam, 60 pores per inch, with relationto the effects of vibration, high humidity and temperature. The results oftests on 1/2 inch thick samples of material are summarized below.
Exposure to a sound pressure level of 160 db at 100 cps forthree hours at vibration amplitudes of about 1/2 inch caused no measurablechange in DC flow resistance.
Three cycles of exposure to a temperature of 40°F and thento 100 0 F with a relative humidity exceeding 90 percent caused a negligibleincrease in sample weight (less than one percent). This showed that con-densation of water vapor in the pores of the material was very small underthese conditions.
Soaking in a 10 percent solution of acetic acid for five hourscaused a weight loss of less than five percent (acetic acid is reported to bean agent for etching this material).
When a rectangular piece of the foam material was soaked inwater and was then held with a half inch edge horizontal, the water drainedout rapidly except for an area close to the bottom edge. Rotating the pieceabout a horizontal axis caused much of this remaining water to drip out ofthe corner. With this type of drainage, water will be retained in the layermaterial only near a horizontal edge. It will, therefore, be desirable toavoid cemented butt Joints which will be horizontal in the installed layers.
Temperature effects on the foam material have been thecause of some concern. The melting point is about 475OF and the manufac-turer recommends use up to 250 0 F. The material has been used, however,in commercial applications for long periods at 375 0 F. A sample of materialexposed in an oven for three hours at 2500 showed no measurable change inweight or DC flow resistance.
The tests described above indicate that damage to the poly-urethane foam would not be caused by ambient conditions in the roominvolving maximum temperatures of 2500 F and maximum relative humidityup to 100 percent. Temperatures in the material which are higher thanambient room temperature are expected, however, because of the conversionof acoustical energy into heat. Portions of the treatment located neai thesirens will be exposed to an acoustic intensity of about one watt / cm (for aplane progressive wave with a 160 db sound pressure level).
24
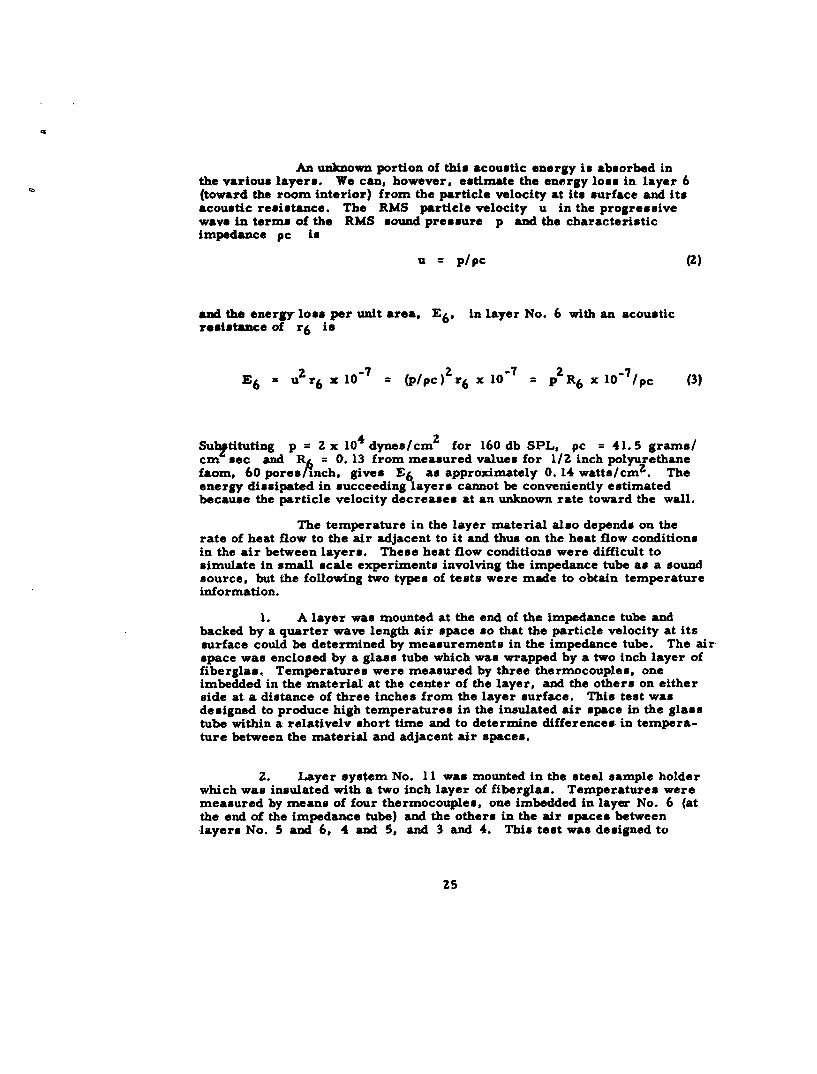
An unknown portion of this acoustic energy is absorbed inthe various layers. We can, however, estimate the energy loss in layer 6(toward the room interior) from the particle velocity at its surface and itsacoustic resistance. The RMS particle velocity u in the progressivewave in terms of the RMS sound pressure p and the characteristicimpedance pc is
u = p/pc (2)
and the energy loss per unit area, E6, in layer No. 6 with an acousticresistance of r 6 is
E 6 = uZr 6 x 107 = (p/pc)2 r 6 x" 0-7 = pZ R 6 x 10"7 /pc (3)
Substituting p = 2 x 10⁴ dynes/cm 2 for 160 db SPL, pc = 41.5 grams/cm sec and R = 0. 13 from measured values for 1/2 inch polyurethanefaom, 60 poresAnch, gives E 6 as approximately 0. 14 watts/cm . Theenergy dissipated in succeeding layers cannot be conveniently estimatedbecause the particle velocity decreases at an unknown rate toward the wall.
The temperature in the layer material also depends on therate of heat flow to the air adjacent to it and thus on the heat flow conditionsin the air between layers. These heat flow conditions were difficult tosimulate in small scale experiments involving the impedance tube as a soundsource, but the following two types of tests were made to obtain temperatureinformation.
1. A layer was mounted at the end of the impedance tube andbacked by a quarter wave length air space so that the particle velocity at itssurface could be determined by measurements in the impedance tube. The airspace was enclosed by a glass tube which was wrapped by a two inch layer offiberglas., Temperatures were measured by three thermocouples, oneimbedded in the material at the center of the layer, and the others on eitherside at a distance of three inches from the layer surface. This test wasdesigned to produce high temperatures in the insulated air space in the glasstube within a relatively short time and to determine differences in tempera-ture between the material and adjacent air spaces.
2. Layer system No. 11 was mounted in the steel sample holderwhich was insulated with a two inch layer of fiberglas. Temperatures weremeasured by means of four thermocouples, one imbedded in layer No. 6 (atthe end of the impedance tube) and the others in the air spaces betweenlayers No. 5 and 6, 4 and 5, and 3 and 4. This test was designed to
25

determine temperatures in air spaces of different sizes for a layer system.Approximate temperatures in the layers can be estinmted from diffezencesin temperature between material and air space in other tests. Heat flowfro•mthe air space perimeter was through the 1/4 inch thick steel spacers,3 inches inside diameter, which were fitted into the 1/4 inch thick tube ofthe sample holder. Heat flow to adjacent air spaces through the steel tubeswas probably small in comparison to the heat flow through the porous layermaterials because of the low conductivity of steel.
The results of tests on a 1/2 inch layer of polyurethane foam,60 pores per inch, with a quarter wave length backing are shown in Figs. 11and 12. The upper part of Fig. I I shows temperrature rises for 160 db SPLwhich were measured at pressure maximum points in the impedance tube.The temperature in the material approached a value near 150OF while thetemperature in the insulated glass tube three inches from the layer approached130 0F. In the impedance tube the temperature approached a value of about113 0F. The curves show a rapid increase in temperature at the start of thetest and this is typical for all the temperature tests. The lower part of Fig. 11shows temperatures for a 157 db SPL in the impedance tube. The asymptoticvalues of temperature were approximately 134°F in the material, 117 0 F inthe glass tube, and 105 0 F in the impedance tube.
Previous temperature tests at 160 db on this material near100 cps gave steady state temperatures from 120 to 210OF for tests at fre-quencies of 99 cps and 103 cps respectively. It is believed that vibration ofthe polyurethane material was associated with these variable results sincethere was a resonant peak near 100 cps. The 3 inch disc of polyurethane hadbeen weighted with discs of 4 mesh hardware cloth and the addition of solderto these weighting discs produced the more consitent results of Figs. 11 and12.
Because of damage to the cones of the loudspeakers caused bytesting for several hours at 160 db, it was decided to make further tests at157 db. Figure 12 shows results of tests at 157 db at frequencies of 200 and400 cps on the same 1/2 inch layer used for Fig. 11. The temperature risesin the material were about the same at ZOO cps, 135 0 F, but were consider-ably higher at 400 cps, 170 0F.
The reason for the increase in temperature with irequency maybe partly due to an increase in acoustic resistance of the layer material or itmay be associated with the smaller particle displacement at higher frequen-cies which would tend to transfer heat less rapidly to the air adjacent to thematerial. The temperature in the glass tube was about 17 0 F below the tem-perature in the material for 100 and 200 cps and about 280 F below thetemperature in the materail at 400 cps. The temperature in the impedancetube approached about 1050 at all three frequencies.
Tests at 108 and. 590 cps and 160 db on layer system No. IIare shown in Fig. 13. In this test condition a rapid rise in temperatureoccurred at the start of the test followed by a slow change for a long period,presumably caused by the large heat capacity of the steel walls of the sampleholder. These tests showed higher temperatures at 510 cpe than at 108 cps
Z6

both in layer No. 6 and in the air spaces between layers. The rate of heatflow into and out of the air spaces is affected by various factors, mentionedpreviously, which are difficult to estimate as well as the following knownconditions. The space between layers 5 and 6 was 17 inches long and wasterminated by 1/2 inch layers of foam, 60 pores/inch. The space betweenlayers 4 and 5 was 7 inches long and was terminated by layer 5 (1/2 inch,60 pores/inch) and layer 4 (1 inch, 80 pores/inch). The space betweenlayers 3 and 4 was 15 inches long and was terminated by layers of foam(I inch, 80 pores/inch). On the basis of heat conduction to the sampleholder only, one might expect that the 7 inch air space between layers 4 and5 would reach higher temperatures than the other two spaces, 17 and 15 inchesin length. This was true at 108 cps but at 590 cps the temperature of thisspace was equal to the temperature in the space between layers 5 and 6 pre-sumably due to the high temperature in layer 6. The temperature in the spacebetween layers 3 and 4 was fairly low at both frequencies, indicating smallenergy losses in the adjacent layers. This, however, might not occur atother test frequencies.
Conclusions to be drawn from the temperature tests which areapplicable to conditions in the large scale facility must be tentative in nature.The following results may have bearing on the problem.
1. The tests on 1/2 inch polyurethane, 60 pores/inch, with aquarter wave length backing having considerable heat insulation, producedtemperatures in the material in the neighborhood of 2000F for particlevelocities corresponding to 160 db SPL in a plane progressive wave. Roomtermperature was 70°F to 800F.
2. The differences between temperatures in a layer and in airspaces adjacent to it were about 15 to 30°F for a single layer backed by awell insulated air space (glass tube) and 30 to 700F for a layer system withless well insulated air spaces (impedance tube).
3. Temperatures in the air between layers of a particular layersystem (system No. 11) varied with position of the air spaces.
4. It is inferred that higher temperatures occur adjacent tolayers far from the hard end (room surface) at higher frequencies and thereis more uniform distribution of temperature throughout the treatment at lowerfrequencies.
With regard to possible damage to layer material due to hightemperatures, the following two points should be considered. The first isthat excessive temperatures can only occur in relatively small areas near thesound sources where the sound pressure level is close to 160 db and willprobably be confined to. layers No. 4, 5 and 6. The second is that the tem-perature between the first few layers in these locations can easily be monitoredby thermocouples when the ASD room is first tested and provision can be madefor moderate amounts of air circulation if it is required.
27

SECTION VIII
CONCLUSIONS AND RECOMMENDATIONS
As a result of the research concerning the design of anabsorbing treatment for the ASD high intensity test chamber, certain con-clusions are drawn related to the acoustical effectiveness, durability andpracticality of a layer type treatment and tentative recommendations for apreferred system are given in the following paragraphs.
CONCLUSIONS
The conclusions listed below are based largely upon theresults of impedance tube tests but it is believed that they are valid for alarge scale absorbing treatment for the ASD chamber.
1) A system of spaced layers can be designed to providea normal absorption coefficient of 96 percent or better,from 50 - 10, 000 cps, for the ASD chamber.
2) The absorption coefficient of such a system will notvary materially for incident sound with sound pressurelevels between 130 and 160 db.
3) Tolerances on the acoustical properties of layermaterials are wide enough to permit the use of rela-tively low cost commercially available material.
4) The spacing of layers is not critical so that reasonabletolerances can be given for the mounting of layermaterial.
5) The fact that a 4 by 4 foot specimen of a layer ofetched polyurethane foam mounted between wire screenswithstood over 70 hours of exposure to sound pressurelevels from 165 to 170 db without damage indicates along life for the layer treatment at a maximum of 160 dbsound pressure level. Tempe rature effects in thelayers due to the intense sound were not well simulatedin the extended life test, however, and limited tests onlayer treatments with restricted air circulation betweenlayers indicate that layers close to the sirens mayreach temperatures over 200 0 F. Excessive tempera-tures can be prevented by air circulation in the space
28

between layers for parts of the treatment which areclose to the sirens, if this is found to be necessary(see Recommendations).
6) Although the mechanical details of layer support andcos•struction were not considered to be within the scopeof the project, it is believed that system supports canbe designed to permit convenient collapsing of thelayer treatment into a reasonably small space forapproximate reverberant conditions in the ASDchamber.
29

RECOMMENDATIONS
Tentative specifications for the layer treatment will serveas a basis for more detailed design with relation to mechanical construc-tion, cost, durability and collapsibility. With regard to durability in thehigh intensity sound field, it is recommended that accelerated life tests bemade on sections of layers of the final design which are several squarefeet in size.
Number and Spacing of Layers
The recommended layer system consists of six layers ofabsorbing material approximately parallel to the chamber walls or ceilingwith spacings as shown for system 11. Fig. 4(m) and Table III (c). Theclear distances between layers 1 to 6 are thus 11 inches (wall or ceilingto the first layer), 13, 9, 15, 7 and 17 inches respectively. Tolerancesfor these spacings may be as large as ± 0. 5 inch with a greater tolerance,up to + 3 inches for the space between the wall or ceiling and the firstlayer.
Acoustical Characteristics of Layers
The acoustical characteristics of the layers depend mainlyon the acoustic resistances RAC. Measured values at 140 db SPL aregiven in Table III (c) for syste-m-No. 11 as 0.66 for layers 1 and 2, 0.44for layers 3 and 4, and 0. 13 for layers 5 and 6. Tolerances for thesevalues may be about + 10 percent. Since acoustic resistance is difficult tomeasure to meet specifications, etched polyurethane foam might be specifiedwith specified thickness and pore size as given below under layer material.
Layer Material
Two materials can be recommended from those tested forlayer material for this high intensity application, etched polyurethane foam,also called skeletal polyurethane foam, and fine mesh wire screen. Sincethe polyurethane foam is considered satisfactory with regard to acousticalproperties and the results of durability tests and is also less expensive thanscreens, it is recommended. This material is available commercially in arange of pore sizes and thicknesses. To attain the required acousticalcharacteristics, layers I and 2 can consist of 1. 5 inch material with a pore
30

size of 80 per inch, layers 3 and 4 can be the same material one inchthick, and layers 5 and 6 can be 0. 5 inch material with a pore size of60 per inch. For this material, the specified acoustic resistances can bemonitored by the equivalent DC flow resistances for each layer which arequite easily measured, and which are given in Table III (c) for systemNo. 11 at a flow velocity of 50 cm/sec. It is understood that the manufac-turer monitors pore size by means of a measurement of DC resistance,i. e. pressure drop across a given thickness and area for a specified air
f low.
Surface Density
The surface density of the layers should be about 0. 5 lb/ft2
but tolerances can be as large as + 0. 2 lb/ft2 . For light weight absorbingmaterial the required surface density can easily be obtained by supportingthe material between open mesh wire screens. For example, aluminum orgalvanized gteel screens (hardware cloth) with a 1/4 to 1/2 inch meshsize will increast, the surface density but will not affect the flow resistanceof a layer. If a light weight netting is used to support the material, it willbe necessary to attach closely spaced weights to prevent vibration.
Layer Supporting Structures
The mechanical requirements for layer supports depend to agreat extent, on the method of collapsing and storing the treatment when thechamber is to be used for reverberant measurements. A suggested methodis to divide each layer into framed panels about 10 by 10 feet in size. Eachpanel may then be suabdivided into convenient sections of polyurethane foam,supported on each side by and laced to wire screen. Methods of enclosingthe polyurethane foam and attaching the screens to the frames have not beenworked out. Since both the screens and the foam are subject to acousticfatigue which may be localized at the supports, various methods of attach-ment should be checked in accelerated fatigue tests.
For collapsing the treatment the arrangement shown in Fig. 14is suggested. This is a photograph of a scale model showing the panels forsix layers of ceiling treatment and for one layer of wall treatment. In theceiling treatment, panels for the six layers are supported from the ceiling byfour cables. The ceiling treatment extends to about six feet from the walls.The treatment is collapsed either by raising the panels to the ceiling forstorage there or preferably by lowering them to the floor for removal fromthe room. The collapsed panels for the six layers will occupy a space 10 by10 feet in area and about one foot in thickness.
31

The panels for each wall layer (see Fig. 14) are positionedby guide calbes anchored to both ceiling and floor. Two guide cables arerequired for each vertical system of panels. Each panel of a layer islocated just back (toward the wall) of the panel above it so that the lowerpanels can be raised to a position behind and close to the top panel. Utilizingprojecting members at the bottom of each panel, the panels can be raised tothe ceiling by means of one or two hoisting cables. As the panels arelowered, projecting members at the top of each panel (except the uppermost)engage mating members at the bottom of the next higher panel. Consequently,each panel ultimately supports the next lower panel, the total load beingsupported by the uppermost panel which anchored to the ceiling. Since thetravel is the same for all six layers, the hoisting cables can be attached to asingle cable for operation by a winch. With this method, the collapsed walltreatment will occupy a space about 10 feet high by 6 feet thick along theupper perimeter of the chamber.
Under consideration for the wall treatment is another type ofsupport for the absorbing material using a fabric netting (made perhaps ofnylon cord) on each side of a layer so that the vertical layers would be flexibleenough to be raised in loops or folds. Lacings through the absorbing materialat close spacings might be designed to provide the required weighting withoutserious loss in flexibility. This type of flexible support will require checkingfor fatigue resistance.
Alternate Five Layer System
If it is desired to save the cost of one layer at the expense ofs lightly poorer performance, a five layer system can be recommendedinstead of the six layer system. Five layer system No. 21 is given as analternate recommendation. The layer spacings and materials are given inTable III (e). The materials are the same as used in the recommended systemNo. 1 I and the same specifications apply.
32

ACKNOWLEDGMENT
The research program was handled by the Acoustics Sectionof the Physics Division of Armour Research Foundation with R. R. Whymarkas acting manager of the section and W. C. Sperry as group leader of theactivity. W. C. Sperry was manager of the section during the last part ofthe program. F. G. Tyzser was project leader responsible for the generaldirection of the work. W. E. Lawrie designed the low frequency impedancetube and its exponential horn and set up the greater part of the measuringequipment. H. H. Hall designed the h~igh frequency impedance tube,L. D. Williams made the majority of the measurements. W. C. Sperry andL. D. Williams worked out a suggested method of supporting and collapsingthe treatment. C. S. Caccavari monitored the extended life tests at NorthAmerican Aviation.
33

LIST OF REFERENCES
1. Kolb, A. W., Rogers 0. R., "The Aeronautical Systems DivisionSonic Fatigue Facility. " Shock, Vibration and Associated Environ-ments. Bulletin No. 30, Part V. March 1962. pp. 37-50.
2. Beranek, L. L., Sleeper, H. P., "Design and Construction ofAnechoic Sound Chambers. " J. Acoust. Soc. Am. Vol. 18. July1946. pp. 140-150.
3. Bedel, E. H., "Some Data on a Room Designed for Free FieldMeasurements. " J. Acoust. Soc. Am. Vol. 8. Oct. 1936.pp. 118-125.
4. Allen, C., "Chamber Treatment for the Large Test Chamber SonicFatigue Test Facility, Wright Patterson Air Force Base, Ohio."Bolt, Beranek, and Newman Job 13,205. July 1960.
5. Bolt, Beranek and Newman, "Investigation of the Performance andDetermination of Acoustical Absorbing Materials under Influence ofIntense Sound Fields. " U.S. Navy Bureau of Ships Report No. 792.Contract Nobs 77075, Index No. N 3713 -21016. November 18, 1960.
6. Morse, P. M., "Vibration and Sound," 2nd Edition, McGraw HillBook Co. Inc.,N.Y., 1948.
7. Zwikker, C., Kosten, C. W., "Sound Absorbing Material,"lst Edition, Elsevier Publishing Co. Inc., N. Y., 1949.
8. Beranek, L. L,, •Noise Reduction, " lst Edition, McGraw Hill BookCo. Inc., N. Y., 1960.
9. Beranek, L. L., "Acoustic Measurements," 1st Edition, John Wileyand Sons, Inc., N. Y., 1949.
10. Smith, P. H., "An Improved Transmission Line Calculator."Electronics. Vol. 17. Jan. 1944. pp. 130.
11. Hopkins, H. F., Stryker, N. R., "A Proposed Loudness EfficiencyRating for Loudspeakers and Determination of System Power Require-ments for Enclosures. " Proc. Radio Eng. Vol. 36. March 1948.pp. 315-335.
34

APPENDIX I
DEVELOPMENT OF HIGH INTENSITY TEST FACILITY
Impedance tubes were designed to measure normal incidenceabsorption coefficient over a wide range of frequency and at high soundintensity. The design goal of 160 db intensity level for tests over the fre-quency range of 50 to 7,000 cps was substantially achieved in that measure-ments at 160 db could be made over most of this range. Measurements atlower intensities were possible down to about 20 cps.
Three impedance tubes were designed, a low frequency tube(3 inches in diameter and 20 ft long) for frequencies between 20 and 300 cps,a medium frequency tube (3 inches in diameter and 3 ft long) for frequenciesbetween 300 and 2, 000 cps, and a high frequency tube (0. 76 inches indiameter and 15 inches long) for frequencies between 1500 and 6000 cps.These tubes were driven by high power sound sources and amplifiers andwere equipped with movable microphones and measuring systems. Sampleholders for convenient mounting of layer type absorbing systems were pro-vided for each tube. The detailed description of the system and a discussionof design criteria are given in the following paragraphs.
In order to measure the DC resistance of absorbing materialsfor layer systems, the range of existing flow resistance equipment wasextended for measurements at flow rates corresponding to the particle velocityof a plane wave at 160 db sound pressure level. This setup is also describedbelow.
IMPEDANCE TUBES
A drawing of the low frequency impedance tube is shown inFig. 15. The medium frequency tube is of similar construction. The highfrequency tube is shown in Fig. 16. The low and medium frequency tubeswere mounted in the center of plywood boxes of sand approximately 8. 5 by12 inches in cross section in order to damp resonant vibrations of the tubewalls. The horn sections coupling the low frequency tube to the drivers wasalso damped by sand. The minimum thickness of sand at all surfaces of thetubes and horn was four inches and over 6000 Ibs of sand were used.
The dimensions and frequency ranges of the low, medium andhigh frequency impedance tubes given in Table IV were determined in part bythe characteristics of the sound sources and in part by the requirementsrelated to sound wavelength. The diameter for the low and medium frequencytubes was 3 inches. A larger diameter would have some advantages withrespect to reducing the effect of edge mounting conditions of the test samplesbut it would be difficult to obtain sound sources with enough acoustic poweroutput to reach the required intensity level of 160 db. (Intensity level based
35

on 10-16 watts/ jm 2 is numerically equal to sound pressure level based on0. 0002 dyne/cm for a plane progressive sound wave in air.) The upperfrequency limit for a circular tube is determined by the frequency for thefirst cross nrwde. This cut off frequency is given by Morse (Ref. 6, p. 308,Eq. 26. 15) fo- a cylindrical tube as
fl= 0. 586 c/2a (4)
where f is the cut-off frequency, c is the velocity of sound and a is theradius ol the tube. For a 3 inch tube the cut-off frequency is 2650 cps. Thismode has a node at the tube axis and it is estimated that the effect on tubemeasurements is not significant at frequencies below about 2000 cps if themicrophone is mounted at the tube axis.
The diameter foi the high frequency tube was 0.76 inches andthe cut-off frequency for the first cross mode was 10, 500 cps. In this tubeit was difficult to keep the microphone accurately on axis and the upper limitfor measurements was about 7,000 cps.
The length of the low frequency impedance tube was set by thespace available for the tube and its associated horn. The tube was 20 ft long,the horn with its coupling section was 16. 5 ft long, and the sample holder was6 ft 4 inches long, giving an overall length of about 43 ft. In the 20 ft tubelength two minima in the standing wave pattern could be measured for fre-quencies above about 57 cps for any sample impedance. Below this frequency,measurements were in some cases restricted to one minimum point and onemaximum with some loss in accuracy involved in calculation of the wave lengthand estimating the attenuation along the tube. The latter source of error wasnot very significant since the attenuation along the tube was small for thesamples of high absorption which were measured.
The 300 cps upper frequency limit of the low frequency tubewas determined by the driver characteristics. Above 300 or 400 cps therewas "breakup" in the loudspeaker cones resulting in lowered acoustic output.
The length of 36 inches for the medium frequency tube allowedmeasurement of two minima in the standing wave pattern at frequencies aboveabout 375 cps. In the range between 375 cps and the 300 cps, the lowerlimit of this tube, it was occasionally necessary to use measurements on onlyone minimum and maximum. The upper limit for this tube was about 2,000cps because of cross modes as discussed previously.
The high frequency tube was 15 inches long and two minimacould be measured for frequencies above 900 cps. A low frequency limit ofabout 1500 cps was set by the driver characteristics. As discussed previously,the upper limit for this tube was about 7000 cps because of cross mode effects.
36

The sound field inside each impedance tube was explored bya microphone mounted inside the impedance tube at the end of a probe tube.A tube was used instead of a rod in order to provide a shielded conduit forthe microphone cable. The probe tube passed through a felt lined bushingat the sound-source end of the impedance tube. The microphone end of theprobe tube was supported by a three legged carriage with felt or rubber atthe contacts between the carriage and the inside surface of the impedancetube. The felt at the microphone carriage supports and at the bushingprovided vibration isolation for the microphone which is essential foraccurate measurements of sound pressure. The microphones were supportedby their electrical conneotions (thin wires) to the calibrate resistancesand to the signal and calibration cables which were inside the probe tubes. Ashort piece of thin wall rubber tubing was placed over the calibrating resistorin the medium frequency impedance tube but, in the high frequency tube, thiswas removed in order to improve the vibration isolation of the microphone.The other end of the probe tube was clamped to a movable carriage whichsupported the microphone preamplifier.
The probe tube for the low frequency tube was 0.75 inch indiameter and about 23 feet long. The preamplifier carriage was moved alonga 2 by 5 inch aluminum channel by means of an endless chain driven by asprocket. A steel tape loop attached to the carriage was used to determinethe microphone positions.
The probe tube for the medium frequency tube was 0.312 inchin diameter and 77 inches long. It was moved by means of a rack and pinion.The microphone position was indicated by a pointer on a fixed centimeterscale.
The probe for the high frequency tube was 0. 25 inch indiameter and 22 inches long. It was moved by means of a lead screw andmicrophone position was read by reference to a fixed centimeter scale.
SAMPLE HOLDERS
A drawing of a sample holder for the low and medium fre-quency tubes is shown in Fig. 17. Two interchangeable sample holders, 6 ft4 inches in length were used. The layers of acoustical materials were discs3. 5 inches in diameter and they were positioned between spacers with a3 inch inside diameter and an outside diameter which was a slip fit in the3-I/2 inch sample holder tube. The layer periphery was compressed slightlyby the spacers. Spacers with lengths of 12, 5, 4, 3, 2 and I inch weremade to allow a wide range of spacing patterns for the various layer systems.
In the high frequency sample holder it was not possible to com-press the edge of the layers without serious deformation of the 0.76 inch -diameter area exposed to the sound. The layers were therefore fitted insidethe spacers (0.76 inches I.D. ) which were held in the sample holder by setscrews.
37

In each sample holder, a hard end was provided by amovable metal plug. Felt washers clamped by metal discs, 3 inches indiameter at the front and back surfaces of the plugs were used so that theplugs could be moved inside the spacers but would be tightly sealed.
DRIVING EQUIPMENT
A block diagram of the driving and measuring equipment isshown in Fig. 18 and a list of equipment in Table V. In the driving setupthe oscillator signal was applied through an attenuator to a separate poweramplifier for each impedance tube. The current in each group of driverswas monitored by means of an ammeter in order to prevent excessive cur-rents which might damage the drivers.
Low Frequency Tube
The drivers for the low frequency tube consisted of 498 inch cone loudspeakers, Jensen P8-PC. A photograph of the loudspeakersand the exponential horn is shown in Fig. 19. The drivers were connectedin a seven by seven array and each line of seven drivers in series was fused.It was found that the resonant frequency of all the speakers was not the sameand, for frequencies near 50 cps, high intensities could not be attained with-out damage to the cone supports. Under this condition, a few speakers whichwere driven near resonance had excessive amplitudes and the others, off reso-nance, had much smaller amplitudes. A level of 140 db, however, could beobtained even in this resonance range.
The speakers were rated at 15 watts for broadcast programmaterial. Using a "rule of thumb" conversion factor of one-half for contin-uous sinusoidal signal would give a rating of 7.5 watts per speaker. For thenominal impedance of 8 ohms, the maximum current rating is 0. 96 amp. Forthe 7 by 7 array the maximum input current is then about 7 amps and themaximum input power is 370 watts. Operation at 6 amps corresponding to290 watts resulted in a voice coil temperature which caused discoloration ofthe voice coil forms, but few failures occurred except as noted for operationnear resonance.
A pressure level of 160 db corresponds to an intensity of aboutone watt/cmz assuming that the impedance tube is terminated by pc. The3 inch diameter tube had an area of 45.6 cmZ which gives an acoustic powerrequirement of about 45 watts. The efficiency of the driver and horn system(electrical input power divided by acoustic power in the impedance tube) wasthus about 45/290 or 16 percent over most of the frequency range.
38

The speakers were mounted in a 71 by 69 inch plywood panelone inch thick and were spaced 8. 5 inches on center. The panel wasattached to the large end of the exponential horn which was coupled to the lowfrequency tube. The horn construction is described below. The space behindthe speakers was a cavity of rectangular cross section, 68 by 66 by 8 inches.This space was ventilated by means of a small blower which can be seen atthe upper left corner of Fig. 19. Lined ducts at the inlet and outlet openingsfor the cooling air were used to reduce the sound from the back of thespeakers.
The cone loudspeakers were coupled to the low frequencyimpedance tube by an inverted exponential horn designed to provide an approx-imation to pc loading for the loudspeakers. For design purposes the layersystem was assumed to have high absorption and thus the impedance tube wasterminated by a specific impedance of about pc and the specific impedancelooking into the source end was also approximately the same. The horn isconsidered as a transformer which matches the acoustical impedance of thesmall area at the impedance tube to the large area at the loudspeakers. Theacoustical impedance is defined as the specific impedance divided by the area.Thus, a well designed horn will transform the acoustical impedance at thethroat pc ISI to pc /S2 at the large end and give a desirable loading forsound sources at this end.
The horn was designed on the basis of the following specifica-tions, a 3 inch diameter at the throat, a 59 by 59 inch area at the large endfor mounting 49 8 inch loudspeakers, a cut-off frequency below 50 cps, andavailable space and cost requirements. The equation for an exponential hornof axial length d is
exp (qd) = S2 /S 1 (5)
The flare constant q determines the cut-off frequency fl which is definedas
f, = qc/4w (6)
For d-equal to 13.6 ft and S$/Sl equal to (59/3)2 or 388, q iso.44 ft 1 giving a cut-off frequency of 40 cps.
In building the horn it was decided, because of cost, to usefiat plywood one inch thick for the greater part of the sides with some devia-tion from an exponential expansion in area. The length was divided intoseven segments. The first was 19 inches long and was made of 1/4 inch sheetsteel which was formed to have a circular cross section 3 inches in diameterat the impedance tube end and a square cross section at the other end. The
39

foUowing segments were made of plywood and were each two feet long.They were hollow pyramids with a square cross section. At each junctionbetween segments, the width of the segment was fitted to the exponentialcurve specified in the preceding paragraph. The large end of the horn wasclosed by a 59 by 59 inch flat plywood panel on which the 49 loudspeakerswere mounted in a seven by seven array approximately 8. 5 inches on center.
The axis of the horn was inclined from the impedance tubeaxis as shown in Fig. 15. The angle between the axes was about 140. Aflanged steel tube, 3 inch I. D. and about 3 ft long was bent to connect theimpedance tube and horn so that there was no interference between the micro-phone probe tube and its preamplifier carriage and the horn.
Although the stepped horn differed from a theoretical exponen-tial horn in several respects and there was an abrupt change from the 59 by59 inch area of the horn to the smaller area of the 49 loudspeakers cones,the horn did not introduce pronounced peaks and dips in the frequency re-sponse of the system. The loading of the loudspeaker drivers was adequateto give a fairly high efficiency for the conversion of electrical power toacoustic power in the impedance tube.
All joints between the plywood sides of the horn were closelyfitted and were glued and screwed together. The various segments weremounted in an enclosure filled with sand as described previously. A photo-graph of the loudspeaker array and horn assembly is shown in Fig. 19.
Medium Frequency Tube
The drivers for the medium frequency tube consisted of 16University Horn Drivers, Model ID-60. The nominal impedance was 16 ohmsand the rated power per driver was 60 watts. Dividing the power rating bytwo to convert to an approximate rating for continuous sinusoidal signals gives30 watts and a maximum current of 1. 37 amps. The drivers were connectedin a 4 by 4 array with each line of four speakers fused at 1 amp. With amaximum current of 4 amps for the array corresponding to a maximum inputpower of 250 watts, the required sound level could be attained. A photographof the horn drivers is shown in Fig. 20.
The acoustic power corresponding to 160 db pressure levelwith a pc termination of the impedance tube is 45 watts the same as calcu-lated for the low frequency tube. The efficiency of the driving system is thusabout 45/250 or 18 percent.
The 16 horn drivers were coupled to the impedance tube by aseries of Y connectors of circular cross section which provided a fairlysmooth area transformation from the driver throat (approximately 7/8 inchdiameter) to the impedance tube (3 inch diameter). The path length fromeach driver to the impedance tube was the same within 1/32 inch to keep theirsound outputs in phase.
40

High Frequency Tube
Two Jensen high frequency horn drivers, Model RP 103,were used as the sound source for the high frequency tube. They weremounted on the impedance tube by a Y-coupling. A photograph of the highfrequency impedance tube is shown in Fig. 16. The nominal impedance was16 ohms and the drivers were connected in series. A maximum currentrating of 0. 5 amp was determined from a curve of voice coil resistanceversus current. This value gives an input power of 8 watts and was adequatefor producing the required sound intensity of 160 db.
The area of the high frequency tube was 2.93 cm 2 and theacoustic power for 160 db sound pressure level with a pc termination was2. 9 watts. The efficiency of the driving system is thus about 2. 9/8 or 36percent.
MEASURING EQUIPMENT FOR IMPEDANCE TUBES
A block diagram of the measuring system is shown in Fig. 18.A list of the equipment is given in Table VI. In general it is a conventionalsystem for this type of work consisting of a microphone, amplifiers, attenu-ator, filter and vacuum tube voltmeter. Since the sound pressures are highand must be measured in absolute levels, high intensity microphones mustbe used and they must be located at the measuring point inside the impedancetube. In the usual installation where only relative pressure levels arerequired, a probe tube is used to conduct the sound from the measuring pointinside the tube to the microphone outside. Measurement of absolute soundpressure level with such a probe microphone would then require calibrationof the resonant probe tube and microphone system at each frequency. Whena calibrated microphone is located inside the impedance tube, the onlyrequirements are a small diameter and adequate vibration isolation for themicrophone. The small size minimizes changes in the sound field due to thepresence of the microphone and vibration isolation prevents transmission ofvibration from the impedance tube wall to the microphone.
For the medium and high frequency impedance tubes, a Massa,M-213 microphone was used. This is a compression type crystal micro-phone which is 0. 25 inches in diame er and 0. 5 inches in length. Its sensi-tiVity is -102 db re I V per dyne/cmi. Although it has a low capacitance,12 jpLf, a moderate length of cable between the microphone and its preampli-fier can be used (about 77 inches for the medium frequency tube and 22 inchesfor the high frequency tube) without excessive reduction of sensitivity orincrease in noise threshold. The insert calibration resistor must, however,be located close to the microphone for a correct calibration by means of theconventional insert voltage calibration technique.
41

The probe tube for the low frequency is 23 feet long andthis length of signal cable has too much capacitance for the M-213 micro-phone. A Massa M-101 microphone was therefore used in this installation.It is 5/8 inches in diameter and one inch long and has a cyacitance of about125 j&pf and a sensitivity of -93. 5 db re I V per dyne/cm .
In order to prevent overload of the preamplifier for theM-101 microphone, a small capacitance was connected across the inputcircuit to reduce the signal level by about 20 db. This capacitance voltagedivider had a negligible effect on the frequency characteristic of the micro-phone. It is, of course, part of the system which is calibrated by the insertvoltage calibration technique.
The electrical part of the measuring system was checkedroutinely by observing the output voltage and waveform produced by a cali-brating signal at the insert resistor in series with the microphone. Thecalibrate voltage was made equal to the microphone voltage from the desiredacoustical signal both in frequency and magnitude. Observation of the outputvoltage waveform on an oscilloscope was made routinely during impedancetube measurements to check the filter settings and to guard against overload.In the initial testing of the measuring system, it was found that there was anon-linear relation between filter input and output voltages when the latterexceeded about 4 my. Care was taken not to exceed this limit during alltests.
FLOW MEASURING FACIUTY
A photograph of the flow measuring apparatus is shown inFig. 2 1. Air was drawn through the sample placed in the vertical cylinderat the right end of the table by means of centrifugal type blowers. Thevolume velocity was measured by means of one of the six flow meters mountedin the back panel. The pressure drop across the sample was measured by theinclined manometer, 0 - 2 cm of water, or by the vertical manometer, 0 - 20inches of water. An existing measuring system was modified for this applica-tion. The previous use required the cylindrical and rectangular sampleholders seen at the left of Fig. 2 1. Each flow meter was supplied with regu-lating and shut-off valves and the manometers could be connected to any one ofthe sample holders by means of valves. A list of the flow meter type numbersand ranges is given in Table VII.
Test samples were fitted to the 3. 5 inch I.D. sample holder andwere supported by a 0.75 inch mesh wire grid which had negligible flow re-sistance. The manometers we3Ce connected to a cavity below the sample, 3. 5inches in diameter and 2 inches in length. The sample holder and the largestflow meter were connected to the blower with 1. 5 inch piping to reduce flowloss in the system.
42
Thick samples were made to fit tightly in the sample holder.Thin samples such as wire screen or glass cloth were sealed by clampingat the circumference by means of a 3. 06 inch I. D. tube which fitted insidethe 3. 5 inch I.D. sample holder. The •inear flow velocity correspondingto the maximum flow rate of 37, 500 cmrn/sec was 600 cm/sec for the areaof the 3. 06 inch tube and 790 cm/sec for the area of the 3. 5 inch tube.These values are well above the required RMS particle velocity of 480 cm/sec corresponding to a plane wave at a sound pressure level of 160 db.
43

APPENDIX II
THEORY AND CALCULATION OF LAYER SYSTEM ABSORPTION
In this appendix, a theory for calculation of the normalincidence absorption is given and the results of approximate calculationsof absorption of particular layer systems at low frequencies.
THEORY FOR CALCULATION OF IMPEDANCE OF MULTIPLE LAYERS
The relation between the normalized specific impedance Z"at a surface and the absorption aN of an acoustic wave at normal incidenceis given in various acoustic textbooks (Ref. 6, 7, 8, 9). It can beexpressed as
IZ )272
100 +Z
Since Z = R+ JX
0wN 4RUN 4R(8)
100 (1 + R)2 + X2
In these relations and throughout the report, the impedance Z is thenormalized impedance, the ratio of sound pressure to particle velocitynormal to the surface divided by pc for air.
Equation (8) represents a family of circles with constantvalues of aN on the R,X plane with centers at
X = 0
and R 200 - 1 (9)
4N
45

and with radii equal to
1 - -0 (10)
A family of circles for ýN between 70 and 100 percent are shown inFig. 22. The design goal of 96 percent absorption requires impedancevalues inside the 96 percent circle. It is seen that values of X should besmall with a maximum range of + 0.416 when R is 1.08. For X equalto zero, R must lie between 0.667 and 1. 50.
The impedance of material systems is a function of frequencyand at high sound intensities it is also a function of other variables such asparticle velocity (see Figs. I and 3).
For homogeneous materials backed by a reflective surfacethe impedance, at least at low intensity, can be approximately related tomeasured properties of the material (Ref. 7, 8). In systems, such as anumber of spaced layers of absorbing materials, the impedance at the sur-face of sound incidence is a more complicated function involving layerspacing.
The calculation of the impedance of a layer system at normalincidence is most easily done by a series of steps. Following Zwikker(Ref. 7 Chapter 6, Article 7) who gives a graph'cl method, the impedanceat the surface of a layer of material can be determined from the character-istic impedance and propagation constant of the layer material and the backingimpedance. Referring to the diagram of a layer system in Fig. 23, theupper part shows a layer system with spacings d and layer thicknesses t-The process of calculation proceeds in steps which are based on the equation(Ref. 7 Chapter 1, Article 2) for the specific impedance z II of layer 1which is backed by the specific impedance Zl0
Sw 1 £z loCOsh(r 1 E 1 ) + w sinh(rite1 )
zlO sinh( l el) + wI cosh( r1 el)
where wI is the characteristic impedance of the material of layer 1 andri is its propagation constant. Both of these quantities are complex. It is
interesting to note that for a hard end backing where zlO is infinity
Is ll = W4 coth ril (12)
46

and for zero impedance backing
z1 W Itanh (13)
thus giving a method of determining w1 and r' 1 from impedancemeasurements. The calculation of layer system impedance can be done bysuccessive applications of Eq (11), starting from the infinite impedance ofthe hard end and calculating zin, z z 2 o etc. The calculation iscomplicated and tedious and Z~ikker l(Wef.4, Chapter 1) describes agraphical method.
A Smith Chart Calculation (Ref. 10) can be used to facilitatethese calculations since it provides a rapid means of evaluating the real andimaginary parts of the hyperbolic cotangent of a complex quantity. TheSmith Chart, however, uses normalized quantities and specific impedancesmust be renormalized in passing through the boundaries of each layer.
The steps according to Zwikker (Ref. 7, Chapter 6, Article7) are shown below. In the air at the left surface of layer I (Fig. 23)
Z10 = coth(-Jd I/X) = j cot(dIX) (14)
and zl 0 = jpc cot(d,/)L) (15)
In the material just inside this surface, the specific impedance is the samebut, to use the Smith Chart to calculate zll, zl 0 must be normalized bydividing by wI to get Z' 1 0 ,
N = zlo/wl (16)
The impedance Z' still normalized to the material in layer I isobtained from the Sith Chart by evaluating Z 1i from
Z11 u coth(flItI +coth'I Zio) (17)
47

which is the impedance in the material at its right hand surface. Renor-maliming to obtain ZII for the impedance in the air at this surface requiresthe use of
z = Z W /pc (18)
This process ts repeated until the impedance is obtained at the incidentsound boundary of the whole system which is converted to normal incidenceabsorption by the use of Eq (8).
Even with the use of the Smith Chart this calculation is tediousand is not particularly accurate because of uncertainties in w and r- forthe layer material. Beranek (Ref. 8) and Zwikker (Ref. 7) give methods ofcalculating these ouantities from measurable properties of absorbingmaterials and Beranek (Ref. 8, Chapter 12) gives curves for conventionalabsorbing materials. For the materials such as polyurethane foam or wirescreens which are adapted to layer systems for high intensity sound, thematerial properties are not available. It was therefore decided to use anapproximate calculation method described below.
THEORY FOR APPROXIMATE CALCULATION OF LAYERSYSTEM ABSORPTION
If certain assumptions are made regarding attenuation andphase shift in passing through a layer of material, the combination of trans-mission line segments and lumped resistances of the central part of Fig. 23can be used. This greatly simplifies the calculation of the absorption of alayer system. If the portion of the transmission line in the layer materialcan be replaced by the resistance r, it must be shown that r is approxi-mately equal to the impedance z of the layer with zero impedance backing.The characteristic impedance is related to the propagation constant (Ref. 8,Eq 12. 14) by
w = -JK r (19)WY
The porosity Y for the porous materials in question can be taken as )/2,approximately unity. Since the velocity of sound in the material is (K/pEq (19) can be given as
48

="Pc2 r (20)
and
Z = "Pcz 2 tanh( rt• (21)
The propagation constant F is composed of a real part 9 the attenuationin nepers per unit length and an imaginary part p. the phase shift per unitlength equal to w/c. Forthinlayers rP is very small and tanh(ri )can be replaced by its argument without serious error in Eq (21) to give
Z o -JPC 2 r L (22)
Replacing r 2 by
2 2r = (0 +j C/c)
= 2 -r W2/c2 + 2JOri/c
gives
- pct [20 -j(cc 2 /rW- ri/c)] (23)
This impedance normalized with respect to pc for air is the impedancewhich was measured (Section IV) for a layer backed by a quarter wavelength stub. Since this measured impedance was essentially resistive, theimaginary part of Eq (23) can be neglected to give
Z -V ZpcQ e (24)
and the impedance of a layer with zero impedance backing in approximatelyequal to a resistance which is proportional to the thickness.
49

CALCULATED ABSORPTIONS OF LAYER SYSTEMS
Impedance calculations were made for six layer systemshaving constant resistance RAG per layer and the spacings of systemNo. I in order to determine how the normal incidence absorption varied withlayer resistance. These calculations, made before the measuring systemwas completed, were intended to show:
1) Whether absorption coefficients in the neighborhoodof 96 percent could be obtained with systems with asmall number of layers.
2) The. size of irregularities to be expected in theabsorption versus frequency curve for systems withas few as six layers.
3) The effect on the absorption of changes in soundintensity which were known to affect resistance.
The calculations were based on the equivalent transmissionline diagram of Fig. 23 using the equations given below this diagram.Hyperbolic cotangents were evaluated by means of the Smith Chart (Ref. 10)to obtain Z 1 0 , ZII, Z2 0 , Z2 1 Z61 and the normal incidencecoefficient of-the system was obtained by the use of Eq (9).
The calculated values of aN are listed in Table VIII for arange of layer resistance at various frequencies. Two of the frequencies,94.4 and 472 cps, were chosen in order to investigate dips in the absorp-tion versus frequency curve which might occur when the length of the wholesystem was equal to a who.e number of half wave lengths. The remainingfrequencies covered the low frequency range between 50 and 500 cps.
It is seen from Table VIII that calculated absorption coeffi-cients were lower at RAC = 0. 1 and increased to a broad maximum atabout RA = 0. 4 . The flrst experimental test (System No. 1) was there-fore made with layer resistances close to this value. The variations incalculated absorption at different frequencies was larger than the variationsfound in the experimental tests but the differences between calculated andexperimental values were not extreme.
The calculations of absorption were justified as a preliminaryevaluaton of a layer-type treatment in showing that high absorption could beobtained with a system of six layers and that changes in absorption of such asystem were not excessive for a moderate range of layer resistance.
50

EFFECT OF SURFACE DENSITY OF LAYERS
In the previous discussion it was assumed that the resistanceof a layer was not greatly affected by layer motion caused by the sound.This motion can be considered as a wave motion in the layer material inaddition to a simple translation motion where all parts of the layer move inphase. Wave motion in a layer causing expansion and contraction in thelayer material is small for layer thicknesses which are short compared toa wave length. Its effect on layer impedance did not introduce a significantreactive term as evidenced by measurements of RAC at frequencies below1500 cps. The effect on the resistive term is also p'robably small and istaken care of by using an experimentally determined lumped resistance.
Translation motion of the whole layer, however, has a signi-ficant effect on layer impedance at low frequencies especially for materialsof low surface density. The effect of the motion for normal incidencesound on a layer of large area depends on the impedance of a stationarylayer (assumed to be a resistance), the surface density of the layer, thefrequency, and the backing impedance for the layer. It was decided to cal-culate the specific impedance of a layer backed by an impedance of pc todetermine the surface density at which layer motion would have negligibleeffect on layer impedance. This case of pc impedance backing waschosen because of convenience and because it is fairly representative ofconditions at low frequencies near the incident sound end of an absorbinglayer system.
For an impervious layer with a surface density m, thevelocity of motion is equal to the force divided by the mass reactance, -jwm.The force is the difference in pressure between the two surfaces. For pcbacking the particle velocity in the air just beyond the surface can be shownto be equal to the velocity of the material. For a pervious stationary layerof impedance r the particle velocity in the backing space is the samedifference in pressure divided by r. For conditions of both motion andflow, the system is analogous to an electrical resistance r in parallelwith an inductance oum with this parallel combination in series with aresistance pc . This analogy was used by Beranek (Ref. 8, Chapter 14)to calculate the transmission loss through a porous layer. The inputimpedance z of this circuit can be determined by elementary electrical cir-cuit theory to be
a = J + PC A(25)
r -jcan
Dividing by pc to transform to normalized impedances, denoted by capitalletters, rationalizing the denominator, and simplifying gives
51

z = R+1+R 2/wM -JR 2 WM (26)
1 + R 2 / w2 M2
When R/ uM <• 1 (at high frequency for a given RIM), the impedance isapproximately equal to R + I which in correct for a stationary layer withbacking. For low frequencies where R/wM is not small, the effect ofmotion is a reduction of the resistive term for a stationary layer and theaddition of a negative reactive term.
Using Eq (26), calculations were made of lumped impedancefor thl layers of system No. 10 for surface densities between 0. 1 and 0. 5lbs/ft . These values were then used to calculate absorption coefficientsfor this system at various frequencies giving the results shown in Table II.As explained in Section III, the calculated absorption values could not bechecked against values measured in an acoustic tube because the boundaryconditions of the 3 inch diameter layers in the impedance tubes was quitedifferent from the boundary conditions of layers of infinite extent used in thecalculations. The calculated values were used in determining surfacedensity of screens to support the layers in the recommended treatment.
52

APPENDIX mI
CALCULATION OF REVERBERANT ROOM CONDITIONS
There has been a question about the desirability of removingthe ceiling treatment when the ASD room is to be used for tests requiringa reverberant field. If the ceiling treatment is collapsed and remains in theroom it will have considerable absorption which may be undesirable inobtaining optimum reverberant conditions. The wall treatment cannot beconveniently removed from the room and even when collapsed will providemuch more absorption than the untreated room surfaces. Calculation andestimation of conditions for a reverberant or diffuse sound field in the ASDroom are given below.
In a diffuse sound field, energy flows toward a surface equallyfrom all directions and the sound pressure level is constant at all points inthe field. In a room designed for such a field, the reverberation time shouldbe long and the minimum distance from a sound source at which diffuse fieldconditions exist should be short.
In order to make a rough estimate of the reverberation timesof the room with ceiling treatment collapsed and with ceiling treatmentremoved, the conventional reverberation formula will be used, I. e.,
T = 0.049 V/A (27)
The total amount of absorption, A, was obtained from calculation or esti-mation of the absorption of the various room surfaces and is shown inTable IX. In these calculations, random coefficients a R are used.Absorption coefficients for the collapsed ceiling treatment were estimatedfrom the normal incidence coefficients measured in the impedance tube forsystem No. 25 which had the same layers as the recommended system No. 1 Ibut had been collapsed. The absorption curve for this collapsed system isgiven in Fig. 4(y) and its description in Table MI (f). A spacing of 30 inchesbetween the hard end (ceiling) and layer No. I was used and a one inch spacebetween layers was assumed to account for the supporting frames. Above600 cps the absorption coefficients for the collapsed treatment are above 96percent but below this frequency the curve is irregular and considerablybelow the curve for the extended treatment shown in Fig. 4(m). Measure-ments were also made on the system collapsed to within four inches from theceiling. The results (not shown) were similar to Fig. 4 (y) except for lowercoefficients'below 125 cps.
53

In the approximate calculations for Table DC, normalincidence coefficients were used for the treated surfaces although these arenot generally equal to random incidence coefficients. An average coefficientof 90 percent was used for the collapsed ceiling treatment, although Fig. 5shows about 96 percent above 600 cps and about 85 percent below this fre-quency. The same coefficient of 90 percent was assumed for the collapsedwall treatment and the total absorption was based on panels 10 feet highwhich would have horizontal surfaces 6 feet wide and vertical surfaces 10feet wide with ceiling treatment removed and 6. 5 feet wide with collapsedceiling treatment in place.
The reverberation times with collapsed treatment given inTable X are rather short and the direct field from a sound source will,therefore, extend for a considerable distance from the source. Hopkinsand Stryker (Ref. 11) and also Beranek (Ref. 9, p. 317) give curves ofsound pressure versus distance from a non-directional sound source for arange of values of thesoom constant B which is defined as
B A (28)S- aa
where aa is the average absorption coefficient of the room surface
Table XI gives values of R and the approximate amountsthat the total sound level from a non-directional sound source is above thelevel of the direct sound from the source at distances of 10 and 20 ft.These level differences were obtained by interpolation from the curves ofRef. I which is a sufficiently accurate method considering the rough esti-mates of random absorption coefficients for the treatment.
A good approximation of an anechoic field exists for theextended treatment. For the collapsed treatment the total field is only 3 dbabove the direct sound at 10 feet but semi-reverberant field conditions existat 20 ft. For the collapsed treatment with ceiling treatment removed, aconsiderably better approximation to reverberant field conditions exists at20 ft. With no treatment, a reverberant field exists at distances less than10 ft.
Removal of the ceiling treatment will therefore be beneficialin exposing structures to reverberant sound fields. If this approximation ofa reverberant sound field for the collapsed treatment is not acceptable, thepossibility of removing both the ceiling and wall treatments can be con-sidered. This should not be necessary provided that test structures can belocated about 20 ft from the sound sources.
54

0 00
Cd1
al 00
0U
30
0
o 00
3.0
UUo 0
C0 04,
0 0 j
I _ -o0
.55

0
0 0A00
0 -0
.0
#4 0o 9!
o: - @
o z0 0
0'
3 556

0
0 -0
0
-0-
.41
oL
9 0
0Zn :
-0 0
0 00
0 0
a. & 4)
totoO
ci 46 czz z
o A
0t
IN) ~(D 0 _ ____V
I4')gtt~ -5'
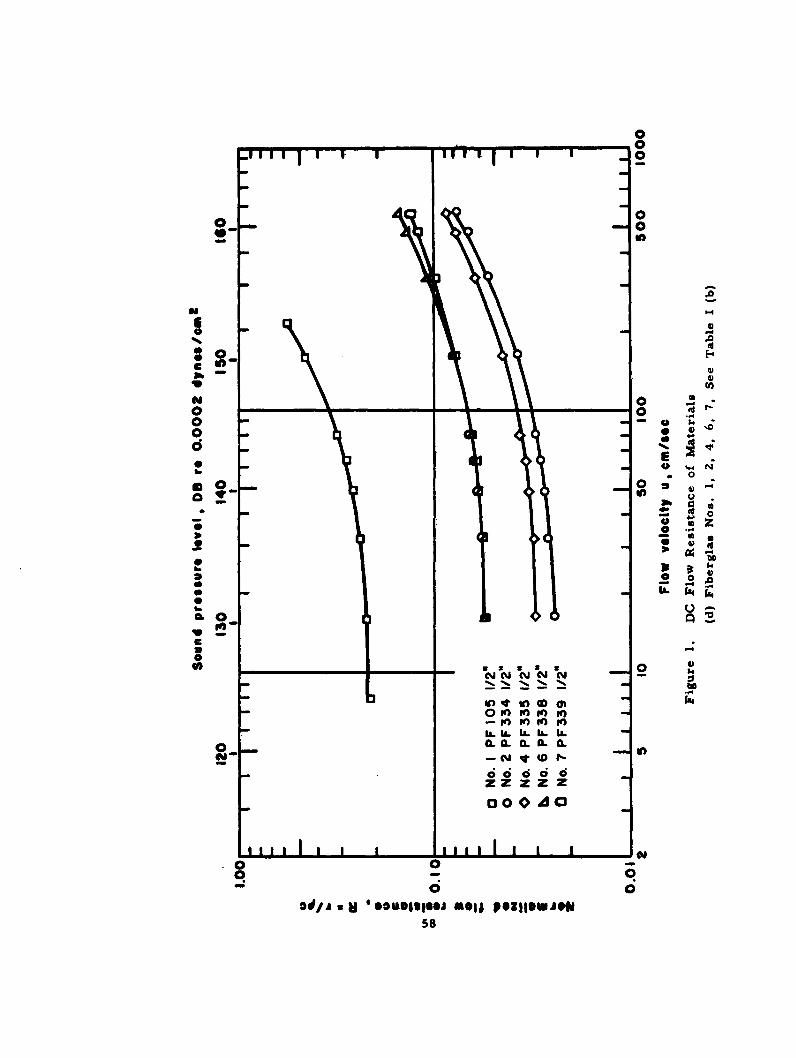
0., UI I t ," 1 I , '-2
o " 0- -0
0'-
C
0 0
0
0
d
o _o
3k
6Z-0
S 0 ~Z
00
o41•~~~ W• to to omoeo•mltp~l~~
t m0 __ ___ ___ __ ___ _ 13 0 A C33
I aL I I I
0 0~~.ao
00 0
041Ai Gsoises~se Sol; P921IS.I.U

0~ I I u f I0
-0
0 00
0
C'-
to04 U
oi
od/A govosloi Me; pzllo io659U

0D 0
U
4).0
3064aC
0-
00
*A 0
0. 7 0
* 60

0
-illijI I I I II I 1 -0
0 0-0
- .0
10
10
o 0
30 0
o 04
Int00
000
owE
61*
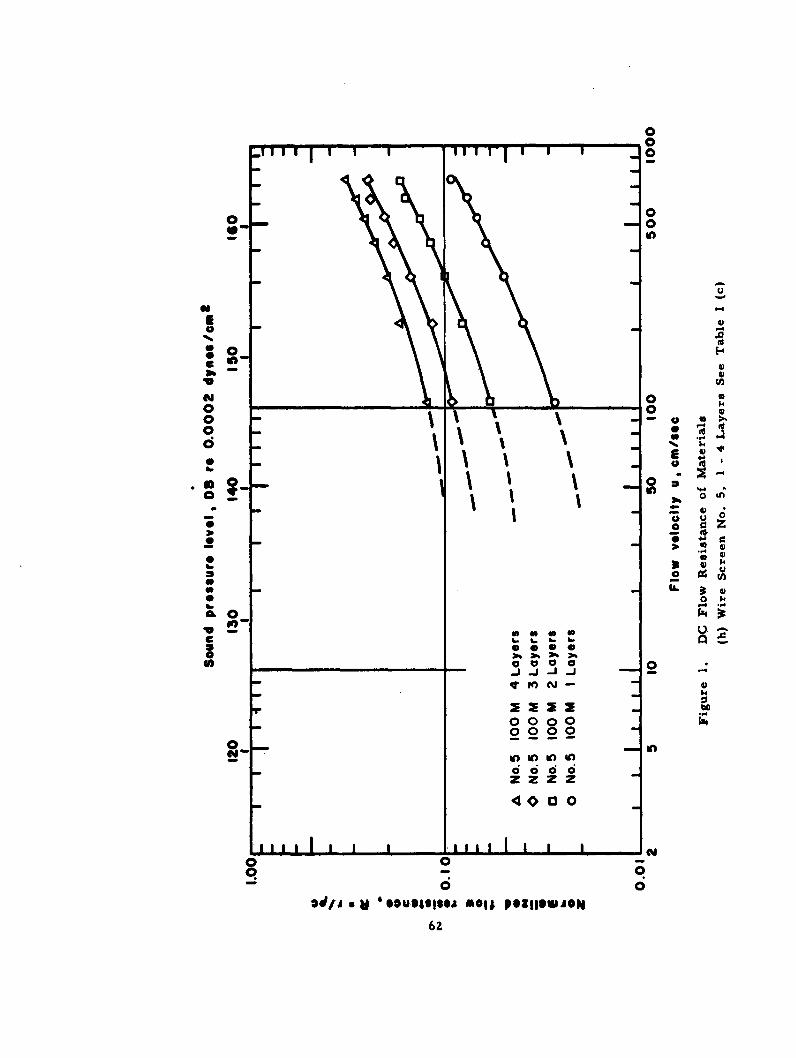
0
-fillI I I _0
0- 0,
#1 In
0.
0 0100
*1 0
In S .
u z
0
a 0 4, 0
0
in In In I
* 6.06
0000
*41/j~00 V U,994MO&PZJWON62

00
00
0
Cd 0
0 0
0
a 00j j -
04
- ~ 0
00 ~
*6

00 -0
a 0
0
5.4
*1 0
644

0-fill1 I! I -I 1I1I1I 1 I I -0
0 0-0
- en
'40
*0
31 0o 00
o 0
f- CD
0000
Di/i~~~~~~~ oaeeailol oloi* 65

00
0
0
-00
In'
'U
0 0 0 0
0 in In0.W*/~~~ ~ ~ ~ ~ UOA -oooO p'OOIonsi u
66V

U) U)
CL IL a
04
0 0 0
CYA
_ _ _ _ _ _ _ _ _ _ _ _ _ _ _ _ _ _ _ _ _
11111 I 11111 II i0
0
S a 4)
400
06
06
0 '
4-4

0.
__ __ _ _0_ 00
."11 l ' ' '" i 'Ii I ' ' ' 9
oS
a.0. . U01.0
,.0 001) -' U
0 06C66
r0 z
684
\ ,, zo
_ * 0
- ., op.. .
__,___,_____,__ __ ___ _o co o .,•
Oil• M' ovi~leJm~l oDI,'O -0
68

li9i C I I1
0) 0E 0
0 ~ )CD)
000 U
00___ ___ 0Z 0
-0oC
coo39 00
0* 0
6 '4
69S

00
CL~o u
*0 0
NY c
C-o00W
00
0 04 gO
00
0~
o 0 -
700

0 00
___ ___ ___ _ _ ___ ____0 0 0I
111it) In In''I
01 V
0
'.4
-o
00 u
43
14 z
0.0 00o' p
*Of/J M'ODUISIIJ 41; OZIIWJS
71.

U) (A
I~I IL ll
5.4
vI~~
in
o 000
0 0
ode~~~~~~~ A O333J O)PRIUO
720
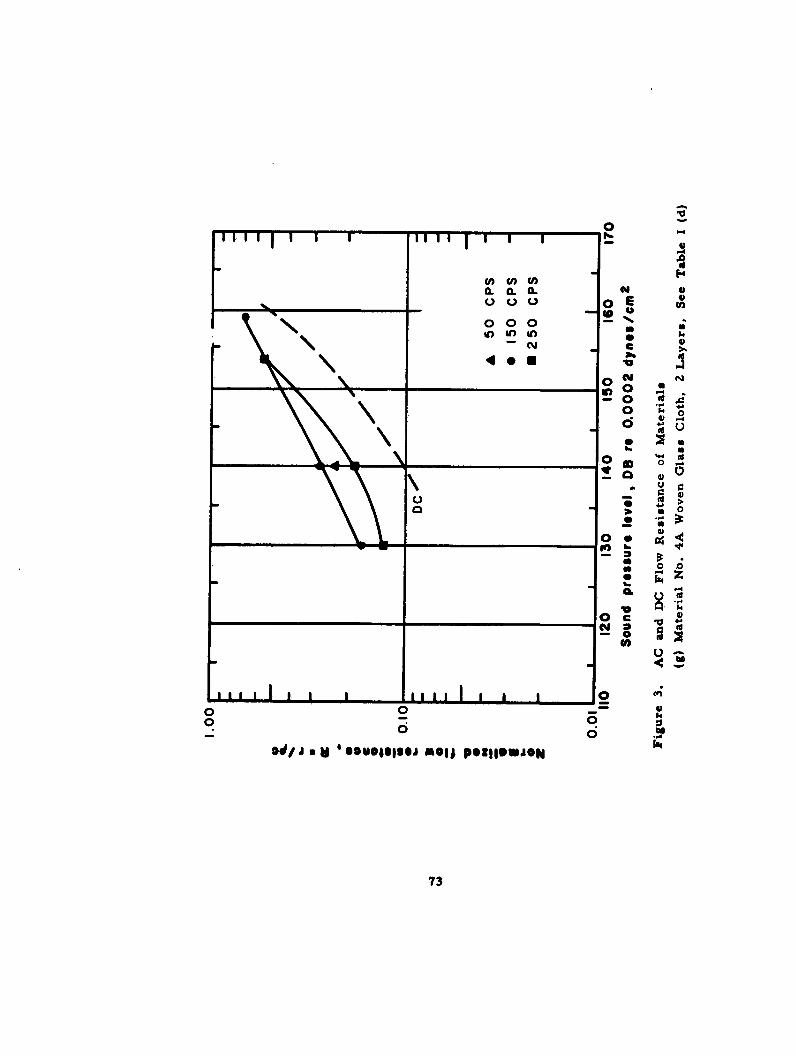
0U) (fU)
()U L)
40u '0
-0 oU~
0 .
0 4 -
0 .
0 C4kv*
.2oeq_ _ _ _ _ _ _ _ _ _ m0 ePI JD J NP
730

- -~~~~ *-*'~ -Irn--0
I 100
I o 01 >
C2 U
0 0
0
Ze O.L J. 4
J4.9
- 4,
w. 4,
0 W
Le, 0
00
744

0
00S -- 0
00
0 0
0 0
% U)
o -.'o C,_ _. "
0o0
"- S N" o:=
00.
LL
L R 0
3o o o
0000 w1u
luo~od'N D l~ll~leooV~l4,noq
75C
L20
Int
100 ON
75

0
00m oo
00
I SI0
0
22___
-L -0- - CO
0. I .
-. U
L*O
Tu z
,a
I M
ZZV' 'a.
~1o
li I.-.
......... ......... .... ijO76

0- r C
0
8 00 000
I 0I -~ U, 4
I~4 0 mo
z*~ r 0
a E'
4A 414
0U-
0 -o
0 9 t" 00 ....
UT-
I 0 st,0
0 0 0 0dy0 a th
IVeOJsd'N ID *vv~.o wiedjosqw77

-0
0
00
I 0 CI 8 00
C 0I 00
L r
0u 0
.00.0
VOO
0U
* G~~~U E...........I $
In T
ML 00'
I
78

0
I 0
I 0
____ 0* 0
0u ~ 0- S
L
0 o0 0 ON
luesod N IDlueolioo vlidosS79I

00
T ~ 0-0
00~
0'o
C,0 0-
- -2
0o
L**
£O*0Z4..
00 VV
00 0
* - L
0~ 0
efpi
el-
10-
800

000
I 00
(I) 0
- ~C.
00
o k0.
1b 0.
ir 91 030
Y~00
~~0 ulI S T
91'0-.
91*0 L C= P
In 91*0
IW w
lueoied 'N I *I*jlgljgg vogadjosqV81

-0
8 0
aIc
.00@
T--
( 0o
o: t~dop:I o
I a 0
I I rLe 0
0 0 to Z
82

0- rr- ,-- r 00
-00
I 0
IE E0 0
yft af
o I 4=
I Z' 0
4A6.
0. a
>0 %. L ZIc31, o* 60 U. Z
£0 v 0L, 0'
0I ZL
0 O
&goojod'N IDves # a5..ioo uolidjosqy
83

0
0000
I. 0
I I 0T-
4009d 'ID &4n~l;oo "Il~e0
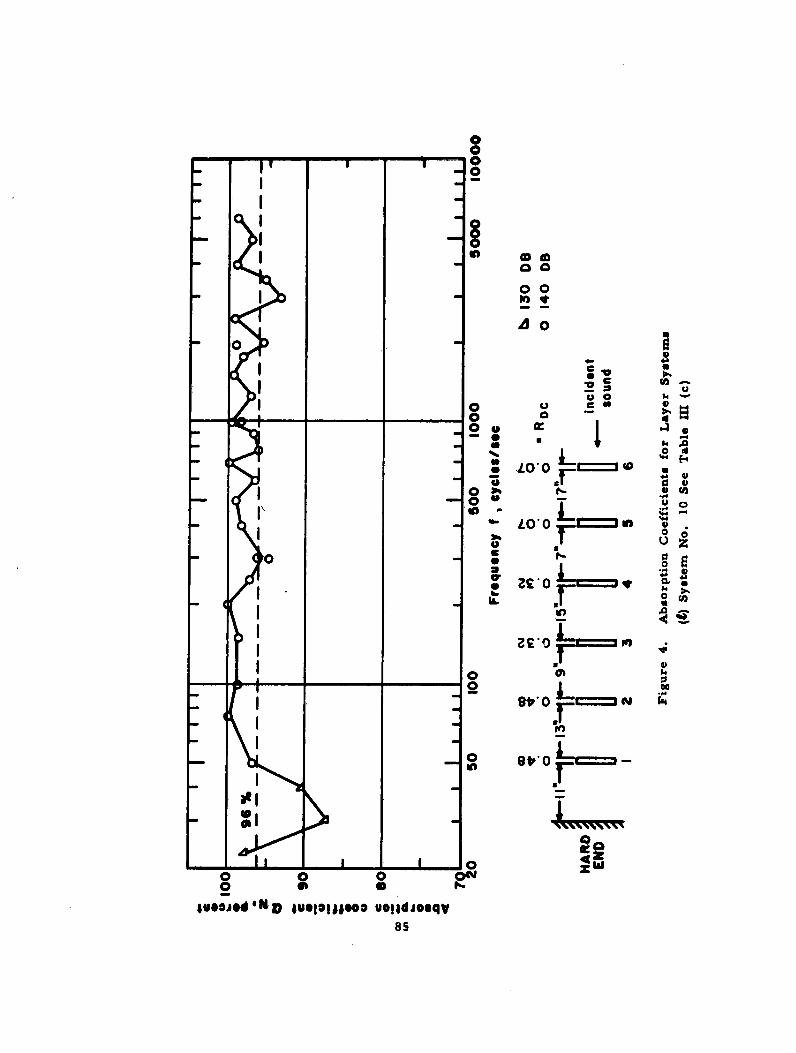
000
I -0
00
0
00
I 0 U0 0
z0*0
00 0
00
P-~-
I 9eoijo h~~j~85U
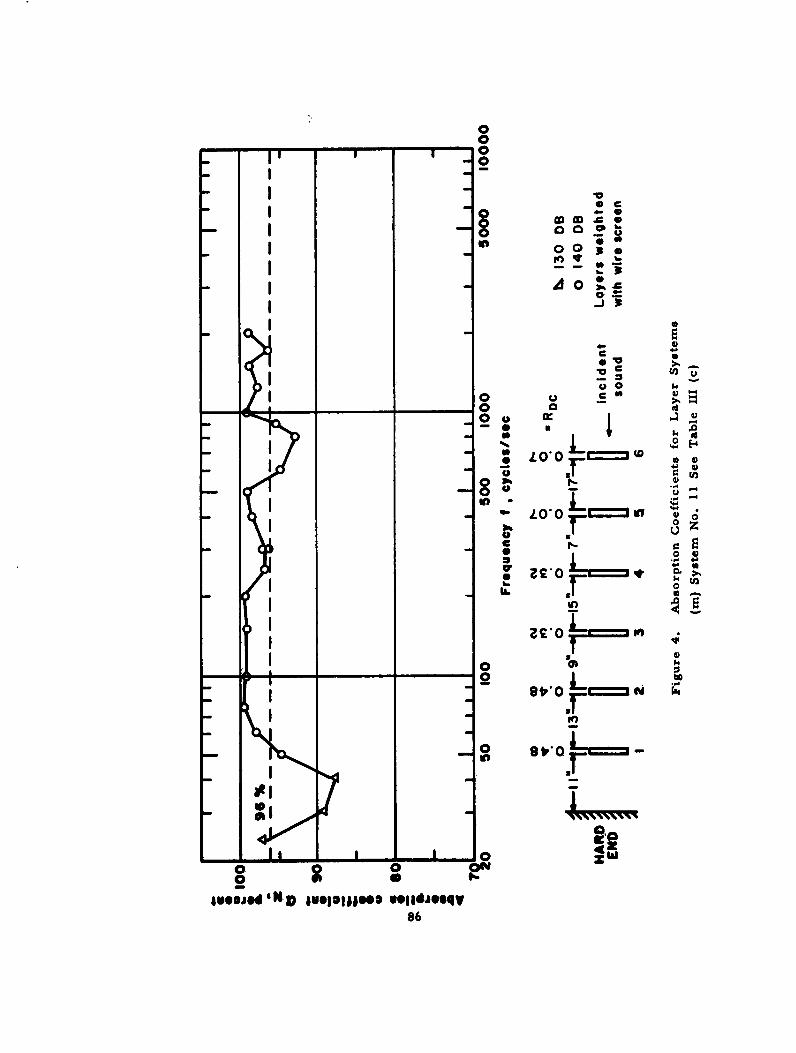
00
0V
0 *0
ec
I ~~0000
I --2
'4
00
a kgI L
9 V Cl -=
9 V 0
I - T
I 0W
wme ONO Ia-.ies oiso
I 86

-~i IDP. i
00
00
I 00
I 00
I 40IL4
II
OV C., t
0_
0 0
0~ -o
87.

0
-0
0 0
T 00
40
Ic
m- rIq
'U
0. ~ 0-. u L
0 U)
LL
0i Is t"-
in u
4p 0 0 C

0
-0
0 0
S"0
40
-2 c
Va..a
l I IaI o
30 o ooo0~ T •
* oU UDlelllooUl~loq
c05
cr 4A)
Mo LOOt
ZVO P4J0n s ~ ....
allv
pooip1 I')d~eq

0
I 0 00
4 00
I 40
0 34-
0 t-
Cu o
0 ~ 0
0
IL LU
I 00
auesj~iN Ve *us 195es ueledj~oeq90
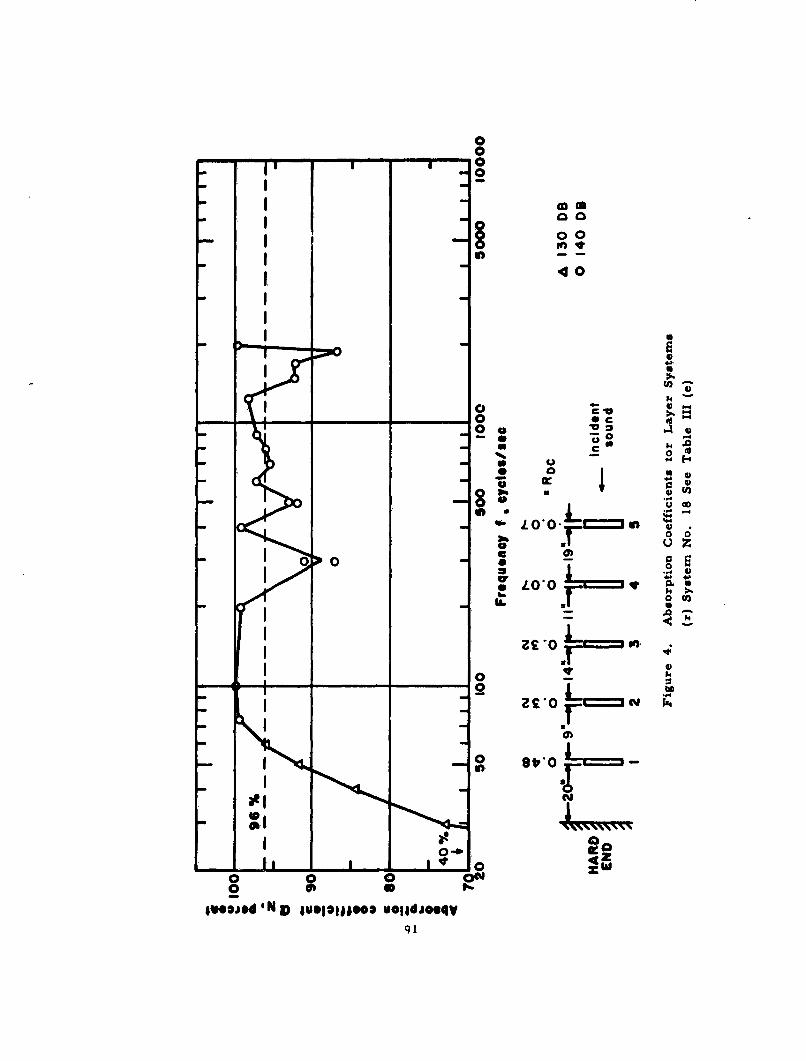
0-0
00
40.
Ul
I~O, C)=S -
_ _ _ _1b 0 a
0 U
0 (a
100a.o
V~ 0
IVS NID l4.olbo vSijo0 l$

-0
00
04
m 1
I 40
4m 4
L 90
9 -,
048 Uci)
I00e NU ooios olj9l92-

0
-0
0 0000
409
400
0N
u
U) Z
0
0 C s4
0 to
SIVD
00 0 V
4"jdNID#o lioould sq93g

0- r 00
0
-0m
00
840.-~
I 0 4)-
C
8 U
uzS 10
I~ U )*4
1 ALj-.~ a 00I F- '0I& LCU
U a
0 f0
I 0C.
94

0
00
I 00to V
I 40
0_- 0
0o mc
IC z
0 co
0 L
ZZ0 0 0W
0 0 0
Avocio 'N~ *V og.l#Ooo uoladjosqy95

0
0 0c
40
Mo 0 C.
0 Q
-0 Ct~ 6......a
leC
* a SIC-Wi 4
IN- 9 adit
I 96

000004
I 00
I 40
IO* C=
2 -
I 0wp V
I0 (l
-04yI 6 0 W *U)1
97I

0- -i*-- -- 00
0I -0
Io co000
c.
Sc
Lo 0 C= a
a__SL 0 '40. 1
efj ~ 0.L c: 0
0t" .......... 0.i
14.I ~.0=~gn
Iw
I 0 I9'

0000
0U
00
0 00
c h.
00
V .
0 p
00
99.
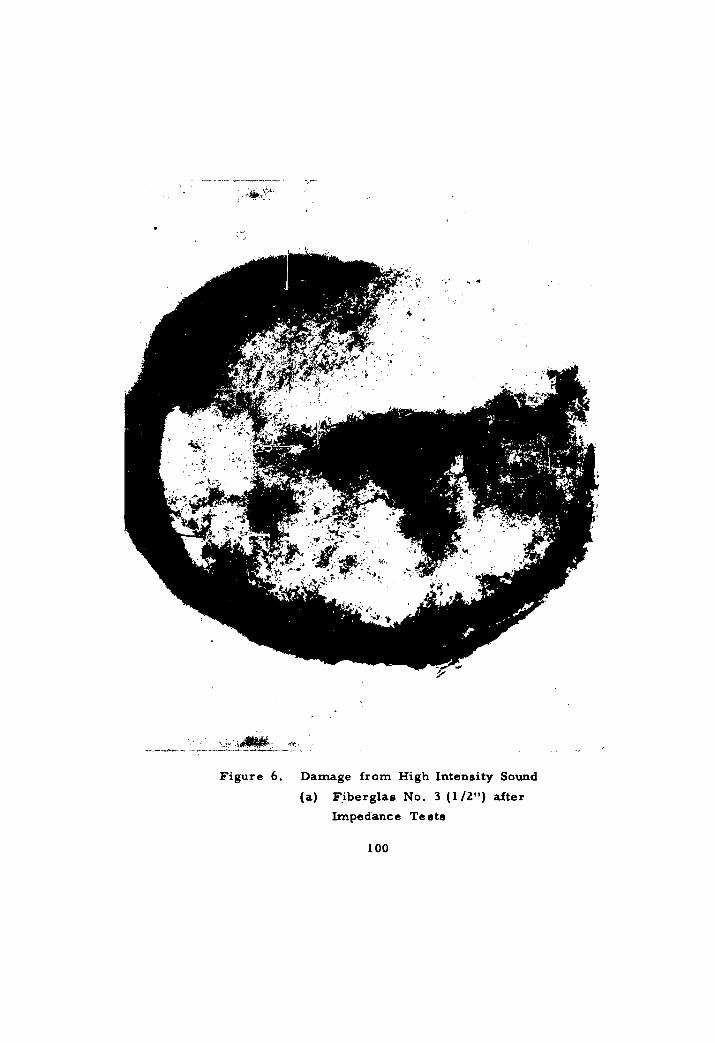
Figure 6. Damage from High Intensity Sound
(a) Fiberglas No. 3 (1/211) after
Impedance Tests
100

Figure 6. Damage from High Intensity Sound
(b) F ibermetal No. 7 after
Impedance Tests
101

*0 0j
0, IA j w/
*Figure 6. Damage from High Intensity Sound
(c) Woven Glass Cloth No. 8 after30 Minutes at 160 db
102

Three segment
wclamping frame,
56" 48" Foam specimen supported aluminum alloybetween screens, 2mesh
stainless steel
Corners dovetailedI and bolted
k-48"
56"
Drill holes for mountingon siren facility 1/2" R. All members
Screen
Foa m
Screen
SFlat head cap screws,..
1/4" x 2* , 510.LC.
Figure 7. Clamping Frame for Extended Life Test
103

41 U)
A4-.
0
p.4
104

40 00N -0
40 (a
404
zS
00
CDa, 0
LL 0 0ID in
44 z0* ".4
0
it0 0* a 0
4-~~ 0.t .
IA. 0
0
105.

+
0
•+. 14.,1 4-
+ +~ ++
- .Direction ofT ' air flow
Joints between
polyurethanepieces
Edges clamped by
Side away from air flow, mounting frame31 breaks in wire screen
________________0 Bolt and l!'D.woshers
" \ Wire lacing
+ + Breaks in screen wire0
+-14
Z+ +
Direction of0 0 air flow
+ +
Side toward air flow,
48 breaks in wire screen
i'igure 10. Location of Breaks in Wire Screens after 78 Hours at 157 db
106

150
140-
130
120
110-
10100
g 9o103 cps
080 160 db SPL
34" Air space (glass tube)
70' 0 50 100 150
&140 -S
130-
120
140
0 Material
100 •A Glass tube
90 103 cps D Impedance tube
1157 db SPL
80 34"Air space (qlass tube)
0 50 100 150Time, minutes
Figure 11. Temperature Rise at 103 cps for Polyurethane,
1/2" No. 3B, 1/4 Wavelength Backing
107

1 4 0 1 1 1 1 I1 7 -' ' Ir
130-
120
C 90 1• 200 cps
157 db SPLso8- 17" Air space (glass tube)
0 50 100 150"-1 701 , 0 i
160-
, 50
40
130 A-
a.
120.- y0 Material
AI Glass tube
110 - 1 Impedance tube
I-.
100
400 cps90 157 db SPL
8.5" Air space (glass tube)s I I I I I p ea t ub
0 50 100 150Time,minutes
Figure 12. Temperature Rise at 200 and 400 cps for
Polyurethane, 1/2" No. 3B, 1/4 Wavelength Backing
108

90
so
C 70
606 foe CSLso 0
1 50 5
505
590 00 ~ a e ' y~
520
90
i90~ CPSma space, 10 0Y~ 6~
Fiue1, Ter"Peratur Rise frSa.~
Ni50 o ssen V.1

}j
Figure 14. Scale Model Showing a Method of SupportingCollapsible Layer Treatment
110

0a
~0
0 0CL /
0r IT j
0 / *0
I..n
E EI
Ii+

P24)
bO
I' !IP4)

o I ,, I VII I'rHi 'ii
o' I 0I
CL
It I IaI C a1 I iII' lii *0 • ! I ilo II I -N',,
V -4,>
rr 11 - AEoJ
a*T I m0
A :5
113

c Cc
cc6) 11
'A oS 2r
U) E
00
0 E
c U)
.000
114o

Figure 19. Drivers and Horn for Low Frequency
Impedance Tube
115

Figure ZO. Drivers for Medium Frequency Impedance Tube
116

144
117

1.0%
a 0
1.0
ma0.5 -5
AX -N
Uf
aC
S0-
0.
0N
-0 .5-
-2 .0
- . .0152.0 2.5 3.C
Normalized resistance , Rarlpc
Figure 22. Normal Incidence Absorption Versus Impedance
118
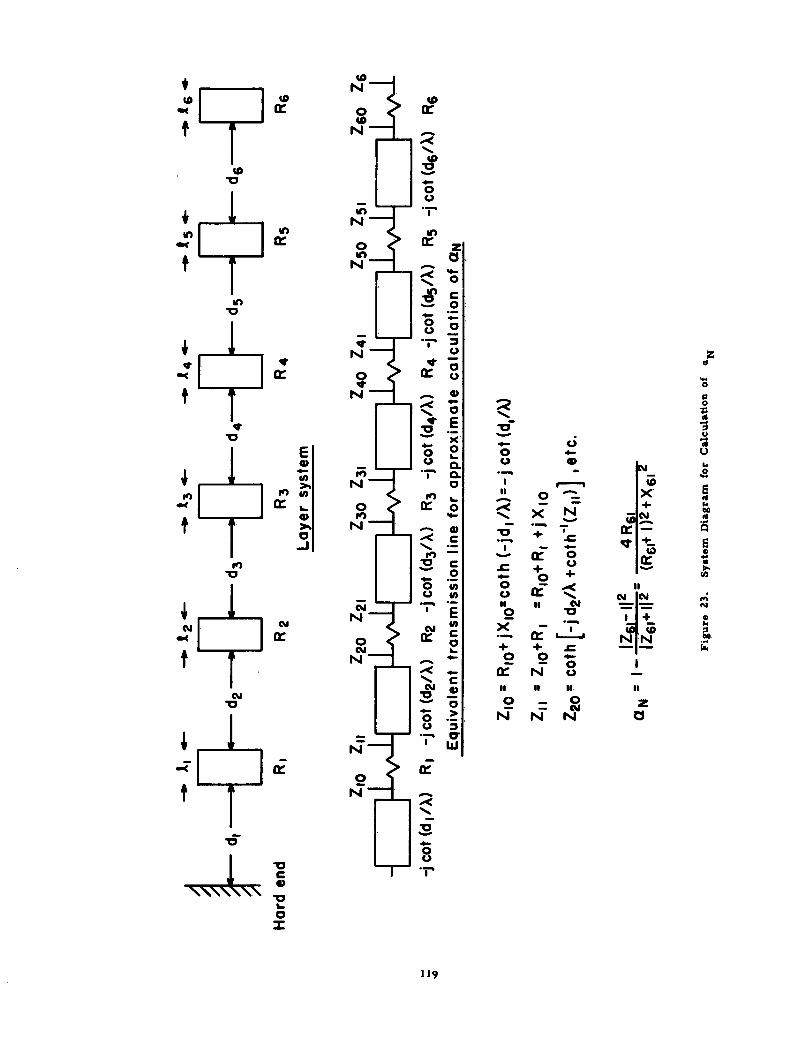
to %D
NID 10<
%DDN0
IIn
0V
00
zz
*00
0 r
+N 16 1.m)a: 0
0 2 .
0 0 0
E 0 0 Ur
0.) 4.)
- .NV0
0i

TABLE I
DESCRIPTION OF MATERIALS
(a) Polyurethane Foam
Normalizedflow resistance
Material Thickness Weight at 140 db
inches lb/ft2 RDC RAC
Polyurethane foam etched, Scott Paper Co.
Black 10-30 pores/inch No. 1 1.0 0.136 <0.03
Gray 45 pores/inch No. 2 1.0 0.131 0.10
Green 60 pores/inch No. 3 1.0 0.147 0.140.5 0.074 0.07
Green 60 pores/inch No. 3A 0.5 0.57 0.07 0.13sandwiched between two20 mesh wire screens
Green 60 pores/inch No. 3B 1.0 0.64 0.14 0.26weighted by two discs of 0.5 0.57 0.07 0.134 mesh hardware cloth
Beige 80 pores/inch No. 4 1.0 0.144 0.320.5 0.072 0.16
Beige 80 pores/inch No. 4B 1.5 0.71 0.48 0.66weighted by two discs of 1.0 0.64 0.32 0.444 mesh hardware cloth O. 5
Polyurethane foam, Du Pont de Nemours Co.
164G 19C/WC-207 No. 5 0.5 2.5
160G 703/WS-603 No. 6 1.0 0.220.5 0.10
120
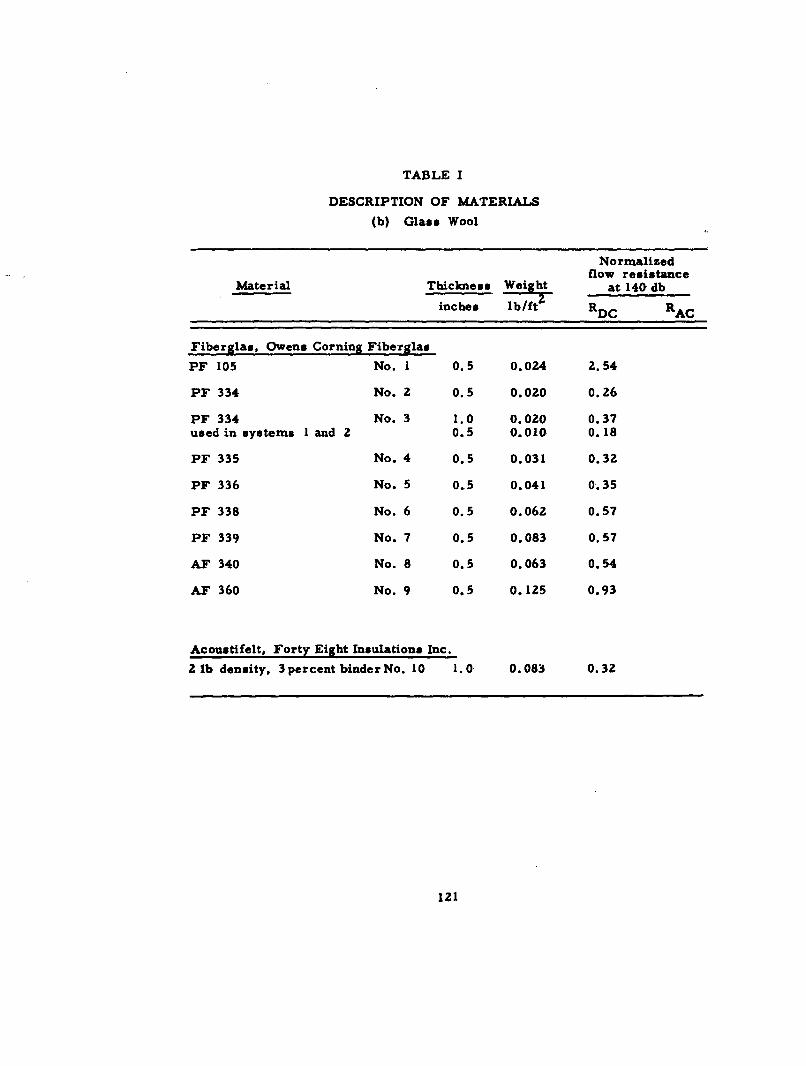
TABLE I
DESCRIPTION OF MATERIALS
(b) Glass Wool
Normalizedflow resistance
Material Thickness Weiht at 140 db
inches lb/ft RDC RAC
Fiberglas, Owens Corning Fiberglas
PF 105 No. 1 0.5 0.024 2.54
PF 334 No. 2 0.5 0.020 0.26
PF 334 No. 3 1.0 0.020 0.37used in systems 1 and 2 0.5 0.010 0.18
PF 335 No. 4 0.5 0.031 0.32
PF 336 No. 5 0.5 0.041 0.35
PF 338 No. 6 0.5 0.062 0.57
PF 339 No. 7 0.5 0.083 0.57
AF 340 No. 8 0.5 0.063 0.54
AF 360 No. 9 0.5 0.125 0.93
Acoustifelt, Forty Eight Insulations Inc.
2 lb density, 3 percent binderNo. 10 1.0 0.083 0.32
121

TABLE .I
DESCRIPTION OF MATERIALS
(c) Metallic Materials
Normalized
Thick- flow resistance
Material ness Weight at 140 db
inches lb/ft RDC RAC
Stainless wire screen, Ludlow-Saylor Wire Cloth Co.
Mesh Wire Opensize diam. area/inch inch
20 0.016 46.2 Type 304 No. 1 0.473 0.0082
50 0.009 30.3 Type 304 No. 2 0.244 0.020
60 0.009 21.3 Type 304 No. 3 0.285 0.022
60 0.011 11.7 Type 304 No. 4 0.429 0.031
100 0.0045 30.3 No. 5 0.121 0.022
100 0.0045 30.3 No. 5A 1.07 0.035 0.09Sandwiched between 220 mesh screens, No. 1
200 0.0021 33.6 No. 6 0.055
200 0.0021 33.6 No. 6A 1.00 0.046Sandwiched between 220 mesh screens, No. I
Fibermetal
Special low resistance sample No. 7 0. 0461 layer
122

TABLE I
DESCRIPTION OF MATERIALS
(d) Woven Glass Cloth
Normalizedflow resistance
Material Thickness Weight at 140 db
inches lb/ft2 RDC RAC
J. P. Stevens Co.
No. 354 cloth, 2 layers No. IA 0.033 0.09sandwiched between 220 mesh wire screens
strand material x 600 No. 2A 0.019chopped, leno weave, 2 layerssandwiched between 220 mesh wire screens
Hess Goldsmith Co.
No. 857, 1 layer No. 3A 0.49sandwiched between 220 mesh wire screens
No. 1-8087, 1 layer No. 4A 0.049 0.12sandwiched between 220 mesh wire screens
Cadillac Plastic Co.
6 oz. No. 5 0.068
7.5 oz. No. 6 0.030
8. 5 oz. No. 7 0.163
10 oz. No. 8 0.060
123
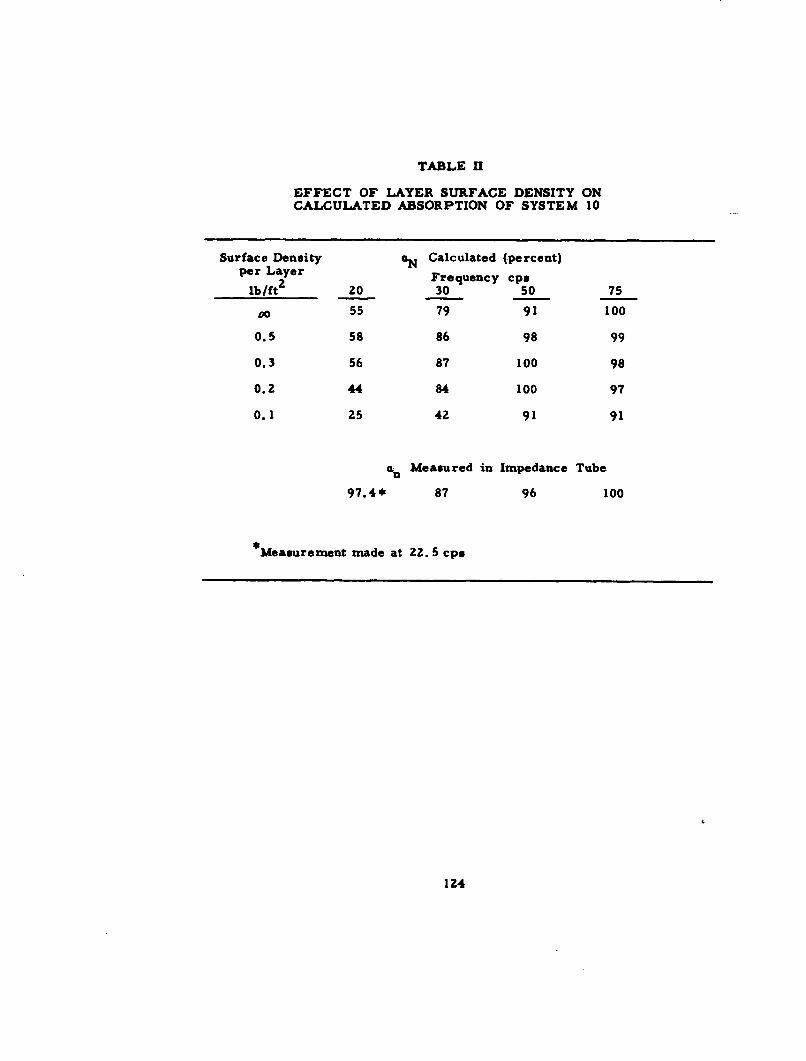
TABLE H
EFFECT OF LAYER SURFACE DENSITY ONCALCULATED ABSORPTION OF SYSTEM 10
Surface Density aN Calculated (percent)
per Layer Frequency cps
lb/ft 2 20 30 50 75
00 55 79 91 100
0.5 58 86 98 99
0.3 56 87 100 98
O.2 44 84 100 97
0.1 25 42 91 91
an Measured in Impedance Tube
97.4* 87 96 100
*Measurement made at 22. 5 cps
124

TABLE III
DESCRIPTION OF LAYER SYSTEMS
(a) Systems 1 - 4
Cleardistance Thick- Normalized
to ness Weight flow resistanceLayer previous each each each layer
no. layer layer layer Material at 140 db.
inches inches lbs/ft 2 (see Table I) RDC RAC
System No. I
1 7 1.0 0.020 G.W.-No. 3 (1/211+1/2") 0.372 9 1 . 0 " " "3 11 1.0 It of4 1 3 1 . 0 ... I5 15 1.0 " "
6 17 1.0 "t it
System No. 2
1 17 1.0 0.020 G.W. -No. 3 (1/2"+1/2") 0.372 15 1.0 to "3 13 1.0 " "
4 11 1.0 i"5 9 1.06 7 1.0 " It
System No. 3
1 7 1.5 0.216 P.U.-No. 4 (1" + 1/12,) 0.48 0.662 9 1 . 5 "1 " " t3 11 1.0 0.144 P.U.-No. 4(1") 0.32 0.444 13 1.0 " " " "5 15 0.5 0.074 P.U.-No. 3 (1/2") 0.07 0.136 17 0.5 t of
System No. 4
1 17 1.5 0.216 P.U.-No. 4(1" + 1/2") 0.48 0.662 15 1.5 " of "3 13 1.0 0.144 P.U.-No. 4(1") 0.32 0.444 1 1 1 . 0 " t " "
5 9 0.5 0.074 P.U.-No. 3(1/2") 0.07 0.136 7 0.5 " " "
IZ5

TABLE III
DESCRIPTION OF LAYER SYSTEMS
(b) Systems 5 - 8
Clear Normalizeddistance Thick- flow resistance
to ness Weight each layerLayer previous each each at 140 db.
no. layer layer layer Material
inches inches lbs/ft2 (see Table I) RDC R.AC
System No. 5
1 12 1.5 0.216 P.U. -No. 4 (1" + 1/2") 0.48 0.662 12 1.5 " " "1 of3 12 1.0 0.144 P.U.-No. 4(11") 0.32 0.444 12 1.0 " " " o5 12 0.5 0.074 P.U.-No. 3 (1/2") 0.07 0.136 12 0.5 " t " "
System No. 6
1 14 1.5 0.216 P.U.-No. 4(1"+ 1/2") 0.48 0.662 1 0 1 . 5 f " " "3 14 1.0 0.144 P.U.-No. 4(1-") 0.32 0.444 1 0 1 . 0 " " ' "5 14 0.5 0.074 P.U.-No. 3 (1/2") 0.07 0.136 10 0.5 It ''
System No. 7
1 7 0.5 0.072 P.U.-No. 4(1/2") 0.16 0.222 9 0.5 " If to "0
3 11 0.5 " " of4 13 0.5 " I to5 15 0.5' of " "
6 17 0.5 of "
System No. 8
1 7 1.0 0.082 G.W. -No. 5 (1/2", + 1/211) 0.72 9 1.0 t " i3 11 1.0 " of4 13 1.0 t o'5 is 1.0 ""
6 17 1.0 " "
126

TABLE III
DESCRIPTION OF LAYER SYSTEMS
(c) Systems 9 - 11
Clear Normalizeddistance Thick - flow resistance
to ness Weight each layerLayer previous each each at 140 db.
no. layer layer layer Material
inches inches lb/ft2 (see Table I) RA_.RC
System No. 9
1 17 1.5 0.216 P.U.-No. 4 (1" + 1/2") 0.48 0.662 11 1.5 " it o3 15 1.0 0.144 P.U. -No. 4(1") 0.32 0.444 9 1.0 t If "5 13 0.5 0.074 P.U. -No. 3(1/2") 0.07 0.136 7 0.5 " " " "
System No. 10
1 11 1.5 0.216 P.U.-No. 4(1" + 1/2") 0.48 0.662 1 3 1 . 5 " o f " "3 9 1.0 0.144 P.U.-No.4 (1") 0.32 0.444 15 1.0 " " " "5 7 0.5 0.074 P.U.-No. 3(1/2") 0.07 0.136 17 0.5 " it
System No. 11
1 11 1.5 0.71 P.U. -No. 4B (1"+1/2") 0.48 0.662 13 1.5 " " " "
3 9 1.0 0.64 P.U. -No. 4B (1") 0.32 0.444 1 5 1 . 0 "t " " t5 7 0.5 0.57 P.U. -No. 3B (1/2") 0.07 0.136 17 0.5 " " t o
*System No. 11 differed from System No. 10 in having each layer weighted bytwo 2. 5" diameter discs of hardware cloth, 1/4" mesh, 0. 029 wire diameter.
127

TABLE HI
DESCRIPTION OF LAYER SYSTEMS
(d) Systems 14 - 17
Clear Normalizeddistance Thick- flow resistance
to ness Weight each layerLayer previous each each at 140 db.
no. layer layer layer Material
inches inches lb/ft (see Table I) RDC RAC
System No. 14
1 30 1.5 0.71 P.U.-No. 4B (1" + 1/2") 0.48 0.662 11 1.5 of 1 if
3 15 1.0 0.64 P.U.-No. 4B (11) 0.32 0.444 9 1.0 " it ,, t5 13 0.5 0.57 P.U.-No. 3B(I/21t) 0.07 0.136 7 0.5 so to If it
System No. 15
1 30 1.5 0.71 P.U.-No. 4B (1" + 1/2") 0.48 0.662 7 1. 5 " " it it3 13 1.0 0.64 P.U.-No. 4B (1") 0.32 0.444 9 1.0 it It ,,5 11 0.5 0.57 P.U.-No. 3B (1/2") 0.07 0.136 15 0.5 of ,, to t
System No. 16
1 30 1.5 0.71 P.U.-No. 4B (I" + 1/2") 0.48 0.662 11 1.0 0.64 P.U.-No. 4B (1") 0.32 0.443 9 1 . 0 " " " "4 15 0.5 0.57 P.U.-No. 3B (1/2") 0.07 0.135 7 0.5 " t " "
System No. 17
1 30 1.5 0.71 P.U.-No. 4B (I" + 1/2") 0.48 0.662 9 1.0 0.64 p.U.-No. 4B (1") 0.32 0.443 11 1.0 is" " "4 7 0.5 0.57 P.U.-No. 3B (1/21t) 0.07 0.135 15 0.5 " "
128

TABLE III
DESCRIPTION OF LAYER SYSTEMS
(e) Systems 18 - 21
Clear Normalizeddistance Thick- flow resistance
to ness Weight each layerLayer previous each each at 140 db.
no. layer layer layer Material
inches inches lb/ft2 (see Table I) RDC RAC
System No. 18
1 20 1 5 0.71 P.U. -No. 4B (1" + 1/2") 0.48 0.662 8 1.0 0.64 P.U. -No. 4B (1") 0.32 0.443 14 1.0 " I t "4 11 0.5 0.57 P.U. -No. 3B (1/2") 0.07 0.135 19 0.5 it it " to
System No. 19
1 20 1.5 0.71 P.U.-No. 4B (1" + 1/2") 0.48 0.662 11 1.0 0.64 P.U. -No. 4B (1") 0.32 0.443 19 1.0 " " " "4 8 0.5 0.57 P.U. -No. 3B (1/2") 0.07 0.135 14 0.5 to 0I of
System No. 20
1 30 1.5 0.71 P.U.-No. 4B (I" + 1/2-) 0.48 0.662 9 1. 5 It " o "3 11 1.0 0.64 P.U.-No. 4B (1") 0.32 0.444 7 1.0 i of of to5 15 0.5 0.57 P.U. -No. 3B (1/2") 0.07 0.13
System No. 21
1 30 1.5 0.71 P.U.-No. 4B (1" + I/2,,) 0.48 0.662 9 1.5 " " " "3 11 1.0 0.64 P.U.-No. 4B (1") 0.32 0.444 7 1.0 " P.U. -No. 3B (1") 0.14 0.265 15 0.5 0.57 P.U. -No. 3B (1/2") 0.07 0.13
129

TABLE III
DESCRIPTION OF LAYER SYSTEMS
(f) Systems 22 - 25
Clear Normalizeddistance Thick- flow resistance
to ness Weight each layerLayer previous each each at 140 db.
no. layer layer layer Material
inches inches lb/ft 2 (see Table I) RDC R.AC
System No. 22
1 20 1.5 0.71 P.U.-No. 4B (1" + 1/2") 0.48 0.662 11 1.0 0.64 P.U.-No. 4B (1") 0.32 0.443 8 1.0 11,i ,it o4 19 1.0 0.64 P.U.-No. 3B (1") 0.14 0.265 14 0.5 0.57 P.U.-No. 3B (1/2") 0.07 0.13
System No. 23
1 20 1.5 0.71 P.U.-No. 4B (1"I + 1/2") 0.48 0.662 11 1.5 " ,, o'3 8 1.0 0.64 P.U.-No. 4B (11") 0.32 0.444 19 1.0 0.64 P.U.-No. 3B (1"1) 0.14 0.265 14 0.5 0.57 P.U.-No. 3B (1/2") 0.07 0.13
"System No. 24
1 11 1.5 0.71 P.U.-No. 4B (1" + 1/2") 0.48 0.662 13 1.5 ,i of it I,
3 9 1.0 0.64 P.U.-No. 4B (1") 0.32 0.444 6 1.0 " " " "
5 10 1.0 0.64 P.U.-No. 3B (1") 0.14 0.266 8 0.5 0.57 P.U. -No. 3B (1/2") 0.07 0.137 15 0.5 of "o "1 of
System No. 25 (System No. 11 collapsed, 30" to ceiling)
1 30 1.5 0.71 P.U.-No. 4B (1" + 1/2") 0.48 0.662 1 1.5 of "1 of to3 1 1.0 0.64 P.U.-No. 4B (1") 0.32 0.444 1 1.0 " " "5 1 0.5 0.57 P.U.-No. 3B (1/2") 0.07 0.136 1 0.5 t t o "
130

TABLE IV
IMPEDANCE TUBE SPECIFICATIONS
Impedance tube Low Medium High
Diameter, inches 3 3 0.76
Length, inches 240 36 15
Frequencyrange - cps 20 - 300 300 - 2000 1500 - 6000
Drivers 49 Cone 16 Horn 2 Hornspeakers drivers drivers
Microphones Massa Massa MassaM-101 M-213 M-213
131

TABLE V
LIST OF DRIVING EQUIPMENT
Oscillator
Hewlett Packard model 200 AB
Attenuators
Daven Attenuators
0 - I db in 0. 1 db steps, type 2506
0 - 10 dbin 1.0db steps, type 2511
0 - 100 dbin 10.0db steps, type 2513
Power Amplifiers
Mc Intosh model M-60 audio amplifier
Callidyne model 68 vibration test amplifier
M. B. model T-51 vibration test amplifier
132

TABLE VI
LIST OF MEASURING EQUIPMENT
Low Frequency Impedance Tube Microphone Systems
Massa M-101 microphone
Massa M-103 preamplifier
Massa M-104 amplifier and power supply
Medium and High Frequency Impedance Tubes Microphone Systems
Massa M-213 microphone
Massa M-114 preamplifier
Massa M-185 amplifier and power supply
Western Electro'-Acoustic Lab. Type 100 E amplifier
Attenuators
Daven attenuators
0 - 1 db in 0. 1 db steps, type 2506
0- 10 dbin 1.0 db steps, type 2511r
0 - 100 db in 10.0 db steps, type 2513
Filters
Allison vairable low pass and high pass filters, model 2-BR
Scott sound analyzer, type 420A
Voltmeter
Ballantine electronic voltmeter, model 300
Oscilloscope
Dumont, type 304 H
133
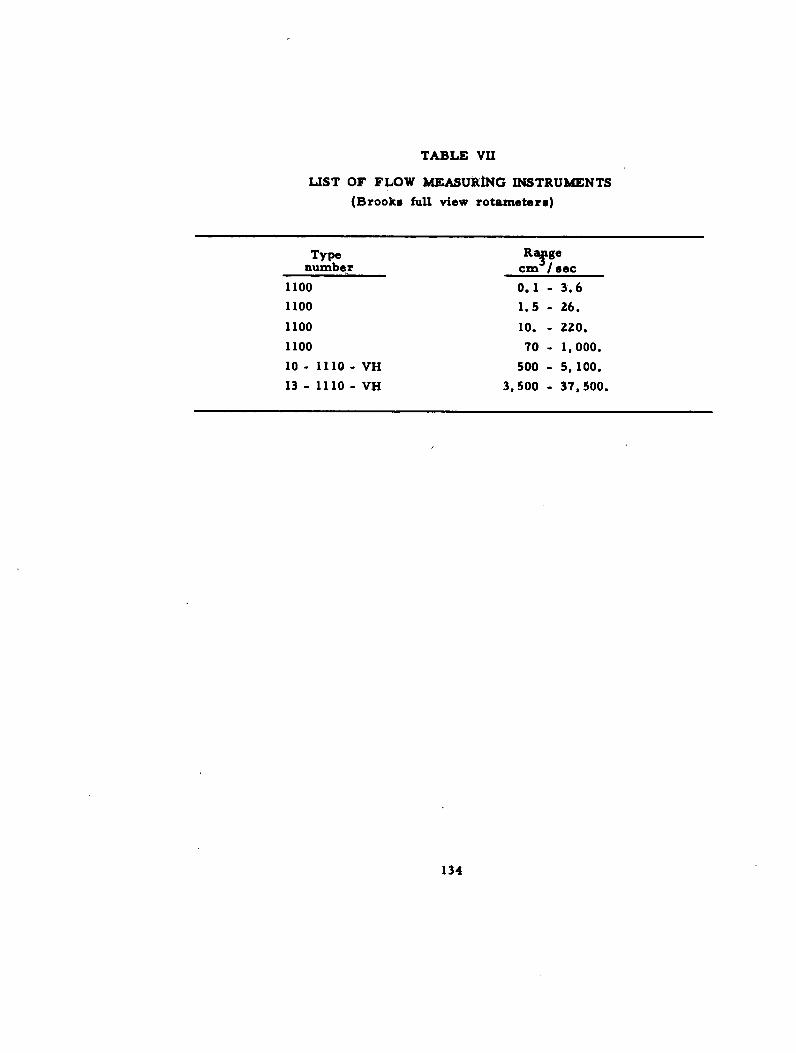
TABLE VII
LIST OF FLOW MEASURING INSTRUMENTS
(Brooks full view rotameterm)
Type Rafge
number cm / sec
1100 0.1 - 3.6
1100 1.5 - 26.
1100 10. - 220.
1100 70 - 1,000.
10- 1110- VH 500 - 5,100.
13- 1110- VH 3,500 - 37,500.
134

TABLE VIII
CALCULATED ABSORPTION COEFFICIENTS FOR SIX LAYER
SYSTEMS WITH EQUAL RESISTANCE PER LAYER AND SPACINGS
OF SYSTEM NO. 1
RAC per layer .1 0.2 0.3 0.4 0.5
Frequency aLNcps percent
50. 71 93 99 99 97
94.4 94 95 95100 65 87 94 95 96
141 78 95
200 72 97472 80 80 81
500 53 74 83 87 89
519 94 96 96
135

TABLE IX
CALCULATED ABSORPTIONS, ASD ROOM
Surface, ft 2 Area, ft 2 0N/lOO A, Sabins
Untreated room
Floor 50 x 70 3,500 0.02 70Ceiling 50 x 70 3,500 0.02 70Walls 2%40(70 + 50) 9,600 0.02 192
16,600 0.02 Av. 332
Extended treatment
Floor 50 x 70 3,500 0.02 70Ceiling 38 x 38 2,204 0.96 2,120Walls 2134(58 + 38) 6,528 0.96 6,270
12,232 0.69 Av. 8,460
Collapsed treatment
Floor 50 x 70 3,500 0.02 70Ceiling 38 x 38 2,204 0.90 1,984Walls (concrete)
2%30 x (50 + 70) 7,200 0.02 144Walls (vertical)
2x6.5 x(38 + 58) 1,248 0.90 1,123Walls (horizontal)
2x6 x (38 + 70) 1,296 0.90 1,166
15,448 0.29 Av. 4,487
Collapsed treatment (ceiling panels removed)
Floor 50 x 70 3,500 0.02 70Ceiling 38 x 38 2,204 0.02 44Walls (concrete)
2x30 x (50 + 70) 7,200 0.02 144Walls (vertical)
2lO x (38 + 58) 1,9O0 0.90 1.728Walls (horizontal)
2x6 x(38 + 70) 1,296 0.90 1.16616,120 0.20 Av. 3,152
136

TABLE X
REVERBERATION TIMES, ASD ROOM
Treatment A, Sabins V, ft 3 T, sec
Untreated 332 140,000 20.7
Extended treatment 8,460 " 0.8
Collapsed treatment 4,487 " 1.5
Collapsed treatmentwith ceiling treatment 2removed 3,152 2.2
This value is given for comparison purposes only, since reverberant fieldconditions do not hold in this case.
137

TABLE XI
DIFFERENCES BETWEEN TOTAL SOUND LEVEL AND DIRECT
SOUND LEVEL FOR A NON-DIRECTIONAL SOURCE IN ASD ROOM
Room condition R = A Total level minus direct level1 -,,
a 10 ft. 20 ft.
Extended treatment 27,300 ft 0 db 0 db
Collapsed treatment 6,340 3 6
Collapsed treatmentwith ceiling treatmentremoved 3,940 4 9
No treatment 339 14 19
138

-. u.
w-0i u..~'
.N -2
ýv - .- Z -
Ox.~ u 0 0, 0A.
-) 0w'-. z ~ - w-0 ý, 000u , 0. >, 0 u-0 'u 0.I ,2 o'ok~ 04I,
0 .' -AUI 0 'd Vj -. E
0. 10 m j Oý 0 0"0 4 0 -IO . .
-0 1 ).0'~ , al -,0 , a,* g.
P, NN r
0 '0 0 N
a,0 0,0
mI 0 ~ 0,N. '
-u -0> t
Uý 0 k0 COLC
o 0 0 0 v 0 w 0Q.ý , u k 0 ' -0 -0 * 0 0 400 ,r m V ,0 f.0 E
U 0 a, 0 a n, ;j v
-4( - .0 - ..:1: z 3 0 a. 0 .. k
N 0wIto '0 - 0 '0 1- Z r-0.
- mo 0 0c 0,o 0 a *0 011 4) 0 -0 014 a, X~o0~
U- 0 O. *