development of a methodology for the delineation of …
TRANSCRIPT

DEVELOPMENT OF A METHODOLOGY FOR
THE DELINEATION OF AIR QUALITY MANAGEMENT
AREAS IN SOUTH AFRICA
By
Gregory MacDonald Scott
M.Sc.
Submitted in fulfilment of the academic requirements
for the degree of Doctor of Philosophy in the
School of Environmental Sciences
University of KwaZulu-Natal
Durban
May 2010

ii
As the candidate’s Supervisor, I have / have not approved this thesis for submission:
Signed:______ _______________________Name: R. Diab
Date: 28 May 2010

iii
Abstract
Since 1992 the Department of Environmental Affairs and Tourism (DEAT), now the
Department of Environmental Affairs (DEA), acknowledged that pollution and waste
management governance was inadequate in dealing with South Africa’s changing social and
industrial context. This triggered an extensive legislative revision, with the new National
Environmental Management: Air Quality Act (No. 39 of 2004) (AQA) being partially
implemented on 11 September 2005 and full implementation expected by 1 April 2010.
The goal of this research was to develop a methodology for the delineation of the boundaries of
air quality management areas in South Africa. The preliminary objective of the research was to
identify the specific criteria that should be considered when developing the methodology. A
review of the methodologies used internationally was undertaken, looking specifically at regions
and countries with similar effects-based air quality legislation. The review concluded that the
international practice regarding boundary determination was data intensive, relying heavily on
the results of ambient air quality monitoring and the results of dispersion modelling based on
comprehensive emissions inventories. Another commonality between the methodologies was
the use of administrative boundaries as the borders of air quality management areas. South
Africa has limited ambient air quality monitoring and there is no national emissions inventory
for criteria pollutants. In the absence of this information an alternative approach was required.
The next objective of the research was to identify or develop a proxy methodology for assessing
the impact of each of these criteria to be used in the boundary determination. The criteria
assessed as part of this research included, population density, emission criteria (industrial,
mining and domestic), topography and administrative boundaries. A further objective of the
research was to combine all the criteria to produce a single indicator or value as to the air
pollution impact potential of the area under consideration. This methodology was then applied
in the South African context. The final objective of the research was to assess the results of the
application of the methodology on the regulatory framework proposed by the AQA, at the
national, provincial and local government levels.
The methodology has proved successful in the identification of areas with high air pollution
impact potential in South Africa. This has allowed for a review of the boundaries proclaimed for
the Vaal Triangle Airshed Priority Area and the Highveld Priority Area. In both cases
significant revisions of the boundaries are recommended, however due to the controversial
nature of these recommendations, it is proposed that these revisions are deferred until the five-

iv
yearly review phase of the priority area management plan. The results also recommended the
proclamation of two additional national priority areas. The first was the proposed Magaliesberg
Priority Area, which covers the north-western areas of Gauteng and the eastern areas of the
North-West. This area combines the high density residential, commercial and industrial areas of
Gauteng with the high density mining and industrial areas of the North-West. However, it is
recommended that further ambient air quality monitoring and research is required prior to the
proclamation of this national priority area. The second new national priority area proposed is the
Waterberg Priority Area. This proclamation is a proactive declaration based on the proposed
industrial developments earmarked for this area. Due to extensive coal reserves in the area, the
development of additional coal-fired power generation, a coal to liquid facility and other coal
beneficiation projects are currently under consideration.
The research has identified five potential provincial priority areas. The provincial priority areas
are associated with the major metropolitan centres in the country and their adjacent district
municipalities. All of the proposed provincial priority areas, with the exception of the one
proposed in Gauteng, require further ambient air quality monitoring and research prior to their
proclamation. It is recommended that the City of Johannesburg / City of Tshwane provincial
priority area be considered for immediate declaration.
The review of the district and local municipalities identified in Table 24 of the National
Framework highlighted the conservative nature of the initial assessment. The review amended
the classification of 33 of the local municipalities, with 32 being reclassified downwards and
only one being reclassified upwards. This also highlighted the subjective nature of the initial
assessment. It is recommended that the local municipalities identified as having “Poor” or
“Potentially Poor” air quality rating, be prioritised as potential sites in the national ambient air
quality monitoring network and receive assistance in the development of their air quality
management plans. This ensures that the limited financial and human resources assigned to air
quality management in South Africa are deployed in those areas with the greatest need.

v
Preface
The work described in this thesis was carried out in the School of Environmental Sciences,
University of KwaZulu-Natal, between July 2003 and May 2010, under the supervision of
Professor Roseanne D. Diab, in fulfilment of the academic requirements for the degree of
Doctor of Philosophy.
This study represents the original work undertaken by the author and has not been submitted in
any other form to another university. Where use has been made of the work of others, it has
been duly acknowledged in the text.

vi
Declaration - Plagiarism
I, Gregory MacDonald Scott declare that
1. The research reported in this thesis, except where otherwise indicated, is my
original research.
2. This thesis has not been submitted for any degree or examination at any other
university.
3. This thesis does not contain other persons’ data, pictures, graphs or other
information, unless specifically acknowledged as being sourced from other persons.
4. This thesis does not contain other persons' writing, unless specifically
acknowledged as being sourced from other researchers. Where other written
sources have been quoted, then:
a. Their words have been re-written but the general information attributed to them
has been referenced
b. Where their exact words have been used, then their writing has been placed in
italics and inside quotation marks, and referenced.
5. This thesis does not contain text, graphics or tables copied and pasted from the
Internet, unless specifically acknowledged, and the source being detailed in the
thesis and in the References sections.
Signed: …………………………………………………………Date:……………………………

vii
Acknowledgements
The author would like to express sincere gratitude to the following individuals and organisations
for their assistance during this research:
To my wife Jeanne, son Bryce and daughter Amber, thanks for your support and enthusiasm
during this time. Without your love and patience this would have never been possible.
To my parents Ralph and Judy, your support and good humour have helped to lighten the load
when I needed it. To my mother-in-law Roni, your support and encouragement have been
amazing, special thanks for baby-sitting the kids over all those weekends when I was finishing
up, much appreciated.
To my supervisor, Roseanne, thanks for your support and guidance over this long journey. It has
been my privilege to study under your guidance. Your impact at the university will be sorely
missed, but enjoy your retirement.
To my mentors, Dr Mark Zunckel and Mr Rob Hounsome, thanks for encouraging me to
undertake this research. While we have all gone our separate ways we still remain good friends
and golfing buddies.
To my former colleague, Mr Atham Raghunandan, thanks for your assistance with the data
processing in the preliminary stages of the research.
To the Department of Environmental Affairs, specifically Mr Peter Lukey, thanks for supporting
my research through access to the APPA Registration Certificate database. Thanks also to Mr
Deon Marais for the assistance with the GIS analysis and mapping.
The CSIR is acknowledged for the financial assistance provided in the preliminary stages of this
research and for funding the international study trip.

viii
TABLE OF CONTENTS
Abstract ........................................................................................................................................ iii
Preface ........................................................................................................................................... v
Acknowledgements ..................................................................................................................... vii
List of Figures ............................................................................................................................... x
List of Tables ............................................................................................................................... xii
List of Acronyms ........................................................................................................................ xiv
CHAPTER ONE - INTRODUCTION
1.1 Background .................................................................................................................. 1
1.2 Goal .............................................................................................................................. 7
1.3 Structure of the Thesis ................................................................................................. 8
CHAPTER TWO - HISTORY OF AIR QUALITY MANAGEMENT IN SOUTH AFRICA
2.1 Introduction .................................................................................................................. 9
2.2 Early Period Prior to 1965 ........................................................................................... 9
2.3 Atmospheric Pollution Prevention Act ...................................................................... 10
2.3.1 Control of Noxious and Offensive Gases ............................................................ 11
2.3.2 Control of Smoke ................................................................................................ 11
2.3.3 Control of Dust .................................................................................................... 12
2.3.4 Control of Vehicle Emissions ............................................................................. 13
2.3.5 Critical Analysis of APPA and Air Quality Status in South Africa .................... 13
2.4 The Constitution and Air Quality Management ......................................................... 18
2.5 Environmental Law Reform and Air Quality Management ....................................... 20
2.6 National Environmental Management: Air Quality Act ............................................ 21
2.6.1 Introduction ......................................................................................................... 21
2.6.2 Passage of the Air Quality Bill ............................................................................ 22
2.6.3 Critical Analysis of AQA .................................................................................... 23
CHAPTER THREE - REVIEW OF INTERNATIONAL APPROACHES TO AIR QUALITY MANAGEMENT
3.1 Introduction ................................................................................................................ 26
3.2 European Union ......................................................................................................... 26
3.3 United Kingdom ........................................................................................................ 34
3.4 United States .............................................................................................................. 39
3.5 Australia ..................................................................................................................... 43
3.6 New Zealand .............................................................................................................. 47
3.7 Summary of International Approaches ...................................................................... 52
CHAPTER FOUR - METHODOLOGY FOR THE DELINEATION OF BOUNDARIES OF
AIR QUALITY MANAGEMENT AREAS IN SOUTH AFRICA
4.1 Introduction ................................................................................................................ 55
4.2 Boundary Criteria ...................................................................................................... 56
4.2.1 Geopolitical Boundaries ...................................................................................... 56
4.2.2 Population Density .............................................................................................. 57
4.2.3 Emissions ............................................................................................................ 60
4.2.4 Topography ......................................................................................................... 75
4.3 Spatial Analysis ......................................................................................................... 75

ix
CHAPTER FIVE - RESULTS 5.1 Introduction ................................................................................................................ 77
5.2 Population Density ..................................................................................................... 77
5.3 Emissions ................................................................................................................... 79
5.3.1 Industrial Sources ................................................................................................ 79
5.3.2 Mining Sources ................................................................................................... 84
5.3.3 Domestic Sources ................................................................................................ 87
5.4 Air Pollution Impact Potential Rating........................................................................ 88
5.5 Topographical Analysis ............................................................................................. 91
CHAPTER SIX - DISCUSSION AND IMPLICATIONS FOR GOVERNMENT
6.1 Introduction ................................................................................................................ 93
6.2 National Implications ................................................................................................. 94
6.2.1 Vaal Triangle Airshed Priority Area ................................................................... 94
6.2.2 Highveld Priority Area ........................................................................................ 99
6.2.3 Proposed Magaliesberg Priority Area ............................................................... 103
6.2.4 Proposed Waterberg Priority Area .................................................................... 105
6.3 Provincial Implications ............................................................................................ 106
6.3.1 Eastern Cape ...................................................................................................... 106
6.3.2 Free State ........................................................................................................... 106
6.3.3 Gauteng ............................................................................................................. 107
6.3.4 KwaZulu-Natal .................................................................................................. 108
6.3.5 Limpopo ............................................................................................................ 112
6.3.6 Mpumalanga ...................................................................................................... 112
6.3.7 North West ........................................................................................................ 113
6.3.8 Northern Cape ................................................................................................... 114
6.3.9 Western Cape .................................................................................................... 114
6.4 Local Government Implications .............................................................................. 116
6.5 Summary of the Implications ................................................................................... 119
CHAPTER SEVEN - CONCLUSIONS AND RECOMMENDATIONS 7.1 Introduction .............................................................................................................. 120
7.2 Conclusions and Recommendations ........................................................................ 121
7.3 Looking Forward ..................................................................................................... 122

x
List of Figures
1.1 Location of the known air pollution “hotspots” in South Africa………………………..1
1.2 Location of the sulphur dioxide monitoring stations in South Africa…………………..5
1.3 Location of the particulate matter (PM10) monitoring stations in South Africa………..5
1.4 Location of the oxides of nitrogen (NOx) monitoring stations in South Africa...………6
3.1 Timeline of the EU Directives associated with air quality management………………27
3.2 Implications of exceedence of the limit value, UAT, LAT for compliance judgment and
assessment requirements in a zone……………………………………………………..29
3.3 Schematic diagram used to determine zone allocation…………………………………30
3.4 Timeline of the adoption of UK Acts associated with air quality management………..35
3.5 Schematic illustration of the implementation of the NAQS by local authorities………36
3.6 Number of local authorities with AQMAs during the period March 1999 – 2007…….37
3.7 Location of local authorities with AQMAs – December 2008………………………....39
3.8 Location of non-attainment AQCRs in the US…………………………………………42
3.9 Location of the major South Australian airsheds.…………………...…………………46
3.10 Preliminary local air management areas for New Zealand…………………………….53
4.1 Geopolitical boundaries of South Africa as at 1 June 2009……………………………59
4.2 Provincial summary of the distribution of registration certificates in South Africa...…61
4.3 Overall hazard rating assigned to certain industry types……………………………….63
4.4 Weightings applied to criteria, sub-categories and categories…………………………68
4.5 Percentage contribution to total dust emissions from typical South African strip mine.69
4.6 Provincial distribution of the active mining operation in South Africa………………..70
4.7 Summary of the results of the FRIDGE study…………………………………………71
4.8 Location of the boundaries of the four major catchment types in South Africa……….76
5.1 Population densities (people/km2) by district municipality……………………………78
5.2 Population densities (people/km2) by local municipality………………………………79
5.3 Summary of the number of companies operating scheduled processes by district
municipality………………………………………………………………..…………...80
5.4 Summary of the number of companies operating scheduled processes by local
municipality…….………………………………………………………………………81
5.5 Summary of industry rating of companies operating scheduled processes by district
municipality…………………..………………………………………………………...82
5.6 Summary of industry rating of companies operating scheduled processes by local
municipality………………………………………………………………………….…83

xi
5.7 Summary of the number of operational mines by district municipality………………..84
5.8 Summary of the number of operational mines by local municipality………………….85
5.9 Summary of the mining rating district municipality……………….……….………….86
5.10 Summary of the mining rating by local municipality………………..……………..…..86
5.11 Summary of domestic emissions potential by district municipality……………..…….87
5.12 Summary of the domestic emission potential by local municipality……………...……88
5.13 Air pollution impact potential rating for district municipalities…………………...…...90
5.14 Air pollution impact potential rating for local municipalities……………………...…..90
5.15 Primary and secondary river catchments in relation to district municipalities…..…….91
5.16 Primary and secondary river catchments in relation to local municipalities……...……92
6.1 Extent of the Vaal Triangle Airshed Priority Area………………………………...…...94
6.2 VTAPA shown in relation to the estimated air pollution impact potential rating at the
district municipality level………………………………………………………..….….95
6.3 VTAPA shown in relation to the estimated air pollution impact potential rating at the
local municipality level…………………………………………………………..….…96
6.4 Proposed revised delineation of the VTAPA…………………………………….….…97
6.5 Maximum modelled 24-hour PM10 concentrations in the VTAPA……………………98
6.6 Maximum modelled 24-hour SO2 concentrations in the VTAPA……………………..98
6.7 Extent of the Highveld Priority Area………………………………………………...…99
6.8 HPA shown in relation to the estimated air pollution impact potential rating at the
district municipality level…………………………………………………………..…100
6.9 HPA shown in relation to the estimated air pollution impact potential rating at the local
municipality level…………………………………………………………………..…101
6.10 Proposed revised delineation of the HPA……………………………………….……102
6.11 Modelled exceedences of SO2 and PM10 in the HPA………...……………………….103
6.12 Extent of the proposed Magaliesberg priority area….…………………………..……104
6.13 Extent of the proposed Waterberg priority area….………………………………..….105
6.14 Extent of the proposed Johannesburg / Tshwane provincial priority area....................108
6.15 Extent of the proposed iLembe / Ethekwini provincial priority area…………………109
6.16 Extent of the proposed uMgungundlovu / Ethekwini provincial priority area………110
6.17 Extent of the proposed Ugu / Ethekwini provincial priority area…………………….111
6.18 Extent of the proposed Cape Winelands / West Coast / Cape Town provincial priority
area……………………………………………………………………………………115

xii
List of Tables
2.1 Summary of the Differences between APPA and AQA…….........................................24
3.1 Summary of the number of air quality management zones declared by the EU Member
States…………………………………………………………………………………...33
3.2 Summary of the AQCRs in the United States as at 18 November 2009…………….…42
3.3 Summary of urban centres in Australia with populations > 25 000 inhabitants………45
3.4 Summary of international approaches to defining air quality management areas……...54
4.1 Municipal demarcation of South Africa as at 1 June 2009…………………………….57
4.2 Population densities in the metropolitan municipalities……………………………….58
4.3 Scoring parameters for each criterion…………………………………………………..65
4.4 Summary of pollutants emitted by the common energy carriers used in South Africa...72
5.1 Summary of population density per province………………………………………….77
6.1 Air pollution impact potential scores for the district municipalities in and around the
VTAPA………………………………………………………………………………....95
6.2 Air pollution impact potential scores for the local municipalities in and around the
VTAPA………………………………………………………………………………....96
6.3 Air pollution impact potential scores for the district municipalities in and around the
HPA….………………………………………………………………………………..100
6.4 Air pollution impact potential scores for the local municipalities in and around the
HPA….………………………………………………………………………………..101
6.5 Air pollution impact potential scores for the district municipalities in and around the
MPA….……………………………………………………………………………….104
6.6 Air pollution impact potential scores for the local municipalities in and around the
MPA….………………………………………………………………………………104
6.7 Air pollution impact potential scores for the local municipalities in and around the
WPA….………………………………………………………………………………106
6.8 Air pollution impact potential scores for the district municipalities in the Eastern Cape
……….……………………………………………………………………………….106
6.9 Air pollution impact potential scores for the district municipalities in the Free State
……….……………………………………………………………………………….107
6.10 Air pollution impact potential scores for the district / metropolitan municipalities in
Gauteng……………………………………………………………………………….108
6.11 Air pollution impact potential scores for the municipalities in the proposed iLembe /
Ethekwini provincial priority area…………………………………………………….110

xiii
6.12 Air pollution impact potential scores for the municipalities in the proposed
uMgungundlovu / Ethekwini provincial priority area………..……………………….111
6.13 Air pollution impact potential scores for the municipalities in the proposed Ugu /
Ethekwini provincial priority area…………………………………………………….112
6.14 Air pollution impact potential scores for the district municipalities in Limpopo…….112
6.15 Air pollution impact potential scores for the district municipalities in Mpumalanga...113
6.16 Air pollution impact potential scores for the district municipalities in the North West
…………………………………………………………………………………..…….113
6.17 Air pollution impact potential scores for the district municipalities in the Northern Cape
…………………………………………………………………………………..…….114
6.18 Air pollution impact potential scores for the municipalities in the proposed Cape
Winelands / West Coast / City of Cape Town provincial priority area……………….115
6.19 Revised Table 24 of the National Framework……………………………………...…117

xiv
List of Acronyms
AAQ NEPM Ambient Air Quality National Environmental Protection Measure
AQA National Environmental Management: Air Quality Act
AQCAs Air Quality Control Areas
AQCRs Air Quality Control Regions
AQFD Air Quality Framework Directive
AQM Air Quality Management
AQMA Air Quality Management Area
AQMP Air Quality Management Plan
APCO Air Pollution Control Officer
APPA Atmospheric Pollution Prevention Act
BPM Best Practicable Means
CAA Clean Air Act
CAU Census Area Unit
CAPCO Chief Air Pollution Control Officer
CBOs Community Based Organisations
CEM Continuous Emission Monitoring
CH4 Methane
C4H6 1,3-Butadiene
C6H6 Benzene
CO Carbon Monoxide
CONNEPP Consultative National Environmental Policy Process
CTL Coal To Liquids
CSIR Council for Scientific and Industrial Research
DEA Department of Environmental Affairs
DEAT Department of Environmental Affairs and Tourism
Defra Department for Environment, Food and Rural Affairs
DEM Digital Elevation Model
DETR Department of Environment, Transport and the Regions
DMAs District Management Areas
DME Department of Minerals and Energy
DoE Department of the Environment
DWA Department of Water Affairs
EC European Commission

xv
EEA European Environment Agency
EEA/ETC-ACC European Environment Agency European Topic Centre on Air and
Climate Change
EEC European Economic Community
EMM Ekurhuleni Metropolitan Municipality
EPAQS Expert Panel on Air Quality Standards
ERC Energy Research Centre
EU European Union
FRIDGE Fund for Research into Industrial Development Growth and Equity
GIS Geographical Information System
HPA Highveld Priority Area
IDP Integrated Development Plan
IDZ Industrial Development Zone
IGAE Intergovernmental Agreement on the Environment
IP&WM Integrated Pollution and Waste Management
IPC Integrated Pollution Control
ISO International Organisation for Standardisation
LAMAs Local Air Management Areas
LAQM Local Air Quality Management
LAT Lower Assessment Threshold
LPG Liquid Petroleum Gas
MEC Member of the Executive Committee
MPA Magaliesberg Priority Area
MoT Ministry of Transport
NAAQS National Ambient Air Quality Standards
NACA National Association for Clean Air
NAPAC National Air Pollution Advisory Committee
NAQAC National Air Quality Advisory Committee
NAQMP National Air Quality Management Programme
NAQO National Air Quality Officer
NAQS National Air Quality Strategy
NCOP National Council of Provinces
NEC National Emission Ceiling
NEMA National Environmental Management Act
NEPC National Environmental Protection Council

xvi
NEPMs National Environmental Protection Measures
NGOs Non-Governmental Organisations
NH3 Ammonia
NMBMM Nelson Mandela Bay Metropolitan Municipality
NO2 Nitrogen Dioxide
NOx Oxides of Nitrogen
NPI National Pollutant Inventory
NRC National Research Council
NSCA National Society for Clean Air and Environmental Protection
NZ New Zealand
O3 Ozone
PAQO Provincial Air Quality Officer
Pb Lead
PGM Platinum Group Metals
PM2.5 Particulate Matter with aerodynamic diameter less than 2.5 microns
PM10 Particulate Matter with aerodynamic diameter less than 10 microns
PRC Peer Review Committee
SAAQIS South African Air Quality Information System
SA EPA South Australia Environmental Protection Agency
SAFARI South African Fire-Atmosphere Research Initiative
SANAS South African National Accreditation System
SANRAL South African National Roads Agency Limited
SAWS South African Weather Service
SIP State Implementation Plan
SO2 Sulphur Dioxide
StatsSA Statistics South Africa
TLA Territorial Local Authority
UAT Upper Assessment Threshold
UJ University of Johannesburg
UK United Kingdom
US United States
US-EPA United States Environmental Protection Agency
VKT Vehicle Kilometre Travelled
VOCs Volatile Organic Compounds
VTAPA Vaal Triangle Airshed Priority Area

1
CHAPTER ONE
INTRODUCTION
1.1 Background
Since 1965 air quality management in South Africa has been regulated in terms of the
Atmospheric Pollution Prevention Act (No. 45 of 1965) (APPA). This legislation employed a
source-based approach, regulating major industrial, vehicle, smoke and dust emissions. A more
detailed review of the legislation is provided later, suffice to say at this juncture, the legislation
has proved ineffective in managing air quality in the Republic. This has allowed the
development of air pollution “hotspots” across the country, namely the Vaal Triangle,
Mpumalanga Highveld, South Durban, Milnerton and Richards Bay (Held et al., 1996; Zunckel,
1999; Scorgie et al., 2004a; Zunckel et al., 2006a; Piekth et al., 2006; Josipovic, 2009; DEA,
2009a). Figure 1.1 shows the location of the air pollution “hotspots” and the associated problem
pollutants.
Figure 1.1 Location of the known air pollution “hotspots” in South Africa (Scorgie,
2005)
From 1992 it was acknowledged that South Africa’s approach to pollution and waste
management governance was inadequate (DEAT, 2000). The first major step in the transition to

2
a new air quality management system was the drafting of the new Constitution (No. 108 of
1996) (Republic of South Africa Government, 1996). Section 24 of the Constitution states that:
“Everyone has the right –
a) to an environment that is not harmful to their health or well-being; and
b) to have the environment protected, for the benefit of present and future generations,
through reasonable legislative and other measures that –
i. prevent pollution and ecological degradation;
ii. promote conservation; and
iii. secure ecologically sustainable development and use of natural resources
while promoting justifiable economic and social development.”
This right to environmental protection was the driving force behind subsequent environmental
legislation in South Africa. The promulgation of the National Environmental Management Act
(No. 107 of 1998) (NEMA) set out the framework for the current environmental legislation in
the country (Republic of South Africa Government, 1998). The National Environmental
Management: Air Quality Act (No. 39 of 2004) (AQA) is one part of the overall environmental
management framework (Republic of South Africa Government, 2005). The AQA is a paradigm
shift in terms of its approach to air quality management in South Africa. The air quality
management philosophy moves from a source-based to an effects-based approach, with
emphasis on the ambient environment (Scorgie, 2008). The AQA introduced new air quality
management tools, including ambient air quality standards, emission standards, controlled
emitters, controlled fuels and priority area management.
In terms of Schedule 4, Part B, the Constitution delegates the responsibility for air quality
management from national to local government level (Republic of South Africa Government,
1996). This is a major departure from the status-quo where air quality management has been a
national responsibility since 1965. The AQA is the enabling legislation that will see this
transition of responsibility effected. The AQA was promulgated in 2005 and specific sections of
the Act commenced on 9 September 2005. At the time, the Minister of Environmental Affairs
and Tourism was not convinced that local government was adequately prepared to undertake the
full air quality management function. As such, he held back all sections of the AQA that
involved local government responsibility, specifically those relating to emission licencing. It
was indicated that during a transitional process, both the AQA and the APPA would run
concurrently, with emission licencing handled under the provisions of the APPA. The

3
transitional period would allow for capacity building and skills development within local
government to competently implement the AQA.
The AQA is also considered a framework piece of legislation, which contains guiding principle
and policies. Section 7 of the AQA makes provision for the development of a National
Framework for achieving the objectives of the Act. After a broadly consultative process the first
generation National Framework was implemented on 11 September 2007 (DEAT, 2007a). The
objective of the National Framework was to provide mechanisms, systems and procedures to
promote holistic and integrated air quality management. Hence, the National Framework
provided norms and standards for all technical aspects of air quality management in South
Africa.
Section 5.3 of the National Framework looked specifically at air quality problem identification
and prioritization in the Republic. The inclusion of Table 24 (Appendix 1), which listed
metropolitan and district municipalities rated as having poor or potentially poor air quality, was
seen as controversial, given that it was a subjective assessment based on limited scientific data
(DEAT, 2007a). To address the perceived poor air quality in these areas the AQA makes
provision for priority area management. The Minister or the provincial Member of the
Executive Committee (MEC) may declare a priority area if the ambient air quality standards are
being, or may be exceeded, and the area requires specific air quality management actions to
rectify the situation. This air quality management tool has three strategic drivers (DEAT,
2006a). Firstly it allowed for the concentration of limited air quality management capacity
(human, technical and financial) when dealing with acknowledged air pollution problem areas.
Secondly it prescribed co-operative governance that may become problematic in areas where
cross boundary air pollution problems existed. Finally it allowed for the application of holistic
air quality management methodologies, namely airshed air quality management. The Act
provides little guidance on the designation of the boundary of such priority areas. Section 5.4.6
of the National Framework covers air quality management planning matters but the document
provides minimal guidance, other than referring to an air quality management planning
document that was under development at the time of publication. A review of the final
document (DEAT, 2008) reveals that minimal guidance is provided, other than recommending
the use of administrative boundaries and topography as criteria for the designation of priority
areas.

4
To date, two national priority areas have been declared. The Vaal Triangle Airshed Priority
Area (VTAPA) was formally declared on 21 April 2006 and the Highveld Priority Area (HPA)
was formally declared on 23 November 2007. During the declaration process, a boundary to
each of these areas was proposed, but no specific methodology was utilized. The boundaries
were delineated based on readily available data, namely outputs of dispersion modeling projects
undertaken in the areas, limited ambient air quality data and administrative boundaries. The
outputs of the VTAPA baseline assessment roughly concurred with the original delineation,
however the boundary was challenged by Scott et al. (2005). Recently the baseline assessment
for the HPA has been completed, so it was possible to assess the accuracy of the HPA
delineation. The lack of a standard methodology to delineate the boundary is considered a short-
coming of the process.
One of the major challenges facing air quality management officials is addressing these
localised air quality management problems. A key to managing these areas is access to high
quality air quality information. Unfortunately South Africa has relatively few ambient air
quality monitoring stations. A comprehensive study was undertaken in 2004 to identify all
ambient air quality monitoring stations in the country (DEA, 2009a). In total, 160 stations were
identified and data were obtained from 136. Figures 1.2 – 1.4 shows the location of the ambient
monitoring locations for the common pollutants on concern in South Africa, namely particulate
matter, sulphur dioxide (SO2) and oxides of nitrogen (NOx). These figures highlight the paucity
of ambient air quality information in South Africa, specifically in the western half of the country
and those areas outside of urban centres. Concerns were raised regarding data quality since very
few of the stations were South African National Accreditation System (SANAS) accredited to
the ISO 17025 standard (DEA, 2009a). A more recent study was commissioned by the
Department of Environmental Affairs (DEA) to survey all the ambient air quality monitoring
stations operated by government entities (national, provincial and local) (DEAT, 2009a). The
purpose of this survey was to assess the readiness of these stations to provide ambient air quality
data to the South African Air Quality Information System (SAAQIS). The survey identified 97
stations, however, not all stations were operational. Problems cited included lack of finances
and training. This lack of credible ambient data has hampered air quality management
initiatives.

5
Figure 1.2 Location of the sulphur dioxide monitoring stations in South Africa
(Zunckel et al., 2006b)
Figure 1.3 Location of the particulate matter (PM10) monitoring stations in South
Africa (Zunckel et al., 2006b)

6
Figure 1.4 Location of the oxides of nitrogen (NOx) monitoring stations in South
Africa (Zunckel et al., 2006b)
Another factor hampering air quality management initiatives is the absence of a comprehensive
national emissions inventory (Scorgie et al., 2004a). Until 2007 the Department of
Environmental Affairs and Tourism (DEAT) (now DEA) operated regional offices, which were
responsible for the registration and management of all the companies operating scheduled
processes in terms of the APPA in their designated areas. In 2007, all of these regional offices
were closed and their archives were centralised in the Pretoria office. For the first time in the
history of the APPA a consolidated archive of all registration certificates was produced. The
contents of the archive were captured in an electronic database (DEAT, 2006b). An analysis of
the content of the electronic database is presented in Chapter 4. Most of the major metropolitan
municipalities are in varying stages of completion of their emission inventories, however, these
are independent initiatives with limited co-operation and co-ordination. This leaves the balance
of the country with little to no readily available emission information.
As highlighted above, one of the largest challenges hampering the implementation of the AQA,
is the lack of skilled and experienced air quality management practitioners. From 1965 until the
present, air quality management in South Africa has been undertaken by a core group of

7
national government officials. As a result, there is now a critical skills shortage as the new air
quality management legislation is rolled out to the other spheres of government. There is
currently no undergraduate training programme for air quality management at any of the tertiary
institutions in South Africa, and limited opportunities for post-graduate study. The University of
Johannesburg (UJ), in association with the National Association for Clean Air (NACA), is now
offering a suite of short courses in air quality management related topics. In the interim, this
skills shortage is being addressed by intergovernmental co-operation, where capacitated spheres
of government are assisting the less well resourced and less prepared.
1.2 Goal
Within this context of a lack of readily available air quality management information, the goal
of this research was to develop a methodology for the delineation of the boundary of an air
quality management area. This methodology will then be applied in the context of South
Africa’s new air quality legislation, which introduces priority area management as one of the
new air quality management tools.
The preliminary objective of the research was to identify the specific criteria that should be
considered when developing the methodology. This was based on a review of similar
international methodologies. Internationally the boundary determination process is reliant on
data intensive techniques such as dispersion modelling and long term ambient air quality
monitoring results (Van Aalst et.al., 1998; EC, 2003; Woodfield et al., 2002; Fisher et al.,
2005). Following the identification of these criteria the next objective was to identify or develop
a proxy methodology for assessing the impact of each of these criteria. This would assist in
overcoming the lack of detailed air quality management information, namely comprehensive
emission inventories and long term ambient air quality monitoring data. A further objective was
to combine the relevant criteria to produce a single indicator or value as to the air pollution
impact potential of the area under consideration. This methodology would then be tested in the
South African context. The final objective of the research was to assess the results of the
application of the methodology on the regulatory framework proposed by the AQA. Here the
results would be compared to the delineation of the current national priority areas, the potential
for provincial priority areas would be explored and a comparison with the current Table 24 local
municipalities with “poor” or “potentially poor” air quality, as specified in the National
Framework. Following the identification of the boundaries of the priority areas, the necessary
air quality management planning initiatives could commence. In terms of Section 15(2) of the
AQA all municipalities in South Africa must prepare an air quality management plan that is

8
included in their integrated development plan (IDP). In the case of a national priority area, the
DEA will take the lead on the air quality management plan development, in collaboration with
the affected provincial and local government structures. In the case of a provincial priority area,
the affected province will take the lead on the air quality management plan development, in
collaboration with the affected local government structures.
The principle of using readily available information will allow the application of this
methodology in other developing countries. The application of this methodology must be seen
as an iterative process with the more data intensive techniques replacing this methodology as the
information come available in South Africa.
1.3 Structure of the Thesis
Chapter 1 of the study introduces the topic matter and sets the objectives of the research.
Chapter 2 provides a background to the history of air quality management legislation in South
Africa, including information regarding the forthcoming entry into effect of the AQA. Specific
emphasis is placed on the provisions in the legislation relating to air quality management
planning. Chapter 3 provides a review of the legislative requirements and frameworks under
which applied air quality management occurs for five different international examples, with
specific emphasis on the approach taken in respect of the delineation of the boundaries of air
quality management zones or areas. It must be noted that all the countries selected apply a
similar air quality management philosophy to that which will be applied in South Africa under
the AQA, namely an effects-based approach. Chapter 4 details the methodology proposed for
application in South Africa. The data that will be used in the assessment of the methodology are
also described. Chapter 5 presents the results of the application of the methodology. The results
from each of the criteria will be presented in addition to the consolidated results. The results
will be presented at District / Metropolitan Municipality level and the Local Municipality level.
Chapter 6 will contain a discussion of the results presented in Chapter 5, with specific emphasis
on the implications for national, provincial and local government structures in South Africa.
Chapter 7 will conclude the study with a summary of the key findings and recommendations for
a way forward for the research in this field in South Africa.

9
CHAPTER TWO
HISTORY OF AIR QUALITY MANAGEMENT IN SOUTH AFRICA
2.1 Introduction
Air pollution is a problem affecting many parts of the world, in both developed and developing
countries. Pollution sources in developed countries are typically associated with industrial
pollution and emissions from motor vehicles, while pollution sources representative of
developing countries are typically associated with emissions from the domestic use of low
grade, low costs fuels used for space heating and cooking requirements (Emmott, 1996;
Brimblecombe and Cashmore, 2002; Elsom and Longhurst, 2004; Khare and Kansal, 2004;
Brimblecombe, 2005). The air pollution profile in South Africa has characteristics of both. The
five main sources of air pollution in South Africa, according to Petrie et al. (1992) are, fuel
combustion in stationary activities, fuel combustion in mobile activities, industrial and chemical
processes, solid waste disposal, particularly through incineration and land surface disturbances
giving rise to dust i.e. unpaved roads, agricultural emissions and other wind-blown emissions.
The description provided by Petrie et al. (1992) is not considered complete, since it makes no
specific reference to domestic fuel burning which is considered a significant source of air
pollution in South Africa, especially during the winter months (Annegarn and Scorgie, 1996;
Scorgie et al., 2004a; Pauw et al., 2008; DEA, 2009a). While it may be captured under the
broad description of fuel combustion in stationary activities, the significance of this source
deserves specific mention.
Management of these diverse sources of air pollution is clearly a complex task and South Africa
has a relatively long history of attempting to address at least some of these sources. This chapter
will explore the history of air quality legislation and management in South Africa to provide a
context for the specific objectives of this research.
2.2 Early Period Prior to 1965
There was no significant industrial activity in South Africa until the end of the 19th century
(Brown and Brown, 1929). There was limited copper mining at O’okiep, diamond mining in
Kimberley from 1870 and gold mining in the eastern Transvaal from 1872 and the
Witwatersrand from 1884. The industrialisation of South Africa proceeded slowly until 1939,
when the Second World War interrupted the supply of manufactured goods traditionally
imported from Europe. This factor led to more local industrialisation. Rapid industrial

10
development in South Africa in the post-World War II period increased the emissions of air
pollutants into the atmosphere such that by 1955 there was cause for concern (Boegman, 1979).
Contrary to the pattern in other countries, it was not the general public who raised concern over
the increasing impact of air pollution, but the local scientific community. Articles relating to air
pollution by Elliston (1948, 1950) and Quass (1950, 1951 and 1953) appeared in technical
journals, highlighting the deterioration in air quality in Europe and the United States, however,
little or no information of this nature existed in South Africa. Halliday measured air pollution
for the first time in South Africa in Pretoria in 1952 and in 1960 headed the newly formed Air
Pollution Research Group of the Council for Scientific and Industrial Research (CSIR)
(Boegman, 1979). In 1955 the first conference on air pollution in South Africa was convened,
attended primarily by scientists and government officials. The key decision taken at this
conference was the need for the drafting of air pollution control legislation (Boegman, 1979).
This process culminated in the promulgation of the APPA.
2.3 Atmospheric Pollution Prevention Act
The APPA was based on old United Kingdom legislation i.e. British Alkali Act of 1865, Alkali
Works Regulation Act of 1906 and the Clean Air Act of 1956 (DEAT, 2002). The legislation
required the application of the “best practicable means” (BPM) to limit emissions from
industrial sources, but due to its framework nature, provided very limited guidance for the
practical implementation of the concept. This approach, although having some positive impacts
on source-based emissions, did not effectively take into account the cumulative impacts of these
and other non-point-source emissions (DEAT, 2002).
Until 1995, air pollution control vested with the Department of National Health and Population
Development. As a result of a recommendation from the Council for the Environment, air
pollution control was brought under the authority of the DEAT (Council for the Environment,
1994). APPA provided for the appointment of a Chief Air Pollution Control Officer (CAPCO).
This was an appointment in name and was made directly by the responsible Minister. In total,
there have been seven CAPCO appointments in terms of the APPA. All of these appointments
have been on a national basis, with the exception of the North West Province, which had a
provincial CAPCO. The CAPCO, together with the inspectors was responsible for the
management and control of air pollution in four broad areas; viz. noxious and offensive gases,
smoke, dust and motor vehicles.

11
2.3.1 Control of Noxious and Offensive Gases
The control of noxious and offensive gases relate to the 72 scheduled processes listed in
Schedule 2 of the APPA. These include the large industrial operations in South Africa i.e. oil
refineries, coal-fired power generation, iron and steel plants and numerous chemical processes.
A 2006 review of the scheduled process database indicated that there were 2578 companies
issued with registration certificates in South Africa (DEAT, 2006b).
A company may not operate a scheduled process without being in possession of a valid
registration certificate. Applications for registration certificates are submitted to the CAPCO.
The CAPCO issues a registration certificate having been satisfied that the company making
application is applying BPM to prevent or reduce the escape of noxious or offensive gases. In
addition, the CAPCO must take into consideration the nature and purpose of the operation,
character of the locality and other relevant considerations before issuing a registration
certificate. The definition of BPM relates to the use of approaches which are both technically
and economically feasible (Emmott, 1996). The determination of BPM is made on a
discretionary basis by the CAPCO in consultation with the relevant industry. The application of
BPM leads to the determination of specific emission limits that can be applied to that operation.
These emission limits are then reflected in the registration certificate and are considered
guidelines that are not legally binding on the operator.
The CAPCO may issue a provisional or a final registration certificate. Provisional certificates
are normally issued to new operations with specific conditions that relate to quantities of raw
materials, emission limits of specific pollutants and the performance of pollution abatement
equipment. Provisional certificates are issued for periods ranging from three to 60 months, and
are renewable. A final registration certificate is issued subject to all the conditions in the
provisional certificate being met. A final registration certificate is valid for the lifetime of the
operation or until modifications are made to the plant which require amendment to the
registration certificate.
2.3.2 Control of Smoke
APPA’s provisions relating to the control of smoke only apply in areas specifically designated
by local authorities. Within these areas APPA provides for three levels of control.

12
Level 1 relates to enforcement of the provisions relating to the installation of fuel burning
appliances which do not conform to certain standards and local authority approval for the siting
of fuel burning appliances and chimneys. The local authority is responsible for ensuring that
smoke from an approved appliance will not be prejudicial to human health or cause a nuisance.
Where smoke does cause a nuisance, the local authority must serve an abatement notice on the
polluter.
Level 2 applies to more significant smoke problems allowing for controls to be applied to
boilers, light industries and combustion of waste. Local authorities are given power to make
regulations relating to the emission of dark smoke, the installation, alteration, extension or
removal of fuel burning appliances, the sale or use of solid fuel, record keeping and the
inspection of polluting facilities. In the event of contravention the local authority can serve a
notice requiring compliance within a specified period.
Level 3 concerns areas established by local authorities as smoke control zones, in which the
emission of dark smoke may be prohibited. This level applies mostly to residential zones.
One problem with the provisions of the APPA relating to smoke control is the difficult and
subjective task of determining what constitutes a nuisance. Nuisance is not defined in the Act,
however, it does provide that smoke which is prejudicial to health or which adversely affects the
reasonable comfort of occupiers of adjoining or nearby premises is a nuisance. A further
criticism of APPA is that the provisions on smoke only apply in areas designated by local
authorities. After such designation has been made, the Minister may transfer the powers of the
local authority to the CAPCO in instances where the local authority fails to prevent or abate
nuisances.
2.3.3 Control of Dust
APPA provides for the control of dust emitted from industrial processes not covered by other
provisions of the Act. The dust control measures apply in areas designated by the Minister, who
may also issue regulations concerning steps to prevent or minimise dust nuisances and
inspection of premises creating dust.

13
Any person who operates a process that creates a dust nuisance in a dust control area must apply
BPM to abate the dust. Dust emanating from depositions in excess of 20 000 cubic meters is
subject to direction from the CAPCO.
As with scheduled processes and smoke, dust control is regulated without reference to legally
binding air quality standards. Such standards would be useful in determining whether the dust
generated by a particular operation is considered a nuisance.
2.3.4 Control of Vehicle Emissions
APPA provides for the control of vehicle emissions in local authority areas as designated by the
Minister. Before this designation can be made the local authority must have access to a test
centre and suitable measuring equipment. Local authorities whose areas are designated are
empowered to authorise any person to detain or inspect any vehicle, to require a driver to stop
while a test is carried out and to serve notices requiring vehicles to be made available for
examination.
APPA allows the Minister to make regulations regarding the use of vehicles emitting specific
gases and concerning the prevention or testing of emissions. To date, regulations have only
applied specific emission controls to diesel driven vehicles. A shortcoming of the current
regulatory regime is its reliance on the vigilance of the local authorities. At present the City of
Cape Town is the only local authority in the country with a regular vehicle testing programme.
In all other local authorities the testing programmes have fallen away due to diminishing
human, technical and financial resources.
2.3.5 Critical Analysis of APPA and Air Quality Status in South Africa
APPA has largely been discredited as workable legislation because it is not legally enforceable,
since it provides ambient air pollution guidelines instead of standards, and in many cases it has
simply not been applied due to lack of capacity and/or resources. An often overlooked factor is
the historically low political priority attached to air quality management in South Africa
(DEAT, 2002). APPA only regulates industries on an individual basis with no consideration of
cumulative or synergistic pollution impacts. Another criticism of APPA is the lack of
transparency and public involvement in the determination of conditions and emission limits in
registration certificates. The lack of transparency is contrary to the principles of the NEMA, as
amended. APPA was regarded by many people as unconstitutional, as it did not set any targets

14
or standards that would permit the achievement of an environment which is not harmful to
health or well being in accordance with the Constitution. There was no underlying drive
towards cleaner air contained in the Act. Furthermore, it was not suited to the new allocation of
provincial and local government roles as specified in the Constitution, as the provinces were
excluded (DEA, 2009a). Due to limited resources (human and financial) during the 1980’s and
1990’s many provisions of the APPA were not fully enforced, which resulted in the occurrence
of a large number of industrial operations that were not registered in terms of the Act. Licencing
backlogs, infrequent compliance inspections and “vague” registration certificate conditions,
resulted in a situation where the industrial impact on the ambient environment was difficult to
determine.
APPA also gave wide discretionary powers to the Minister and the CAPCO. The Act included
numerous phrases that were prefaced with ‘may’ and ‘might’. For example, the Minister may
appoint a CAPCO. The Act also made no legal provision for any form of ambient air quality
monitoring. The CAPCO may prescribe monitoring at his/her discretion. APPA prescribes a list
of scheduled processes for which a registration certificate is required. The registration certificate
is issued by the CAPCO. Again, there is a large amount of discretion in the application of the
BPM approach by the CAPCO. APPA had a very weak penalty system for offenders. A first
offence resulted in a maximum fine of R500 or a prison sentence up to 6 months, or both. A
second offence incurred a maximum fine of R2000 or a prison sentence up to 1 year, or both. To
date there have been few successful prosecutions in terms of the APPA (Glazewski, 2000).
Given the deficiencies of the Act and its implementation, there is also a range of specific
circumstances in South Africa that result in degraded air quality. The air quality problem of
greatest significance is that of domestic fuel use which results in direct exposure to elevated air
pollution concentrations of especially particulates, but including sulphur dioxide (SO2), oxides
of nitrogen (NOx) and volatile organic compounds (VOCs). The problem is dramatically
compounded in the winter months by poor dispersion potential. The presence of a highly stable,
stratified atmosphere, including surface inversions, traps and accumulates these pollutants close
to the ground (Diab, 1975, Cosijn and Tyson, 1996). In a study conducted by Terblanche et al.
(1992) in the Vaal Triangle, a heavily industrialised area interspersed with several dense low
income settlements, it was found that internationally accepted health standards for particulate
matter were exceeded by two and a half times. As a result, children living in these areas carried
a risk of developing upper respiratory infections 21 – 103 % higher than children living in

15
relatively unpolluted areas. In many respects the problem of domestic fuel use appears
intractable and as such political support for efforts to resolve this problem is limited.
The next important problem is the heavy dependence on low-grade (low calorific value and high
ash content) coal for electricity generation. Although, until recently, this has allowed for
electricity pricing to be kept relatively cheap, deemed an important economic growth driver,
emissions of SO2 and NOx to atmosphere from power stations were not controlled. Although the
environmental effects such as acidification are not readily observed, the sheer volume of the
emissions to atmosphere is a cause for concern. Additionally, the carbon dioxide emissions are
not controlled either and power generation is a major source accounting for ~ 40% of the
greenhouse gas emissions in South Africa (ERC, 2007). Given the recent escalations in the cost
of electricity in South Africa, more is now being done to minimise energy usage and to promote
its more efficient use (Eskom, 2008). Of concern is the continued reliance on coal fired power
generation into the future. With the nuclear build programme delayed due to financial
constraints and the lack of progress in the development of renewable energy sources, South
Africa has reverted to coal fired power generation as the energy source of choice in the short to
medium term.
South Africa has an ageing motor vehicle parc, with the average age of a vehicle being 11 years
(Swan, 2009). The emissions from motor vehicles on South African roads are largely
uncontrolled. While many new vehicles are fitted with emission control equipment (i.e. catalytic
converters), the majority of vehicles are old and poorly serviced. Although lead has now been
phased out of the fuels used in South Africa, the quality of the petrol and diesel, specifically the
sulphur content, is still inferior to fuels produced in Europe and North America. As such, the
full benefit of the emission control equipment on modern vehicles is not realised. In a response
to a limited reliable public transport system the minibus taxi industry has grown exponentially
over the last twenty years, but again many of the vehicles in the taxi fleet are poorly maintained.
In Cape Town, the development of a thick brown haze under stable atmosphere conditions,
predominantly in winter, principally owes its origin on to emissions from diesel vehicles
(Wicking-Baird et al., 1997).
South Africa is also prone to extensive bush or wild fires, commonly termed veld fires. These
extend over large areas of the country and are a major source of low-level pollutant emissions.
Paradoxically, the dry winter season (during which these veld fires occur) is also a time when

16
the atmosphere is extremely stable further exacerbating the effects of these fires in degrading air
quality. Many of these fires occur naturally due to lightening strikes, but many more are set
deliberately. Fire is used as part of a grassland management programme where burning plays a
key role in ecology; controlled fires are used to burn firebreaks to prevent runaway fires and
damage to property, or in agriculture. Prior to sugar cane harvesting it is common practice to
burn a field to remove the trash (old outer leaves of the plant) and drive pests (rodents and
snakes) from the fields. Emissions from this source were intensively researched during the
South African Fire-Atmosphere Research Initiative (SAFARI) in 1992 and the follow-up
SAFARI 2000 field campaigns (Garstang et al., 1996; Swap et al., 1996; Swap et al., 2002)
Poor land use planning is also a key consideration in understanding degraded air quality in
South Africa. One of the most prominent examples is the South Durban Industrial Basin, where
two large oil refineries together with a variety of other heavy and light industrial operations,
major transport infrastructure including road, sea and air are all located in very close proximity
to densely populated residential areas (Diab et al., 2002; Barnett and Scott, 2007). There are
several other examples of similar situations in the country including the Milnerton area in Cape
Town, Richards Bay and the Vaal Triangle. Historically there has been virtually no attempt at
incorporating air quality as a component of transport planning. Many of the land use planning
problems currently experienced are legacy issues from the apartheid era, however more
recently, the problems associated with air pollution and incompatible land use planning are
pressures associated with service delivery and poor consultation during land rezoning processes.
The effects of mining have also led to many air quality problems in South Africa. One such
example is windblown dust from mine dumps from gold mines. In areas of Soweto for example,
residents live with the problem of ceilings collapsing under the weight of the dust, let alone the
potential health effects of exposure to the same (Annegarn and Sithole, 1999). Coal mining is
also a major source of dust as well as releases of methane (an important greenhouse gas). In
addition, underground fires in abandoned coal mines and in some instances old stockpiles of
discard coal also contribute to degraded air quality through spontaneous combustion (DEAT,
2007b). Finally, various metal refineries and smelters associated with beneficiation of the
minerals generate large volumes of air pollution especially in the North West, Mpumalanga and
Limpopo provinces. Under the APPA the management of air quality issues on mines was the
responsibility of the Department of Minerals and Energy (DME) (now the Department of

17
Mineral Resources and the Department of Energy). A lack of co-operative governance led to
under regulation of the environmental performance of this sector.
Having highlighted the above issues, it is still considered that the full extent of air pollution and
associated impacts has not yet been researched and described for the Republic. Continuous
ambient air quality measurements are currently taking place in the major metropolitan centres of
the country i.e. Johannesburg, Cape Town, Durban and Pretoria. Comprehensive ambient
monitoring networks have been installed at the industrial hubs of Richards Bay and the Coega
Industrial Development Zone (IDZ) near Port Elizabeth. The balance of ambient air quality
monitoring is undertaken by industrial entities that use the information for research and
regulatory compliance purposes. There is currently no single emissions inventory for the
country, with emissions information gathered for site specific investigations. The City of Cape
Town is considered to have the most comprehensive emissions inventory following numerous
scientific investigations and research projects that have been based in the city. The City of
Johannesburg, Ethekwini Municipality (Durban) and the Buffalo City Local Municipality (East
London) are currently in advanced stages of the development of their own emissions
inventories. Information on air pollution sources outside of these centres is extremely limited
and several attempts at establishing a national air pollution database have not reached fruition.
The DEA is developing the SAAQIS whose ultimate objective is to be the national repository
for all air quality information in the country (www.saaqis.org.za). Phase I of the project, the
ambient air quality monitoring module, was recently completed and as at October 2009 had 52
government (national, provincial or local government) stations reporting to the national
database. The objective is to expand this number to include other government and industry
operated stations in the short to medium term. Phase II of the project, the emissions inventory
module, is currently under development.
There have been few health studies that focus on the direct health effects of prevailing air
quality, but those that have been done, for example in the South Durban Industrial Basin
(eThekwini Municipality, 2006) and the Vaal Triangle (Terblanche et.al.,1992) highlight the
potential health risks as a result of exposure to high concentrations of air pollution. More
recently, air quality related issues have been taken up by civil society which has seen the
mobilisation of action groups in all the major urban/industrial centres including Durban South,
Milnerton, Richards Bay, Pietermaritzburg, Rustenburg and the Vaal Triangle. Pressure from
these non-governmental organisations have been instrumental in the development of action

18
plans to address the air pollution in the problem areas i.e. Multi-Point Plan for South Durban,
Richards Bay Clean Air Association and the Vaal Triangle Airshed Priority Area.
Air quality management in South Africa has been undermined by a serious lack of resources,
both financial and human. As indicated, Johannesburg, Cape Town, Durban and Pretoria have
made sustained efforts to monitor and manage air quality. The national smoke and SO2
monitoring campaign, which was the most ubiquitous (if limited) approach to ambient air
quality monitoring, is no longer nationally administered. Most town councils and municipalities
which previously monitored at least these two pollutants no longer do so. Those that continue to
operate the monitoring equipment face ongoing budget constraints and it seems most likely that
the network will continue to deteriorate. Many of the staff in these councils and municipalities
complains of a lack of political support for ongoing air quality management (DEAT, 2009a).
2.4 The Constitution and Air Quality Management
The adoption of a democratic Constitution and Bill of Rights in 1996 made government
accountable to the South African people. The Constitution sets out the legislative and executive
authority of different spheres of government within a framework of cooperative governance. It
states that national and provincial governments have concurrent responsibility for environmental
management.
The Constitution states that South Africa is a sovereign, democratic state based on the values of
human dignity, equality, non-discrimination, the rule of law and universal suffrage. In terms of
environmental management it is important to recognise that sovereignty includes the ability to
limit sovereign powers by entering into international agreements where the need arises.
Chapter Three of the Constitution sets out principles of cooperative government and
intergovernmental relations that govern the relations between all spheres of government and all
organs of the state within spheres. Amongst those important for environmental management are
the obligations to preserve the peace and national unity of the Republic; secure the wellbeing of
its people; provide effective, transparent, accountable and coherent government; respect the
powers, functions and institutional integrity of other spheres of government; inform, consult,
assist and support other government agencies; co-ordinate actions and legislation; adhere to
agreements; and avoid legal proceedings against other government agencies.

19
Schedule 4 of the Constitution covers agriculture, cultural matters, environment, health services,
housing, nature conservation, pollution control, regional planning and development, soil
conservation, tourism, trade and urban and rural development.
The national executive has the power to supervise the provinces and to intervene where the
provinces do not fulfil executive obligations in terms of the Constitution or legislation. In these
circumstances it may issue directives or intervene to maintain national security or economic
unity, maintain or establish national or minimum standards, and prevent unreasonable action by
a province or action that prejudices the interests of another province or the country as a whole.
In such cases, the national executive must report to the National Council of Provinces (NCOP)
that has the power to review its actions.
The provincial governments have similar legislative and executive powers with respect to local
authorities. Parts B of Schedule 4 and 5 set out a wide range of activities including planning and
regulatory functions where local governments have responsibilities that affect the environment.
As a result of their important role in implementing policy, effective environmental management
at local level is essential for its success. Provincial government has an important role to play in
setting provincial norms and standards and assisting local government to carry out its role
effectively within the framework of this policy.
Section 146 of the Constitution addresses the question of conflicts between national and
provincial legislation and establishes that national legislation prevails where legislation by
individual provinces cannot effectively regulate a matter; where a matter requires uniformity
across the nation; and where national legislation is necessary to maintain security or economic
unity, or to protect the common market, promote economic activities across provincial
boundaries, promote equity or to protect the environment. Other provisions include prevention
of unreasonable action by provinces and to prevent prejudice to other parts of the country.
Section 195 (1) (e-g) states that public administration must be accountable, transparent through
the provision of timely, accessible and accurate information, must respond to people's needs and
must encourage public participation in environmental governance.
Various sections of the Bill of Rights as contained in the Constitution have major relevance for
environmental policy. Section 24 of the Bill of Rights guarantees that the right to environmental
protection for current and future generations. In terms of section 8 of the Constitution, the Bill

20
of Rights applies to all law, and binds the legislature, executive, judiciary and all organs of state.
This means that government must give effect to the rights in the exercise of environmental
governance. In terms of section 24 people can take legal action to protect their environmental
and other rights, even where government has no obligation in terms of any other statute to give
effect to these rights. Section 24 also compels government to pass reasonable legislation to
protect the environment, prevent pollution and ecological degradation, and secure sustainable
development. Government must also ensure compliance with legislation.
The government of the Republic is constituted as national, provincial and local spheres of
government that are distinctive, interdependent and interrelated. It is clear from the analysis of
the provisions of the Constitution and Schedules 4 and 5, that in the case of numerous
environment related functions, more than one sphere of government has legislative and/or
executive and administrative authority, and that this authority is often exercised concurrently by
different government agencies.
Legislation may impact on functional areas of competence. For instance, in terms of the
Constitution, air pollution is an area of national, provincial and local government competence,
but the APPA assigns the control of noxious and offensive emissions and dust control to
national government, while assigning the control of smoke pollution and vehicular emissions to
local authorities.
2.5 Environmental Law Reform and Air Quality Management
Since 1992, the DEAT acknowledged that pollution and waste management governance was
inadequate in dealing with South Africa’s changing social and industrial context. DEAT
initiated a policy development process known as the Integrated Pollution Control (IPC) process.
This process drew many concerns from civil society and was subsequently abandoned. A new
process, known as the Consultative National Environmental Policy Process (CONNEPP) was
initiated in 1995. This process was tasked with the development of an overarching
environmental policy for South Africa.
The drafting of the Constitution of South Africa (No. 108 of 1996) allocated national, provincial
and local authority responsibilities for environmental management. The Constitution also set out
the legislative and executive authority of the different spheres of government within a
framework of cooperative governance. It highlighted the concurrent responsibility of national,
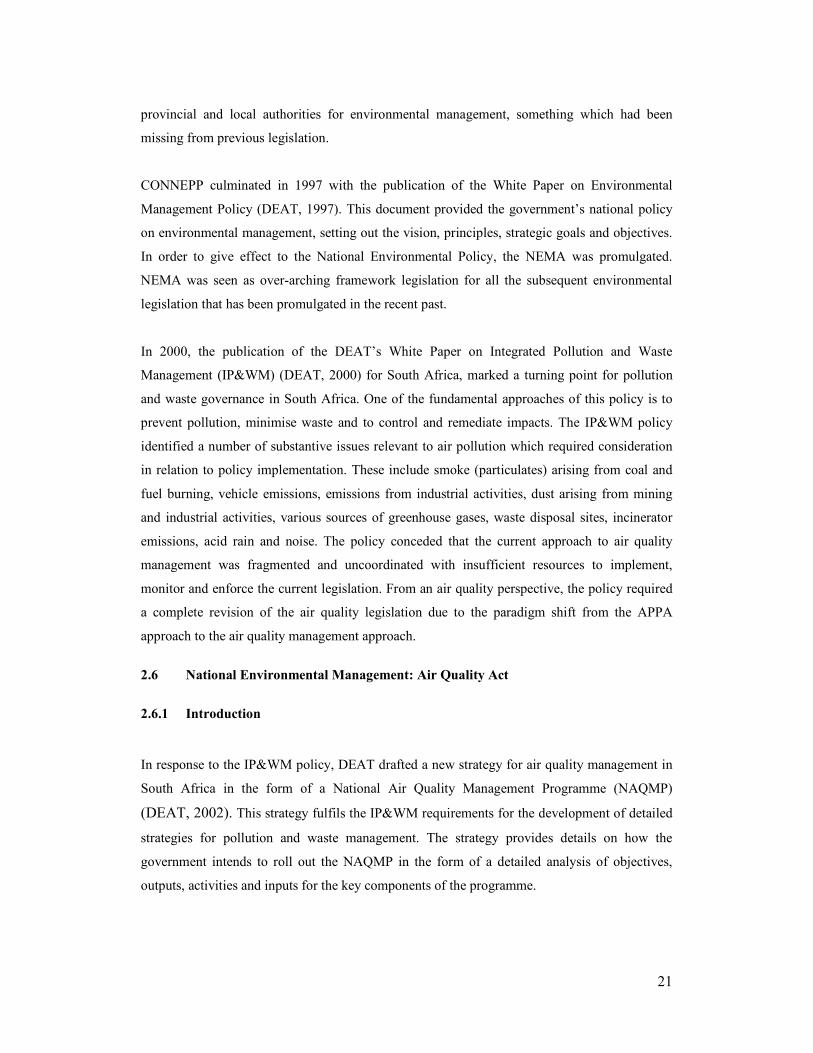
21
provincial and local authorities for environmental management, something which had been
missing from previous legislation.
CONNEPP culminated in 1997 with the publication of the White Paper on Environmental
Management Policy (DEAT, 1997). This document provided the government’s national policy
on environmental management, setting out the vision, principles, strategic goals and objectives.
In order to give effect to the National Environmental Policy, the NEMA was promulgated.
NEMA was seen as over-arching framework legislation for all the subsequent environmental
legislation that has been promulgated in the recent past.
In 2000, the publication of the DEAT’s White Paper on Integrated Pollution and Waste
Management (IP&WM) (DEAT, 2000) for South Africa, marked a turning point for pollution
and waste governance in South Africa. One of the fundamental approaches of this policy is to
prevent pollution, minimise waste and to control and remediate impacts. The IP&WM policy
identified a number of substantive issues relevant to air pollution which required consideration
in relation to policy implementation. These include smoke (particulates) arising from coal and
fuel burning, vehicle emissions, emissions from industrial activities, dust arising from mining
and industrial activities, various sources of greenhouse gases, waste disposal sites, incinerator
emissions, acid rain and noise. The policy conceded that the current approach to air quality
management was fragmented and uncoordinated with insufficient resources to implement,
monitor and enforce the current legislation. From an air quality perspective, the policy required
a complete revision of the air quality legislation due to the paradigm shift from the APPA
approach to the air quality management approach.
2.6 National Environmental Management: Air Quality Act
2.6.1 Introduction
In response to the IP&WM policy, DEAT drafted a new strategy for air quality management in
South Africa in the form of a National Air Quality Management Programme (NAQMP)
(DEAT, 2002). This strategy fulfils the IP&WM requirements for the development of detailed
strategies for pollution and waste management. The strategy provides details on how the
government intends to roll out the NAQMP in the form of a detailed analysis of objectives,
outputs, activities and inputs for the key components of the programme.

22
The drafting of new air quality legislation was one of the initial goals of the NAQMP. This
process culminated with the promulgation of the AQA in February 2005. The introduction of
new air quality legislation in South Africa will see air pollution managed in a more holistic and
integrated manner with the devolution of powers down to the local municipal level and the
introduction of priority areas that will concentrate on “hotspots”. The focus will shift towards
managing air quality based on ambient concentrations with the introduction of ambient air
quality standards. Ambient air quality standards have been prepared and these are based
primarily on health related criteria, using the best available international research and
information. Global issues such as climate change and greenhouse gas emission also receive
attention in the new legislation.
Equally important is the framework legislation provided by the NEMA, within which the AQA
resides, providing government with the regulatory tools to implement NEMA policy in the field
of air quality. The AQA is one of the pieces of legislation in a suite of laws framed within
NEMA. Other legislation under NEMA includes the National Water Act (No. 36 of 1998),
National Environmental Management: Protected Areas Act (No. 57 of 2003), National
Environmental Management: Biodiversity Act (No. 10 of 2004), National Environmental
Management: Integrated Coastal Management Act (No. 24 of 2008) and National
Environmental Management: Waste Act (No 59 of 2008).
2.6.2 Passage of the Air Quality Bill
The process leading up to the promulgation of the Act was rather protracted and at times
difficult. The Bill was initially issued for public comment on 1 April 2003, whereafter a number
of submissions were made to the DEAT by a wide range of stakeholders. In total 240 comments
were received from 23 different organisations (DEAT, 2004). The submissions covered a wide
range of topics, namely, points of clarity, provisions for appeals, changing voluntary obligations
to compulsory obligations (changing may to must), provisions for exemption and revisions to
specified timeframes (DEAT, 2004). In response to these submissions the Bill was revised and
then submitted to the NCOP for consideration on 1 October 2003. A Select Committee reviewed
the document and made recommendations for limited changes to the Bill. The Bill was then
passed to the National Assembly for consideration. The Parliamentary Portfolio Committee for
Environmental Affairs and Tourism held public hearings on 3 and 4 February 2004.
Stakeholders ranging from industry to Non Government Organisations (NGOs) and Community
Based Organisations (CBOs) made presentations and submissions to the Committee (DEAT,
2004). Based on the concerns and issues raised during these hearings, the Bill was withdrawn

23
for further revision. The Bill was re-introduced following the General Elections in April 2004.
The amended Bill was debated in the National Assembly on 25 August 2004 and passed.
Following approval from the NCOP the Bill was signed by the President on 19 February 2005.
2.6.3 Critical Analysis of AQA
A critical feature of the AQA is that it is consistent with our constitutional right to an
environment that is not harmful to our health or well-being. In earlier drafts of the Bill, this
emphasis on the protection of human health and the environment was not explicit, but through
concerted lobbying by stakeholders, the object of the legislation was revised to its current form.
APPA has been criticized for its lack of transparency. The BPM approach allowed officials and
industry to decide on an emissions target on the basis of a non-transparent process of
negotiation. Under the AQA, legislated ambient air quality and emissions standards must be
established and applied nationally. The AQA makes provision for setting of provincial and local
emission standards, on condition that the standards are stricter than the national standards. The
process of establishing national standards and any subsequent provincial and local standards is
clearly specified, with the public consultation and participation processes integral to the process.
A list of offences is given in Chapter 7 of the AQA. These include conducting a listed activity
without a license or contravening the conditions of a license, as well as failing to submit
relevant reports, such as a pollution prevention plan or an atmospheric impact report. The
provision of false information during the licensing process is also regarded as an offence. In
contrast to the APPA, offences are now explicitly stated and hence are more likely to lead to
prosecutions than under the APPA. Few prosecutions by the state under the APPA were
successful. Enforcement is expected to improve as it will involve all spheres of government,
including provincial and local government. All spheres of government are empowered to issue
fines to offenders.

24
Table 2.1: Summary of the Differences between APPA and AQA
APPA AQA Source-based emission control Combination of ambient air quality
management approach and source-based
control Source-based approach using BPM Effects-based approach using Air Quality
Management (AQM)
Four categories of control - noxious or offensive gases - dust - smoke - vehicle emissions
Potentially covers all pollutants identified by the Minister, including odour and noise
No legal requirement for ambient air quality
monitoring Requires municipalities and provinces to
undertake ambient air quality monitoring Identifies scheduled processes
Identifies listed activities
Required to appoint a National Air Pollution
Advisory Committee (NAPAC) but may
appoint a CAPCO
May appoint a National Air Quality Advisory
Committee (NAQAC) but must appoint a
national, provincial and local air quality officer Weak penalty system for offenders Stricter penalty system of fines and prison
sentences Does not protect public health or the
environment Upholds the constitutional right to a safe and
healthy environment Does not address trans-boundary and
international issues / obligations Addresses trans-boundary and international
issues / obligations Lacking in transparency and accountability Includes a provision for co-operative
governance Makes no provision for solving problems in hotspot areas
Requires preparation of an Air Quality
Management Plan (AQMP) to address air
quality issues in a particular area Issuing of permits based on non-transparent negotiation between government and industry
Requires industry to make public their
application for a license
A key issue to be addressed in improving air quality management in South Africa is effective
coordination between a variety of different government departments. For example, the
Department of Minerals and Energy has an active interest in motor vehicle emissions and air
pollution from domestic fuel use, the Department of Health (once the implementing agency for
APPA) has an interest in the public health aspects or air pollution, the Department of Transport
can have a huge bearing through suitable transport planning and so forth. Coordination between
these departments will be crucial in ensuring that there is no duplication or that issues are not
effectively addressed because there is little or no buy-in from the necessary state department.
Progress has already been made with the formation of the Intergovernmental Task Team

25
between the Departments of Energy, Transport and Environmental Affairs to formulate and co-
ordinate regulatory controls for motor vehicles.
The AQA is generally considered to be framework legislation, and as such, provision was made
under section 7 of the Act for the development of a National Framework. The National
Framework for Air Quality Management in South Africa was gazetted on 11 September 2007
and provided detailed guidance on the implementation of the AQA (DEAT, 2007a). The
National Framework expanded on the methodology to be followed during the development of
the air quality management tools for the efficient and effective implementation of the AQA.
During the drafting of the 2007 National Framework a number of the transitional projects
undertaken in preparation for the transition to the AQA had not yet been completed. Section 7.1
of the National Framework indicated that the 2007 version was considered a 1st Generation draft
and this would be followed by a more complete document (2nd Generation) by September 2008.
The DEA has decided to postpone the revision of the National Framework, in order to include
additional regulatory information i.e. guidance on atmospheric dispersion modelling.
The National Framework specifies that the repeal of the APPA and full entry into effect of the
AQA will take place in the 2009/10 financial year (DEAT, 2007a). The DEA initially indicated
that 11 September 2009 was an internal target date for the transition, however this date was not
achieved due to internal delays relating to restructuring following the 2009 General Elections.
The revised target date for the transition was 1 April 2010. This allowed sufficient time for
finalisation of all the necessary regulations, templates and guidance documents. Critical path
items outstanding as at 1 December 2009 were the ambient air quality standards as required in
terms of Section 9 of AQA, the listed activities and associated minimum emission standards as
required in terms of Section 21 of the AQA and the licencing templates required in terms of
Section 37 of the AQA. This delay also allowed additional capacity building and skills
development opportunities with the provincial and local government authorities.

26
CHAPTER 3
REVIEW OF INTERNATIONAL APPROACHES TO AIR QUALITY MANAGEMENT
3.1 Introduction
This chapter provides a review of the legislative requirements and the frameworks under which
air quality management for five different international examples are applied, with specific
emphasis on how these systems manage areas with ambient air quality concentrations in excess
of local standards or limit values. Particular attention is paid to the methodology used to define
or delineate the boundary of the air quality management areas, zones or regions. The chapter
first examines the European Union’s (EU) approach to air quality management and notes that
the EU does not define a specific methodology for the identification of air quality management
zones within Member States. However, general guidance is provided to ensure a degree of
consistency across the Union. Secondly, a detailed analysis on the definition of boundaries of air
quality management areas in the United Kingdom (UK) is given, followed by the United States’
approach under the Clean Air Act. The division of powers between the federal government and
the states is described, again with specific emphasis on how the air quality management
planning systems identify areas that do not comply with the National Ambient Air Quality
Standards (NAAQS). The Australian approach to air quality management is reviewed, with
emphasis on how the National Environmental Protection Measures (NEPMs) have been used
together with population density, detailed emission inventories, topography and atmospheric
dispersion potential in the identification of regional and local airsheds. Finally, an analysis of
New Zealand’s approach to air quality management planning under the Resource Management
Act is undertaken, with specific reference to the identification of local air management areas
(LAMAs).
3.2 European Union
The European Economic Community (EEC) formed in 1956 and did not begin to take specific
actions with respect to environmental protection until the 1980s when the scope of pollution-
related damages to Europe’s forests and other ecosystems began to be recognized. In fact the
EU did not get a constitutional basis for acts with respect to environmental protection until the
1987 Single European Act (Goldenman and Levina, 2004). In the meantime, a number of
Member States had already developed air quality management initiatives. Part of the challenge
for the EU has therefore been to harmonize not only air quality standards, but also the national

27
systems in place for assessing and monitoring air quality (Elsom, 1999). Figure 3.1 shows the
timeline of EEC / EU directives associated with air quality management.
Figure 3.1 Timeline for the adoption of EU Directives to address air pollution (after
Longhurst et al., 2009)
As at November 2009 the EU currently comprises 27 Member States, including amongst others,
the UK, Germany, France, Spain and Italy. Whilst the major objectives of the organisation are
economic and political regional co-operation, environmental action has been motivated to come
under this overall theme (Elsom, 1992; Jacobson, 2002; EEA, 2004). Using directives,
1980
1990
2000

28
regulations and decisions, the EU promotes environmental concern among Member States.
Directives are binding, although they include consideration for conditions in individual states,
while regulations apply uniformly across nations and decisions are directed at specific Member
States. The 1996 Air Quality Framework Directive (AQFD) and its Daughter Directives were
aimed at establishing a harmonized structure for assessing and managing air quality throughout
the EU. This approach saw a shift from the “command and control” approach to air quality
management to an approach that managed air pollution through ambient standards (Longhurst et
al., 2009). This is the approach to air quality management that has been adopted by the new
South African air quality legislation.
The AQFD had four overarching objectives, the first of which was to define and establish
objectives for ambient air pollution that was protective of human health and the environment;
secondly, it sought to provide a standardized methodology for the assessment of ambient air
quality in Member States; thirdly, to allow for the public dissemination of the ambient air
pollution information gathered; and finally, to maintain ambient air quality where it is
considered good and realize an improvement in areas where it is considered poor.
In addition to each Member State’s obligation to address air quality management, they are
required to comply with Directives in other environmental sectors, including waste
management, water quality and nature conservation. There are three types of plans found in EU
air quality legislation; firstly, plans to achieve specific air quality objectives; secondly, short-
term plans to address urgent air quality exceedences; and thirdly, plans to reduce emissions
from sources.
Within this structure, the EU Member States are given considerable scope to determine what
actions they will take in order to meet their commitment to achieve the air quality objectives
within their territories. However, the Member States must at the same time implement the other
EU-level measures that comprise the overall EU air quality management system. These include
controls over stationary sources of polluting emissions to air, such as large combustion plants,
industrial installations, and facilities using solvents. Other EU-level measures aim to reduce
emissions from mobile sources, such as road traffic, and include technical requirements to limit
air emissions from various types of motor vehicles as well as fuel quality standards (Fenger,
2002). Finally, the National Emission Ceilings (NEC) Directive (2001/81/EC) establishes
national emissions ceilings for sulphur dioxide (SO2), oxides of nitrogen (NOx), volatile organic
compounds (VOCs) and ammonia (NH3) (EC, 2001).

29
The Framework Directive requires that all Member States divide their territories into zones and
agglomerations. Agglomerations are special zones that are defined as having greater than 250
000 inhabitants. The concept of a zone enables Member States to sub-divide their territories into
basic areas for air quality management (EC, 1996). The Framework Directive does not prescribe
a specific methodology to be used but guidance documents were drafted to assist in the
designation of zones (Van Aalst et al., 1998; EC, 2003). One of the stated goals of the
Framework Directive was to allow for direct comparability between the Member States; as such
there is great benefit in applying a consistent approach. It has been recommended that
approaches considered in other Member States should be taken into account and reasons for
major deviations from the general trend should be carefully considered before making a final
decision.
The zones are determined based on the ambient air pollution concentrations determined at
various sites within the Member States. The nature of the assessment requirements depend on
the observed ambient concentrations in relation to the limit and threshold values. Each of the
Daughter Directives specifies a limit value and two threshold values for each pollutant. The
upper assessment threshold (UAT) and the lower assessment threshold (LAT) are both lower
than the limit value and are defined as percentages of the limit value. Figure 3.2 shows the
implications of exceedence of the limit value, UAT and LAT in terms of the assessment
requirements.
Figure 3.2 Implications of exceedence of the limit value, UAT, LAT for compliance
judgment and assessment requirements in a zone (EC, 2003)

30
Any ambient concentration above the limit value is considered to be in non-compliance, subject
to the specific attainment date for that specific pollutant. Zones with ambient concentrations in
excess of the UAT trigger the assessment requirements of Regime 1 (Area of Poor Air Quality).
These include mandatory high quality ambient air quality monitoring, which may be
supplemented by information from other sources including air dispersion modeling. Zones with
ambient concentrations in excess of the LAT but below the UAT trigger the assessment
requirements of Regime 2 (Area of Improving Air Quality). These include mandatory ambient
air quality monitoring but at fewer sources than Regime 1. Less intensive ambient monitoring
techniques, namely passive sampling, may be used. Zones with ambient concentrations below
the LAT trigger the assessment requirements of Regime 3 (Area of Good Air Quality). Regime
3 is divided into two separate categories, agglomeration and non-agglomeration zones. In
agglomeration zones at least one ambient monitoring site is required and this can be
supplemented with dispersion modeling, objective estimation and indicative measurements. In
non-agglomeration zones dispersion modeling, objective estimation and indicative
measurements alone are considered sufficient (EC, 1996).
Figure 3.3 shows a schematic diagram of how the level of air quality management in each zone
is determined based on the measured ambient concentrations in relation to the limit value and
the margin of tolerance.
Figure 3.3 Schematic diagram used to determine zone allocation (EC, 2003)
If an area falls into Group 1, where the ambient air pollution concentrations are in excess of the
limit value and the margin of tolerance, then this zone is deemed to have the worst air quality.

31
This triggers the preparation of a detailed action plan for the area, demonstrating how the
Member State will achieve the limit value by the designated attainment date. If an area falls into
Group 2, where the ambient air pollution concentrations are in excess of the limit value but
below the margin of tolerance, then this zone is not required to prepare an action plan, but must
report ambient air pollution concentrations to the Commission on an annual basis and also
indicate any necessary steps to achieve the limit value by the attainment date. If an area falls
into Group 3, where the ambient air pollution concentrations are below the limit value, then this
zone is only required to report ambient air pollution concentrations every three years.
The European Commission (EC) (2003) documented and recommended the following zone
designation process. The process commences with a preliminary assessment of how air quality
is spatially distributed in the territory of the country or region that is responsible for the
designation of zones. This focuses on the pollutants addressed by the first Daughter Directive,
but it is also considers the pollutants of subsequent Daughter Directives, as far as possible. In
the preliminary assessment, all relevant air quality parameters (annual averages, exceedences of
hourly/daily values) are taken into account. Then an attempt is made to identify areas of similar
air quality characteristics, in terms of exceedences, source types, climatology and topography.
The results of the preliminary assessment are then overlaid onto a map of territories of local
administrations with competence regarding the control of sources. The borders of the
administrative territories are then proposed as the possible delineations of zones. Where
possible, it is recommended that administrative territories with similar air quality characteristics
are combined into larger areas. It is, however, important to note that zones should primarily be
regarded as administrative entities for which the Framework Directive defines specific
assessment, reporting and management requirements (EC, 2003).
The EC (2003) recommended that the following general principles should be taken into account
when undertaking the zone designation process to ensure transparency. The use of existing
administrative boundaries (cities, provinces and municipalities) was encouraged to allow
citizens to clearly identify the zoning of a particular location. The borders of zones should be
fixed in time, except for formal amendments that may occur from time to time. The EC (2003)
cautioned against the use of spatial statistics, namely population density, as this criterion may be
undefined for individual locations and changes continuously over time.
The EC recommended the following considerations be taken into account in the definition of
zones (EC, 2003). As highlighted above, the importance of linking zone boundaries to

32
administrative areas is reemphasized. The grouping of adjacent administrative areas with similar
air quality characteristics is recommended. It is not recommended to group a spatially separated
agglomeration with surrounding areas. The EC recommends that Member States have a clear
and consistent definition of what comprises an agglomeration. The guidance provided indicates
that built-up areas, not separated by more than a few kilometers, with a population in excess of
250 000 people, constitutes an agglomeration. Further guidance is provided to recommend that
the agglomeration does not include significant areas that are not built-up. For the sake of
consistency in reporting to the European Parliament and the EC, it is recommended that
Member States or authorities within the countries do not deviate from the mainstream
approaches used by the majority. This has the potential to create discrepancies within Member
States and create public confusion. The use of highways as the boundaries of zones is
discouraged, due to the high variability in the air pollution impact of this particular source. The
administrative capacity and the legislative mandate of the sphere of administration must be
taken into consideration when defining the boundaries of the zone. Overly small zones may
result in an unacceptable administrative burden in some areas, while overly large zones may
require co-operation and co-ordination between different spheres of government with different
administrative mandates. The EC also recommended against the designation of a zone around a
single industrial operation, unless this would facilitate air quality management.
While it not possible to detail the approach to the identification of zones in each Member State
of the EU, a detailed review of the process followed by the United Kingdom authorities is
provided in Section 3.3.
Table 3.1 provides a summary of the number of zones declared by each of the EU Member
States based on their 2005, 2006 and 2007 submissions to the European Commission under the
Framework Directive and the First, Second, Third and Fourth Daughter Directives. A significant
difference between the three years is the inclusion of reporting from two new Member States
(Bulgeria and Romania) in 2006 and the voluntary reporting of pollutants under the Fourth
Daughter Directive in 2007. Further discussion is provided below.

33
Table 3.1: Summary of the number of air quality management zones declared by the EU
Member States (Vixseboxse and De Leeuw, 2007, 2008; De Leeuw and Vixseboxse, 2008)
Member State 2005 Zones 2006 Zones 2007 Zones Austria 19 19 19 Belgium 17 17 18 Bulgeria Not part of EU 6 6 Cyprus 1 1 1 Czech Republic 15 15 15 Denmark 10 10 3 Estonia 4 4 4 Finland 18 18 18 France 87 88 81 Germany 140 120 120 Greece 4 4 4 Hungary 11 11 11 Ireland 4 4 4 Italy 144 121 115 Latvia 2 2 2 Lithuania 3 3 3 Luxembourg No submission 3 No submission Malta 2 2 2 Netherlands 9 9 No submission Poland 362 362 186 Portugal 26 26 27 Romania Not part of EU 4 21 Slovakia 10 10 11 Slovenia 9 9 9 Spain 140 138 138 Sweden 6 6 6 United Kingdom 43 44 44 Total No. of Zones 1064 1056 868
An analysis of the information presented in the 2007 report (De Leeuw and Vixseboxse, 2008)
indicates that the area of the zones varies from 0.8 km2 to 338 145 km2 and that the population
within the zones varies from 3 000 to 9 833 408. The zones have been sub-divided according to
the pollutant specified in the First, Second and Third Daughter Directives. A total of 752 zones
have been identified due to SO2, 783 zones for nitrogen dioxide (NO2), 770 zones for PM10, 636
zones for lead (Pb), 674 zones for benzene (C6H6), 705 zones for carbon monoxide (CO) and
550 zones for ozone (O3). In the EU271 Member States about 25-30% of the zones have been
given the status of agglomeration zones which has implications for the number of required
monitoring stations, since continuous ambient air quality monitoring is required in these areas.
The ratio of the number of agglomerations to the total number of zones varies strongly between
1 The 27 EU Member States after accession of 12 new Member States in 2004 and 2007

34
the Member States: less than 10% of the zones are classified as agglomeration zones in Cyprus,
Finland, Hungary and Poland; in Bulgaria, Denmark, United Kingdom and Lithuania more than
60 % are classified as agglomeration zones. Excluding Cyprus which has not defined an
agglomeration but only one zone covering the whole country and Bulgaria which has designated
all zones as agglomeration, the percentage of national population living in agglomerations
varies between 12% (Slovakia) and 68% (Malta). On average about one third of the EU27
population reside in agglomerations (De Leeuw and Vixseboxse, 2008).
In 2006 there were 4 386 ambient monitoring stations reporting to the European Environment
Agency’s European Topic Centre on Air and Climate Change (EEA/ETC-ACC) (Vixseboxse
and De Leeuw, 2008). This comprised 3 020 NO2 analysers, 2 456 PM10 analysers, 2 324 SO2
analyers and 1 886 O3 analysers.
3.3 United Kingdom
The UK has a long history in dealing with air pollution issues, dating back to the 17th Century
(Evelyn, 1661). The first attempt to legally regulate air pollution from industrial sources was
through the creation of the Alkali Inspectorate under the 1863 Alkali Act. This was followed in
1906 with the Alkali Works Regulation Act. This Act sought to regulate the emission of
noxious and offensive gases from common industrial processes, namely chemical industries,
petroleum refineries, petrochemical industries, electricity generation, coal carbonization, iron
and steel works, non-ferrous metals and mineral processing works (HM Government, 1906).
This legislation formed the basis of the APPA, which was the first air quality legislation in
South Africa.
Figure 3.4 shows the progression of air quality legislation in the UK during the 20th Century,
commencing with the Alkali Works Regulation Act in 1906 and culminating with the
Environment Act of 1995. The London smogs experienced in the early 1950s saw a renewed
momentum in air quality legislation in the UK, which ultimately led to the promulgation of the
Clean Air Act in 1956. This saw the first introduction of emission limits and other pollution
control requirements via the application of BPM (Ireland et al., 1979). In the ensuing years there
were reductions in the industrial and domestic emissions, primarily due to the introduction of
smokeless zones in the major urban centres (Walton et.al., 2001; Longhurst et.al., 2009). The
process of fuel switching, away from coal to gas, and the wider use of electricity in industrial
processes, combined with enterprise relocations, were the major drivers in the improvement in
ambient air quality conditions.

35
Figure 3.4 Timeline of the adoption of UK Acts to address air pollution (after
Longhurst et al., 2009)
As highlighted in Section 3.2, the 1980s saw the growth of the awareness of environmental
issues, including air quality, in the EC. As a Member State of the EC, the UK began to adopt
and implement provisions of the Directives relating to ambient air quality standards (EEC,
1980; 1982; 1985). The European Council Directive 96/62/EC on Ambient Air Quality
Assessment and Management, commonly referred to as the Framework Directive, was
introduced in 1996 (EC, 1996).
During the 1990s air quality re-emerged as an important environmental policy issue in the UK
(Walton et al., 2001). In 1990, the UK Government published its environmental strategy in a
White Paper entitled “This Common Inheritance” (HM Government, 1990). This saw a move
away from an emissions-based policy to an effects-based policy, primarily due to growing
public concern over health effects relating to air pollution (Longhurst et al., 2009). The Expert
Panel on Air Quality Standards (EPAQS) was established and tasked with the development of
ambient air quality standards for the UK based on the best available epidemiological
information. The ambient standards produced by the EPAQS were the cornerstone of a new
risk-based approach to air quality management in the UK. The 1995 Environment Act saw the
introduction of a new framework termed Local Air Quality Management (LAQM), which
combined the new ambient standards with the existing technology based control of air pollution.
1900
1980
1990

36
This new approach to air quality management saw the delegation of the air pollution control and
management to local government, while national government retained the policy and co-
ordination function. This delegation of the air quality management function to the lowest sphere
of government is the same operational philosophy envisaged in the new South African air
quality legislation. The UK has over 10 years of operational experience of this model that could
provide useful guidance for South Africa.
Section 80 of the 1995 Environment Act requires the Secretary of State to publish a National
Air Quality Strategy (NAQS) as soon as possible. The NAQS was first published in 1997 (DoE,
1997) and then reviewed, updated and amended in 2000 (DETR, 2000) and 2007 (Defra, 2007).
The focus of the NAQS was the establishment of health-based ambient air quality standards for
eight pollutants, namely C6H6, CO, Pb, NO2, O3, PM10, SO2 and 1,3-butadiene (C4H6) (Beattie
et.al., 2001). Section 83 of the 1995 Environment Act requires a local authority, for any area
where the ambient air quality standards are not being met, to issue an order designating an air
quality management area (AQMA) (HM Government, 1995). With the publication of the NAQS
in December 1997, the local authorities were legally obliged to start the process of designating
AQMAs. Figure 3.5 details the assessment procedure followed by local authorities in terms of
the NAQS.
Figure 3.5 Schematic illustration of the implementation of the NAQS by local
authorities (Woodfield et al., 2003)

37
In terms of Figure 3.5 the local authorities are required to carry out a process termed Review
and Assessment. The process requires the local authority to define the current and future state of
local air quality. The work is considered to be continuous by the UK Government, however, the
process has been broken down into distinct phases of work, referred to as Rounds. The
Government plays an oversight role to ensure that the work undertaken by the local authorities
is being conducted in an appropriate manner (Longhurst et al., 2009). The First Round of
Review and Assessment commenced in 1998 and concluded in 2001. During this time 129 local
authorities declared one or more AQMAs. The Second Round commenced in 2003 and the
Third Round commenced in 2006. Figure 3.6 shows the progressive number of AQMAs
declared in the UK in the period 1997 – 2007. In December 2008 the total number of AQMAs
in the UK was 294 (Vaughan, 2009). Figure 3.7 shows the distribution of these AQMAs in the
UK.
Figure 3.6 Number of local authorities with AQMAs during the period March 1999 –
2007 (Longhurst et al., 2009)
Beattie et al. (2000) identified the need for sound science to underpin the AQMA designation
process, to ensure that the process achieved its ultimate objective of achieving the UK ambient
air quality standards in all areas. The National Society for Clean Air and Environmental
Protection (NSCA) (now Environmental Protection UK) published a toolkit for local authorities
to assist them in the definition and declaration of AQMAs (NSCA, 2000). The document
acknowledged the challenge facing the local authority in defining the geographical boundary of
the AQMA. It also highlighted the importance of communication and consultation with all
stakeholders during the process. The toolkit provides guidance on the assessment of uncertainty

38
from outputs of dispersion models and the validation of the modeled results against observed
ambient air quality data.
A study undertaken by Woodfield et al. (2002) highlighted that the process of determining
AQMA boundaries in the UK had emerged as highly variable. In addition the methodologies
employed by the local authorities to determine the boundary of the AQMA were also highly
variable. The results of the study indicated that most AQMAs were based on the outputs of
dispersion modeling studies, with very few local authorities using actual observed ambient air
quality data. The modeling techniques and the consideration of uncertainty varied considerably
between local authorities. Due to the uncertainty of the results, many local authorities applied
the precautionary principle and declared a larger area than indicated by the modeled results or
alternatively declared the entire local authority as an AQMA, thereby reducing the potential risk
of failing to identify any location of public exposure to predicted ambient air quality standard
exceedences (Woodfield et al., 2002). The methods used by local authorities for determining the
exact boundary on an AQMA varied considerably. Some chose to use administrative
boundaries, others chose physical boundaries such as roads, rivers and railway lines (Woodfield
et al., 2002). Various other local factors were identified as influencing the determination of the
boundary of the AQMA. These included the local authority political regime (perceived blight
factor) and factors that may impact on the overall effectiveness of an Action Plan to improve
local air quality (Beattie et al., 2000).
There appears to be some confusion when comparing the number of AQMAs declared in the
UK at the end of 2007 (294) in terms of the UK’s Local Air Quality Management (LAQM)
process, with the number of air quality management zones reported to the EC in terms of the
Framework Directive (44) for the same period. It must be noted that the LAQM process is UK
specific and arises from the national requirements required in terms of the Environment Act.
While the air quality regulations issued in terms of the LAQM process are aligned to the
requirements of the EC Daughter Directive requirements, the LAQM process is not the delivery
vehicle for achieving compliance with the EC Framework Directive requirements.

39
Figure 3.7 Location of local authorities with AQMAs – December 2008 (Vaughan,
2009)
3.4 United States
The Air Pollution Control Act of 1955 was the first federal air pollution law in the United States
(US). Before its enactment, there were several state and local pieces of legislation addressing air
pollution, but due to increasing awareness regarding the negative impacts of air pollution on
public health, ecosystems and the economy, the US government decided that air pollution
should be managed on a national basis (NRC, 2004). The main purpose of this initial Act was to
provide research and technical assistance to enable the control of air pollution at its source, but
it did little to prevent or reduce air pollution. These initial efforts were enhanced over the next
15 years through the enactment of additional air quality legislation. This included the Clean Air
Act (CAA) of 1963 and the Air Quality Act of 1967. The creation of the US Environmental
Protection Agency (US-EPA) and the passage of CAA amendments in 1970 helped to establish
the basic framework by which air quality is managed in the US. This framework was further

40
developed and refined with the passage of further amendments to the CAA in 1977 and 1990
(NRC, 2004). As the impacts from air pollution have become more evident, the legislation has
become increasingly complex and ambitious (NRC, 2004).
The CAA prescribed a complicated set of responsibilities and relationships between the federal
(national), state (provincial), tribal and local agencies. The US-EPA co-ordinates the federal
government’s efforts and is responsible for the development of national ambient air quality
standards (NAAQS), in addition to co-ordinating the national approaches to air pollution
mitigation (EC, 2004).
The CAA, as amended, identifies five major goals for protecting and promoting human health
and public welfare. These include:
• Mitigating potentially harmful human and ecosystem exposure to six criteria pollutants,
namely CO, NO2, SO2, O3, particulate matter (both PM10 and PM2.5) and Pb;
• Limiting the sources of and risks from exposure to hazardous air pollutants, which are
also called air toxics;
• Protecting and improving visibility impairment in wilderness areas and national parks;
• Reducing the emissions of species that cause acid rain, specifically SO2 and NOx; and
• Curbing the use of chemicals that have the potential to deplete the stratospheric ozone
layer.
State and local governments are given much of the responsibility to develop, implement, and
enforce specific strategies and control measures to achieve the national standards and goals.
Although many aspects of the AQM system assume a collaborative relationship between the
federal, state, and local agencies, the US-EPA oversees all activities carried out by these
agencies. This oversight includes the authority to impose federal sanction and federally devised
pollution control plans on non-performing authorities. Under US law the federal courts have a
role in air quality management. All air quality related matters promulgated under the CAA are
subject to judicial review. The court, usually the Court of Appeals for the District of Columbia,
has the power to set aside any regulations, or portions of regulations, deemed to be “arbitrary
and capricious” (NRC, 2004). In addition, any private citizen may file a civil action against the
US-EPA.
For the purposes of administering the air quality management system, the CAA adopted the air
quality control regions (AQCRs) which were previously designated under the 1967 Air Quality

41
Act. This Act based its measures within ten atmospheric regions grouped according to
homogeneous meteorological, climatic and topographical factors. These were divided into 247
air quality control areas (AQCAs) or airsheds, composed of groups of communities to be treated
as a unit for the implementation of air quality standards within which non-attainment areas
would be designated (McGrory, 1990). The 1990 CAA Amendments updated the boundaries of
the original AQCAs based on new statistical data. Each of these AQCAs is required to
undertake an inventory of emissions from fixed sources every year and from mobile sources
every three years. The emissions inventory from fixed sources is informed either directly from
emission testing or continuous emission monitoring (CEM) or the application of emission
factors, namely AP 42. The emission factors in AP 42 facilitate the estimation of emissions
from a variety of air pollution sources and are considered to be representative of long-term
emission averages for all facilities in the source category (US-EPA, 2004).
Based on the NAAQSs and ambient quality monitoring data records, each of the AQCAs is
designated as either:
• Non-attainment area - any area that does not meet (or that contributes to ambient air
quality in a nearby area that does not meet) the primary or secondary NAAQS for the
pollutant;
• Attainment area - any area that meets the primary or secondary NAAQS for the
pollutant and does not contribute to the violation of the standards in a nearby area;
• Unclassifiable area - any area that cannot be classified on the basis of available
information as meeting or not meeting the primary or secondary NAAQS for the
pollutant.
It is important to note that after the promulgation of a new or revised NAAQS each state is
required to undertake a review of the designations of the AQCRs under their jurisdiction.
Following the initial designation there is further consultation and the US-EPA must make their
final area designations within two years of the promulgation of the NAAQS (Walton et al.,
2001).
Table 3.2 summarises the number of non-attainment AQCRs declared in the US together with
the pollutant that caused the declaration. The table provides two PM2.5 values, one based on the
standard that was introduced in 1997 and a second value based on an updated standard
introduced on 17 December 2006. Non-attainment areas, as defined in the primary legislation,

42
are those areas where ambient air quality fails to achieve the national standards, however, only
areas that persistently fail to achieve the national standards are designated (Walton et al., 2001).
Table 3.2: Summary of the AQCRs in the United States as at 18 November 2009 (US-
EPA, 2009)
Pollutants Total Number of Non-
Attainment AQCRs O3 – 8-hour 52 PM2.5 (1997) 39 PM2.5 (2006) 31
PM10 47 CO 1 SO2 9 Pb 2
Figure 3.8 shows the distribution of non-attainment AQCRs in the US. The map does not
indicate which pollutant is not in compliance but indicates if the AQCR is a single or multi-
pollutant non-attainment area.
Figure 3.8 Location of non-attainment AQCRs in the US (US-EPA, 2009)
In addition, the CAA classifies non-attainment areas according to the severity of the exceedence
of the concentration levels. For example, O3 non-attainment areas are classified as either
marginal, moderate, serious, severe-15, severe-17, or extreme. Similarly, CO and PM10 non-
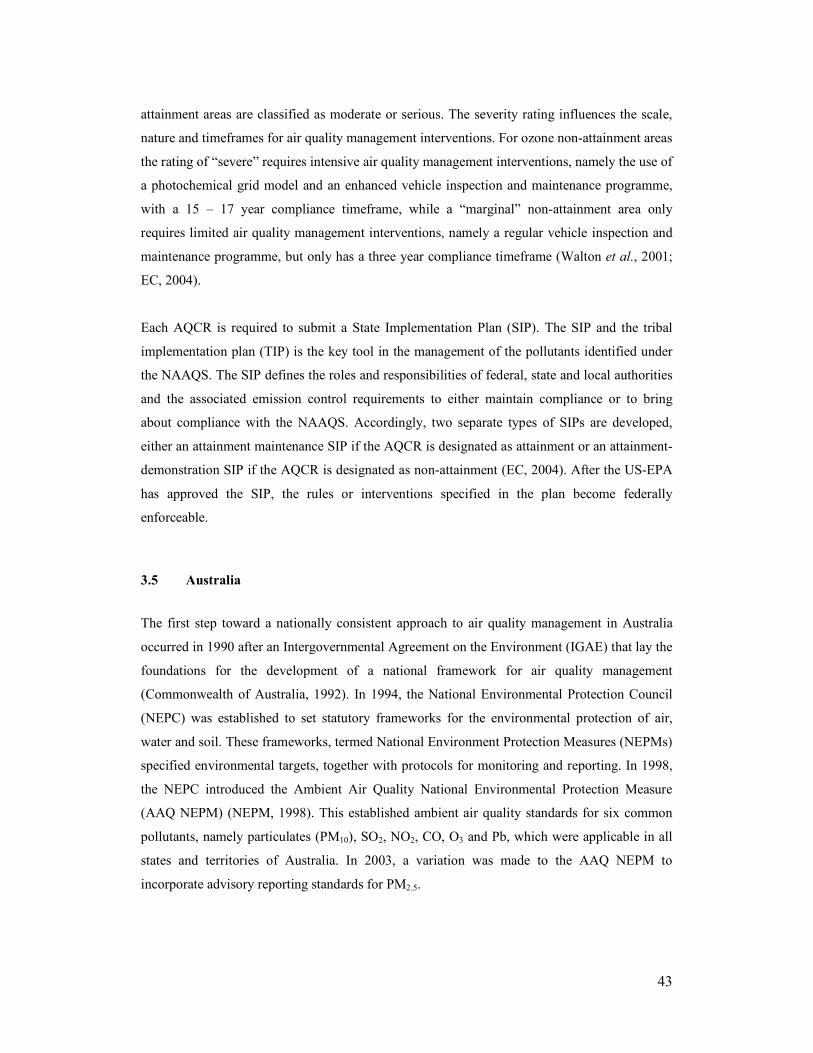
43
attainment areas are classified as moderate or serious. The severity rating influences the scale,
nature and timeframes for air quality management interventions. For ozone non-attainment areas
the rating of “severe” requires intensive air quality management interventions, namely the use of
a photochemical grid model and an enhanced vehicle inspection and maintenance programme,
with a 15 – 17 year compliance timeframe, while a “marginal” non-attainment area only
requires limited air quality management interventions, namely a regular vehicle inspection and
maintenance programme, but only has a three year compliance timeframe (Walton et al., 2001;
EC, 2004).
Each AQCR is required to submit a State Implementation Plan (SIP). The SIP and the tribal
implementation plan (TIP) is the key tool in the management of the pollutants identified under
the NAAQS. The SIP defines the roles and responsibilities of federal, state and local authorities
and the associated emission control requirements to either maintain compliance or to bring
about compliance with the NAAQS. Accordingly, two separate types of SIPs are developed,
either an attainment maintenance SIP if the AQCR is designated as attainment or an attainment-
demonstration SIP if the AQCR is designated as non-attainment (EC, 2004). After the US-EPA
has approved the SIP, the rules or interventions specified in the plan become federally
enforceable.
3.5 Australia
The first step toward a nationally consistent approach to air quality management in Australia
occurred in 1990 after an Intergovernmental Agreement on the Environment (IGAE) that lay the
foundations for the development of a national framework for air quality management
(Commonwealth of Australia, 1992). In 1994, the National Environmental Protection Council
(NEPC) was established to set statutory frameworks for the environmental protection of air,
water and soil. These frameworks, termed National Environment Protection Measures (NEPMs)
specified environmental targets, together with protocols for monitoring and reporting. In 1998,
the NEPC introduced the Ambient Air Quality National Environmental Protection Measure
(AAQ NEPM) (NEPM, 1998). This established ambient air quality standards for six common
pollutants, namely particulates (PM10), SO2, NO2, CO, O3 and Pb, which were applicable in all
states and territories of Australia. In 2003, a variation was made to the AAQ NEPM to
incorporate advisory reporting standards for PM2.5.

44
The AAQ NEPM included a monitoring protocol to ascertain whether the ambient standards
were being achieved in the participating jurisdictions. A participating jurisdiction is defined as
either the Commonwealth or a State or Territory of Australia (NEPM, 1998). Due to the vast
size of the country, with large uninhabited regions, the AAQ NEPM specified a minimum
population threshold of 25 000 as the trigger for the monitoring of pollutants within a region
(NEPM, 1998). A region was defined as “an area within the boundary surrounding population
centres as determined by the relevant participating jurisdiction” (NEPM, 1998). The Peer
Review Committee (PRC) was established to assist the NEPC in its task of assessing and
reporting on the implementation and effectiveness of the AAQ NEPM. In 2001, the PRC
developed a guidance document (NEPM, 2001) to assist jurisdictions in the selection of regions
requiring monitoring and assessment and presented a preliminary identification of the regions
by jurisdiction.
The PRC identified three different types of regions that may occur within Australia (NEPM,
2001), namely:
Type 1: A large urban or town complex with a population of 25 000 people or more
requiring direct monitoring and contained within a single airshed;
Type 2: A region with no single population centre with 25 000 people or more, but with
a total population of 25 000 or more, and with significant point source or area
based emissions as to require a level of direct monitoring; and
Type 3: A region with a population of 25 000 people or more but with no significant
point or area based emissions, so that ancillary data can be used to infer that
direct monitoring is not required.
The initial assessment undertaken by the PRC used the 1996 census data from the Australian
Bureau of Statistics. Table 3.3 shows a summary, by state, of the urban centres in Australia with
a population > 25 000 inhabitants. While the population data may provide a basis for the
preliminary assessment of regions for ambient air quality monitoring it was recommended that
this was taken into consideration with other factors such as the airshed characteristics, emission
sources in the area, topography and atmospheric dispersion potential (NEPM, 2001). These
assessments were left to the discretion of the individual states and territories. The development
of the National Pollutant Inventory (NPI) NEPM in 1998 saw the collection and dissemination
of information relating to the emission and transfer of 93 different substances. This information
formed an integral part of policy and programme formulation for government by assisting in

45
environmental planning and management. This comprehensive information was used in the
determination and assessment of urban and regional airsheds.
Table 3.3 Summary of the urban centres in Australia with populations > 25 000
inhabitants (NEPM, 2001)
State / Territory Number of Urban Centres with
a Population > 25 000 New South Wales 15
Victoria 8
Queensland 13
Western Australia 4
South Australia 1
Tasmania 2
Australian Capital Territory 1
Northern Territory 1
The assessment undertaken by the South Australia Environmental Protection Agency (SA EPA)
is considered a good example of an individual state assessment (Ciuk, 2002). The SA EPA
undertook an assessment of the emissions from aggregate sources within the Adelaide airshed
and five regional airsheds. Figure 3.9 shows the location of the study areas. The airsheds
selected represented collectively over 79% of the total South Australian population and 85% of
the industrial emissions. The assessment also included domestic emissions, transport related
emissions and emissions from commercial activities. It is interesting to note that Table 3.3 only
shows one urban centre with a population > 25 000, namely Adelaide (978 000), but the SA
EPA assessment identified six major airsheds in the state. The combined populations in four of
the airsheds exceeded the 25 000 inhabitant threshold, but in two cases, namely Port Lincoln (12
333) and Barossa (14 893), this threshold was not exceeded. This highlights the importance of
assessing other factors such as emission sources, topography and atmospheric dispersion
potential, when identifying airsheds.
Ciuk (2002) made a number of recommendations to improve the accuracy of the assessment in
the future. These included the need to update the emissions inventory within a short period of
the next population census to provide a more accurate representation of emissions based on
latest demographic information. Further, the emissions inventory for domestic emissions was
considered weak and recommendations to improve this in forthcoming assessments were
provided. The assumptions relating to emissions from recreational and commercial boating
activity may have grossly over or under estimated the true contributions from this sector.

46
Emissions from bushfires and prescribed burning were excluded from the emissions inventory.
This is considered a significant omission, specifically in the regional airsheds. Further
improvements in the emissions estimation from motor vehicles and industrial emissions were
recommended.
Figure 3.9 Location of the major South Australian airsheds (Ciuk, 2002)

47
The other states and territories in Australia are at varying stages in the identification of their
airsheds, with South Australia, Queensland, New South Wales, Western Australia and Victoria
more advanced than the others due to the location of major metropolitan areas, and the
associated urban air pollution problems, within these states.
3.6 New Zealand
In New Zealand (NZ) the first air pollution related legislation to be promulgated was the Clean
Air Act of 1972. This legislation regulated industrial emissions using the BPM concept
(Longhurst et al., 2009). Similarities can be draw with the historical approaches to air pollution
control used in the UK and South Africa. The Clean Air Act was nationally administered
through the Department of Health and was responsible for the regulation of the larger emission
sources. The City and District Councils were responsible for the regulation of smaller emission
sources.
The Resource Management Act promulgated in 1991 is the current legislation that controls air
quality matters in NZ. The Act promotes sustainable management of NZ’s natural and physical
resources and is the single piece of legislation under which all environmental matters are
managed in NZ (NZ Ministry for the Environment, 2009a). Under the Resource Management
Act the 12 regional councils and four unitary authorities are responsible for managing air
quality. Regional councils also have a role in ensuring that ambient air quality standards are
achieved in their regions. The national government provides guidance and support, through the
drafting of national ambient air quality standards, drafting of good practice guideline
documents, research, public education and reporting.
Until the introduction of the Resource Management Act, ambient air quality monitoring in NZ
had largely been in response to specific, perceived problems, and so was quite limited. The Act
shifted responsibility to the regional councils, and monitoring networks were established and
expanded throughout NZ during the 1990s. The Act also controls emissions from large
industrial sources through air-discharge permits, issued by regional councils. In terms of
emissions, domestic fires and motor vehicles contribute most of NZ’s air pollutants while
industry can also cause localised problems (Sturman and Zawar-Reza, 2002; Bluett, 2006;
Cavanagh, 2006; Longley and Olivares, 2008; Longley et al., 2008).
In October 2004, the NZ government introduced 14 national environmental standards for air
quality. The 14 standards included seven standards banning activities that resulted in significant

48
emissions of dioxins and furans and other toxics into the atmosphere, five ambient air quality
standards, a design standard for new wood burners installed in urban areas and a requirement for
all landfills greater than one million tons of refuse to collect greenhouse gases. The ambient
standards included CO, NO2, O3, particulates (PM10) and SO2. In June 2009, the NZ
Environment Minister announced a review of the environmental standards relating to air quality
and appointed an expert panel (NZ Ministry for Environment, 2009b).
The implementation of the standards was linked to the determination of “airsheds” or Local Air
Quality Management Areas (LAMAs) for the entire country. The New Zealand Foundation for
Research, Science and Technology undertook a research project with the objective of
formulating a methodology for determining airsheds or LAMAs, and then completing prototype
LAMAs for three District Councils (Fisher et al., 2005). Since the data gathering exercise
covered the entire country the draft LAMAs for the entire country were determined. This is one
of the few countries to have comprehensively documented the approach taken in the
determination of the boundaries of their air quality management areas. The timescale for the
project was relatively short, lasting only six months from project initiation to final review. As
such, the project relied heavily on readily available information. The process uses four key
inputs, each of which is more fully described below. A base year of 2001 was used for the study
(Fisher et al., 2005).
3.6.1 Geophysical Boundaries
A key consideration in determining the areas to be included in the NZ LAMA design was local
topography, since geophysical features ultimately influence the areas within which emissions
travel or reside. The initial work started by defining geophysical boundaries using the
orientation of ridgelines, position of valleys and the slopes of hills. The project used a
Geographical Information System (GIS) to model and analyse topography at a range of scales.
Since the geophysical boundaries that define airsheds are similar to those that define
watersheds, the project used the hydrological analysis tools from the software Arc-GIS 9.0. This
tool isolates drainage basins by identifying ridge-lines between neighbouring basins. The key
input into this software is a Digital Elevation Model (DEM). A DEM is a digital representation
of the land surface and may be defined as a regularly spaced grid of elevation points.
The methodology for isolating ridge-lines in the topography and defining the geophysical
boundaries of airsheds is outlined below. The first stage was to smooth the DEM in the x, y and
z directions. This has the effect of generalising the height differences across the terrain surface

49
and allows for an easier analysis and definition of ridge-lines. The project started with a 1km
resolution DEM as a raster. To smooth the grid, each DEM cell was rounded to the nearest 10m
in height (z). This also smoothes the DEM at the coastal margin and has the effect of smoothing
the whole DEM vertically. To smooth the DEM spatially (x and y), the “Focal statistics”
analysis tool was applied from the Arc-GIS software. This passes a 3 x 3 cell over the DEM and
for each group of nine height values and calculates a mean value for that cluster. The resulting
output was a smoothed DEM that was suitable for ridge-line analysis. The next phase was the
hydrological analysis, involving an assessment of flow directions, flow accumulation and
drainage basin location. A cut-off value was applied for merging neighbouring basins. Fisher et
al. (2005) felt than in order for a geophysical boundary to influence airflow and thus define an
airshed, a figure of 200m was appropriate. Therefore, all polygons with a range below 200m
were merged. All values above this maintained their own airshed boundary.
The total number of airsheds initially identified, using the above mentioned methodology, was
12 960, with 5 907 (45.5%) in the North Island and 7 053 (54.5%) in the South Island. This
large number must be considered within the context of the complexity of the general topography
of NZ. Due to the large number of airsheds initially identified, Fisher et al. (2005) proposed a
technique for trimming this number. The airsheds were subjected to analysis based on the range
in heights per drainage basin, as well as the mean height of the basin itself. This analysis
reduced the total number of airsheds to 4 911. The project team acknowledged that further
reduction or trimming of the total number of airsheds was required.
3.6.2 Emissions Information
One of the major determinants of the LAMA identification process was particulate matter,
specifically PM10 emission density. Emissions from a variety of sources were combined to
produce an emissions density per census area unit (CAU). The purpose of this criterion was to
identify high-density emission areas across NZ. The emission sources considered domestic fuel
burning, motor vehicles and industries. The methodology for the emission determination for
each of these sources is described in more detail below.
Domestic PM10 emissions were based on the 2001 census data which included information
identifying the number of dwellings in each CAU that used wood, coal, gas, electricity and other
heating methods. This information was used in conjunction with estimates of average daily fuel
use for both wood and coal, and estimates of average emission rates for each fuel to estimate
PM10 emissions for each CAU. Fisher et al. (2005) acknowledged that the methodology was
subject to a number of major limitations. The main concern was that the approach did not allow

50
for variations in types of burners. This could be significant, as areas with a large number of
modern low emission burners would be assumed to have the same emission rate as areas
dominated by older burners or open fires. Similarly, the estimates of fuel use were not location
or appliance specific. It was recommended that future work be undertaken, based on more
accurate home heating surveys, to refine the accuracy of the emissions from this source.
Estimation of PM10 emissions from on-road vehicles involved the collection and use of data
from three principle data sources, i.e. the total number of vehicle kilometres travelled (VKT),
the number and type of vehicles that comprise the national fleet and the emission rate of PM10
by each particular vehicle type. The vehicle kilometres travelled was obtained from the Ministry
of Transport (MoT) and was based on a 1994 National Traffic Database. The database lists
virtually every section of public road in NZ together with information regarding the length of
the section of road, an estimate of the average annual daily traffic, the road classification (urban
arterial, rural etc.), speed limit and responsible authority. Information was available throughout
NZ with counts made in every Territorial Local Authority (TLA). The MoT disaggregated the
national VKT data into 14 regions and further processing was done to ensure detailed
information was available in every TLA. The motor vehicle fleet data were obtained from the
Land Transport Safety Authority Vehicle Registration database. The 2004 data were used in the
study as 2001 data were not readily available. The national database was disaggregated into
TLA and into eight vehicle classes. The TLA fleet data were used to determine the VKT
travelled and the PM10 emissions rates from motor vehicles. A local database was used to
calculate PM10 tailpipe emission factors for the eight vehicle classes considered.
Fisher et al. (2005) highlighted that the project only considered on-road use of motor vehicles.
The project excluded emissions from off-road use and other forms of transportation, i.e. rail,
ships and aircraft. It was recommended that other sources of transport emissions should be
included in future revisions of the inventory.
The industrial PM10 emission from all major dischargers was estimated. The initial focus was on
combustion related emissions, but this was extended to include relevant process emissions,
including some quarries and mining activities. Emission factors were applied to the activity data
to estimate the quantity of emissions from each source. Emission factors used were from the
US-EPA AP42 database (US-EPA, 2004). To account for the varying quality of emission
calculations, a reliability index was introduced (Fisher et al., 2005). The reliability index ranged
from 1, which signifies well justified emissions data obtained through continuous emission
monitoring, to 5, which is essentially an educated guess. When the exact location of an

51
operation was not clear, an effort was made to find the location through various web-based
sources. Once a street address or locality was identified, the co-ordinates were found using
mapping software. When the exact location was unknown but the general area was identified a
subjective estimate was made. The use of this reliability index may create an overly
conservative emission estimate, since the US-EPA AP42 database already includes a confidence
measure. The methodology did not indicate the weighting the reliability index carried, and as
such it is not possible to assess the impact this may have on the results.
3.6.3 Meteorological Effects
The LAMA boundaries defined in the study are defined primarily by emission patterns and
geographical barriers but the meteorological effects determine if estimated concentrations
within a CAU will extend beyond that CAU. Thus the effects of neighbouring CAUs with high
emissions, impacting on each other, need to be considered if they can be merged together into a
single LAMA. The aim is to use a model of dispersion from different sources to estimate levels
of PM10 arising from emissions under worst case meteorological conditions. A simple,
analytical model for urban air pollution relating concentration, emission rate and meteorology
was applied as shown in Equation 3.1 (Fisher et al., 2005).
Χ = cQ / U 3.1
Concentration is denoted by X, area source strength by Q, wind speed by U and parameter c is a
simple indicator of the amount of dispersion that the emissions experience in the atmosphere.
Parameter c is determined by Equation 3.2
c = (2/π)1/2 x1-b(a(1-b))-1 3.2
Parameter c is further described by parameters a and b relating to turbulence and stability in the
atmosphere at the location and time of interest. Parameters a and b are stability dependant, and
related to the vertical diffusion coefficient σz by Equation 3.3.
σz = axb 3.3
where x is the distance downwind. This model is recommended by the European Environment
Agency (EEA) for preliminary assessment of area sources under the EC air quality directives.
Inputs into the model are interpreted as the daily domestic PM10 emission rates for each CAU,
and the CAU area (as Q is the emission rate per unit area). Other assumptions include that
emissions are uniformly distributed within each CAU; a=0.06, b=0.71 for stable conditions

52
under low wind speeds; the values of a and b are 10-minute averages, so a (and thus σz) is scaled
by (60/10)0.2 to give hourly average concentrations; the worst case wind speed is 1.5 m/s and all
emissions occur during the night when the worst case wind speed occurs.
3.6.4 Final Outputs
The geophysical boundary data were combined with the other GIS referenced criteria data, i.e.
administrative boundaries, emissions, meteorology, to refine the airshed boundary
determination. The project team reduced the final number to 161 areas. Figure 3.9 shows the
preliminary outputs from the project. The LAMAs are divided into three categories, depending
on the air pollution impact potential of the area. 60 of the LAMAs are coded as Category 1,
which indicates that enhanced air quality management intervention will be required, 85 of the
LAMAs are coded as Category 2, which indicates further review and assessment is required in
these areas, while the balance of the country is coded as Category 3, indicating that no air
quality problems are anticipated. This preliminary review has been refined and as at September
2005 there were 42 LAMAs where air quality could exceed the national ambient standards
(Bluett, 2006). All but one of the 42 LAMAs have been gazetted due to known or potential
concerns about particulate matter (PM10) and the remaining LAMA has the potential to breach
the sulphur dioxide and particulate matter (PM10) standards.
3.7 Summary of International Approaches
All of the international approaches reviewed are extremely data intensive. The EU approach to
zone identification relies on over 4 000 ambient monitoring stations to allow comparison with
the ambient air quality standards specified in the Daughter Directives. The EU approach
recommends the use of administrative boundaries for zone delineation. The UK approach to
AQMA boundary determination is a combination of ambient air quality monitoring and
dispersion modelling. The dispersion modelling component is reliant on comprehensive
emissions inventories. Again, the use of administrative boundaries is also recommended. The
US approach to the identification of non-attainment areas relies on ambient air quality
monitoring stations to allow comparison with NAAQS. Here again, the use of administrative
boundaries is recommended when delineating a non-attainment area. The NZ approach is
considered to be the most comprehensive method assessed. The method combines topography,
meteorology and emissions, with administrative boundaries providing guidance. The
methodology is also considered data intensive as this method required DEM data, detailed
emission inventories for all industrial sites, detailed vehicle count and profile data, detailed
domestic emission data and detailed meteorological data.

53
Figure 3.10 Preliminary local air management areas for New Zealand (Fisher et al.,
2005)

54
It must be noted that all the countries and regions assessed in this chapter all rely on the same
effects-based air quality management philosophy. This is the same approach to air quality
management that South Africa is pursuing under the AQA. Table 3.4 provides a summary of
each of the international approaches to defining the boundaries of air quality management areas
or regions.
Table 3.4 Summary of international approaches to defining air quality management
areas
Country / Region Approach to Defining Air Quality Management
Areas European Union Ambient air quality monitoring and administrative
boundaries
United Kingdom Ambient air quality monitoring, dispersion modeling
and administrative boundaries
United States Ambient air quality monitoring and administrative
boundaries
Australia Population density, emission inventories, topography
and atmospheric dispersion potential
New Zealand Topography, emission inventories and atmospheric
dispersion potential
The approach of using ambient air quality monitoring results to assist in the definition of the
boundaries of air quality management areas is not readily applicable in South Africa, due to the
paucity of the ambient air quality monitoring stations in the country. Projects are being
implemented to expand the national ambient monitoring network, so in time this approach may
be applicable in South Africa. The use of administrative boundaries is something that is readily
applicable in South Africa. The AQA provides guidance on the roles and responsibilities of all
spheres of government so the use of administrative boundaries in the South African context is
considered appropriate. The approach of using emission inventories and dispersion modeling is
not readily applicable to all areas of South Africa, due to the lack of a national emissions
inventory. Emissions inventories do exist for some of the major metropolitan areas and some
regions, however, these inventories are not readily available, cover different time periods and
are not consistent in terms of the pollutants reported. Phase II of the SAAQIS project will see
the development of the national emissions inventory, so in time this approach may be applicable
in South Africa. The use of population density, topography and atmospheric dispersion potential
is directly applicable in the South African context. This information is readily available for the
entire country.

55
CHAPTER 4
METHODOLOGY FOR THE DELINEATION OF BOUNDARIES OF AIR QUALITY
MANAGEMENT AREAS IN SOUTH AFRICA
4.1 Introduction
This chapter will outline the proposed methodology for the delineation of boundaries of air
quality management zones in South Africa. The methodology chosen was based on a
combination of assessment criteria that are currently used internationally and other criteria
specific to the South African context. The methodology proposed for South Africa has been
determined based on the lack of readily available air quality information, whilst ensuring the
scientific defensibility of the resultant outputs. The methodology proposed could also be applied
internationally, specifically in countries where ambient air quality and emissions data are not
readily available
Based on the international review detailed in Chapter 3 and an understanding of the limitation of
ambient air pollution and emissions data readily available in South Africa, the following criteria
have been selected as the criteria to be used in the delineation of the boundaries of air quality
management zones in South Africa.
The first criterion, and a common thread in most international methodologies, is the use of
agreed administrative boundaries as indicating the extent of the air quality management zones.
Population density is the second criterion that will be used in the assessment. Whilst some
international methodologies caution against the use of this criterion due to its dynamic nature
(EC, 2003), an argument for its use in the South African context will be presented below. The
third criterion will be the use of emissions density. The emissions parameter will be determined
from a variety of emission sources, i.e. industrial, mining and domestic emissions. In the
absence of actual emissions data for all sources, proxy methodologies are presented below based
on readily available information. The final criterion will be the use of topographical features to
determine the boundaries of air quality management zones. Each criterion will be mapped on a
GIS and based on the analysis of the outputs the preliminary boundaries of the air quality
management zones in South Africa will be delineated.

56
4.2 Boundary Criteria
4.2.1 Geopolitical Boundaries
The use of geopolitical boundaries in defining the boundaries of air quality management zones
is a common practice internationally (Van Aalst et.al., 1998; EC, 2003; Woodfield et al., 2002;
Fisher et al., 2005). The strength of using this criterion is that all geopolitical boundaries are
agreed boundaries with a specific spatial representation. In some cases the boundaries are
selected based on physical / topographic criteria i.e. rivers and ridges. This falls in line with the
other criteria that have been selected as the basis for determining the boundaries of air quality
management zones. In other cases the boundaries have been selected based on other parameters
and this will create situations where the combination of adjacent areas may be required.
In South Africa the determination of geopolitical boundaries is controlled by the Municipal
Demarcation Board. In terms of Section 155 of the Constitution, the Municipal Demarcation
Board is an independent authority responsible for the determination of municipal boundaries.
The Board's status as an independent authority is also protected by Section 3 of the Local
Government: Municipal Demarcation Act, 1998, and various judgements by the Constitutional
Court. In addition to the determinations and re-determination of municipal boundaries, the
Board is also mandated by legislation to declare district management areas; to delimit wards for
local elections; and to assess the capacity of municipalities to perform their functions.
Geopolitical boundary demarcations are subject to change and for the purpose of this
dissertation the boundaries as at 1 June 2009 are the geopolitical boundaries used in this study.
South Africa is currently divided into nine separate provinces (Fig. 4.1). Table 4.1 shows the
breakdown of the country according to province, metropolitan, district and local municipalities.
It is important to note that under the AQA the district and metropolitan municipalities will
become the atmospheric emission licencing authorities. As such, the district and metropolitan
municipality boundaries will be the primary factor when considering the boundaries of air
quality management areas, however the local municipality boundaries may be used to refine the
final boundary. The results presented in Chapter 5 will be presented at both the district and local
municipality level, with the metropolitan municipality results presented on both levels.

57
Table 4.1: Municipal demarcation of South Africa as at 1 June 2009 (Municipal
Demarcation Board, 2009)
Province Metropolitan
Municipalities
District
Municipalities
Local
Municipalities
Eastern Cape 1 6 38
Free State 0 5 20
Gauteng 3 3 9
KwaZulu-Natal 1 10 50
Limpopo 0 5 25
Mpumalanga 0 3 18
Northern Cape 0 5 27
North-West 0 4 20
Western Cape 1 5 24
Total 6 46 231
The Municipal Demarcation Board also divides the local municipalities further into wards for
the purposes of local elections. Whilst information exists at the ward level, it was decided for
the purposes of this dissertation to use the local municipal level as the lowest level of
geopolitical boundary. All of the other information sources used in this dissertation will be
assessed at the local municipality level. For readers not familiar with South African geography,
it is recommended that they use the Municipal Demarcation Board website
(www.demarcation.org.za) for reference purposes. The website provides maps at the national,
provincial, district and local municipality level. The maps may provide to assistance in the
interpretation of the results presented in Chapter 5 and 6 as it was impractical to generate
annotated maps at the scale presented.
4.2.2 Population Density
Population density is the second criterion to be used in the determination of the boundary of air
quality management zones in South Africa. The EU (Vixseboxse and De Leeuw, 2007) provides
guidance that the use of population density in the designation or determination of air quality
management areas is not advisable. The argument put forward by the EU is that population
densities fluctuate, and as such, is not a criterion they recommend. In the South African context
the use of the population density criterion to determine the boundary of the air quality
management zone is considered appropriate due to the fact that a large proportion of South
Africa’s urban and peri-urban population are a significant source of air pollution relating to
domestic fuel burning. In addition, urban South Africans are highly dependent on road
transportation as the primary means of commuting, due to the poorly developed public transport
system. As such, high population density may also be a good proxy indicator of air pollution.

58
This matter is complicated in the South African situation by the fact that a high population
density may also occur within rural areas. This is mainly due to the apartheid legacy which saw
the development of rural bantustans. As such, careful differentiation between rural and urban
areas is required when using this criterion.
The 2001 National Census data are the population information used in this study. A mid-year
population estimate was undertaken in 2008, however this update was a high level assessment
and did not provide population estimates at the local government level. It must be noted that the
municipal demarcation used in the 2001 census differs slightly from the current demarcation.
The census data, specifically the geophysical references, will be adjusted to align with the
current demarcation. The population density has been calculated in all of the municipal areas in
the country, down to local municipality level. The detailed information is included in Appendix
2. Table 4.2 provides the population density in each of the six metropolitan municipality areas.
Table 4.2: Population densities in the metropolitan municipalities (after StatSA, 2004)
Name of Metropolitan Municipality Population (2001) Area (km2) Population Density
(people/km2)
City of Cape Town 2 893 246 2 987.4 968.5
Nelson Mandela Bay (Port Elizabeth) 1 005 778 1 958.9 513.4
Ethekwini (Durban) 3 090 121 2 291.9 1 348.3
City of Johannesburg 3 225 812 1 645.0 1 961.0
City of Tshwane (Pretoria) 1 985 983 2 174.6 913.3
Ekurhuleni (Kempton Park) 2 480 277 1 924.4 1 288.8
The most densely populated province is the Gauteng Province, with an average population
density of 519.6 people/km2, while the least densely populated province is the Northern Cape
Province with an average population density of 2.7 people/km2. The national average population
density in South Africa is 36.7 people/km2 (United Nations, 2009). The global average
population density is 45.2 people/ km2 (United Nations, 2009). Population densities range from
18 131 people/km2 in Macau (People’s Republic of China) to 0.026 people/km2 in Greenland
(Denmark) (United Nations, 2009). Several of the most densely-populated territories in the
world are city-states, microstates, micronations, or dependencies. These territories share a
relatively small area and a high urbanisation level, with an economically specialised city
population drawing also on resources outside the area. In the case of South Africa this can be
likened to the urban conurbation of Johannesburg, with a high level of urbanisation supported
by resources produced outside of the Gauteng province. High population density is
characterised as more than 1000 people/km2 (Elsom, 1999).

59
Figure 4.1
Geopolitical boundaries of South Africa as at 1 June 2009

60
4.2.3 Emissions
4.2.3.1 Industrial Sources
The industrial emissions assessed as part of this dissertation are derived from the APPA
Registration Certificates database. This database is the only national registry of large industrial
operations. An electronic database was generated as an output of the APPA Registration
Certificate Review project, which sought to centralise the APPA Registration Certificates which
were issued and maintained in regional offices. All the registration certificates from the Durban,
Cape Town, Boksburg and Pretoria regional offices were consolidated in the Pretoria offices of
the DEA in 2007. The contents of all the registration certificates were captured into a common
electronic database and a uniform hard-copy archive was developed. The final output was an
electronic database of 2578 companies that were registered to operate scheduled processes
across the country. The number of companies that are coded as operational in the database is
1509. The actual number of operational companies is expected to be lower due to the fact that
several companies no longer operate scheduled processes on their premises but have not
officially withdrawn or cancelled their registration certificates. This excludes companies that are
operating scheduled processes without the required registration certificates.
Figure 4.2 shows the provincial breakdown of industries registered in the APPA Registration
Certificate database. The numbers adjacent to the province name indicates the actual number of
registration certificates in each province and a percentage of the national total. Gauteng
province has the highest number of registration certificates, accounting for over 30% of the total
registration certificates, while the Northern Cape province has the lowest number of registration
certificates, accounting for just over 2% of the national total.
The electronic database had a number of shortcomings that needed to be addressed before the
information could be considered useful for this dissertation. During the data capturing phase of
the project, quality control was undertaken on a sample basis. This allowed some errors to go
undetected during the data capture phase. The most common error was where a company was
not correctly captured in terms of its geographical location. Initial work involved a
comprehensive review of the database to ensure the accuracy of the geographical coding of each
company.

61
Figure 4.2: Provincial summary of the distribution of registration certificates in South
Africa (DEAT, 2009b)
Due to the lack of a comprehensive national emissions inventory and the absence of regular
emissions reporting as a condition in registration certificates, it was necessary to base the
industrial emissions impact from each site on a proxy methodology. A common method of
overcoming the lack of site specific emission information is the use of emission factors, such as
the US-EPA AP42. The use of emission factors requires knowledge of the specific industrial
process taking place on the site, an understanding of the production capacity or throughput of
the process and an understanding of the pollution abatement equipment installed. The
registration certificates issued for each of the scheduled processes operational in the country do
not contain such detailed information. This information is also not readily available for illegal /
unregistered operations. As such an alternative proxy methodology was required to assess the
industrial emission impact.
During the APPA Registration Certificate Review project a prioritisation matrix was designed
primarily based on the identification of sources contributing significantly to local air pollution
resulting in human health and welfare impact potentials. The primary objective of the
Western Cape, 186, 12%
Northern Cape, 30, 2%
North West, 111, 7%
Mpumalanga, 194, 13%
Limpopo, 75, 5%
KwaZulu Natal, 263, 17%
Gauteng, 486, 33%
Free State, 90, 6%
Eastern Cape, 74, 5%

62
prioritisation matrix was to allow for the identification of the top 50 polluters in the country
(DEAT, 2006c). The APPA Registration Certificate Review project found it difficult to identify
specific individual companies and reverted to a sector-based approach, where six industrial
sectors were identified. These sectors included Primary Iron and Steel, Petrochemical Refining,
Ferroalloy Production (Ferro-Vanadium, Ferro-Chrome and Ferro-Manganese), Primary
Aluminium, Pulp and Paper and Coal-fired Power Generation (DEAT, 2006c). In total, 63
individual operations were identified from the process, accounting for ~ 80% of the industrial
emissions in the country, but accounting for only 4.1% of the total number of registration
certificates. A modified methodology was followed during this research to take account of the
assessment at the local government level and the improved geographical information available
following the comprehensive review of the database. As part of this research it was decided to
remove the public profile criterion from the assessment. The public profile criterion provided an
indication of the number of air pollution related complaints received regarding a specific
company and also the level of negative press coverage received. It was removed as it was
considered a duplication of the parameter assessed under air pollution control officer (APCO)
findings.
The industrial emissions impact assessment was divided into three separate categories, namely
source impact, receptor impact and compliance status. The source impact of an industrial site
was assessed by quantifying the number of individual registration certificates held by the
company. This assessment was expanded by also assessing the air pollution impact potential and
hazard rating of each industrial emitter. The hazard rating was subjectively determined based on
the following criteria:
• Possible quantity and impact potential of common criteria pollutants (SO2, PM10, NOx and
CO);
• Potential for generating toxins such as benzene, dioxins and furans, carcinogenic metals
such as cadmium, manganese, hexavalent chromium, arsenic, polyaromatic hydrocarbons,
polychlorinated biphenyls, acrylonitrile, 1.3 butadiene, acedaldehyde, asbestos, quartz, etc.;
• Potential for upset emissions;
• Potential for accidents likely to result in significant atmospheric emissions;
• Height of discharge of emission; and
• Odour impact potential.

63
In order to ensure consistency with the APPA Registration Certificate Review project the same
hazard rating was applied as calculated in the original project. A summary of the hazard rating
scores for each of the industry sectors is shown in Figure 4.3.
Figure 4.3: Overall hazard rating assigned to certain industry types (DEAT, 2006c)
The majority of the industries assessed had hazard ratings of between 4.2 and 5.8 out of a
possible 10. Petroleum refineries were assessed to have the highest hazard rating (9.2), followed
by ferro-chrome and ferro-manganese (8.5), iron and steel (7.7), waste oil regeneration (7.5) and
pulp and paper (7.5). Small-scale boiler operations were assessed to have the lowest hazard
rating (4.2). It must be noted that this hazard rating was only calculated for scheduled processes,
operated in terms of the APPA, and excludes smaller industrial operations that fall below the
threshold requiring registration. In the case of industrial boilers, all boilers capable of burning
more than ten tons of coal per hour require registration. All other smaller boilers must be
registered with the local authority as a fuel burning appliance.
The receptor impact of the rating was assessed by determining the exposure potential of the
population in the vicinity of industrial operations. The receptor category was modified from the
original methodology to assess the exposure of the population within the entire local
municipality, instead of a 3km radius from the plant. The APPA Registration Certificate Review

64
project reported that the geographical location of each operation was only known for 35% of the
total database (DEAT, 2006c). The uncertainty in the location of the industrial operations may
be attributed to the following reasons. The limited human resources prevented regular
compliance inspections at all facilities, as such officials undertook inspections on a reactive
basis, usually after receipt of a complaint. Changes to the municipal demarcation system in the
late 1990s resulted in significant changes to location descriptions. Old location descriptions
reflected in registration certificates were in some cases difficult to convert to the new municipal
demarcations. This problem was compounded by the lack of up to date telephone numbers,
contact personnel and postal addresses. This was partially resolved during the review of the
APPA Registration Certificate database undertaken for this research, but significant uncertainty
still exists for ~ 50% of the database. Due to the uncertainty in the actual location of some of the
smaller operations this approach is considered more conservative. This is also considered an
improvement in the methodology due to the errors in the database relating to geographical
location of operations. The receptor impact also assesses the potential for cumulative impacts
from other industrial emission sources.
The compliance status of the rating assessed compliance performance of the individual
companies. The potential for compliance monitoring was assessed by determining the last time
any of the registration certificates on the site were reviewed. The CAPCO issues two types of
registration certificates, either a provisional certificate or a final certificate. In the case of a
provisional certificate the operator must demonstrate compliance with the conditions of the
registration certificate before a final certificate can be issued. A provisional registration
certificate has a specified validity period, ranging from three months to five years. A final
registration certificate has no specified validity period, as such, when a final registration
certificate is issued this permits the plant to operate indefinitely. In some cases the database
revealed that plants were operating under registration certificates issued in the 1970s. The
compliance category also reviews the frequency of complaints received regarding a particular
operation and other non-compliance issues noted by the APCOs assigned to each plant.
Table 4.3 shows the criteria assessed within each of the assessment categories and the scoring
assigned. The scoring parameters for each of the criteria are largely consistent with the
methodology used in the APPA Registration Certificate Review project, with minor
amendments in the receptor category. The source impact category scored the industrial impact
in two sub-categories, namely scale of operation and air pollution potential.

65
Table 4.3:
Scoring parameters for each criterion (after DEAT, 2006c)
Source Im
pact Category
Receptor Im
pact Category
Compliance Status Category
Scale of
Operation
Air Pollution
Potential
Exposure Potential
Cumulative Im
pacts
Potential
Compliance
Monitoring Potential
Operator Compliance
No. of
RC’s
Held
Score
Industry
Hazard
Rating
Score
Local
Municipality
Population
Score
Location
Score
Date of Last
Amendment
to RC
Score
APCO
Findings /
Complaints /
Directives
Issued
Score
1
20
HR5
20
< 50 000
20
Rural
25
2005 – current
0
1
0
2 - 5
40
HR4
40
50 001 –
150 000
40
Predominately
Rural with Urban
Pockets
50
2000 – 2004
25
2
25
6 - 10
60
HR3
60
100 001 –
300 000
60
Predominately
Urban with Rural
Pockets
75
1990’s
50
3
50
11 - 15
80
HR2
80
300 001 –
500 000
80
Metro / Priority
Area
100
1980’s
75
4
75
> 15
100
HR1
100
> 500 001
100
Before 1980’s
100
5
100
Blank
0
Blank
0
Blank
0
Blank
0
Blank
0
Blank
0

66
In terms of the scale of operation, the higher the number of registration certificates held by an
industrial operation at a single site, the higher the rating score. Of the 1509 operational companies
registered in terms of the APPA, 1338 (88.7%) have a single registration certificate. The balance of the
companies hold multiple certificates, with Sasol Secunda (77) holding the most registration certificates
on a single site. In terms of the hazard rating, the results presented in Figure 4.3 were divided into
hazard rating bands, with the higher hazard rating attracting a higher rating score. The banding for the
hazard rating was as follows, HR1 indicated a hazard rating of greater than 8.1, HR2 indicated a
hazard rating of 7.1 – 8.0, HR 3 indicated a hazard rating of 6.1 – 7.0, HR 4 indicated a hazard rating
of 5.1 – 6.0, while HR5 indicated a hazard rating of less than 5.0. By example, a petrochemical
refinery with a hazard rating of 9.2 would be classified in the HR1 band, while a small boiler with a
hazard rating of 4.2 would be classified in the HR 5 band.
The receptor impact category scored the industrial impact in two sub-categories, namely exposure
potential and cumulative impact potential. In terms of the exposure potential, the total population of
the local municipality in which the industry was located was assessed. Industries located in local
municipalities with high population were assessed to pose a greater exposure potential. In terms of the
cumulative impact potential the overall location of the industry was assessed in relation to other
pollution sources, with isolated rural operations assessed to have a lower impact potential as opposed
to industries located within known air pollution hotspots.
The compliance status category scored the industrial impact in two sub-categories, namely compliance
monitoring potential and operator compliance. As highlighted previously, the historical compliance
and enforcement of the APPA legislation was limited due to capacity constraints. In terms of the
compliance monitoring potential, the industries were assessed based on the date the registration
certificates were issued. Industries with registration certificates issued within the last five years were
deemed to contain operational conditions in line with the NEMA principles relating to environmental
management, while older registration certificates were deemed to be out of line with modern
environmental principles. By example, a registration certificate issued in the 1970s contained no
emission limits but was considered legally valid, whereas a registration certificate, in the same
industrial sector, issued in 2009 would contain emission limits in line with best available technology
(BAT). In terms of the operator compliance, the industries were assessed based on the number of
public complaints received, negative APCO audit report findings and compliance directives issued
within the last ten years. The higher the number of complaints, negative audit findings or compliance
directives issued, the greater the assessed score. Information to inform this assessment was gathered
during the APPA Registration Certificate Review project and was augmented by feedback received
during Working Group II Meetings (National – Provincial Air Quality Officers Forum) which are held
on a quarterly basis.

67
Figure 4.5 shows the weightings applied to the criteria, sub-categories and categories to derive an
impact score for each individual plant. The weightings are slightly modified from the original
weightings applied during the APPA Registration Certificate Review project to accommodate the
changes made to the assessment criteria for this research. Each individual criteria score, as determined
using the scoring parameters detailed in Table 4.3, is weighted at 100% of the assessed score. For
example a company holding five registration certificates would receive a score of 40 and this score
would be considered in the weighting exercise. Once all scores for each of the criteria have been
determined, the weighting exercise proceeds to the sub-category level. At this level the first of the
differential weighting occurs. The percentage weighting specified is applied against the criteria score.
Following the application of the initial weighting at the sub-category level, the scores obtained within
each of the three assessment categories are summed. The resultant scores represent the individual
category scores which are further weighted to generate a final assessment score. Box 4.1 below shows
a worked example of the weighting system.
Box 4.1: Worked Example of Industrial Weighting System
Company X is a petrochemical refinery located in Johannesburg. It currently holds 15 registration
certificates and the last amendment to any registration certificate took place in 2002. Within the last 10
years there have been two public complaints regarding odour and a compliance directive was issued
for the company to address fugitive emissions from their tank farm.
Source Impact Score
No. of RC’s Held = 15 – Score 80 (Weighting 30%) = 24
Industry Hazard Rating = 9.2 = HR1 – Score 100 (Weighting (70%) = 70
Final Source Impact Score = 94
Receptor Impact Score
Local Municipality Population = 3 225 812 – Score 100 (Weighting 70%) = 70
Location = Metro / Priority Area – Score 100 (Weighting 30%) = 30
Final Receptor Impact Score = 100
Compliance Status Score
Date of Last RC Amendment – 2002 – Score 25 (Weighting 50%) = 12.5
APCO Findings / Complaints / Directives – 3 – Score 50 (Weighting 50%) = 25
Final Compliance Status Score = 37.5
Final Impact Score
Final Source Impact Score (94) (Weighting 40%) = 37.6
Final Receptor Impact Score (100) (Weighting 25%) = 25.0
Final Compliance Status Score (37.5) (Weighting 35%) = 13,1
Final Industrial Assessment Rating for Company X = 75.7

68
Criteria
Sub-Categories
Categories
Final Rating
Figure 4.4:
Weightings applied to criteria, sub-categories and categories (after DEAT, 2006c)
Number of RC’s Held – 100%
Industry Hazard Rating – 100%
Local Municipality
Population – 100%
Location – 100%
Date of Last Amendment
to RC – 100%
APCO Findings / Complaints /
Directives Issued – 100%
Air Pollution Potential – 70%
Scale of Operation – 30%
Source Impact – 40%
Exposure Potential – 70%
Potential for Cumulative
Concentrations and Impacts –
30%
Receptor Impact – 25%
Compliance Monitoring
Potential – 50%
Operator Compliance – 50%
Compliance Status – 35%
Total

69
Transport (roads), 93.3
Product Removal, 0.8
Miscellaneous, 1.1
Topsoil Removal, 2.7
Drilling and Blasting, 0.4
Overburden Stripping, 1.6
Handling (stockpiles), 0.1
After a score is obtained for a plant it is then aggregated with the other industrial operations
within the boundary of the local municipality or metro. This allows for comparison of the
industrial emissions on a local, district, provincial and national basis.
4.2.3.2 Mining Sources
Mining operations are considered a significant source of air pollution, specifically dust. Over
70% of copper, 80 % of ferrous metals and 95% of the industrial minerals are mined by surface
mines and quarries (Thompson and Visser, 2000). Figure 4.6 shows the percentage contribution
to total dust emissions from a typical South African strip mine.
Figure 4.5: Percentage contribution to total dust emissions from typical South African
strip mine (after Amponsah-DaCosta, 1997)
Figure 4.6 shows that the haul roads on typical South African strip mines account for over 90%
of the dust emissions. The impact of emissions from mining operations may be localised but a
high density of mining operations can impact on ambient concentrations. The Department of
Mineral and Energy (now the Department of Mineral Resources) publishes a summary of
operating mines and quarries and mineral processing plants in South Africa on a regular basis.
The most recent summary was published in 2006 (DME, 2006). The report was analysed and all

70
Eastern Cape, 117, 11%
Free State , 38, 4%
Gauteng, 119, 11%
KwaZulu Natal, 90, 9%
Limpopo, 103, 10%
Mpumalanga, 147, 14%
North West, 136, 13%
Northern Cape, 132, 13%
Western Cape, 157, 15%
active mines were mapped down to the local government level. Figure 4.7 shows a summary of
active mines on a provincial basis. Figure 4.7 shows that the mines are well distributed on a
provincial basis, with no single province having more than 15% of the active mines. The DME
report includes surface mines, open cast mines, underground mines, mines at sea and mineral
beneficiation works. The mines at sea were excluded from the analysis and also the works,
whose impact is accounted for in the industrial emissions section.
Figure 4.6: Provincial distribution of the active mining operation in South Africa
(DME, 2006)
The impact of the mining operations was established by initially calculating the mine density
per km2 across each local municipality. The mine density was then multiplied by the population
density of the local municipality to allow for national comparison. The same calculation was
applied at the metropolitan and district municipality level. Box 4.2 shows a worked example of
the mine impact calculation.

71
Box 4.2: Worked Examples of Mine Impact Calculation
The Sol Plaatjie Local Municipality is located in the Frances Baard District in the Northern
Cape and contains 18 diamond mines within the 1877.1 km2 area of the local municipality with
a population density of 107.3 people/km2.
Mine density = 18/1877.1 = 0.00958 mines/km2
Corrected for population density = 0.00958 x 107.3 = 1.029
The Swartland Local Municipality is located in the West Coast District in the Western Cape and
contains 21 operational mines within the 3692.2 km2 area of the local municipality with a
population density of 19.5 people/km2.
Mine density = 21/3692.2 = 0.00569 mines/km2
Corrected for population density = 0.00569 x 19.5 = 0.111
4.2.3.4 Domestic Sources
Air pollution in dense, low-income settlements in South Africa is acknowledged as a major
threat to the health and well-being of people living and working in these communities (Scorgie
et al., 2004a; Pauw et al., 2008). Figure 4.8 shows a summary of the results of a FRIDGE study
to examine the potential socio-economic impact of measures to reduce air pollution from
combustion.
Figure 4.7 Summary of the results of the FRIDGE study (Pauw et al., 2008)

72
The first column in Figure 4.8 above shows the percentage of respiratory related hospital
admissions in relation to the pollution source. Almost 70% of the hospital admissions could be
attributed to domestic emissions. The second column in Figure 4.8 shows the percentage of
premature mortalities in relation to the pollution source. Over 70% of the premature mortalities
could be attributed to domestic emissions.
Domestic air pollution in South Africa is considered to be the single most important source of
impact due to the fact that those exposed to the pollution are considered the most susceptible in
terms of socio-economic factors (Pauw et al., 2008). They are traditionally the elderly and the
youth, with limited finances and limited access to basic health care.
The majority of the dense low-income communities are using energy carriers that are low on the
energy ladder (Smith, 1987). The domestic emissions in South Africa can be divided into three
categories, emissions from fuels used for space heating, emissions from fuels used for cooking
and emissions from fuels used for lighting.
In South Africa, the common fuels used for space heating and cooking include wood, coal and
paraffin, with limited use of liquid petroleum gas (LPG) and animal dung. The common fuel
used for lighting is paraffin, with limited use of LPG. Candles are also a popular lighting source
with limited air pollution impact potential, but the risk of accidental fires is high. Table 4.4
summarises the pollutants emitted by each of the different energy carriers.
Table 4.4 Summary of pollutants emitted by the common energy carriers used in
South Africa (Hays et al., 2003; Scorgie et al., 2004b)
Energy Carrier Associated Pollutants
Coal Particulate Matter, NO2, CO, SO2, PAHs, Heavy Metals and VOCs
Wood Particulate Matter, NO2, CO, Polycyclic Aromatic Hydrocarbons
(PAHs) and VOCs
Paraffin Particulate Matter, NO2, CO and PAHs
LPG NO2, CO, SO2 and VOCs
Other biomass (dung) Particulate Matter, PAHs, NO2, CO and VOCs
The Census 2001 data (StatsSA, 2004) for domestic heating, cooking and lighting was analysed
on a local municipality level. The dominant carrier was identified for each local municipality. In
order to be classified as a dominant carrier more than 25% of the households in the area must be
classified as using a particular carrier. This resulted in some cases where more than a single

73
carrier was identified in each area. The carriers or combinations of carriers were rated in terms
of their pollution impact potential. Electricity was considered the cleanest carrier, followed by
LPG, wood, paraffin and coal (Dockery et al., 1993; Pope III et al., 1995; Brunekreef and
Holgate, 2002; Oosthuizen, 2004). No areas were identified where the dominant carrier was
other biomass (dung). The carriers or combination of carriers were listed from lowest to highest
pollution impact potential. The domestic cooking sector comprised 12 combinations of carriers
with electricity rated as one and a combination of wood and coal rated as 12. The domestic
heating sector comprised 11 combinations of carriers with electricity rated as one and a
combination of wood and coal rated as 11. The domestic lighting sector comprised six
combinations of carriers with electricity rated as one and a combination of paraffin and candles
rated as six. Following the pollution impact potential rating the scores for each sector were
combined to give a single value per local municipality. A weighting was applied to each activity
based on the scale of the emissions potential. Cooking and heating consume more fuel than that
used for lighting. For the average household with an income under R 3000 per month, 60% of
monthly energy expenditure was used on cooking, 30% on space heating and 10% on lighting
(Winkler et al., 2002). The same weighting was applied to each sector to derive a single value
per local municipality. In order to account for the impact of dense highly populated areas the
final domestic emission rating was then multiplied by the population density. Box 4.3 provide a
worked example of the rating and weighting system
This methodology differs from the conventional approach to domestic emission estimations,
which applies emission factors to estimated fuel usage to estimate actual emissions (EMM,
2004; Scorgie et al., 2004b; DEAT, 2007b). The high degree in variability of the fuel quality
creates a degree of uncertainty in the results produced by this methodology, combined with the
uncertain impact of the national electrification programme. Pauw et al. (2008) indicate that the
trends in domestic energy sources are changing, as such, until the next full population census
scheduled for 2011, the emission estimates from this sector will carry a high degree of
uncertainty.

74
Box 4.3: Worked Example of the Domestic Emission Rating and Weighting System
Urban Example
In the Nelson Mandela Bay Metropolitan Municipality the dominant energy carriers for
domestic cooking are electricity and paraffin, while the dominant energy carriers for domestic
heating are electricity and paraffin and the dominant energy carrier for lighting is electricity.
The pollution impact potential rating for electricity / paraffin for cooking is 3 (Weighting –
60%) = 1.8
The pollution impact potential rating for electricity / paraffin for heating is 2 (Weighting – 30%)
= 0.6
The pollution impact potential rating for electricity for lighting is 1 (Weighting – 10%) = 0.1
Final domestic emission rating = 1.8+0.6+0.1 = 2.5
Corrected for population density - 2.5 x 513.4 = 1283.5
Rural Example
In the Engcobo Local Municipality the dominant energy carrier for domestic cooking is wood,
while the dominant energy carrier for domestic heating is wood and the dominant energy
carriers for lighting are paraffin and candles.
The pollution impact potential rating for wood for cooking is 6 (Weighting – 60%) = 3.6
The pollution impact potential rating for wood for heating is 5 (Weighting – 30%) = 1.5
The pollution impact potential rating for paraffin / candles for lighting is 6 (Weighting – 10%) =
0.6
Final domestic emission rating = 1.8+0.6+0.1 = 5.7
Corrected for population density – 5.7 x 65.7 = 374.5
4.2.3.5 Summary of Air Pollution Impact Potential Impact
Each emission parameter will be individually mapped at a district and local municipality level
on a national basis. The rating for each sector will be derived based on the following
methodology. Population density will be rated on a seven level scale for both the district and
local municipality level, with one indicating a low population density. The industrial emission
impact will be rated on a six level scale for the district municipalities and a nine level scale for
the local municipalities, with one indicating a low industrial emission impact potential. The
mining impact will be rated on a six level scale for both the district and local municipality level,
with one indicating a low impact potential. The traffic emission impact will be rated on a six
level scale for both the district and local municipality level, with one indicating a low traffic

75
emission impact potential. The domestic impact will be rated on a seven level scale for both the
district and local municipality level, with one indicating a low domestic impact potential. These
parameters were then combined to produce a single score for each district and local
municipality. Since most of these parameters have been corrected based on population density
and area, each of the ratings will carry equal weight. The district municipalities were rated on a
scale of five to 32, while the local municipalities were rated on a scale ranging from five to 35,
with five indicating a low air pollution impact potential, increasing to the respective maximums.
4.2.4 Topography
The topographical component of the analysis will only be applied after the primary analysis of
the geopolitical boundary, population density and emission analysis. The New Zealand
methodology describes an extremely complicated methodology for ridge analysis and the
identification of potential airsheds (Fisher et al., 2005). The methodology used in this research
will be the overlaying of the four major catchment categories (primary, secondary, tertiary and
quaternary) as identified by the Department of Water Affairs and Forestry (now Department of
Water Affairs). The topography analysis will be used to decide whether two adjacent
municipalities should be considered as separate air quality management areas or whether the
topography of the area indicates that two or more adjacent areas should be combined into a
single air quality management area. Figure 4.9 shows the location of the four different
catchment types in South Africa. The tertiary and quaternary catchment levels are considered to
be too detailed for an assessment at the district and local municipality level, as such only the
primary and secondary catchment levels will be used in the topographical analysis.
4.3 Spatial Analysis
Each of the components will be captured into a GIS. The GIS will then overlay each of the
components to produce a composite air pollution impact potential rating for each metro / district
/ local municipality. No adjustments to the standard operation of the GIS technique were
applied. The analysis of the results will involve an assessment of the location of the existing
national priority areas, the potential identification of additional national priority areas, the
potential identification of provincial priority areas and a comparison with the municipalities
listed in Table 24 of the National Framework.

76
Figure 4.8 Location of the boundaries of the four major catchment types in South
Africa (after DWA, 2009)

77
CHAPTER FIVE
RESULTS
5.1 Introduction
The results are provided at the district and local municipality level, with both incorporating the
metropolitan municipalities. The district and metropolitan municipalities are the future
atmospheric emission licencing authorities and will form the primary level of assessment when
identifying the boundaries of air quality management areas, however the results at the local
municipality level allow for the refinement of boundaries of the areas.
5.2 Population Density
Figure 5.1 shows the population density for South Africa at the district and metropolitan
municipality level. As expected, the highest population densities are indicated in the six
metropolitan municipalities. The national average population density is 36.7 people/km2. The
Gauteng province has the highest population density (493.3 people/km2), with over 20% of the
total population of the country located within only 2% of the total surface area. The Northern
Cape province has the lowest population density (3.7 people/km2), with only 2% of the total
population located within 24% of the total surface area. Table 5.1 summarises the population
density per province. The population density in the eastern half of the country is higher than the
western half. KwaZulu-Natal, Limpopo and the Eastern Cape have relatively high population
densities outside of the major urban centres.
Table 5.1: Summary of population density per province
Province Population Density
(people/km2)
Eastern Cape 40.9
Free State 20.9
Gauteng 493.3
KwaZulu Natal 106.1
Limpopo 43.2
Mpumalanga 51.3
North West 28.5
Northern Cape 3.7
Western Cape 44.7

78
Figure 5.1 Population densities (people/km2) by district municipality
Figure 5.2 shows the population density for South Africa at the local municipality level. The
grey areas are district management areas (DMAs) which are the formally declared nature
conservation areas. The population densities in these areas are very low due to the low number
of permanent residents and have been excluded from this study. The local municipality with the
lowest population density (0.4 people/km2) is the Karoo Hoogland Local Municipality in the
Northern Cape, while the local municipality with the highest population density (872.9
people/km2) is the Msunduzi Local Municipality in KwaZulu-Natal. Figure 5.2 again shows the
high population densities in the eastern half of the Eastern Cape, the central and eastern areas of
Limpopo and throughout KwaZulu-Natal. These areas are predominately rural and the relatively
high population densities can be attributed to the apartheid legacy of independent homelands,
namely Transkei, Bophuthatswana, Ciskei, Venda, Gazankulu, Lebowa and KwaZulu. This
figure also shows the location of the larger urban centres, namely Bloemfontein, Kimberley,
Pietermaritzburg, Nelspruit and East London.

79
Figure 5.2 Population densities (people/km2) by local municipality
5.3 Emissions
5.3.1 Industrial Sources
The industrial source results are presented in two separate ways. Firstly the actual number of
companies operating scheduled processes is presented at both the district and local municipality
level. This is followed by the industrial impact rating, also at the district and local municipality
level. Figure 5.3 shows the number of companies operating scheduled processes at the district
and metropolitan municipality level.
The Gauteng province has the highest number of companies registered in terms of the APPA,
with 486 or 33% of the national total. The Northern Cape province has the fewest companies
registered, with only 30 or 2% of the national total. Outside of the metropolitan municipalities
the Bojanala Platinum (North-West), Gert Sibande (Mpumalanga), Nkangala (Mpumalanga)
and Ehlanzeni (Mpumalanga) District Municipalities have the highest number of companies
registered.

80
Figure 5.3 Summary of the number of companies operating scheduled processes by
district municipality
The establishment of an atmospheric emission licencing authority requires extensive human,
financial and technical resources. As such, the DEA is recommending that all licencing
authorities with 10 or fewer companies should consider delegating the licencing responsibility
to the relevant province in terms of Section 36 of the AQA. Based on the information presented
in Figure 5.3, all of the metropolitan municipalities should undertake the atmospheric emission
licencing function, 16 of the district municipalities should consider delegating the function to
the respective provinces, while the remaining 34 district municipalities should considering
offering the atmospheric emission licencing function. A more detailed analysis will be provided
in Chapter 6.
Figure 5.4 shows the number of companies operating scheduled processes at the local and
metropolitan municipality level. The Ekurhuleni Metro has the highest number of individual
companies, 234 or 15.5% of the national total. The Emalaheni Local Municipality
(Mpumalanga) has the highest number of individual companies at the local municipality level,
36 or 2.3% of the national total.

81
Figure 5.4 Summary of the number of companies operating scheduled processes by
local municipality
Figure 5.4 shows that many local municipalities in the Northern Cape, Limpopo and Eastern
Cape do not have a single company registered. A detailed summary of metropolitan, district and
local municipality information is provided in Appendix 1.
Figure 5.5 shows the industry rating at the metropolitan and district municipality level following
the application of the rating methodology described in Section 4.2.3.1. The rating methodology
is applied to each individual company and this is then agglomerated at the local, district and
metropolitan municipality level. This information is considered to be more representative of the
air pollution impact potential of each of the sites. When compared with Figure 5.3, a similar
pattern emerges. However, the low rating score by smaller industrial operations in the more
rural areas of the Northern Cape, KwaZulu-Natal and Eastern Cape is apparent. The high impact
rating in Mpumalanga confirms the previous observations made in Figure 5.3. This parameter
will be used as the input to represent industrial sources in the air pollution impact potential
indicator value.

82
Figure 5.5 Summary of industry rating of companies operating scheduled processes
by district municipality
Figure 5.6 shows the industry rating at the local municipality level. The results confirm the
observations made from Figure 5.4, with the highest air pollution impact potential from
industrial emissions occurring in the metropolitan municipalities. In the Eastern Cape, the
Buffalo City Local Municipality is the only area outside of the Nelson Mandela Bay Metro that
indicates high air pollution impact potential (rating greater than 500). This can be attributed to
the industrial activity in the city of East London. In the Free State, three local municipalities are
highlighted as having high air pollution impact potential, namely Metsimaholo, Matjhabeng and
Manguang. This can be attributed to the industrial activity in the towns of Sasolburg and
Welkom and the city of Bloemfontein, respectively. In Gauteng there are four local
municipalities outside of the metros that are highlighted as having high air pollution impact
potential. They include Emfuleni, Midvaal, Mogale City and Kungwini. This can be attributed
to the industrial activity in the towns of Vanderbijlpark, Vereeniging, Krugersdorp and
Bronkhorstspruit, respectively. In KwaZulu-Natal there are three local municipalities outside of
the Ethekwini Metro that are highlighted as having high air pollution impact potential, they
include uMhlathuze, Umsunduzi and Newcastle. This can be attributed to the industrial activity

83
in the cities of Richards Bay and Pietermaritzburg and the town of Newcastle, respectively.
There are no local municipalities in the Limpopo Province identified as having high air
pollution impact potential due to industrial emissions.
Figure 5.6 Summary of industry rating of companies operating scheduled processes
by local municipality
In Mpumalanga there are seven local municipalities that are highlighted as having high air
pollution impact potential, they include Msukaligwa, Mkhondo, Govan Mbeki, Emalahleni,
Steve Tshwete, Mbombela and Thaba Chweu. In the North-West there are two local
municipalities identified as having high air pollution impact potential, they include Madibeng
and Rustenburg. This can be attributed to the industrial activity in the towns of Brits and
Rustenburg respectively. There are no local municipalities in the Northern Cape identified as
having high air pollution impact potential due to industrial emissions. In the Western Cape there
is only one local municipality, outside of the City of Cape Town Metro, that is identified as
having high air pollution impact potential due to industrial emissions, namely the George Local
Municipality.

84
5.3.2 Mining Sources
Figure 5.7 shows the density of mining operations on a metropolitan and district municipality
scale. There is a high density of coal mines in the Gert Sibande and Nkangala District
Municipalities in Mpumalanga. There is a high density of platinum group metal (PGM) mines in
the Bojanala Platinum District Municipality in the North-West. There is a high density of
diamond mines in the Frances Baard District Municipality in the Northern Cape.
Figure 5.7 Summary of the number of operational mines by district municipality
The high density of mines in the Cacadu and West Coast District Municipalities are associated
with quarrying activities for the production of aggregate and crusher sand, while sand mining
and clay mining also occurs in these areas. Mining activities appear to be concentrated in the
northern and western parts of the country, with relatively fewer mines in the north of the Eastern
Cape, the Free State and KwaZulu-Natal.

85
Figure 5.8 shows the density of mines on a local municipality scale. Over 35% of the local
municipalities do not have a single active mine within their jurisdiction. There is a high density
of mining operations in the vicinity of the metropolitan areas, mostly to provide quarry material
for construction purposes. The local municipality with the highest number of mines (40) is the
Dikgatlong Local Municipality in the Northern Cape where diamond mining dominates.
Figure 5.8 Summary of the number of operational mines by local municipality
Figure 5.9 shows the mining rating at the metropolitan and district municipality level following
the application of the methodology described in Section 4.2.3.2. The rating methodology is
applied at each local government structure level. This rating system is considered to be more
representative of the air pollution impact potential of mining operations in each area.

86
Figure 5.9 Summary of the mining rating by district municipality
Figure 5.10 Summary of the mining rating by local municipality
There are discernable differences between the maps indicating the mine density and those which
have been corrected for population density. At the district municipality level (Figures 5.7 & 5.9)
the areas of high mine density and low population density are apparent in the Northern Cape,

87
Limpopo and Mpumalanga. The areas of lower mine density but high population density are
apparent in Gauteng and KwaZulu Natal. These observations are further amplified by the maps
showing the local municipality level (Figures 5.8 & 5.10).
5.3.3 Domestic Sources
Figures 5.11 and 5.12 show the summary of the domestic emission potential at the metropolitan
and district and local municipality level, respectively. It is apparent that the eastern half of the
country has a higher domestic emissions potential than the western half. This can also be
attributed to the fact that the calculation takes population density into consideration. While
electricity is widely used in the metropolitan municipalities, the dense low income settlements
found throughout these areas contribute to the high domestic emissions potential.
Figure 5.11 Summary of domestic emissions potential by district municipality
The dominant fuel used for cooking in urban areas is paraffin, while wood and coal are used to a
lesser extent. The dominant fuel use for cooking in rural areas is wood. Electricity and wood are
the common fuels used for space heating, with paraffin used to a lesser extent. Coal usage is
more commonly used in the interior of the country and more specifically in the areas close to

88
the coal mines, namely Mpumalanga and northern KwaZulu-Natal. The dense rural populations
using coal and wood for cooking and heating purposes are clearly visible in Limpopo,
KwaZulu-Natal, Mpumalanga and the Eastern Cape. Surprisingly, the Western Cape is heavily
reliant on electricity, even in rural areas.
Figure 5.12 Summary of the domestic emission potential by local municipality
5.4 Air Pollution Impact Potential Rating
Each of the parameters presented above was combined into a single air pollution impact
potential rating by municipality. Box 5.1 provides worked examples for the calculation of three
separate air pollution impact potential rating calculations. Figure 5.13 and 5.14 shows the air
pollution impact potential rating for the district and local municipalities respectively. The higher
the rating value the higher the air pollution impact potential. All of the metropolitan
municipalities have high air pollution impact potential ratings. Each of these maps will be
subjected to topographical analysis, after which the delineation of air quality management areas
within South Africa will be determined.

89
Box 5.1 Worked example of air pollution potential impact rating calculations
High Impact Potential Rating
The Nelson Mandela Bay Metropolitan Municipality (Port Elizabeth) in the Eastern Cape has a
population density of 513.4 people/km2 which resulted in a rating of six on the seven level scale.
The area has 40 companies operating scheduled processes and scored an industrial impact of
2224.2 which resulted in a rating of five on the six level scale. The area has 38 operational
mines and scored a mining impact ratio of 9.96 which resulted in a rating of six on the six level
scale. The area scored a domestic rating of 1206.5 which resulted in a rating of seven on a seven
level scale.
Final rating = 6+5+6+7 = 24 out of a possible 26
Medium Impact Potential Rating
The Mopani District Municipality in Limpopo has a population density of 86.9 people/km2
which resulted in a rating of two on the seven level scale. The area has 21 companies operating
scheduled processes and scored an industrial impact of 897.0 which resulted in a rating of two
on the six level scale. The area has 21 operational mines and scored a mining impact ratio of
0.16 which resulted in a rating of four on a six level scale. The area scored a domestic rating of
1864.4 which resulted in a rating of seven on a seven level scale.
Final rating = 2+2+4+7 = 15 out of a possible 26
Low Impact Potential Rating
The Xhariep District Municipality in the Free State has a population density of 3.9 people/km2
which resulted in a rating of one on the seven level scale. The area has 3 companies operating
scheduled processes and scored an industrial impact of 109.1 which resulted in a rating of one
on the six level scale. The area has 1 operational mine and scored a mining impact ratio of
0.0001 which resulted in a rating of one on a six level scale. The area scored a domestic rating
of 45.1 which resulted in a rating of one on a seven level scale.
Final rating = 1+1+1+1 = 4 out of a possible 26

90
Figure 5.13 Air pollution impact potential rating for district municipalities
Figure 5.14 Air pollution impact potential rating for local municipalities

91
5.5 Topographical Analysis
Topography is the final parameter that will be used in the methodology to delineate the
boundary of air quality management areas in South Africa. The Department of Water Affairs
has defined all the river catchments in South Africa, at the primary, secondary, tertiary and
quaternary level (DWA, 2009). The final air pollution impact potential maps will be overlain
with the primary and secondary river catchments which have been shown to be the most
appropriate levels to be used in the topographical analysis. Figure 5.15 shows the district
municipality air pollution impact potential map with the primary and secondary river
catchments. Figure 5.16 shows the local municipality air pollution impact potential map with
the primary and secondary river catchments.
Figure 5.15 Primary and secondary river catchments in relation to district
municipalities

92
Figure 5.16 Primary and secondary river catchments in relation to local municipalities
The primary river catchments and district municipalities have been used for the preliminary
assessment of the boundaries of air quality management areas, this will be further refined
through the use of secondary river catchments and local municipalities in Chapter 6.

93
CHAPTER 6
DISCUSSION AND IMPLICATIONS FOR GOVERNMENT
6.1 Introduction
The AQA makes provision for the introduction of the priority area management tool as a
mechanism to address areas where the ambient air quality exceeds or is likely to exceed ambient
standards. Since air pollution may have cross-boundary impacts and air quality management
resources in South Africa are limited, cooperation between the different spheres of government
is required (Scorgie et al., 2004a; Zunckel et al., 2006a; Piekth et al., 2006). Three different
types of priority areas can be designated, each with their own criteria and management
implications.
In the event an air quality management area crosses a provincial or national boundary, then the
Minister must declare a national priority area. The National Air Quality Officer (NAQO) takes
responsibility for the development and implementation of the national priority area management
plan, together with all the other affected spheres of government. In the event an air quality
management area crosses a district or metropolitan boundary, but remains within a single
province, then the MEC must declare a provincial priority area. The Provincial Air Quality
Officer (PAQO) takes responsibility for the development and implementation of the provincial
priority area management plan. Should the province not have sufficient capacity to assume
responsibility for the priority area, then the MEC may request the Minister to take responsibility
for the development and implementation of the provincial priority area management plan.
Should an air quality management area fall within a single district or metropolitan municipality,
then the air quality management plan for that district or metropolitan municipality must address
the problem.
The results from Chapter 5 will now be assessed at the national, provincial and local
government level. At the national level, two national priority areas have been declared to date.
An assessment will be undertaken to check whether the declarations were justified and the
extent to which the boundaries of the areas, which were subjectively determined, coincide with
boundaries as determined by the methodology developed through this research. A further
investigation will be done to see whether any other areas in the country warrant declaration as

94
national priority areas. To date, no provincial priority areas have been declared in South Africa.
A preliminary assessment will be undertaken to identify any potential provincial priority areas.
Finally, an assessment will be undertaken to assess the justification of the classification of the
local municipalities identified in Table 24 of the National Framework.
6.2 National Implications
6.2.1 Vaal Triangle Airshed Priority Area
Figure 6.1 shows the extent of the Vaal Triangle Airshed Priority Area (VTAPA) that was
declared on 21 April 2006. The area covers portions of the Gauteng and Free State Provinces.
District or metropolitan municipalities involved includes the City of Johannesburg, Sedibeng
and Fezile Dabi, while local municipalities involved include Emfuleni, Midvaal and
Metsimaholo. The VTAPA includes the historical Vaal Triangle, defined as the area within the
towns of Sasolburg, Vanderbijlpark and Vereeniging (Terblanche et al., 1992), with an extended
area towards the north, including the southern regions of the City of Johannesburg.
Figure 6.1 Extent of the Vaal Triangle Airshed Priority Area
Figures 6.2 and 6.3 shows the results of analysis undertaken as part of this research, at the
district and local municipality level, respectively. Each of the maps has the primary and

95
secondary drainage basins indicated. Table 6.1 and 6.2 show the calculated impact potential
scores determined at the district and local municipality level, respectively.
Figure 6.2 VTAPA shown in relation to the estimated air pollution impact potential
rating at the district municipality level
Table 6.1 Air pollution impact potential scores for the District Municipalities in and
around the VTAPA
Province District / Metropolitan Municipality Impact Score
Free State Fezile Dabi District Municipality 8
Gauteng Sedibeng District Municipality 16
Gauteng City of Johannesburg Metropolitan Municipality 25
Gauteng Ekurhuleni Metropolitan Municipality 26
Gauteng West Rand District Municipality 17

96
Figure 6.3 VTAPA shown in relation to the estimated air pollution impact potential
rating at the local municipality level
Table 6.2 Air pollution impact potential scores for the Local Municipalities in and
around the VTAPA
Province District / Metropolitan
Municipality
Local Municipality Impact
Score
Free State Fezile Dabi Metsimaholo 12
Gauteng Sedibeng Midvaal 7
Gauteng Sedibeng Lesedi 5
Gauteng Sedibeng Emfuleni 22
Gauteng West Rand Westonaria 15
Gauteng West Rand Randfontein 14
Gauteng West Rand Merafong City 13
All areas comprising the existing VTAPA have relatively high to medium air pollution impact
potential, justifying their incorporation into the area. However an analysis of the topographical
parameter indicates that the priority area should also include adjacent areas, namely the local
municipalities of Westonaria, Randfontein and Merafong City in the West Rand District
Municipality to the west, the local municipality of Lesedi in the Sedibeng District Municipality
to the east and the Ekurhuleni Metropolitan Municipality to the north. Figure 6.4 shows the
proposed revised delineation of the VTAPA. The inclusion of the Ekurhuleni Metropolitan

97
Municipality and the balance of the Sedibeng district municipality (Lesedi Local Municipality)
are deemed controversial as these areas form part of the current Highveld Priority Area (HPA).
The Lesedi Local Municipality has a low air pollution impact potential (5), but this area is
considered significant since there is significant air pollution transport over this area from both
the Ekurhuleni Metro and the Vaal Triangle due to prevailing winds. This recommendation is
further strengthened by the results of the baseline modelling assessment undertaken for the
VTAPA (DEAT, 2007b). Figures 6.5 and 6.6 shows the maximum modelled 24-hour PM10 and
SO2 concentrations within the VTAPA and surrounding areas. The location of the boundary of
the primary catchment further strengthens the argument for the inclusion of the Ekurhuleni
Metro into the VTAPA. It must be acknowledged at this stage that there will be significant
inter-basin transfer of air pollution between the VTAPA and the HPA. Recommendations are
made in Section 6.2.2 for the removal of Ekurhuleni and Lesedi from the current HPA.
Figure 6.4 Proposed revised delineation of the VTAPA
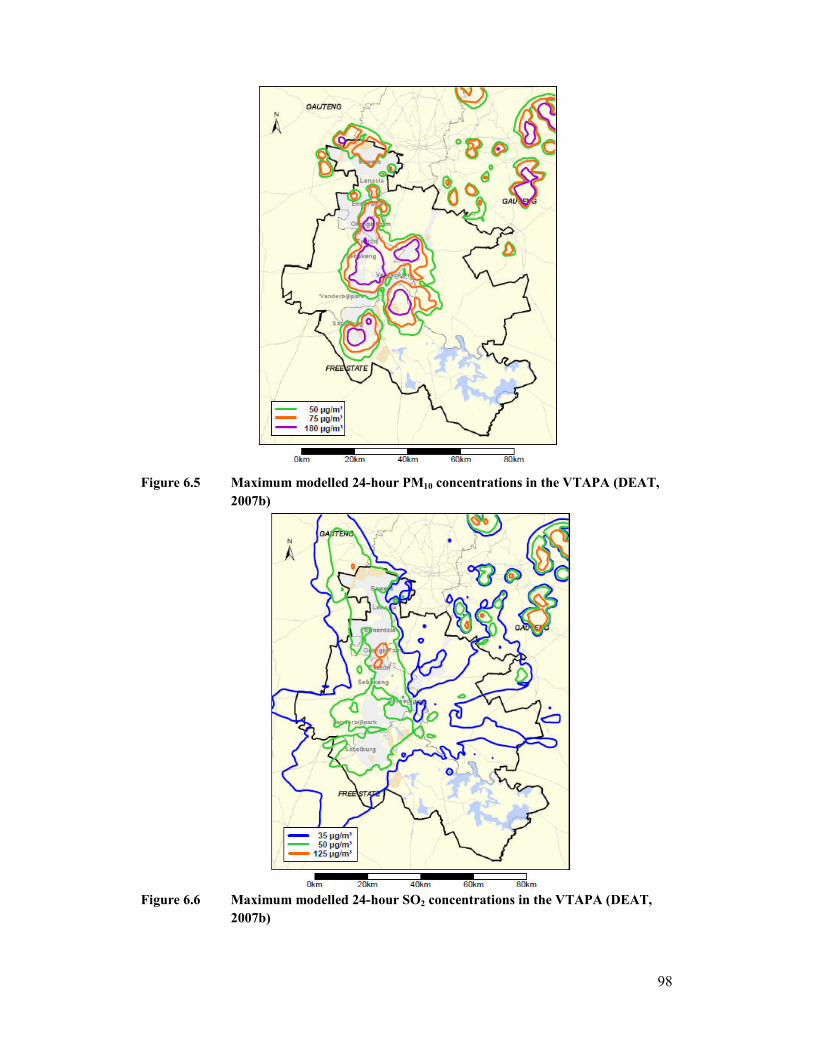
98
Figure 6.5 Maximum modelled 24-hour PM10 concentrations in the VTAPA (DEAT,
2007b)
Figure 6.6 Maximum modelled 24-hour SO2 concentrations in the VTAPA (DEAT,
2007b)

99
6.2.2 Highveld Priority Area
Figure 6.7 shows the extent of the Highveld Priority Area (HPA) declared on 23 November
2007. The area covers portions of the Gauteng and Mpumalanga provinces. District or
metropolitan municipalities include Ekurhuleni, Sedibeng, Nkangala and Gert Sibande, while
local municipalities include Lesedi, Delmas, Emalahleni, Steve Tshwete, Msukaligwa, Pixley ka
Seme, Lekwa, Govan Mbeki and Dipaleseng.
Figure 6.7 Extent of the Highveld Priority Area
Figures 6.8 and 6.9 shows the results of analysis undertaken as part of this research, at the
district and local municipality level, respectively. Table 6.3 and 6.4 show the calculated impact
potential scores determined at the district and local municipality level, respectively.

100
Figure 6.8 HPA shown in relation to the estimated air pollution impact potential
rating at the district municipality level
Table 6.3 Air pollution impact potential scores for the District Municipalities in and
around the HPA
Province District / Metropolitan Municipality Impact Score
Mpumalanga Nkangala District Municipality 17
Mpumalanga Gert Sibande District Municipality 13
Gauteng Sedibeng District Municipality 16
Gauteng City of Johannesburg Metropolitan Municipality 25
Gauteng Ekurhuleni Metropolitan Municipality 26
Gauteng Metsweding District Municipality 8
Limpopo Greater Sekhukhune District Municipality 12
Significant revisions to the boundary of the HPA are recommended based on the results
presented in Figures 6.8 and 6.9. It appears that the current delineation includes areas in the
south with relatively low air pollution impact potential and excludes areas in the north that have
relatively higher air pollution impact potential. The topographical analysis also confirms this
recommendation. Figure 6.10 shows the proposed revised delineation of the Highveld Priority
Area. This revised delineation sees the exclusion of the Ekurhuleni Metropolitan Municipality
and the Lesedi Local Municipality (Sedibeng District Municipality), which is now
recommended for inclusion in the VTAPA. All the local municipalities in the Gert Sibande
District Municipality are excluded, with the exception of the Govan Mbeki Local Municipality.

101
Figure 6.9 HPA shown in relation to the estimated air pollution impact potential
rating at the local municipality level
Table 6.4 Air pollution impact potential scores for the Local Municipalities in and
around the HPA
Province District / Metropolitan
Municipality
Local Municipality Impact
Score
Gauteng Sedibeng Lesedi 5
Gauteng Metsweding Kungwini 9
Mpumalanga Nkangala Delmas 10
Mpumalanga Nkangala Emalahleni 17
Mpumalanga Nkangala Steve Tshwete 11
Mpumalanga Nkangala Thembisile 11
Mpumalanga Nkangala Dr JS Moroka 12
Mpumalanga Gert Sibande Msukaligwa 8
Mpumalanga Gert Sibande Pixley ka Seme 6
Mpumalanga Gert Sibande Lekwa 6
Mpumalanga Gert Sibande Govan Mbeki 14
Mpumalanga Gert Sibande Dipaleseng 5
Limpopo Greater Sekhukhune Elias Motsoaledi 12
The Msukaligwa Local Municipality in the Nkangala District Municipality is also excluded.
Additional areas to the north are recommended for inclusion in the HPA, these include the
Kungwini Local Municipality in the Metsweding District Municipality, Thembisile Local

102
Municipality and Dr J.S. Moroka Local Municipality in Nkangala District Municipality and the
Elias Motsoaledi Local Municipality in the Greater Sekhukhune District Municipality in
Limpopo.
The recommendation for the revision of the boundary of the HPA is further strengthened by the
preliminary modelling results of the baseline assessment for the HPA (DEA, 2010). Figure 6.11
shows the modelled results indicating the frequency of exceedence of ambient air quality
standards only for industrial emissions in the HPA. The lack of exceedences in the southern and
eastern areas confirms the findings of this research. The high numbers of exceedences modelled
in the Ekurhuleni area confirms the results presented in Figures 6.5 and 6.6. It is the
topographical influence of the primary and secondary catchment boundaries that lead to the
recommendation for the inclusion of this area and the Lesedi Local Municipality area into the
VTAPA. It must be noted that extensive inter-basin transfer between the VTAPA and the HPA
will be expected to occur and that the two areas are merely separated for administrative and
management purposes. It must be noted that the two air quality management plans for the
national priority areas are managed by the national Department of Environmental Affairs under
the auspices of the National Air Quality Officer, thus ensuring a co-ordinated approach to air
quality management.
Figure 6.10 Proposed revised delineation of the HPA

103
Figure 6.11 Modelled exceedences of SO2 and PM10 in the HPA (DEA, 2010)
6.2.3 Proposed Magaliesberg Priority Area
Figure 6.12 shows the extent of the proposed Magaliesberg Priority Area (MPA). The area
covers portions of the Gauteng and North-West Province. Since the proposed priority area
crosses a provincial boundary the area is considered a national priority area. Metropolitan
municipalities included in the proposed priority area include the City of Tshwane and the City
of Johannesburg. District municipalities included in the proposed priority area include West
Rand and Bojanala, while local municipalities include Mogale City, Madibeng and Rustenburg.
The complex topography in this area, namely the Magaliesberg Mountains, strongly influences
dispersion and drainage patterns and forms a natural barrier within the proposed area. The area
is characterised by a combination of high density urban residential areas together with rural
industrial and mining activities. There is ambient air quality monitoring taking place in the City
of Tshwane and in Rustenburg but little is known or understood regarding the transfer of
pollution between these two areas. Tables 6.5 and 6.6 show the calculated impact potential
scores determined at the district and local municipality level, respectively.

104
Figure 6.12 Extent of the proposed Magaliesberg Priority Area
Table 6.5 Air pollution impact potential scores for the District Municipalities in the
proposed MPA
Province District / Metropolitan Municipality Impact Score
Gauteng City of Tshwane Metropolitan Municipality 24
Gauteng City of Johannesburg Metropolitan Municipality 25
Gauteng West Rand District Municipality 17
North West Bojanala District Municipality 16
Table 6.6 Air pollution impact potential scores for the Local Municipalities in the
proposed MPA
Province District / Metropolitan
Municipality
Local Municipality Impact
Score
Gauteng West Rand Mogale City 17
Gauteng City of Johannesburg n/a 25
Gauteng City of Tshwane n/a 24
North West Bojanala Madibeng 12
North West Bojanala Rustenburg 14

105
6.2.4 Proposed Waterberg Priority Area
Figure 6.13 shows the extent of the proposed Waterberg Priority Area (WPA). The area
incorporates all six local municipalities within the Waterberg District Municipality. Figures 5.13
and 5.14 do not identify this area as having high air pollution impact potential, however the
proposed priority area is identified based on the extensive development proposals currently
under consideration in the area. These include three new coal fired power stations, one of which
is currently under construction, the development of a new coal to liquid (CTL) facility and other
coal based industries. Current and future emissions from this area have the potential to impact
on Botswana located to the north. This is in addition to the developments currently planned on
the Botswana side of the border, which include two new coal-fired power stations and a
potential CTL facility. Since this area has the future potential to impact on areas outside of the
borders of the country it is considered as a national priority area, even though it does not cross a
provincial boundary. The DEA is currently considering declaring this area as the third national
priority area, as a proactive management measure. In the past the previous national priority
areas have been declared on a reactive basis. Table 6.7 show the calculated impact potential
scores determined at the local municipality level. This information confirms that the area is not
currently impacted by poor air quality.
Figure 6.13 Extent of the proposed Waterberg Priority Area

106
Table 6.7 Air pollution impact potential scores for the Local Municipalities in the
proposed WPA
Province District / Metropolitan
Municipality
Local Municipality Impact
Score
Limpopo Waterberg Thabazimbi 5
Limpopo Waterberg Modimolle 5
Limpopo Waterberg Mogalakwena 10
Limpopo Waterberg Bela Bela 6
Limpopo Waterberg Mookgopong 4
Limpopo Waterberg Lephalale 5
6.3 Provincial Implications
6.3.1 Eastern Cape
Table 6.8 shows the calculated impact potential scores determined at the district municipality
level in the Eastern Cape. The Nelson Mandela Bay Metropolitan Municipality (NMBMM) has
the highest industrial activity, highest population density and the second highest concentration
of mining activities in the province. The province has an extremely poor coverage of ambient air
quality monitors, as highlighted in Figures 1.2 – 1.4. No adjacent district / metros in the Eastern
Cape can be considered as potential provincial priority areas.
Table 6.8 Air pollution impact potential scores for the District / Metropolitan
Municipalities in the Eastern Cape
Province District / Metropolitan Municipality Impact Score
Eastern Cape Alfred Nzo District Municipality 9
Eastern Cape Ukhahlamba District Municipality 5
Eastern Cape Chris Hani District Municipality 8
Eastern Cape O.R. Tambo District Municipality 11
Eastern Cape Cacadu District Municipality 5
Eastern Cape Amathole District Municipality 13
Eastern Cape Nelson Mandela Bay Metropolitan Municipality 23
6.3.2 Free State
The Free State is characterised by low population densities due to the predominant agricultural
activities in the province. The Fezile Dabi District Municipality has the highest industrial
activity, however the bulk of this activity is concentrated in the north in the Metsimaholo Local

107
Municipality (Sasolburg). This district forms part of the Vaal Triangle Airshed Priority Area.
The highest concentration of mining activity is in the Lejweleputswa District Municipality,
which contains a high concentration of gold mines. The road density in the Free State is
generally low with only one major urban centre (Bloemfontein) in the province. Table 6.9
shows the calculated impact potential scores determined at the district municipality level in the
Free State. No other adjacent districts in the Free State can be considered as potential provincial
priority areas.
Table 6.9 Air pollution impact potential scores for the District Municipalities in the
Free State
Province District / Metropolitan Municipality Impact Score
Free State Xhariep District Municipality 4
Free State Thabo Mofutsanyane District Municipality 7
Free State Lejweleputswa District Municipality 7
Free State Motheo District Municipality 8
Free State Fezile Dabi District Municipality 8
6.3.3 Gauteng
The Gauteng province is the economic hub of the country with the highest industrial, population
and road densities. The central regions of the province are highly urbanised, with lower
population densities on the periphery. The Ekurhuleni Metropolitan Municipality has the highest
industrial density of any district or metro in the country and forms part of the HPA. The
Sedibeng District Municipality falls both within the VTAPA and HPA, while the southern parts
of the City of Johannesburg Metropolitan Municipality fall within the VTAPA. Due to the fact
that the districts and metros with significant air pollution impact potential are already
incorporated in national priority areas there is limited scope for the declaration of provincial
priority areas in Gauteng. Table 6.10 provides a summary of the calculated impact potential
scores determined at the district / metropolitan municipality level in Gauteng. There is an
industrial, commercial and residential corridor developing between The City of Johannesburg
Metropolitan Municipality and the City of Tshwane Metropolitan Municipality. The
combination of population density, industrial activity and road density identifies this as a future
potential provincial priority area. Figure 6.14 shows the extent of the proposed Johannesburg /
Tshwane Provincial Priority Area. The area incorporates the northern suburbs of the City of
Johannesburg, Midrand and the City of Tshwane.

108
Figure 6.14 Extent of the proposed Johannesburg / Tshwane Provincial Priority Area
Table 6.10 Air pollution impact potential scores for the District / Metropolitan
municipalities in Gauteng
Province District / Metropolitan Municipality Impact Score
Gauteng Metsweding District Municipality 8
Gauteng West Rand District Municipality 17
Gauteng Sedibeng District Municipality 16
Gauteng City of Johannesburg Metropolitan Municipality 25
Gauteng City of Tshwane Metropolitan Municipality 24
Gauteng Ekurhuleni Metropolitan Municipality 26
6.3.4 KwaZulu-Natal
The Ethekwini Metropolitan Municipality has the highest population density, industrial activity
and road density in the province. The balance of the province is characterised as predominantly
rural with urban pockets. The industrial hubs of Newcastle (Amajuba District Municipality),
Richards Bay (Uthungulu District Municipality) and Pietermaritzburg (Umgungundlovu District
Municipality) are clearly visible but this can be attributed to the dominance of the individual
local municipalities within the district, rather than a district wide effect. The districts

109
surrounding the Ethekwini Metro provide the potential for the declaration of a provincial
priority area.
To the north, the Ethekwini Metro is bordered by the iLembe District Municipality. The
development of new international airport, and the associated industrial hub, on the border
between these two areas may justify the declaration of the provincial priority area in the future.
Figure 6.15 shows the extent of the proposed iLembe / Ethekwini Provincial Priority Area. The
area includes the Ethekwini Metropolitan Municipality and the local municipalities of
KwaDukuza and eDondakusuka in the iLembe District Municipality. The rapid residential and
commercial expansion of the lower North Coast (Ballito, Umhlali etc.) provides further
justification for the declaration of this area. The recent opening of the King Shaka International
Airport in this area adds additional to the air pollution impact potential since this has been co-
developed with a trade port. The prevailing synoptic winds in the area are north-easterly and
south-westerly, which would transport pollution south from the iLembe District Municipality or
north from the Ethekwini Metro (Preston-Whyte, 1980). It is recommended that a programme of
ambient air quality monitoring is commenced in the area. Table 6.11 summarises the calculated
impact potential scores determined at the district / metropolitan and local municipality level.
Figure 6.15 Extent of the proposed iLembe / Ethekwini provincial priority area

110
Table 6.11 Air pollution impact potential scores for the municipalities in the proposed
iLembe / Ethekwini provincial priority area
Province District / Metropolitan
Municipality
Local Municipality Impact
Score
KwaZulu Natal Ethekwini n/a 26
KwaZulu Natal iLembe KwaDukuza 15
KwaZulu Natal iLembe eDondakusuka 16
To the west, the Ethekwini Metro is bordered by the uMgungundlovu District Municipality. The
rapid residential and commercial expansion of the Outer West regions (Hillcrest, Bothas Hill)
combined with the industrial development of the Cato Ridge area may justify the future
declaration of this area as a provincial priority area. There is a distinct topographical barrier
(Key Ridge) that separates the two areas, but katabatic drainage down river valleys transport air
pollution from the interior to the coast. Figure 6.16 shows the extent of the proposed
uMgungundlovu / Ethekwini provincial priority area. The area includes the Ethekwini
Metropolitan Municipality and the local municipalities of Msunduzi and Mkhambathini in the
uMgungundlovu District Municipality. Table 6.12 summarises the calculated impact potential
scores determined at the district / metropolitan and local municipality level.
Figure 6.16 Extent of the proposed uMgungundlovu / Ethekwini provincial priority
area

111
Table 6.12 Air pollution impact potential scores for the municipalities in the proposed
uMgungundlovu / Ethekwini provincial priority area
Province District / Metropolitan
Municipality
Local Municipality Impact
Score
KwaZulu Natal Ethekwini n/a 26
KwaZulu Natal uMgungundlovu Msunduzi 21
KwaZulu Natal uMgungundlovu Mkhambathini 12
To the south, the Ethekwini Metro is bordered by the Ugu District Municipality. The Ugu
District Municipality is characterised by ribbon development along the coastal areas, with a
rural interior, dominated by agriculture. While the Ugu District Municipality has a relatively
high pollution impact potential, due to industrial emissions and mining density, these activities
are concentrated along the coastal regions. The prevailing synoptic winds in the area are north-
easterly and south-westerly, which would transport pollution south from the Ethekwini Metro or
north from the Ugu District (Preston-Whyte, 1980). There is long term, high quality ambient air
quality monitoring information in the southern parts of the Ethekwini Metro and in the border
areas (Umkomaas). Further analysis of this ambient data may justify the declaration of a
provincial priority area. Figure 6.17 shows the extent of the proposed Ugu / Ethekwini
provincial priority area.
Figure 6.17 Extent of the proposed Ugu / Ethekwini provincial priority area

112
The area includes the Ethekwini Metropolitan Municipality and the local municipalities of
uMdoni and Hibiscus Coast in the Ugu District Municipality. Table 6.13 summarises the
calculated impact potential scores determined at the district / metropolitan and local
municipality level.
Table 6.13 Air pollution impact potential scores for the municipalities in the proposed
Ugu / Ethekwini provincial priority area
Province District / Metropolitan
Municipality
Local Municipality Impact
Score
KwaZulu Natal Ethekwini n/a 26
KwaZulu Natal Ugu uMdoni 18
KwaZulu Natal Ugu Hibiscus Coast 18
6.3.5 Limpopo
The Mopani District Municipality has the highest population density, together with the highest
industrial impact and road density in the province. The province is predominantly rural with
pockets of urban development. Mining activities in this province are concentrated along the
eastern limb of the Bushveld Igneous Complex. Table 6.14 provides a summary of the
calculated impact potential scores determined at the district / metropolitan municipality level in
Limpopo. No adjacent districts in Limpopo can be considered as potential provincial priority
areas.
Table 6.14 Air pollution impact potential scores for the district municipalities in
Limpopo
Province District / Metropolitan Municipality Impact Score
Limpopo Capricorn District Municipality 11
Limpopo Greater Sekhukhune District Municipality 12
Limpopo Vhembe District Municipality 11
Limpopo Waterberg District Municipality 6
Limpopo Mopani District Municipality 13
6.3.6 Mpumalanga
All three districts within the Mpumalanga province are similar with regards to their industrial
impact, mining density and road density. The Gert Sibande District Municipality has a lower

113
population density. Parts of the Nkangala and Gert Sibande District Municipalities are included
in the HPA. The Ehlanzeni District Municipality is disjunct from the other districts due to
topography. Due to the inclusion of a large portion of this province in the HPA no adjacent
districts in Mpumalanga can be considered as potential provincial priority areas. Table 6.15
provides a summary of the calculated impact potential scores determined at the district /
metropolitan municipality level in Mpumalanga.
Table 6.15 Air pollution impact potential scores for the District Municipalities in
Mpumalanga
Province District / Metropolitan Municipality Impact Score
Mpumalanga Ehlanzeni District Municipality 16
Mpumalanga Gert Sibande District Municipality 13
Mpumalanga Nkangala District Municipality 17
6.3.7 North West
The Bojanala District Municipality has the highest industrial impact and mining density in the
province. This district borders on the West Rand District Municipality and the City of Tshwane
Metro in Gauteng. The Magaliesberg provides a topographical barrier between the areas,
otherwise this may have been considered a potential national priority area. Mining activities in
this province are concentrated along the western limb of the Bushveld Igneous Complex. The
province can be characterised as rural with urban pockets. The towns of Klersdorp (Dr Kenneth
Kauanda District Municipality), Potchefstroom (Dr Kenneth Kauanda District Municipality),
Rustenburg (Bojanala District Municipality) and Brits (Bojanala District Municipality) are the
major industrial hubs in the province. Table 6.16 provides a summary of the calculated impact
potential scores determined at the district / metropolitan municipality level in the North West.
Due to the isolated nature of the urban centres no adjacent districts in the North West can be
considered as potential provincial priority areas.
Table 6.16 Air pollution impact potential scores for the District Municipalities in the
North West
Province District / Metropolitan Municipality Impact Score
North West Ngaka Modiri Molema District Municipality 8
North West Dr Ruth Segomotsi Mompati District Municipality 5
North West Dr Kenneth Kaunda District Municipality 9
North West Bojanala District Municipality 16

114
6.3.8 Northern Cape
The Northern Cape has the lowest population density in the country. The Siyanda and France
Baard District Municipalities are the only areas with any significant industrial development. The
road density in the Frances Baard District Municipality is the highest in the province. Mining
activity in the province is relatively high due to the presence of diamonds in Kimberley and
along the Orange River. Table 6.17 provides a summary of the calculated impact potential
scores determined at the district / metropolitan municipality level in the Northern Cape. No
adjacent districts in the Northern Cape can be considered as potential provincial priority areas.
Table 6.17 Air pollution impact potential scores for the District Municipalities in the
Northern Cape
Province District / Metropolitan Municipality Impact Score
Northern Cape Kgalagadi District Municipality 4
Northern Cape Pixley ka Seme District Municipality 4
Northern Cape Namaqwa District Municipality 4
Northern Cape Siyanda District Municipality 4
Northern Cape Frances Baard District Municipality 8
6.3.9 Western Cape
The City of Cape Town Metro has the highest population density, industrial impact and road
density in the province. The coastal fringes of the province are considered to be developed with
a predominantly rural interior. The industrial hub of Saldanha Bay heavily weights the West
Coast District Municipality rating, with the same applying to the Mossel Bay and George in the
Eden District Municipality. The districts surrounding the City of Cape Town Metro provide the
potential for the declaration of a potential provincial priority area. The Overberg District
Municipality to the east is not considered a potential priority area due to the limited air pollution
potential of this district. However, the western regions of the Cape Winelands (Stellenbosch and
Drakenstein Local Municipalities) and the southern region of the West Coast (Swartland Local
Municipality) border directly onto the City of Cape Town Metro. The topography of the area
(Cape Fold Mountains) may limit the cross-boundary impact but drainage through inter-
connecting valleys may impact on adjacent areas. Table 6.18 summarises the calculated impact
potential scores determined at the district / metropolitan and local municipality level. Figure
6.18 shows the extent of the proposed Cape Winelands / West Coast / Cape Town provincial
priority area.

115
Figure 6.18 Extent of the proposed Cape Winelands / West Coast / Cape Town
provincial priority area
Table 6.18 Air pollution impact potential scores for the municipalities in the proposed
Cape Winelands / West Coast / City of Cape Town provincial priority area
Province District / Metropolitan
Municipality
Local Municipality Impact
Score
Western Cape City of Cape Town n/a 22
Western Cape Cape Winelands Stellenbosch 11
Western Cape Cape Winelands Drakenstein 11
Western Cape West Coast Swartland 8
This area includes the City of Cape Town, the local municipalities of Stellenbosch and
Drakenstein in the Cape Winelands District Municipality and the local municipality of
Swartland in the West Coast District Municipality. While extensive ambient air quality
monitoring is taking place in the City of Cape Town Metro, limited ambient monitoring is
taking place in the Cape Winelands and West Coast District Municipalities. It is recommended
that a programme of ambient air quality monitoring takes place in the inter-connecting areas.

116
6.4 Local Government Implications
Table 24 of the National Framework provided a subjective assessment of the air quality in all
metropolitan and district municipalities of South Africa. The municipalities were rated as either;
“Acceptable” – generally good air quality; “Potentially Poor” – air quality may be poor at times
or deteriorating or “Poor” – ambient air quality standards regularly exceeded. This assessment
was based on limited ambient air quality monitoring data, where available, results of dispersion
modelling studies, strategic environmental impact assessments and other proxy information.
This original table listed all six metropolitan municipalities and 22 district municipalities,
however the Free State and portions of the Northern Cape were inadvertently excluded from the
table. Table 6.19 provides a corrected summary of six metros and 28 district municipalities. As
part of the revision to the National Framework this table has been expanded to identify the
specific local municipalities within the districts with poor or potentially poor air quality. In total,
48 local municipalities were identified. Table 6.1 also includes a revised assessment of the air
pollution potential of each of the local municipalities based on the results of this research. Areas
with an air pollution impact potential rating of ≤ 15 were deemed to have acceptable air quality,
a rating of 16 – 25 was deemed to be potentially poor, while a rating ≥ 26 was deemed to be
poor.
The revised air quality rating assessment saw the reclassification of 32 of the local
municipalities to lower ratings. Only one district municipality and one local municipality were
reclassified to a higher rating, having previously not being included in the summary. This
indicates that the preliminary assessment was conservative in nature. Based on the air pollution
impact potential assessment rating derived from this research, all six of the metropolitan
municipalities have poor air quality, 15 district municipalities and 21 local municipalities have
either poor or potentially poor air quality.

117
Table 6.19
Revised Table 24 of the National Framew
ork (after DEAT, 2007a)
Province
Metro / District Municipality
Local Municipality
Initial Air Q
uality Rating
(Table 24)
Revised Air Q
uality Rating
(This Research)
Eastern Cape
Nelson Mandela Bay Metro
n/a
Poor
Poor
Amathole DM
Buffalo City
Potentially Poor
Potentially Poor
Free State
Motheo DM
Mangaung
Potentially Poor
Acceptable
Lejweleputswa DM
Matjhabeng
Potentially Poor
Acceptable
Fezile Dabi DM
Metsimaholo
Poor
Acceptable
Gauteng
City of Johannesburg Metro
n/a
Poor
Poor
City of Tshwane Metro
n/a
Poor
Poor
Ekurhuleni Metro
n/a
Poor
Poor
West Rand DM
Randfontein
Potentially Poor
Potentially Poor
Westonaria
Potentially Poor
Potentially Poor
Mogale City
Poor
Potentially Poor
Merafong City
Potentially Poor
Acceptable
Sedibeng DM
Emfuleni
Poor
Poor
Midvaal
Poor
Acceptable
Lesedi
Poor
Acceptable
Metsweding DM
Kungwini
Potentially Poor
Acceptable
Nokeng tsa Taemane
Potentially Poor
Acceptable
KwaZulu-Natal
Ethekwini Metro
n/a
Poor
Poor
uMgungundlovu DM
The Msunduzi
Potentially Poor
Potentially Poor
Uthukela DM
Emnambithi-Ladysmith
Potentially Poor
Acceptable
Umtshezi
Potentially Poor
Acceptable
iLembe DM
eDondekusuka
Potentially Poor
Potentially Poor
KwaDukuza
Potentially Poor
Potentially Poor
Uthungulu DM
uMhlathuze
Poor
Potentially Poor
Amajuba DM
Newcastle
Potentially Poor
Potentially Poor
Ugu DM
Umdoni
Potentially Poor
Potentially Poor
Hibiscus Coast
Potentially Poor
Potentially Poor

118
Limpopo
Mopani DM
Ba-Phalaborwa
Potentially Poor
Acceptable
Capricorn DM
Polokwane
Potentially Poor
Potentially Poor
Waterberg DM
Lephalale
Potentially Poor
Acceptable
Greater Sekhukhune DM
Greater Tubatse
Potentially Poor
Acceptable
Vhembe DM
Thulamela
Acceptable
Potentially Poor
Mpumalanga
Ehlanzeni DM
Thaba Chweu
Potentially Poor
Acceptable
Mbombela
Potentially Poor
Potentially Poor
Umjindi
Potentially Poor
Acceptable
Gert Sibande DM
Msukaligwa
Poor
Acceptable
Pixley Ka Seme
Poor
Acceptable
Lekwa
Poor
Acceptable
Dipaleseng
Poor
Acceptable
Nkangala DM
Delmas
Poor
Acceptable
Emalahleni
Poor
Potentially Poor
Steve Tshwete
Poor
Potentially Poor
North-West
Bojanala Platinum DM
Madibeng
Potentially Poor
Potentially Poor
Rustenburg
Poor
Potentially Poor
Dr Kenneth Kaunda DM
City of Matlosana
Potentially Poor
Potentially Poor
Northern Cape
Kgalagadi DM
Gamgara
Potentially Poor
Acceptable
Siyanda DM
//Khara Hais
Potentially Poor
Acceptable
Frances Baard DM
Sol Plaatjie
Potentially Poor
Potentially Poor
Western Cape
City of Cape Town Metro
n/a
Poor
Poor
West Coast DM
Saldanha Bay
Poor
Acceptable
Cape Winelands DM
Drakenstein
Potentially Poor
Acceptable
Stellenbosch
Potentially Poor
Acceptable
Eden DM
Mossel Bay
Potentially Poor
Acceptable
George
Potentially Poor
Acceptable

119
6.5 Summary of the Implications
The revision of the boundaries of the existing national priority areas is deemed controversial as
the authorities in the VTAPA have developed an extensive air quality management plan that is
currently under implementation. The HPA is currently undertaking their baseline assessment,
including an extensive dispersion modelling study. The revision of the boundaries would require
extensive rework of the baseline assessments and air quality management planning initiatives,
with significant cost and time implications. Given the limited financial resources assigned to air
quality management in South Africa, the revision of the boundaries of these existing national
priority areas is not advisable at this time. In addition, this would merely delay the
implementation of the necessary interventions to improve the air quality in those areas where
ambient air quality standards are being exceeded. It is recommended that the revisions to the
boundaries are considered during the formal five-yearly review phase of the priority area
management plan.
As indicated in Section 6.1, to date no provincial priority areas have been declared. The
provincial priority areas presented in the Chapter above are proposed for consideration by the
provincial authorities. In many cases, additional ambient air quality monitoring and research
will be required to justify the declaration of these areas as provincial priority areas. One area
that warrants immediate consideration is the City of Johannesburg / City of Tshwane provincial
priority area. Both areas have ambient air quality monitoring which confirms the findings of this
research and the area contains over 10% of the total population of the country.
The district and local municipalities identified in Table 6.19 are those that should be prioritised
in terms of the roll out of the national ambient air quality monitoring network. The DEA has a
programme starting in 2010 for the expansion of the national ambient air quality monitoring
network. The objective of this network is to provide credible scientific information to guide air
quality management in the country. The municipalities identified in Table 6.19 should also be
prioritised in terms of assistance for the development of their air quality management plans.
This ensures that the limited financial and human resources assigned to air quality management
are deployed in those areas with the greatest need.

120
CHAPTER SEVEN
CONCLUSIONS AND RECOMMENDATIONS
7.1 Introduction
Air quality management in South Africa has been in a transitional phase since the partial entry
into effect of the AQA in September 2005. With full promulgation of the Act scheduled for 1
April 2010, the transition of the air quality management function from national to local
government will be complete. Concerns have been raised regarding the capacity of local
government to undertake this responsibility. The AQA sees the introduction of a number of new
air quality management tools, one of which is priority area management. This air quality
management tool has three strategic drivers. Firstly, it allows for the concentration of limited air
quality management capacity when dealing with acknowledged air pollution problem areas.
Secondly, it prescribes co-operative governance that may become problematic in areas where
cross boundary air pollution problems occur and finally, it allows for the application of holistic
air quality management methodologies, namely airshed air quality management. Unfortunately
the legislation, which is framework in nature, provides little guidance on the identification of the
boundaries of these areas.
The goal of this research was to develop a methodology for the delineation of the boundary of
an air quality management area in South Africa. The preliminary objective of the research was
to identify the specific criteria that should be considered when developing the methodology. A
review of the methodologies used internationally was undertaken, looking specifically at regions
and countries with similar effects-based air quality legislation. The review concluded that the
international practice regarding boundary determination was data intensive, relying heavily on
the results of ambient air quality monitoring and the results of dispersion modelling based on
comprehensive emissions inventories. Another commonality between the methodologies was
the use of administrative boundaries as the borders of air quality management areas. South
Africa has limited ambient air quality monitoring and there is no national emissions inventory
for criteria pollutants. In the absence of this information an alternative approach was required.
The next objective of the research was to identify or develop a proxy methodology for assessing
the impact of each of these criteria to be used in the boundary determination. The criteria
assessed as part of this research included, population density, emission criteria (industrial,
mining, transport and domestic), topography and administrative boundaries. A further objective
of the research was to combine all the criteria to produce a single indicator or value as to the air

121
pollution impact potential of the area under consideration. This methodology was then applied
in the South African context. The final objective of the research was to assess the results of the
application of the methodology on the regulatory framework proposed by the AQA, at the
national, provincial and local government levels.
7.2 Conclusions and Recommendations
The methodology has proved successful in the identification of areas with high air pollution
impact potential in South Africa. This has allowed for a review of the boundaries proclaimed for
the VTAPA and the HPA. In both cases significant revisions of the boundaries are
recommended, however due to the controversial nature of these recommendations, it is proposed
that these revisions are deferred until the five-yearly review phase of the priority area
management plan. The results indicated the need to proclaim an additional two national priority
areas. The first was the proposed Magaliesberg Priority Area, which covers the north-western
areas of Gauteng and the eastern areas of the North-West. This area combines the high density
residential, commercial and industrial areas of Gauteng with the high density mining and
industrial areas of the North-West. However, it is recommended that further ambient air quality
monitoring and research is required prior to the proclamation of this national priority area. The
second new national priority area proposed is the Waterberg Priority Area. This proclamation is
a proactive declaration based on the proposed industrial developments earmarked for this area.
Due to extensive coal reserves in the area, the development of additional coal-fired power
generation, a coal to liquid facility and other coal beneficiation projects are currently under
consideration.
The research has identified six potential provincial priority areas. The provincial priority areas
are associated with the major metropolitan centres in the country and their adjacent district
municipalities. All of the proposed provincial priority areas, with the exception of the one
proposed in Gauteng, require further ambient air quality monitoring and research prior to their
proclamation. It is recommended that the City of Johannesburg / City of Tshwane provincial
priority area be considered for immediate declaration.
The review of the district and local municipalities identified in Table 24 of the National
Framework highlighted the conservative nature of the initial assessment. The review amended
the classification of 33 of the local municipalities, with 32 being reclassified downwards and
only one being reclassified upwards. This also highlighted the subjective nature of the initial

122
assessment. It is recommended that the local municipalities identified in revised section of Table
6.19 be prioritised in terms of the roll out of the national ambient air quality monitoring
network. This programme commences in 2010 and aims to expand the national ambient air
quality monitoring network to high air pollution impact potential areas that currently have no or
limited ambient air quality monitoring taking place. The objective of this network is to provide
credible scientific information to guide air quality management in the country. It is also
recommended that the municipalities identified in Table 6.1 be prioritised in terms of assistance
for the development of their air quality management plans. This ensures that the limited
financial and human resources assigned to air quality management are deployed in those areas
with the greatest need.
7.3 Looking Forward
The methodology proposed by this research is considered part of an iterative approach to air
quality management in South Africa. In order to fulfil the Constitutional right to an environment
that is not harmful to health and well-being, immediate action is required to identify areas with
potentially poor or poor air quality. This research proposes a methodology to identify areas with
compromised air quality, in the absence of conventional methodologies. This allows for the
limited air quality resources in South Africa to be deployed in those areas with the greatest
need. As the national ambient air quality management network develops and long term ambient
air quality monitoring records come available, this methodology will be replaced by those
applied internationally. Phase II of the SAAQIS will see the development of the national
emissions inventory which will also allow for the application of dispersion modelling as used in
international methodologies. Phase II will commence in 2010 and is scheduled for completion
by the end of 2012. This methodology is also suitable for application in other countries where
long term ambient air quality data and comprehensive emission inventories are unavailable.

123
References
Amaponsah-DaCosta F., 1997. Cost effective strategies for dust control in an open cast coal mine, Unpublished M.Sc. thesis, University of Witwatersrand, Johannesburg
Annegarn H.J. and Scorgie Y, 1996. Desktop study to design an air quality management
strategy for the Vaal Triangle, Final Report on the Vaal Triangle Intervention Project Report
SRCNS 96.09, Department of Environmental Affairs and Tourism, Pretoria.
Annegarn H.J and Sithole J.S., 1999. Soweto Air Monitoring – SAM Trend Analysis of
Particulate Pollution 1992 – 1999. Supplementary Report to the 1998 Annual Report, Report
AER 99.163, SSOW, 10 January 1999.
Barnett C. and Scott D., 2007. The Reach of Citizenship: Locating the politics of industrial air
pollution in Durban and beyond, Urban Forum, 18(4), 289 – 309.
Beattie C.I., Longhurst J.W.S. and Woodfield N.K., 2000. Air quality management: challenges
and solutions in delivering air quality action plans, Energy and Environment, 11(6), 729 – 747.
Beattie C.I., Longhurst J.W.S. and Woodfield N.K., 2001. Air quality management: evolution of
policy and practice in the UK as exemplified by the experience of English local government,
Atmospheric Environment, 35, 1479 – 1490.
Bluett J., 2006. The state of the PM10 monitoring network within NES airsheds: Benchmark
year 2006, NIWA Client Report CHC2006-146, National Institute of Water and Atmospheric
Research Ltd, Christchurch.
Boegman, 1979. The Development of a National Policy for the Control of Air Pollution in
South Africa, Thesis submitted in fulfilment of the requirements of the degree of Doctor of Philosphy, University of Witwatersrand, Johannesburg
Brimblecombe P., 2005. The Globalization of Local Air Pollution, Globalizations, 2(3), 429 –
441.
Brimblecombe P. and Cashmore M., 2002. Air Pollution Perceptions and Policy, Clean Air and
Environment Quality, 36(4), 31- 34.
Brown A.S. and Brown G.G., 1929. The South and East African Year Book and Guide for
1929, Marston & Company Ltd, London.
Brunekreef B. and Holgate S.T., 2002. Air pollution and health, The Lancet, 360, 1233 – 1242.
Cavanagh J.E., 2006. Potential of vegetation to mitigate road-generated air pollution: Part 1 –
Review of background information, Landcare Research Contract Report: LC0506/00xx,
Landcare Research, Lincoln.
Ciuk J., 2002. South Australian National Pollutant Inventory – Summary Report, Adelaide and
Regional Airsheds Air Emission Study 1998 – 1999, Environment Protection Authority – South Australia, Adelaide

124
Cosijn C. and Tyson P.D., 1996. Stable discontinuities in the atmosphere over South Africa, South African Journal of Science, 92, 381 – 386.
Commonwealth of Australia, 1992. Intergovernmental Agreement on the Environment, Available from http://www.environment.gov.au/esd/national/igae/index.html (accessed
04.04.2010)
Council for the Environment, 1994. A National Environmental Management System for South
Africa, Department of Environmental Affairs and Tourism, Pretoria.
DEA, 2009a. State of Air Report 2005 – A report on the state of the air in South Africa,
Department of Environmental Affairs, Pretoria.
DEA, 2010. Air Quality Management Plan for the Highveld Priority Area – Air Quality
Baseline Assessment for the Highveld Priority Area, Draft Document, Chief Directorate: Air
Quality Management and Climate Change, Pretoria.
DEAT, 1997. White Paper on Environmental Management Policy for South Africa, Available
from http://www.environment.gov.za/PolLeg/WhitePapers/EnvMgmt.htm (accessed 26.11.2009)
DEAT, 2000. White Paper on Integrated Pollution and Waste Management for South Africa,
Government Gazette No 209783, Notice No. 227, 17 March 2000, Pretoria.
DEAT, 2002. The National Air Quality Management Programme (Phase 1) – South Africa, Draft Project Document, Directorate: Air Quality Management, Pretoria
DEAT, 2004. Comments and Response Database to the National Environmental Management Air Quality Bill No. 62 of 2003, Unpublished report, Department of Environmental Affairs and
Tourism, Pretoria.
DEAT, 2006a. The Air Quality Act (AQA) Companion – Revision 1, Unpublished report,
Department of Environmental Affairs and Tourism, Pretoria.
DEAT, 2006b. APPA Registration Certificate Database Report, Report prepared as part of the
Atmospheric Pollution Prevention Act (APPA) Registration Certificate Review Project,
Department of Environmental Affairs and Tourism, Pretoria
DEAT, 2006c. Prioritisation of Registration Certificates for Review as part of the Atmospheric
Pollution Prevention Act (APPA) Registration Certificate Review Project, Final Draft
Document, Chief Directorate: Air Quality Management and Climate Change, Pretoria.
DEAT, 2007a. The 2007 National Framework for Air Quality Management in the Republic of
South Africa, Department of Environmental Affairs and Tourism, Pretoria
DEAT, 2007b. Vaal Triangle Priority Area Air Quality Management Plan – Baseline
Characterisation, Final Draft Document, Chief Directorate: Air Quality Management and Climate Change, Pretoria.
DEAT, 2008. Manual for Air Quality Management Planning in South Africa, Department of Environmental Affairs and Tourism Air Quality Management Publication, Series C – The
Governance Information Series, Book 3, Pretoria.

125
DEAT, 2009a. A Baseline Audit, Assessment and Status Report on Government’s Current Ambient Air Quality Monitoring Activities, Report prepared for the Department of
Environmental Affairs and Tourism, Ecoserv Report Q139, Pretoria.
DEAT, 2009b. APPA Registration Certificate Database, Available from
http://www.environment.gov.za/appa/apparegcertificate/login.aspx (Accessed 01.12.2009)
De Leeuw F.A.A.M. and Vixseboxse E., 2008. Reporting on ambient air quality assessment -
Preliminary results for 2007, European Topic Centre on Air and Climate Change, Bilthoven.
Department of the Environment, Scottish Office, Welsh Office, 1997. The United Kingdom
National Air Quality Strategy, CM 3587, The Stationery Office Ltd., London
Department of Environment, Transport and the Regions (DETR), National Assembly for Wales,
Scottish Executive, Department of the Environment for Northern Ireland, 2000. The Air Quality
Strategy for England, Scotland, Wales and Northern Ireland: Working Together for Clean Air, The Stationery Office Ltd., London.
Department for Environment, Food and Rural Affairs (Defra), 2007. The Air Quality Strategy for England, Scotland and Northern Ireland, Volume 1, The Stationery Office Ltd., London
Diab R.D., 1975. Stability and mixing layer characteristics over southern-Africa, Unpublished
MSc Thesis, University of Natal, Durban
Diab R.D, Prause A. and Bencharif H., 2002. Analysis of SO2 in the South Durban Industrial Basin, South African Journal of Science, 98, 543 – 546.
DME, 2006. Operating mines and quarries and mineral processing plants in the Republic of South Africa, 2006, Report issued by the Department of Minerals and Energy, Directorate –
Mineral Economic, Pretoria
Dockery D.W., Pope C.A., Xu X., Spengler J.D., Ware J.H., Fay M.E., Ferris B.G. and Speizer
F.E., 1993. An association between air pollution and mortality in six US cities, The New
England Journal of Medicine, 329 (24), 1753 – 1759.
DWA, 2009. The South African 1: 500 000 river coverage, Resource Quality Services,
Department of Water Affairs, Available from
http://www.dwaf.gov.za/iwqs/gis.data/river/rivs500k.html (accessed on 14 December 2009)
EC, 1996. European Council (EC) Directive 96/61/EC of 24 September 1996 concerning
integrated pollution prevention and control, Official Journal No. L 257, 10.10.1996, p 0026 – 0040, Brussels
EC, 2001. European Council (EC) Directive 2001/81/EC of 23 October 2001 on national
emission ceilings for certain atmospheric pollutants, Official Journal No. L 309, 27.11.2001, p.
22 – 30, Brussels
EC, 2003. Guidance on Assessment under the EU Air Quality Directives, Report by the
Working Group on Implementation, Brussels.

126
EC, 2004. Assessment of the Effectiveness of European Air Quality Policies and Measures, Final Report on Task 3.2: Case Studies Comparing the EU Experience with the Experience of
the USA and Other Countries, Case Study 2: Comparison of the EU and US air quality
standards and planning requirements, B4-3040/2003/365967/MAR/C1, Brussels
EEA, 2004. European Environment Agency (EEA) Signals 2004: A European Environment
Agency Update on Selected Issues, Office of the Official Publications of the European
Communities, Copenhagen.
EEC, 1980. European Economic Council (EEC) Directive 80/779/EEC of 15 July 1980 on air
quality limit values and guideline values for sulphur dioxide and suspended particulates,
Official Journal No. L 229, 30.8.1980, p. 30, Brussels.
EEC, 1982. European Economic Council (EEC) Directive 82/884/EEC of 3 December 1982 on
a limit value for lead in the air, Official Journal No. L 378, 31.12.1982, p. 0015 – 0018,
Brussels.
EEC, 1985. European Economic Council (EEC) Directive 85/203/EEC of 7 March 1985 on air
quality standards for nitrogen dioxide, Official Journal No. L 087, 27.3.1985, p. 0001 – 0007, Brussels.
Ekurhuleni Metropolitan Municipality (EMM), 2004. Air quality management plan for the
Ekurhuleni Metropolitan Municipality, Plan compiled on behalf of the Department of
Environment and Tourism, Report Number APP/04/EMM-02b, Draft – Final Report.
Elliston G., 1948. Darkening Africa: The Problem of Smoke Nuisance, S.A. Engineer, June
1948, pg 23 – 26, Johannesburg
Elliston G., 1950. Tolerance of Atmospheric Pollution Inflicts Injuries on the Community,
Municipal Affairs, February 1950, pg 15 – 18.
Elsom D.M., 1992. Atmospheric Pollution: A Global Problem, 2nd Edition, Blackwell
Publishers, Oxford.
Elsom D.M., 1999. Development and Implementation of Strategic Frameworks for Air Quality
Management in the UK and the European Community, Journal of Environmental Planning
and Management, 42(1), 103 – 121.
Elsom D.M. and Longhurst J.W.S. (eds), 2004. Regional and Local Aspects of Air Quality
Management, WIT Press, Southampton.
Emmott N., 1996. A Fitting Atmosphere for a Rainbow Nation, Essay submitted in part
fulfilment of the requirements of the LLM Degree, University of London, London
ERC, 2007. Long Term Mitigation Scenarios: Technical Report, Report prepared for the
Department of Environment Affairs and Tourism, Pretoria.
Eskom, 2008. Energy Efficiency and Demand Side Management Programme – 2008, Issued by
Eskom Demand Side Management, Megawatt Park.
eThekwini Municipality, 2006. South Durban Health Study, Multipoint Plan Project 4 : Health
Study and Health Risk Assessment, Final Project Report, Durban.

127
Evelyn J., 1661. Fumifugium, or, the Inconvenience of the Aer, and Smoke of London
Dissipated, National Society for Clean Air, Brighton, reprinted 1976.
Fenger J., 2002. Urban air quality, In Astin J., Brimblecombe P. and Sturges W. (eds), Air Pollution Science for the 21
st Century, Elsevier Science Limited, Oxford.
Fisher G., King D., Bluett J., Gimson N., Wilton E., Xie S., Faulk M., Cudmore R., Kingham S.,
Sturman A. and Ladd M., 2005. Defining New Zealand’s Airsheds: Local Air Management
Areas, Foundation for Research, Science and Technology Programme, Contract Reference
C01X0405, Wellington.
Garstang M., Tyson P.D., Swap R., Edwards M., Kållberg P. and Lindesay J.A., 1996.
Horizontal and vertical transport of air over southern Africa, Journal of Geophysical
Research, 101, D19, 23721 – 23736.
Glazewski, J., 2000. Environmental Law in South Africa, Butterworths, Durban
Goldenman G. and Levina E., 2004. Comparison of the EU and US Air Quality Standards and
Planning Requirements, Project for the European Commission’s DG Environment, Directorate C, Contract B4-3040/2003/365967/MAR/C1, Washington DC.
Hays M.D., Smith N.D., Kinsey J., Dong Y. and Kariher P., 2003. Polycyclic aromatic
hydrocarbon size distributions in aerosols from appliances of residential wood combustion as
determined by direct thermal desorption – GC/MS, Journal of Aerosol Science, 34(8), pp 1061
– 1084.
Held G., Gore B.J., Surridge A.D., Tosen G.R., Turner C.R. and Walmsley R.D. (eds), 1996.
Air pollution and its impacts on the South African Highveld, Environmental Scientific Association, Cleveland, South Africa.
HM Government, 1906. Alkali and Works Regulation Act, Available from http://www.opsi.gov.uk/acts/acts1906a (accessed 6 April 2009)
HM Government, 1990. This Common Inheritance, CM 1200, Her Majesty’s Stationery Office,
London.
HM Government, 1995. Environment Act 1995, Part IV Chapter 25, The Stationery Office Ltd.,
London.
Ireland F.E., Bryce D.J. and Megaw W.J., 1979. The philosophy of control of air pollution in
the United Kingdom, Philosophical Transactions of the Royal Society of London, Series A: Mathematical and Physical Sciences 290, 376, 625 – 637.
Jacobson M.Z., 2002. Atmospheric Pollution: History, Science and Regulation, Cambridge
University Press, Cambridge.
Josipovic M., 2009. Acidic deposition emanating from the South African Highveld – A critical levels and critical loads assessment, Unpublished PhD thesis, University of Johannesburg,
Johannesburg.
Khare M. and Kansal A., 2004. Sectoral analysis of air pollution control in Delhi, in Regional
and Local Aspects of Air Quality Management, Elsom D.M. and Longhurst J.W.S. (eds),
WIT Press, Southampton.

128
Longhurst J.W.S, Irwin J.G., Chatterton T.J., Hayes E.T., Leksmono N.S. and Symons J.K.,
2009. The development of effects-based air quality management regimes, Atmospheric
Environment, 43, 64 – 78.
Longley I. and Olivares G., 2008. A review of regional and natural background PM10 in New
Zealand, NIWA Client Report AKL2008-062, National Institute of Water and Atmospheric
Research Ltd, Auckland.
Longley I., Olivares G., Khan B. and Zawar-Reza P., 2008. The determinants of levels of
secondary particulate pollution and nitrogen dioxide in urban New Zealand – Part 1, NIWA
Client Report AKL2008-053, National Institute of Water and Atmospheric Research Ltd,
Auckland.
McGrory D.P., 1990. Air pollution legislation in the US and the European Community,
European Law Review, 15, 298 – 316.
Ministry for the Environment, 2009a. Roles and Responsibilities, Available from
http://www.mfe.govt.nz/issues/air/responsibilities.html (accessed 19 November 2009)
Ministry for the Environment, 2009b. National environmental standards for air quality,
Available from http://www.mfe.govt.nz/laws/standards/air-quality-standards.html (accessed 19
November 2009)
Municipal Demarcation Board, 2009. Municipal Demarcation of South Africa, Available from http://www.demarcation.org.za, Accessed on 21.11.2009.
National Environment Protection Measure (NEPM), 1998. National environment protection measure for ambient air quality, National Environment Protection Council, Commonwealth of
Australia, Canberra.
National Environment Protection Measure (NEPM), 2001. National environment protection
(ambient air quality) measure, Technical Paper 2, Selection of Regions, National Environment
Protection Council, Commonwealth of Australia, Canberra.
National Research Council of the National Academies (NRC), 2004. Air Quality Management
in the United States, The National Academies Press, Washington.
National Society for Clean Air and Environmental Protection (NSCA), 2000. Air Quality
Management Areas: Turning Reviews into Action, NSCA, Brighton.
Oosthuizen M.A., 2004. The respiratory health status of adults who spent their developing years
in a polluted area in South Africa, Unpublished MMedSc Dissertation, University of KwaZulu-
Natal, Durban.
Pauw C.J., Friedl A., Holm D., John J., Kornelius G., Oosthuizen R. and van Niekerk A.S.,
2008. Air pollution in dense, low-income settlements in South Africa – Issue 1, Report to The Royal Danish Embassy and the Department of Environmental Affairs and Tourism, Pretoria.
Petrie J.G, Burns Y.M. and Bray W., 1992. Air Pollution, Chapter 17 in Environmental
Management in South Africa, editors Fuggle R.F. and Rabie M.A., Juta & Co, Cape Town.

129
Piketh S., Burger R., Broccardo S., Bhailal S., McKechnie C and Ncipha X, 2006. Airborne measurements of air pollutants over South Africa, Joint Department of Environmental
Affairs and Tourism / University of the Witwatersrand / South African Weather Service Project,
Pretoria
Pope III C.A., Thun M.J., Namboodiri M.M., Dockery D.W., Evans J.S., Speizer F.E. and Heath
J.C.W., 1995. Particulate air pollution as a predictor of mortality in a prospective study of US
adults, American Journal of Respiratory & Critical Care Medicine, 151 (3), 669 – 674.
Preston-Whyte R.A., 1980. Climate of Durban, Natal Town and Regional Planning Reports,
Volume 44, Pietermaritzburg.
Quass F.W., 1950. Atmospheric Pollution and Smoke Control, Commerce and Industry, March 1950, pg 267 – 274, Pretoria.
Quass F.W., 1951, Eliminating the Smoke Nuisance, SA Engineer, January 1951, pg 20 – 23, Johannesburg.
Quass F.W., 1953, Atmospheric Pollution and Smoke Control in the Union of South Africa, Air Repair, Vol 2(4).
Republic of South Africa Government, 1996. Constitution of the Republic of South Africa, Act
No. 108 of 1996, Pretoria
Republic of South Africa Government, 1998. National Environmental Management Act, Act No. 107 of 1998, Pretoria
Republic of South Africa Government, 2005. National Environmental Management: Air Quality Act, Act No. 39 of 2004, Pretoria.
Scorgie Y., Burger L., Annegarn H.J. and Kneen M.A., 2004a. Study to examine the potential socio-economic impact of measures to reduce air pollution from combustion, Final Report, Fund
for Research into Industrial Development Growth and Equity (FRIDGE), Department of Trade
and Industry, Pretoria.
Scorgie Y., Burger L., Annegarn H.J. and Kneen M.A., 2004b. Study to examine the potential
socio-economic impact of measures to reduce air pollution from combustion, Part 1 Report:
Definition of air pollutants associated with combustion processes, Fund for Research into Industrial Development Growth and Equity (FRIDGE), Department of Trade and Industry,
Pretoria.
Scorgie Y., 2005. Implementing international “good practice” air quality management in the
South African context, Presentation to the KwaZulu Natal Branch of the National Association
for Clean Air, 4 August 2005, Hilton Hotel, Durban.
Scorgie Y., 2008. Air Quality and Regulation, Available from
http://www.naca.org.za/index.php?option=com_content&;task=view&id=39&Itemid=46 (accessed 20.11.2009).
Scott G.M., Annegarn H and Kneen M., 2005. Air Pollution Know No Boundaries: Defining air catchment area and making sense of physical and political boundaries in air quality
management, IQPC Conference on Implementing the Air Quality Act, 24 – 25 October 2005,
Kyalami.

130
Smith K.R., 1987. Biofuels, air pollution and health, Plenum Press, New York.
Statistics South Africa (StatsSA), 2004. Census 2001: Primary tables South Africa: Census ’96 and 2001 compared (Report No. 03/02/04 – 2001), Technical Report, Pretoria.
Sturman A. and Zawar-Reza P., 2002. Application of back-trajectory techniques to the
delimitation of urban clean air zones, Atmospheric Environment, 36, 3339 – 3350.
Swan P. 2009. Findings of the car parc study and how this relates to vehicle emissions and
current and future fuel requirements, SAPIA Cleaner Fuels Seminar, Swan Lake Lodge,
Centurion, 28 October 2009.
Swap R.J, Annegarn H.J., Suttles J.T., Haywood J., Helmlinger M.C., Hely C., Hobbs P.V.,
Holben B.N., Ji J., King M.D., Landmann T., Maenhaut W., Otter L., Pak B., Piketh S.J.,
Platnick S., Privette J., Roy D., Thompson A.M., Ward D. and Yokelson R., 2002. The Southern African Regional Science Initiative (SAFARI 2000): overview of the dry season field
campaign, South African Journal of Science, 98 (4), 125 – 131.
Swap R., Garstang M., Macko S.A., Tyson P.D., Maenhaut W., Artaxo P., Kållberg P. and
Talbot R., 1996. The long-range transport of southern African aerosols to the tropical South
Atlantic, Journal of Geophysical Research, 101, D19, 23777 – 23791.
Terblanche A.P.S., Opperman L., Nel C.M.E., Reinach S.G., Tosen G. and Cadman A., 1992.
Preliminary results of exposure measurements and health effects of the Vaal Triangle Air Pollution Health Study, South African Medical Journal, 81, 550 – 556.
Thompson R.J. and Visser A.T., 2000. The functional design of surface mine haul roads, Journal of the South African Institute of Mining and Metallurgy, 100 (3), 169 – 180.
United Nations, 2009. United Nations Statistics Division and Social Statistics, Available from http://unstats.un.org/unsd/demographics/sconcerns/densurb/default.htm (accessed on 14
December 2009)
United States – Environmental Protection Agency (US-EPA), 2009. The Green Book Non-
Attainment Areas for Criteria Pollutants, Available from:
http://www.epa.gov/air/oaqps/greenbk/ (accessed 18 November 2009)
United States – Environmental Protection Agency (US-EPA), 2004. Air CHIEF CD-Rom, EPA
454/C-04-001, Emission Factor and Inventory Group, Version 11.
Val Aalst R., Edwards L., Pulles T., De Saeger E., Tombrou M. and Tǿnnesen D., 1998.
Guidance report on preliminary assessment under EC air quality directives, Technical report No
11, Brussels.
Vaughan R., 2009. NO2 approach to time extension, Presentation given at Defra Workshop – Air Quality and Industrial Pollution, 12 March 2009, London.
Vixseboxse E. and De Leeuw F.A.A.M., 2007. 2005 Annual Member States reporting on ambient air quality assessment, ETC/ACC Technical Paper 2007/4, European Topic Centre on
Air and Climate Change, Bilthoven.

131
Vixseboxse E. and De Leeuw F.A.A.M., 2008. 2006 Annual Member States reporting on ambient air quality assessment, ETC/ACC Technical Paper 2008/2, European Topic Centre on
Air and Climate Change, Bilthoven.
Walton W., Carmichael K. and Hunter C., 2001. Local Air Pollution Control in the USA:
Potential Lessons for the Introduction of Air Quality Management Areas and Action Plans in the
UK, International Planning Studies, 6 (3), 311 – 333.
Wicking-Baird M.C., de Villiers M.G. and Dutkiewicz R.K., 1997. Cape Town Brown Haze
Study, Energy Research Institute Report No. Gen 182, University of Cape Town, Cape Town.
Winkler H., Spalding-Fecher R., Tyani L. And Matibe K., 2002. Cost-benefit analysis of energy
efficiency in urban low cost housing, Development Southern Africa, 19 (5), pp 593 – 614.
Woodfield N.K., Longhurst J.W.S, Beattie C.I. and Laxen D.P.H., 2002. Designating air quality
management areas (AQMAs) in the UK: Implications for securing UK air quality objectives, Water, Air and Soil Pollution: Focus, 2, 677 – 688.
Woodfield N.K., Longhurst J.W.S., Beattie C.I. and Laxen D.P.H., 2003. Judging the Risk of Exceedence: local authority decision-making for air quality management area designation,
Local Environment, 8 (4), 423 – 435.
Zunckel M., 1999. Dry deposition of sulphur over eastern South Africa, Atmospheric
Environment, 33, 3515 – 3529.
Zunckel M., Koosialee A., Yarwood G., Maure G., Venjonoka K., van Tienhoven A.M. and
Otter L., 2006a. Modelled surface ozone over southern Africa during the Cross Border Air
Pollution Impact Assessment Project, Environmental Modelling & Software, 21, 911 – 924.
Zunckel M., John J. and Naidoo M., 2006b, The National Air Quality Management Programme
Phase II, Output C1: Air Quality Information Review, Report compiled for the Department of Environmental Affairs and Tourism, Pretoria.

132
Appendix 1 – Table 24 – National Framework
Note – The original Table 24 only identified air pollution hot spots areas at the District Municipality level. It must also be noted that the original table omitted the Free State. Table
6.19 provides a corrected listing and provides detail at the local municipality level.

133
Appendix 2 – Table of Results

Province
Metro / District
Industry Rating
Mines
Pop Density
Domestic
Final Rating
Eastern Cape
Alfred Nzo
12
24
9
Eastern Cape
Ukhahlamba DM
11
12
5
Eastern Cape
Chris Hani DM
11
15
8
Eastern Cape
O.R. Tambo DM
11
36
11
Eastern Cape
Cacadu DM
11
12
5
Eastern Cape
Amatole DM
23
26
13
Eastern Cape
Nelson Mandela Bay Metro
56
75
23
Free State
Xhariep DM
11
11
4
Free State
Thabo Mofutsanyane DM
21
13
7
Free State
Lejweleputswa DM
22
12
7
Free State
Motheo DM
22
22
8
Free State
Fezile Dabi DM
32
12
8
Gauteng
Metsweding DM
24
11
8
Gauteng
West Rand DM
45
35
17
Gauteng
Sedibeng DM
54
34
16
Gauteng
City of Johannesburg Metro
66
85
25
Gauteng
City of Tshwane Metro
66
75
24
Gauteng
Ekurhuleni Metro
66
86
26
KwaZulu NatalUmkhanyakude DM
12
15
9
KwaZulu NatalSisonke DM
11
14
7
KwaZulu NatalUmzinyathi DM
12
24
9
KwaZulu NatalZululand DM
12
25
10
KwaZulu NatalUthukela DM
12
25
10
KwaZulu NatalAmajuba DM
23
25
12
KwaZulu NatalUthungulu DM
34
36
16
KwaZulu NatalUgu DM
25
36
16
KwaZulu NataliLembe DM
24
36
15
KwaZulu NataluMgungundlovu DM
44
36
17
KwaZulu NatalEthekwini Metro
66
85
25
Limpopo
Capricorn DM
13
25
11
Limpopo
Greater Sekhukhune
13
26
12
Limpopo
Vhembe DM
22
25
11
Limpopo
Waterberg DM
21
12
6
Limpopo
Mopani DM
24
25
13
Mpumalanga
Ehlanzeni DM
54
25
16
Mpumalanga
Gert Sibande DM
52
15
13

Mpumalanga
Nkangala DM
54
26
17
North W
est
Ngaka Modiri Molema DM
22
13
8
North W
est
Dr Ruth Segomotsi Mompati DM
11
12
5
North W
est
Dr Kenneth Kaunda DM
33
12
9
North W
est
Bojanala Platinum DM
54
25
16
Northern CapeKgalagadi DM
11
11
4
Northern CapePixley ka Seme DM
11
11
4
Northern CapeNamakwa DM
11
11
4
Northern CapeSiyanda DM
11
11
4
Northern CapeFrances Baard DM
14
12
8
Western Cape
Central Karoo DM
11
11
4
Western Cape
Overberg DM
12
11
5
Western Cape
West Coast DM
22
11
6
Western Cape
Eden DM
32
12
8
Western Cape
Cape W
inelands DM
32
12
8
Western Cape
City of Cape Town
66
82
22

Province
District Municipalities
Local Municipalities
Pop DensityIndustry Rating
Mines
Domestic Rating
Final Rating
Ca
md
eb
oo
11
21
5
Blu
e C
ran
e R
ou
te1
12
15
Ma
ka
na
11
31
6
Ba
via
an
s1
11
14
Su
nd
ay's
Riv
er
11
11
4
Nd
lam
be
11
52
9
Ikw
ezi
11
21
5
Ko
ug
a1
15
18
Ko
u K
am
ma
11
11
4
Mb
ash
e2
11
61
0
Bu
ffa
lo C
ity
52
66
19
Am
ah
lati
11
33
8
Gre
at
Ke
i1
13
27
Mn
qu
ma
21
36
12
Mg
qu
sh
wa
11
14
7
Nxu
ba
11
11
4
Nko
nko
be
11
33
8
Inxu
ba
Ye
the
mb
a1
12
15
Tso
lwa
na
11
21
5
Inkw
an
ca
11
11
4
Lu
kh
an
ji1
13
27
Em
ala
hle
ni
11
13
6
Sa
kh
isiz
we
11
13
6
En
gco
bo
21
14
8
Ints
ika
Ye
thu
21
14
8
Elu
nd
ini
11
32
7
Se
nq
u1
11
25
Ga
rie
p1
11
14
Ma
lets
wa
i1
12
15
Mb
iza
na
31
16
11
Ng
qu
za
31
16
11
Nta
ba
nku
lu2
11
59
Po
rt S
t Jo
hn
s3
11
61
1
Mh
lon
tlo
21
14
8
Kin
g S
ab
ata
Da
lind
ye
bo
3
11
71
2
Nya
nd
en
i3
13
61
3
Ch
ris H
an
i
Ukh
ah
lam
ba
Ca
ca
du
Am
ath
ole
Ea
ste
rn C
ap
e
OR
Ta
mb
o

Um
zim
vu
bu
21
16
10
Ma
tatie
le2
14
41
1
Ne
lso
n M
an
de
la B
ay M
etr
on
/a6
56
72
4
Le
tse
we
ng
11
21
5
Mo
ho
ka
re1
11
14
Ko
pa
no
ng
11
11
4
Na
led
i1
11
14
Ma
nts
op
a1
11
14
Ma
ng
au
ng
32
43
12
Ma
silo
nya
na
11
21
5
To
ko
log
o1
12
15
Tsw
elo
pe
le1
12
15
Na
la1
11
14
Ma
tjh
ab
en
g2
25
21
1
Se
tso
to1
12
26
Dih
lab
en
g1
13
16
Ma
ulti a
Ph
ofo
ng
21
34
10
Ph
um
ele
la1
11
14
Nke
toa
na
11
11
4
Mo
qh
aka
11
21
5
Ng
wa
the
11
21
5
Me
tsim
ah
olo
22
53
12
Ma
fub
e1
11
14
Em
fule
ni
64
66
22
Le
se
di
11
12
5
Mid
va
al
12
31
7
Ku
ng
win
i1
25
19
No
ke
ng
tsa
Ta
em
an
e1
11
14
Ra
nd
fon
tein
41
63
14
We
sto
na
ria
41
64
15
Mo
ga
le C
ity
42
65
17
Me
rafo
ng
City
31
54
13
Eku
rhu
len
i M
etr
o7
66
72
6
City o
f Jo
ha
nn
esb
urg
Me
tro
76
67
26
City o
f T
sh
wa
ne
Me
tro
66
67
25
Vu
lam
eh
lo2
11
59
uM
do
ni
51
66
18
Fre
e S
tate
Ga
ute
ng
Se
dib
en
g
Me
tsw
ed
ing
Xh
arie
p
Mo
the
o
We
st
Ra
nd
Alfre
d N
zo
Th
ab
o M
ofu
tsa
nya
ne
Fe
zile
Da
bi
Le
jwe
lep
uts
wa
Ug
u

uM
uziw
ab
an
tu2
11
59
Hib
iscu
s C
oa
st
51
66
18
Ezin
qo
len
i2
15
61
4
Um
zu
mb
e4
11
61
2
uM
sh
wa
thi
21
14
8
Ric
hm
on
d2
11
37
Th
e M
su
nd
uzi
63
66
21
Mkh
am
ba
thin
i2
15
41
2
Imp
en
dle
11
12
5
Mp
ofa
na
11
11
4
uM
ng
en
i1
13
27
Okh
ah
lam
ba
11
13
6
Em
na
mb
ith
i-L
ad
ysm
ith
21
32
8
Ind
aka
31
16
11
Inb
ab
aza
ne
31
16
11
Um
tsh
ezi
11
32
7
En
du
me
ni
11
51
8
Nq
uth
u2
13
41
0
Um
vo
ti1
11
25
Msin
ga
21
14
8
Ne
wca
stle
42
56
17
eM
ad
lan
ge
ni
11
21
5
Da
nn
ha
use
r2
13
51
1
uP
ho
ng
olo
11
12
5
Ab
aq
ulu
si
11
42
8
eD
um
be
11
33
8
Ulu
nd
i2
13
41
0
No
ng
om
a2
11
59
Um
hla
bu
ya
ling
an
a1
11
36
Th
e B
ig F
ive
Fa
lse
Ba
y1
11
25
Jo
zin
i2
13
41
0
Hla
bis
a3
15
61
5
Mtu
ba
tub
a2
11
26
Mb
on
am
bi
21
44
11
Nka
nd
la2
11
48
uM
hla
thu
ze
52
64
17
Nta
mb
an
an
a2
11
59
uT
hu
ng
ulu
Kw
aZ
ulu
Na
tal
Um
zin
ya
thi
Am
aju
ba
Zu
lula
nd
Um
kh
an
ya
ku
de
Um
gu
ng
un
dlo
vu
Uth
uke
la

Um
lala
zi
21
35
11
Mto
nja
ne
ni
11
13
6
Nd
we
dw
e3
11
61
1
Ma
ph
um
ulo
31
16
11
Th
e K
wa
Du
ku
za
51
63
15
eD
on
da
ku
su
ka
41
56
16
Um
zim
ku
lu1
11
14
Ing
we
21
13
7
Kw
a S
an
i1
11
14
Ub
uh
leb
ezw
e2
13
41
0
Gre
ate
r K
oksta
d1
12
26
eT
he
kw
ini M
etr
o
76
67
26
Ma
rule
ng
11
12
5
Gre
ate
r G
iya
ni
21
35
11
Gre
ate
r T
za
ne
en
31
56
15
Ba
-Ph
ala
bo
rwa
11
52
9
Gre
ate
r L
eta
ba
31
46
14
Mu
sin
a1
12
15
Th
ula
me
la4
15
71
7
Ma
kh
ad
o2
13
39
Mu
tale
11
12
5
Blo
ub
erg
11
12
5
Mo
lem
ole
11
12
5
Po
lokw
an
e3
15
61
5
Ag
an
an
g2
11
59
Le
pe
le-N
ku
mp
i2
13
39
Th
ab
azim
bi
11
21
5
Mo
dim
olle
11
21
5
Mo
ga
lakw
en
a1
15
31
0
Be
la B
ela
11
31
6
Mo
okg
op
on
g1
11
14
Le
ph
ala
le1
12
15
Gre
ate
r M
arb
le H
all
21
33
9
Elia
s M
ots
oa
led
i2
13
61
2
Ma
kh
ud
uta
ma
ga
31
16
11
Fe
tag
om
o2
11
59
Gre
ate
r T
ub
ats
e2
15
41
2
iLe
mb
e
Sis
on
ke
Gre
ate
r S
ekh
ukh
un
e
Lim
po
po
Mo
pa
ni
Vh
em
be
Ca
prico
rn
Wa
terb
erg

Alb
ert
Lu
thu
li1
14
28
Msu
ka
ligw
a1
23
28
Mkh
on
do
12
32
8
Pix
ley k
a S
em
e1
12
26
Dip
ale
se
ng
11
21
5
Go
va
n M
be
ki
22
55
14
Le
kw
a1
12
26
De
lma
s1
15
31
0
Dr
JS
Mo
roka
41
16
12
Em
ala
hle
ni
34
64
17
Ste
ve
Tsh
we
te1
25
31
1
Em
akh
aze
ni
11
31
6
Th
em
bis
ile3
11
61
1
Bu
sh
bu
ckrid
ge
41
16
12
Th
ab
a C
hw
eu
12
31
7
Mb
om
be
la3
35
51
6
Um
jind
i1
15
18
Nko
ma
zi
31
35
12
Mo
rete
le3
11
61
1
Ma
dib
en
g2
35
21
2
Ru
ste
nb
urg
33
53
14
Kg
etle
ng
rivie
r1
12
15
Mo
se
s K
ota
ne
11
32
7
Tsw
ain
g1
11
25
Ma
fike
ng
21
32
8
Ra
tlo
u1
11
25
Ditso
bo
tla
11
51
8
Ra
mo
tsh
ere
Mo
iloa
11
21
5
Ka
gis
an
o1
11
14
Mo
lop
o1
12
15
Le
kw
a-T
ee
ma
ne
11
31
6
Gre
ate
r T
au
ng
11
12
5
Na
led
i1
12
15
Ma
mu
sa
11
31
6
Ve
nte
rsd
orp
11
31
6
Tlo
kw
e1
14
17
City o
f M
atlo
sa
na
32
53
13
Ge
rt S
iba
nd
e
Nka
ng
ala
Dr
Ke
nn
eth
Ku
an
da
Eh
lan
ze
ni
Mp
um
ala
ng
a
Bo
jan
ala
Pla
tin
um
Ng
aka
Mo
diri M
ole
ma
Dr
Ru
th S
eg
om
ots
i M
om
pa
ti
No
rth
We
st

Ma
qu
assi H
ills
11
31
6
Ga
-Se
go
nya
na
11
31
6
Mo
sh
aw
en
g1
11
14
Ga
ma
ga
ra1
12
15
Ka
mie
sb
erg
11
21
5
Ka
roo
Ho
og
lan
d1
11
14
Na
ma
Kh
oi
11
21
5
Ric
hte
rve
ld1
12
15
Kh
ai-M
a1
12
15
Ha
nta
m1
12
15
Ub
un
tu1
11
14
Siy
ath
em
ba
11
21
5
Siy
an
cu
ma
11
11
4
Th
em
be
lihle
11
21
5
Um
so
bo
mvu
11
11
4
Em
tha
nje
ni
11
21
5
Re
no
ste
rbe
rg1
11
14
Ka
ree
be
rg1
11
14
Mie
r1
11
14
Kg
ate
lop
ele
11
11
4
!Ka
i! G
arib
11
21
5
Kh
ara
He
is1
14
17
Tsa
nts
ab
an
e1
12
15
!Kh
eis
11
11
4
Ph
okw
an
e1
14
17
Dik
ga
tlo
ng
11
51
8
Ma
ga
ren
g1
13
16
So
l P
laa
tjie
31
63
13
City o
f C
ap
e T
ow
n
66
66
24
Ma
tzik
am
a1
13
16
Ce
da
rbe
rg1
12
15
Sw
art
lan
d1
15
18
Sa
lda
nh
a B
ay
11
51
8
Be
rgrivie
r1
12
15
Witze
nb
erg
11
31
6
Dra
ke
nste
in3
15
21
1
Ste
llen
bo
sch
31
52
11
Pix
ley K
a S
em
e
Siy
an
da
Fra
nce
s B
aa
rd
No
rth
ern
Ca
pe
We
st
Co
ast
Ca
pe
Win
ela
nd
s
Kg
ala
ga
di
Na
ma
kw
a

Bre
ed
e V
alle
y1
14
17
Bre
ed
e R
ivie
r /
Win
ela
nd
s1
13
16
Th
ee
wa
ters
klo
of
11
41
7
Ove
rstr
an
d1
14
17
Ca
pe
Ag
hu
las
11
31
6
Sw
elle
nd
am
11
31
6
Ka
nn
ala
nd
11
21
5
He
sse
qu
a1
13
16
Mo
sse
l B
ay
11
51
8
Ge
org
e3
25
21
2
Ou
dts
ho
orn
11
31
6
Bito
u1
13
16
Kn
ysn
a1
15
18
La
ing
sb
urg
11
21
5
Prin
ce
Alb
ert
11
11
4
Be
au
fort
We
st
11
21
5
Ce
ntr
al K
aro
o
We
ste
rn C
ap
e
Ove
rbe
rg
Ed
en